1. Introduction
In the present paper, the definition of a nourishment performance index (NPI) for coastal engineering interventions is proposed, based only on general factors such as the initial sand volume necessary for the nourishment, the beach surface loss after the intervention and the closure depth (defined in [
1]), which indicates the seaward depth limit to the active profile.
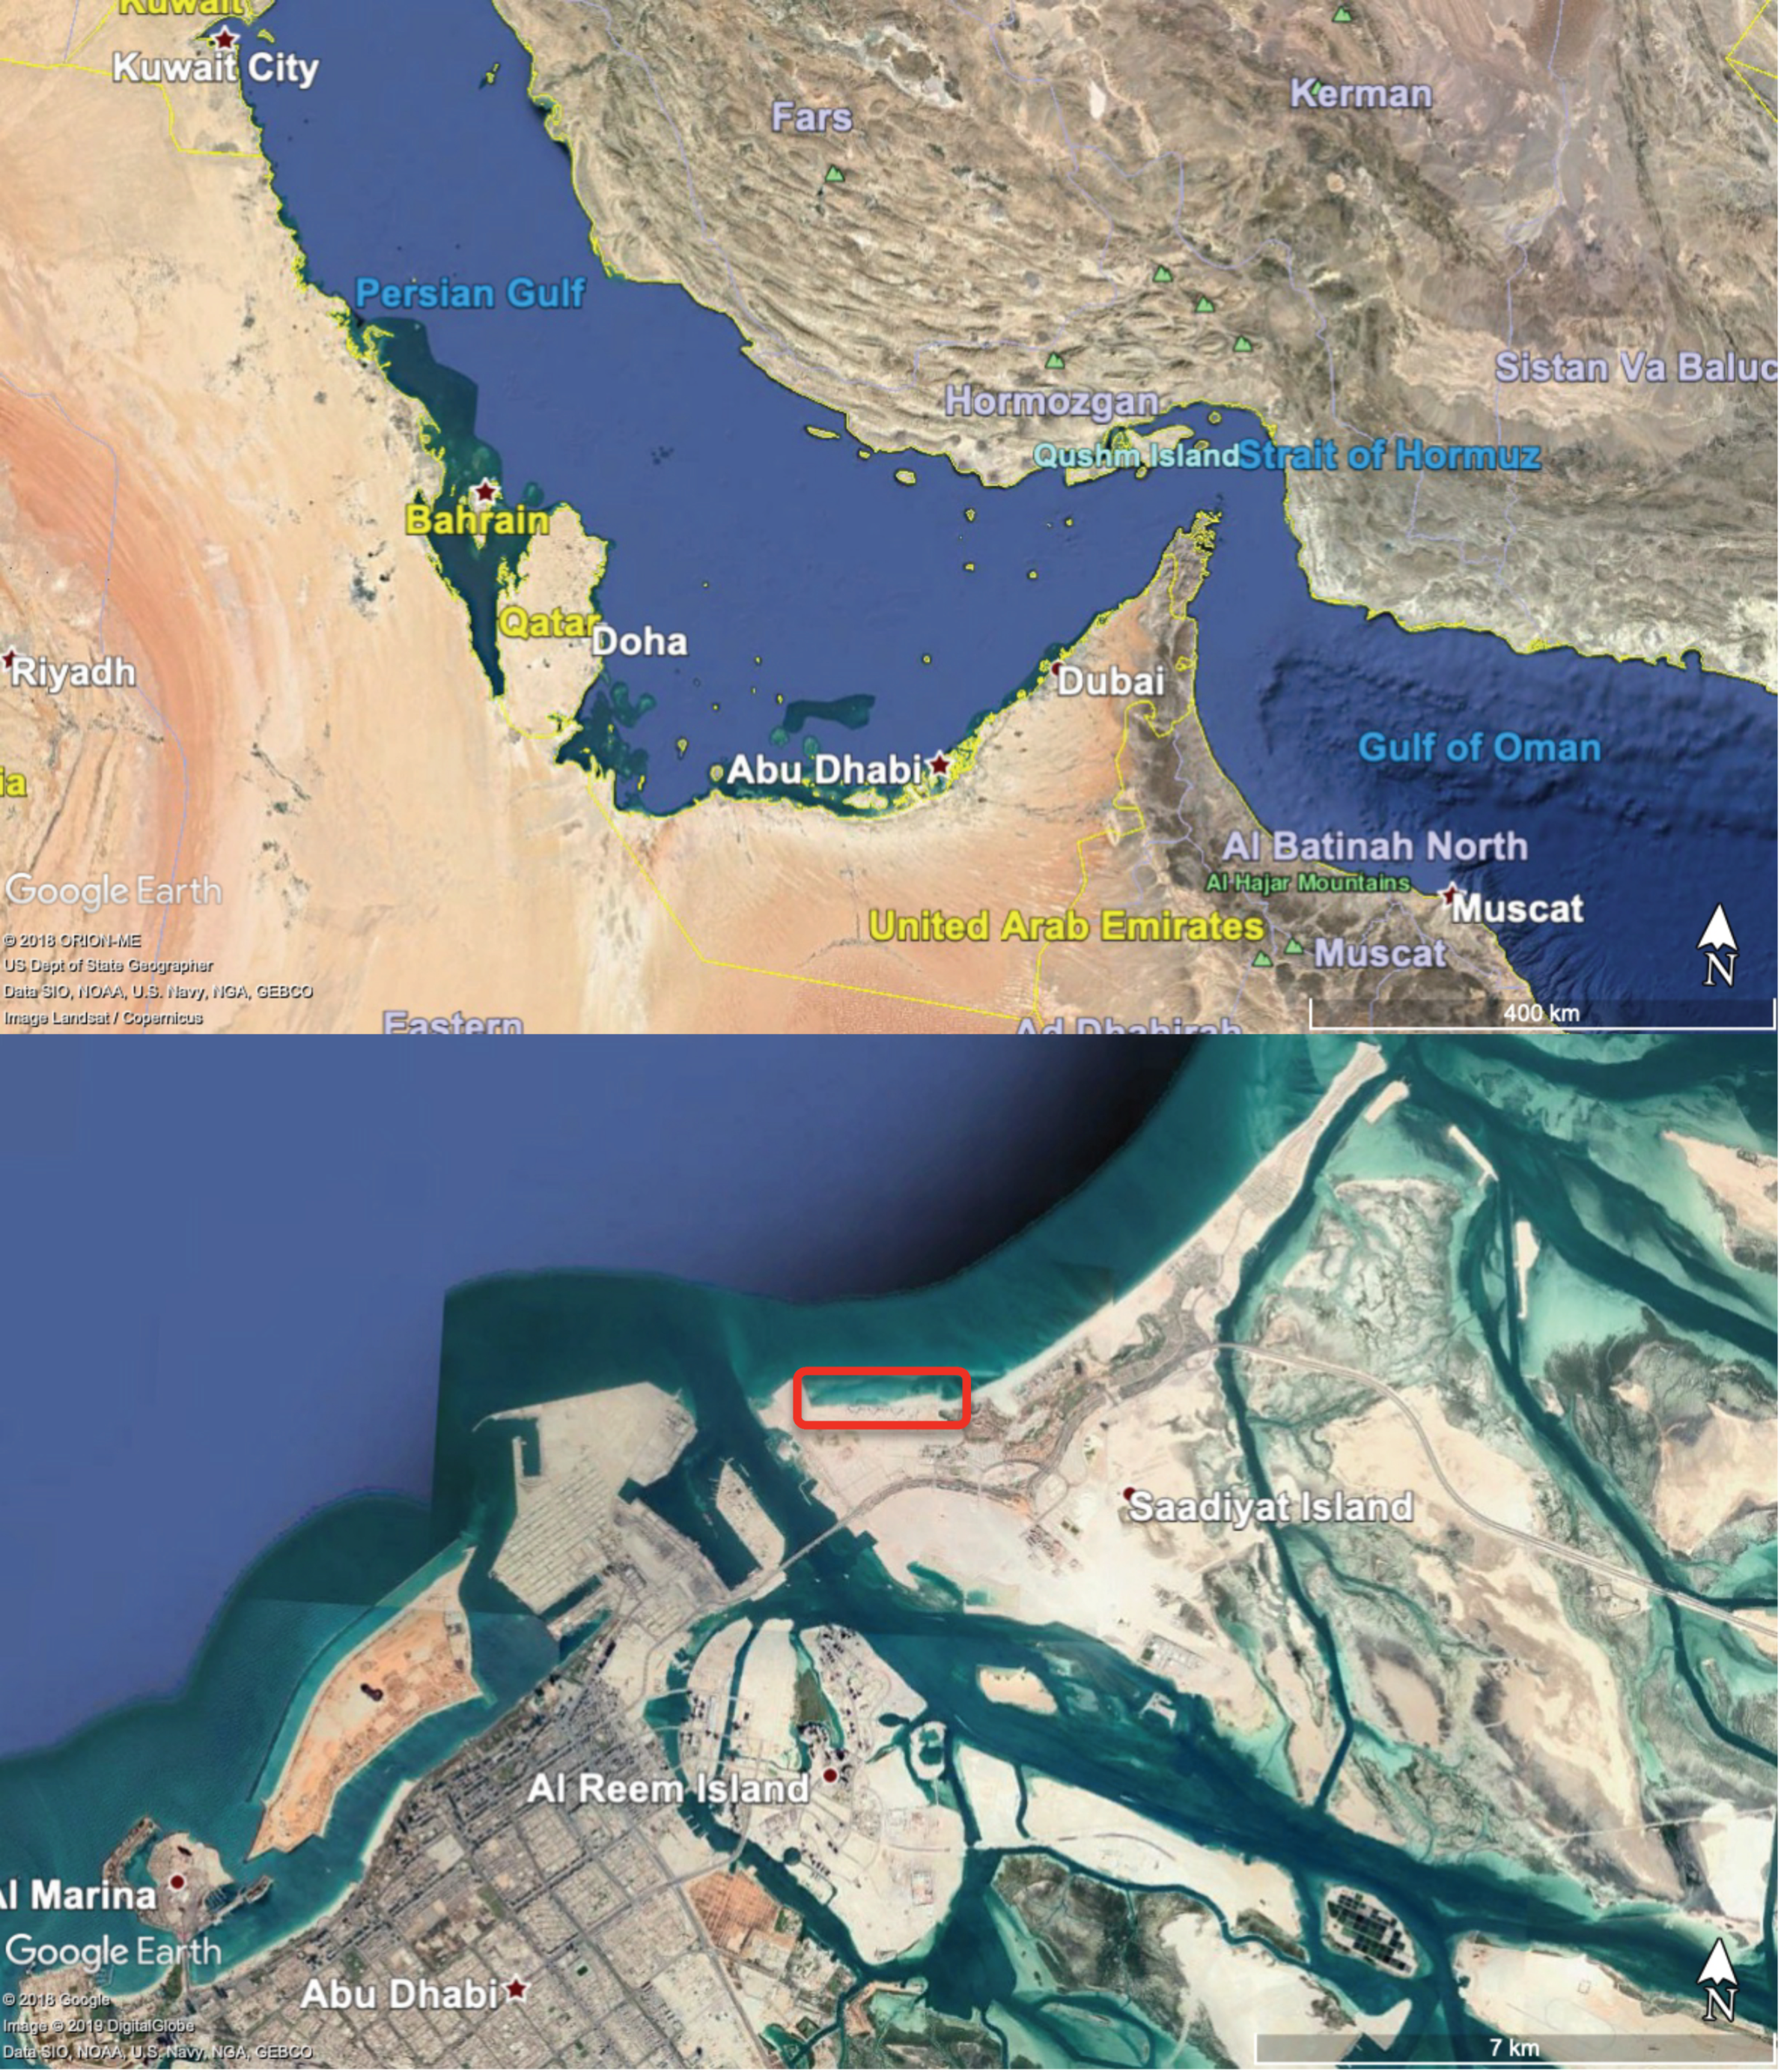
In particular, the NPI has been determined for a coastal prediction system to be built at Saadiyat beach, in Saadiyat Island, a large low-lying 27 km
2 island situated in the Arabian Gulf (also named Persian Gulf) within the Emirate of Abu Dhabi of the United Arab Emirates (
Figure 1). Saadiyat Island comprises a SW–NE oriented, 9 km long natural sandy beach, Saadiyat beach, of moderate to flat slope. The shape and orientation of the beach has been modified several times for the development of the Cultural District of Saadiyat Island. The present study focuses on the western area of Saadiyat beach, a 2 km long beach. Where the urban plan requires the realization of sustainable coastal protection structures, different design scenarios have been proposed by the Tourism Development Investment Company (TDIC), described in the relative TDIC master plan. According to the last development plan as approved by TDIC, the intervention for Saadiyat beach involves a large sand nourishment intervention and the construction of four groynes; the number and location of the four groynes has been decided by TDIC and no contribution from the present Authors has been given.
In order to quantify the feasibility for each of the design scenarios developed by TDIC, a deep knowledge of the engineering details and the coastal conditions, such as the performance of the intervention, the morphodynamics response of the shoreline to the various different coastal defence scenarios of the TDIC development plan is required [
2,
3,
4,
5].
The objective of the present study is to identify a methodology to evaluate the nourishment performance for different scenarios of coastal defence at Saadiyat beach. The proposed methodology is based on the recent availability of observational data (i.e., data measured by in-situ instruments, see
Section 2.1 and
Section 2.2, and data recorded by remote observing systems like satellites, see
Section 2.3.3), allowing to define with precision the wave climate (the distribution of wave characteristics averaged over a period of time and for a particular location) and coast landforms, i.e., any of the relief features present along the coast, which are the result of a combination of processes, sediments and the geology of the coast itself. The observational data were collected by means of in-situ monitoring instruments, survey campaigns and satellite imagery. The data collection has served as a basis for numerical models-based simulations of the oceanographic conditions (wave climate) and of the morphological changes in the natural shape of the coastline under the influence of the planned interventions. The outcomes of the performed numerical simulations allow the identification of the more environmentally sustainable scenario for Saadiyat beach.
3. Results
3.1. Nearshore Wave Climate
The nearshore wave climate has been calculated in terms of significant wave height, Hs, wave peak period, T
p and mean wave direction, θ
i, at eight virtual buoys near the coast at different depths.
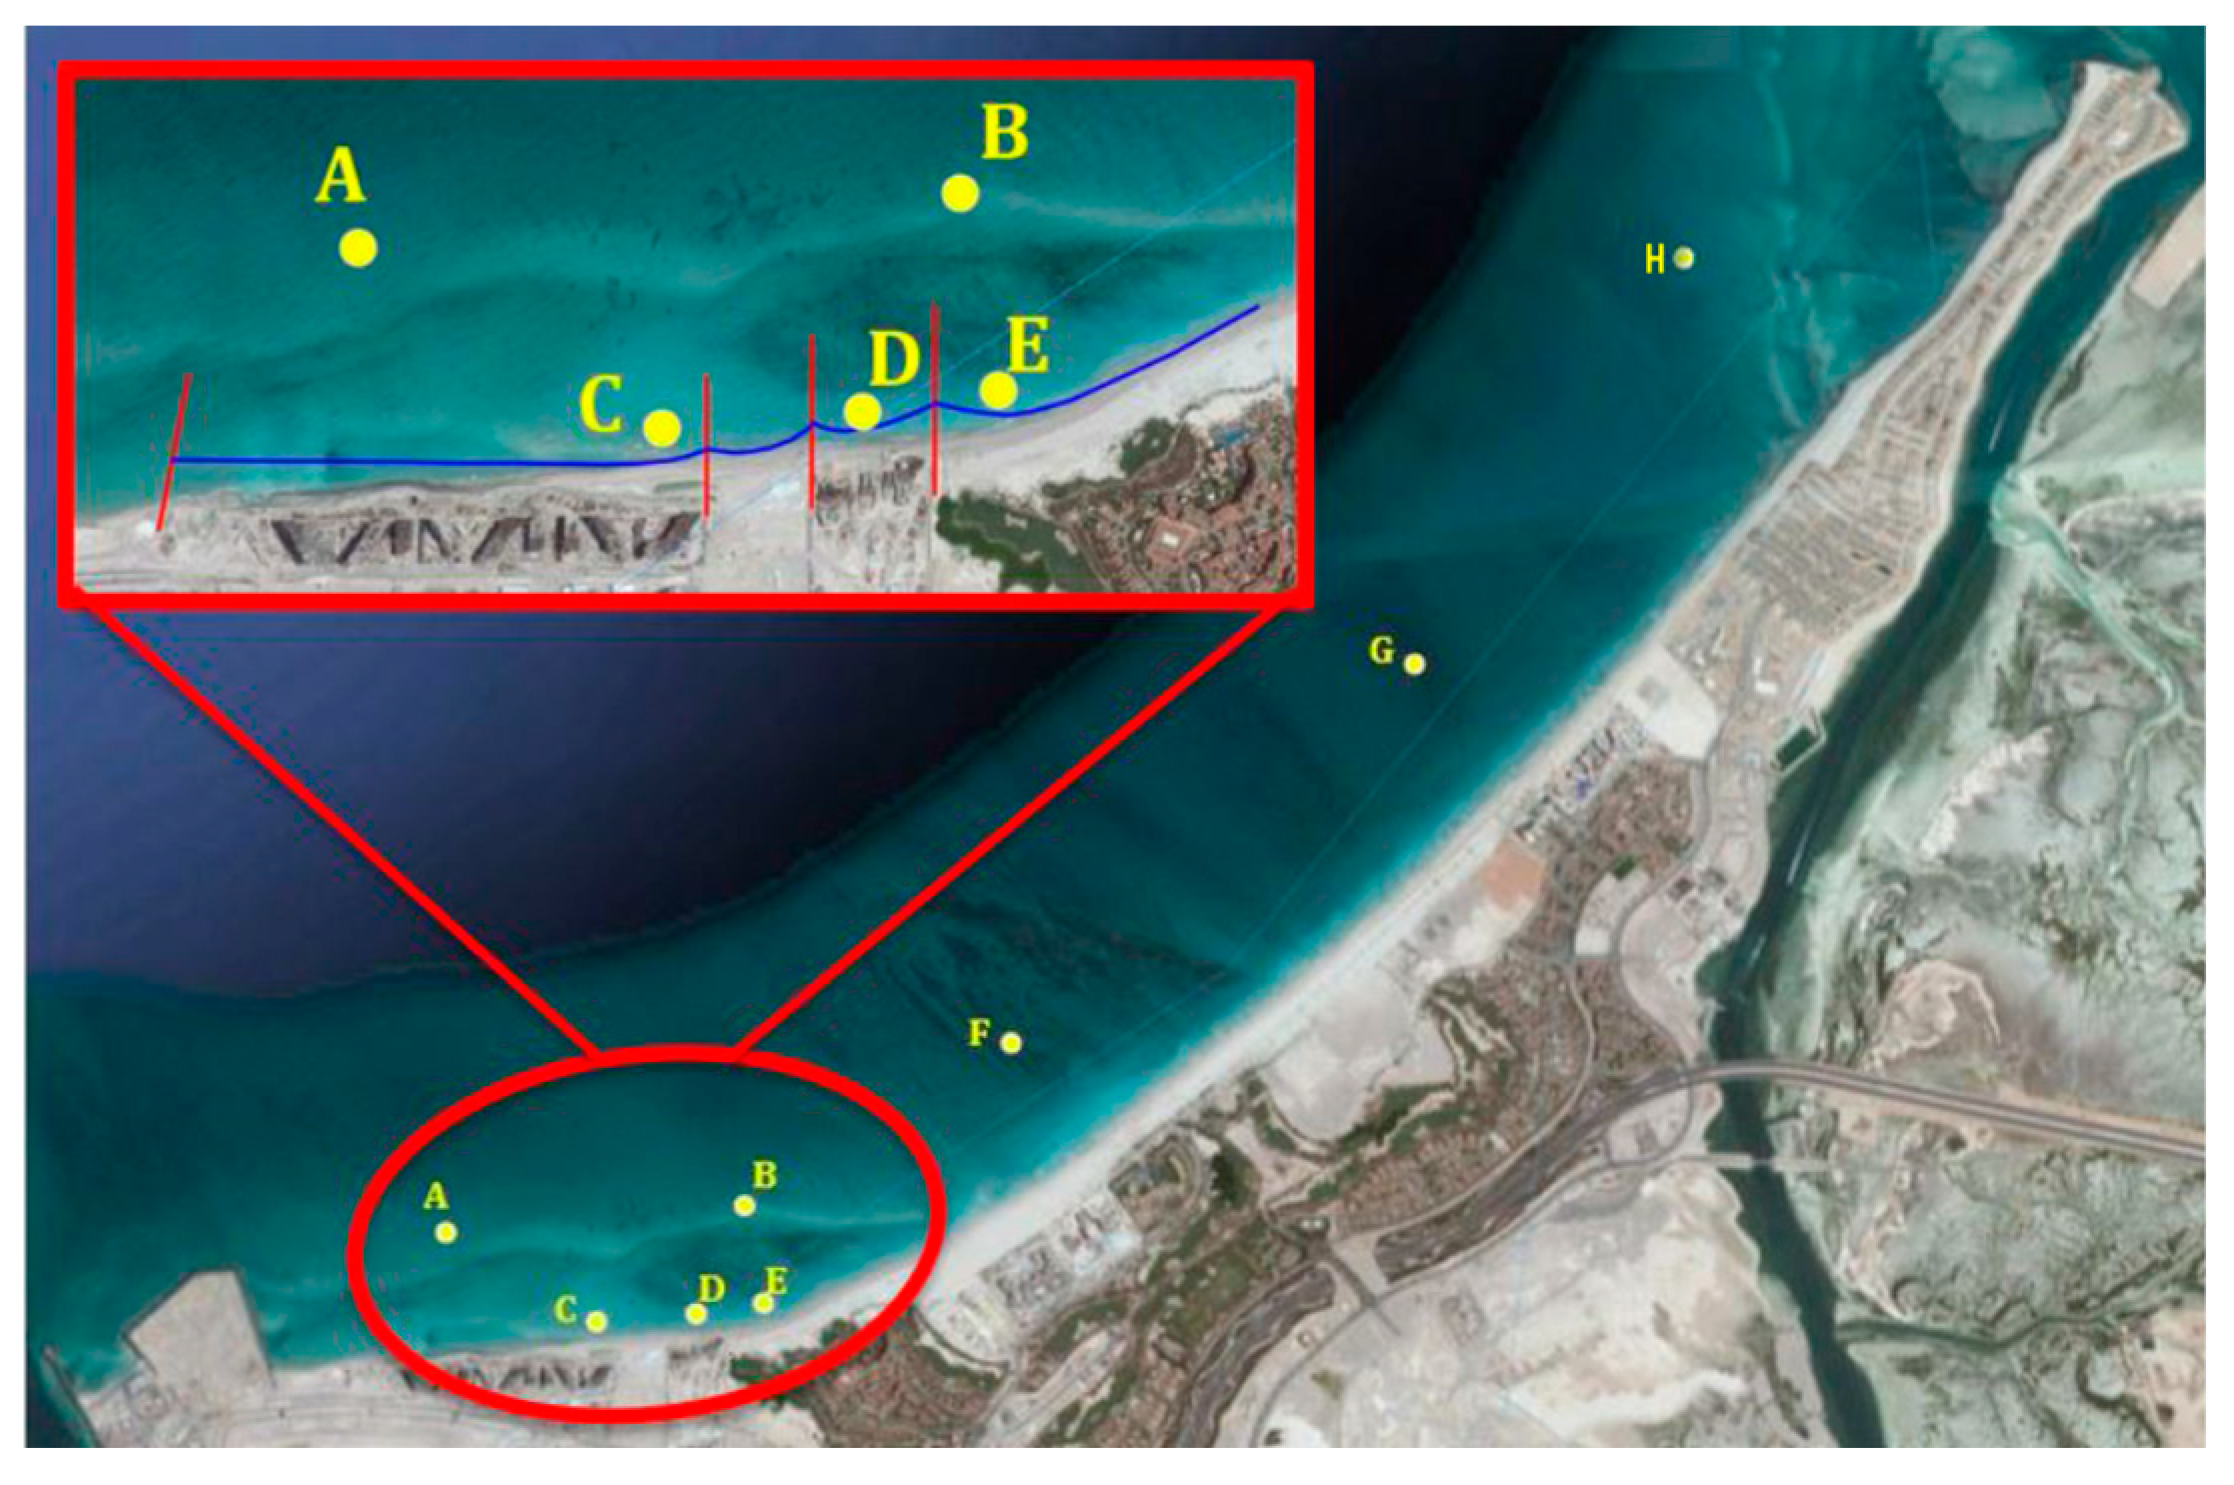
Figure 6 shows the location of the virtual buoys, chosen in order to analyse the wave effects along the entire beach, with a focus in the proximity of the study area at the western side of the beach.
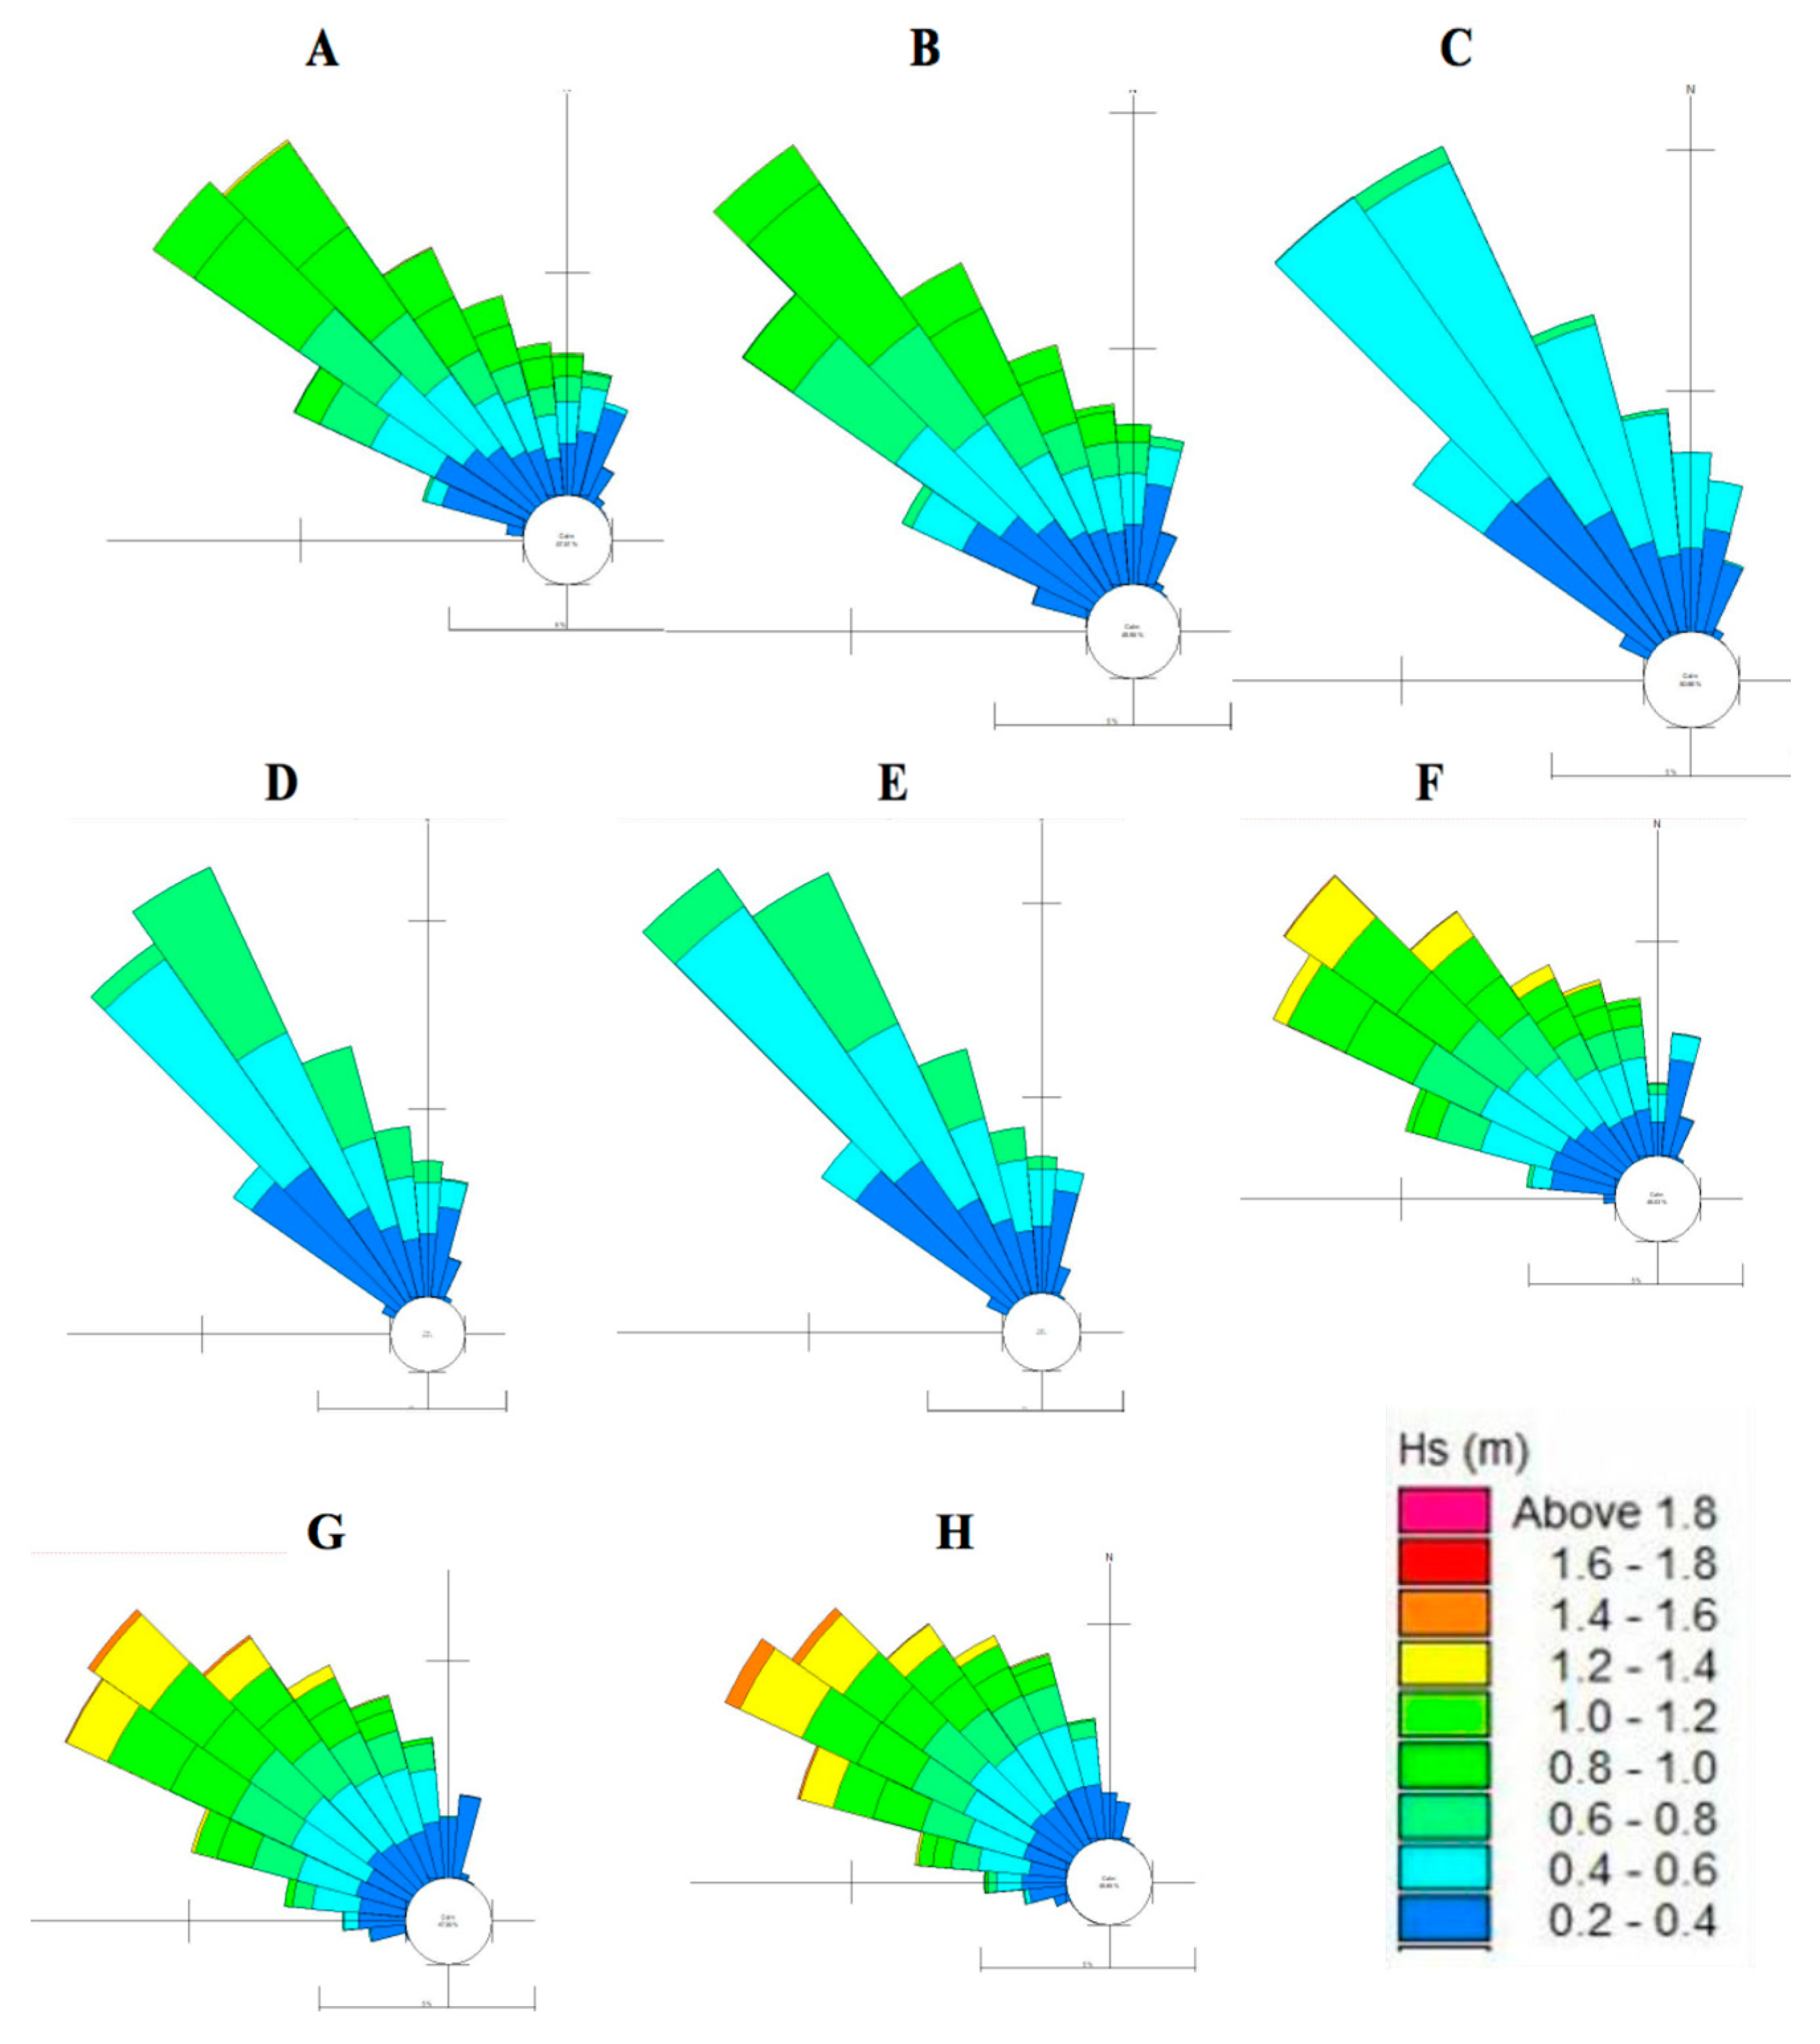
Results are reported in terms of wave rose plots indicating the wave appearance frequencies.
Figure 7 shows the corresponding wave roses at the virtual buoys indicated in
Figure 6 with labels from A to H: the influence of the bottom (seabed) determines a dissipation of the waves close to the beach. Results show that the most frequent wave’s events have directions in the sector 270° N–360° N, with a dominant North-West component, and maximum wave height lower than 1.8 m.
Wave roses corresponding to virtual buoys C, D and E in
Figure 6 are, indeed, similar when considering the main wave direction and Hs values. In particular, it can be noticed how changes of the coastline shape and the presence of groynes, acting as defence structures, obstruct the wave propagation, resulting in a wave energy reduction in C, D, and E with respect to the waves corresponding to A and B.
Results relative to the remaining virtual buoys show a good exposure of the beach to different wave conditions, i.e., the position of the virtual buoys has been chosen well enough so that the simulated beach conditions are sensitive to the action of the waves coming from all the possible directions; therefore, the climate at the virtual buoys is well representative of the real conditions of the beach. The bottom friction, the bathymetry of the area and the alignment of the beach determine a slight rotation of the fronts and only the directions from east to south are lost with respect to the original wave climate at the bathymetry 6 m.
3.2. Shoreline Design Scenarios
To increase the longevity of the beach and propose a sustainable solution over the years, some possible alternatives have been simulated. In particular, a different orientation of the as-built shoreline and different volume of sand for the nourishment have been tested.
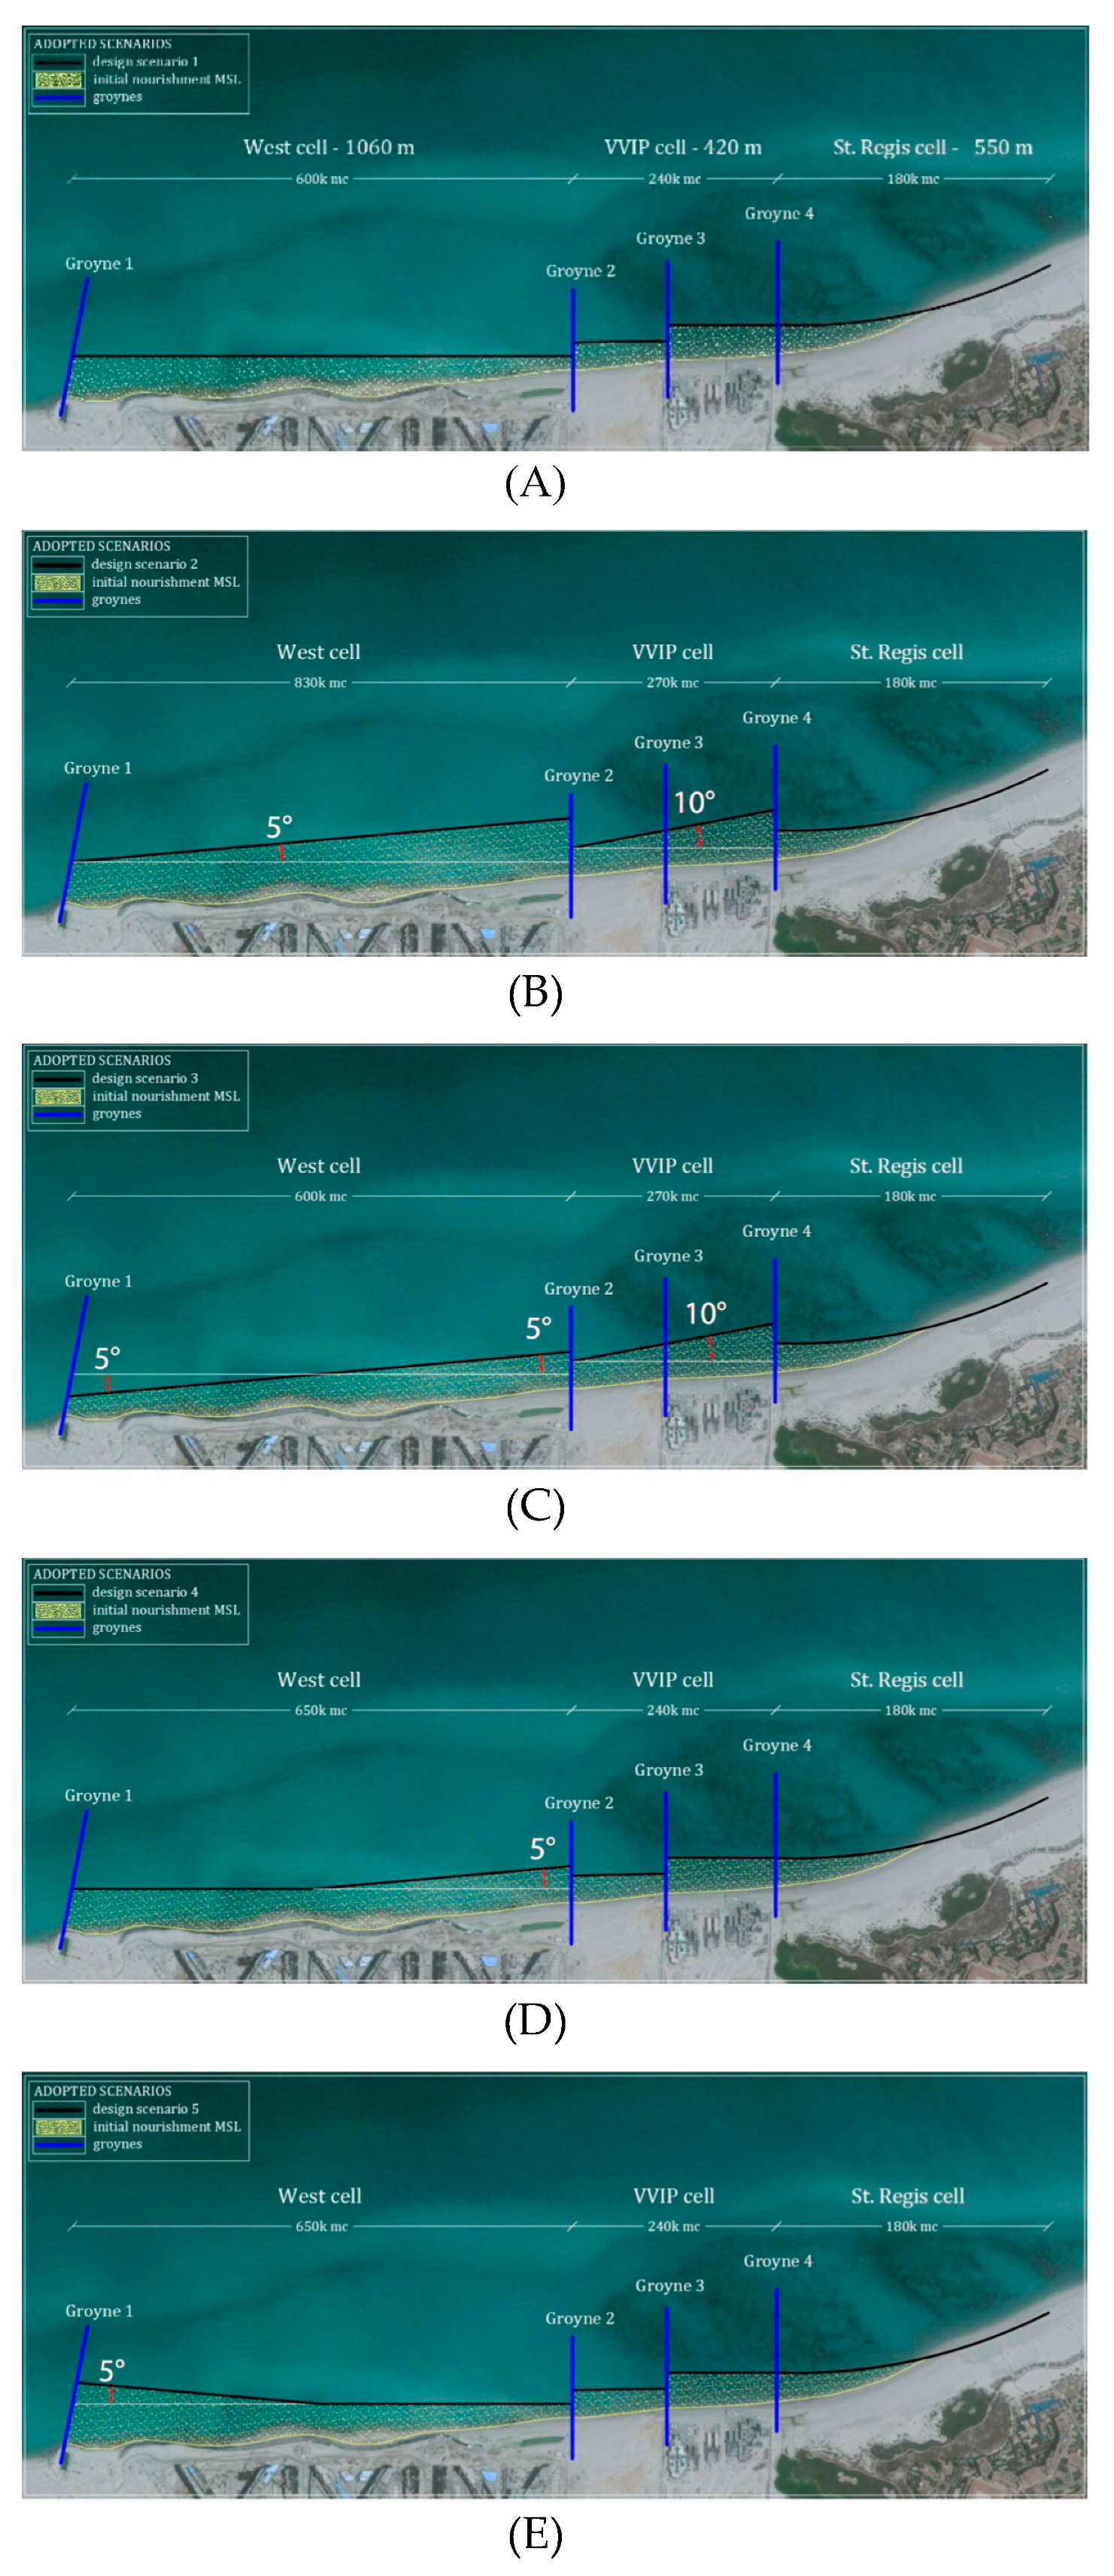
Figure 8 shows the scenarios with different orientations of the initial design shoreline. Based on the results of the sediment analysis (
Section 2.1), it is assumed that the area of interest is characterised by medium sand with the median grain size
= 0.26 mm and the sorting parameter
/
= 2.44 (where:
D15 (transition layer) is the 15th percentile particle size in the transition layer material, meaning that 15% of the sand is smaller than
D15 mm, and
D85 (filter media) is the 85th percentile particle size in the filter media.
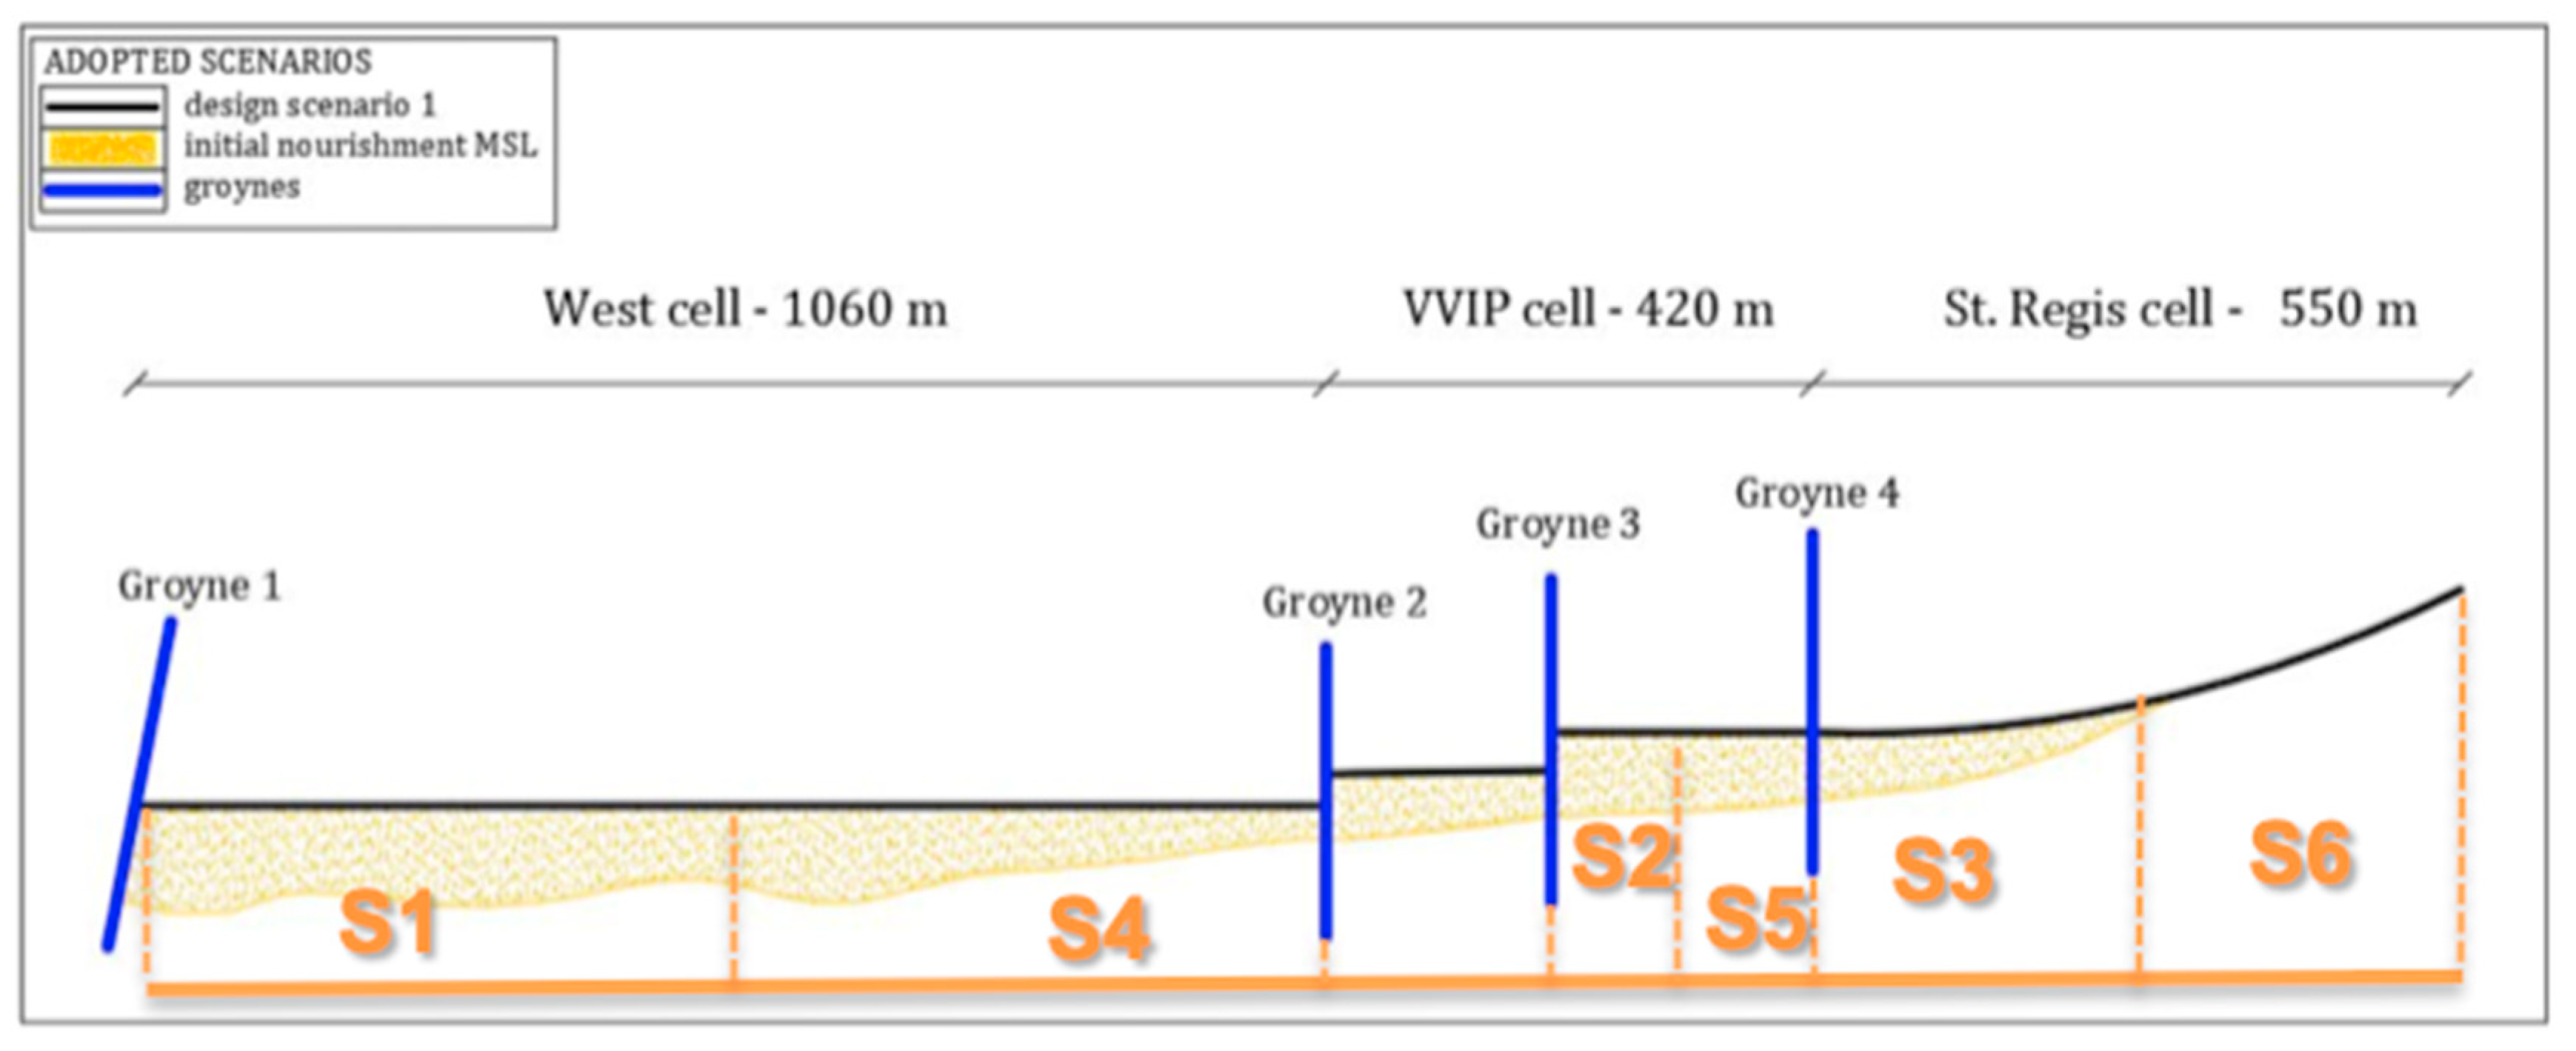
In scenario 1, the initial alignment of the design shoreline is obtained from the nourishment of the entire stretch of coast. In particular, 600,000 m3 are necessary for the West cell, 240,000 m3 for the VVIP cell and 180,000 m3 for the St. Regis cell.
In the scenario 2, a rotation of the shoreline alignment for the west cell and the VVIP cell, respectively 5° and 10° counter clockwise, is proposed, with a consequent increase in the sand volume, which is necessary for the initial nourishment (respectively 830,000 m3 for the West cell and 270,000 m3 for the VVIP cell).
The difference of scenario 3 with respect to scenario 2 consists in the fact that the shoreline alignment in the West cell is around the centreline.
In the scenario 4, the initial shoreline alignment is the same as in scenario 1 but a counter clockwise rotation of 5° is expected for the West cell, from the centre of the cell to the groyne 2, with a relative increase in the nourishment sand requirement, from 600,000 m3 to 650,000 m3.
In the scenario 5, the shoreline alignment is similar to scenario 1, but a clockwise rotation of 5° has been imposed for the West cell, from the centre of the cell to the groyne 1. The volume of sand required is 50,000 m3 more than the volume foreseen in the scenario 1.
A summary of the volumes of sand needed for the initial nourishment in the different scenarios is reported in
Table 3.
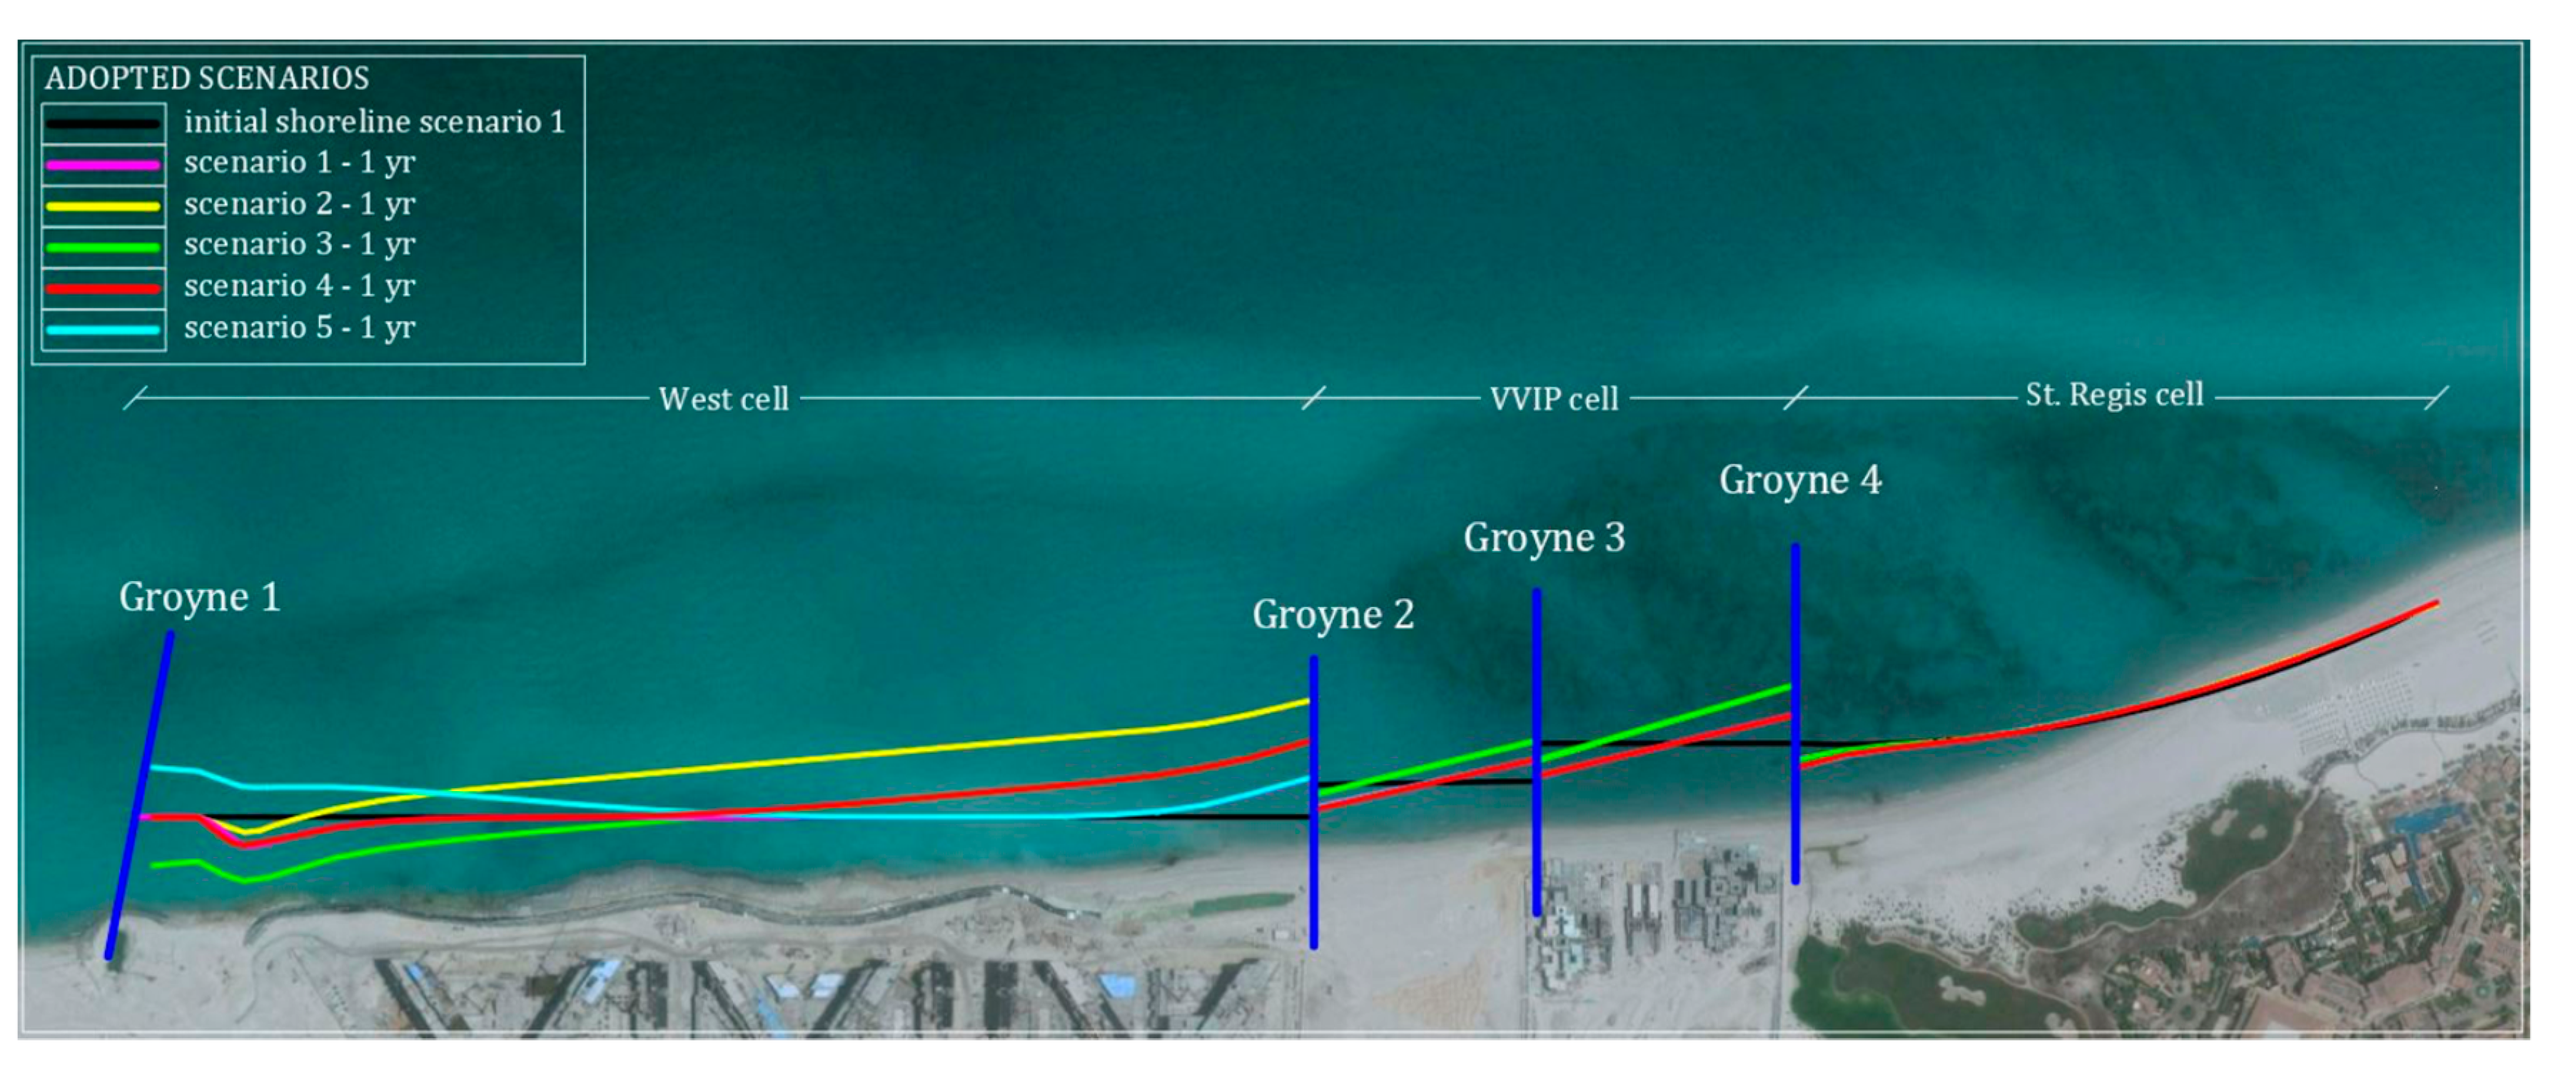
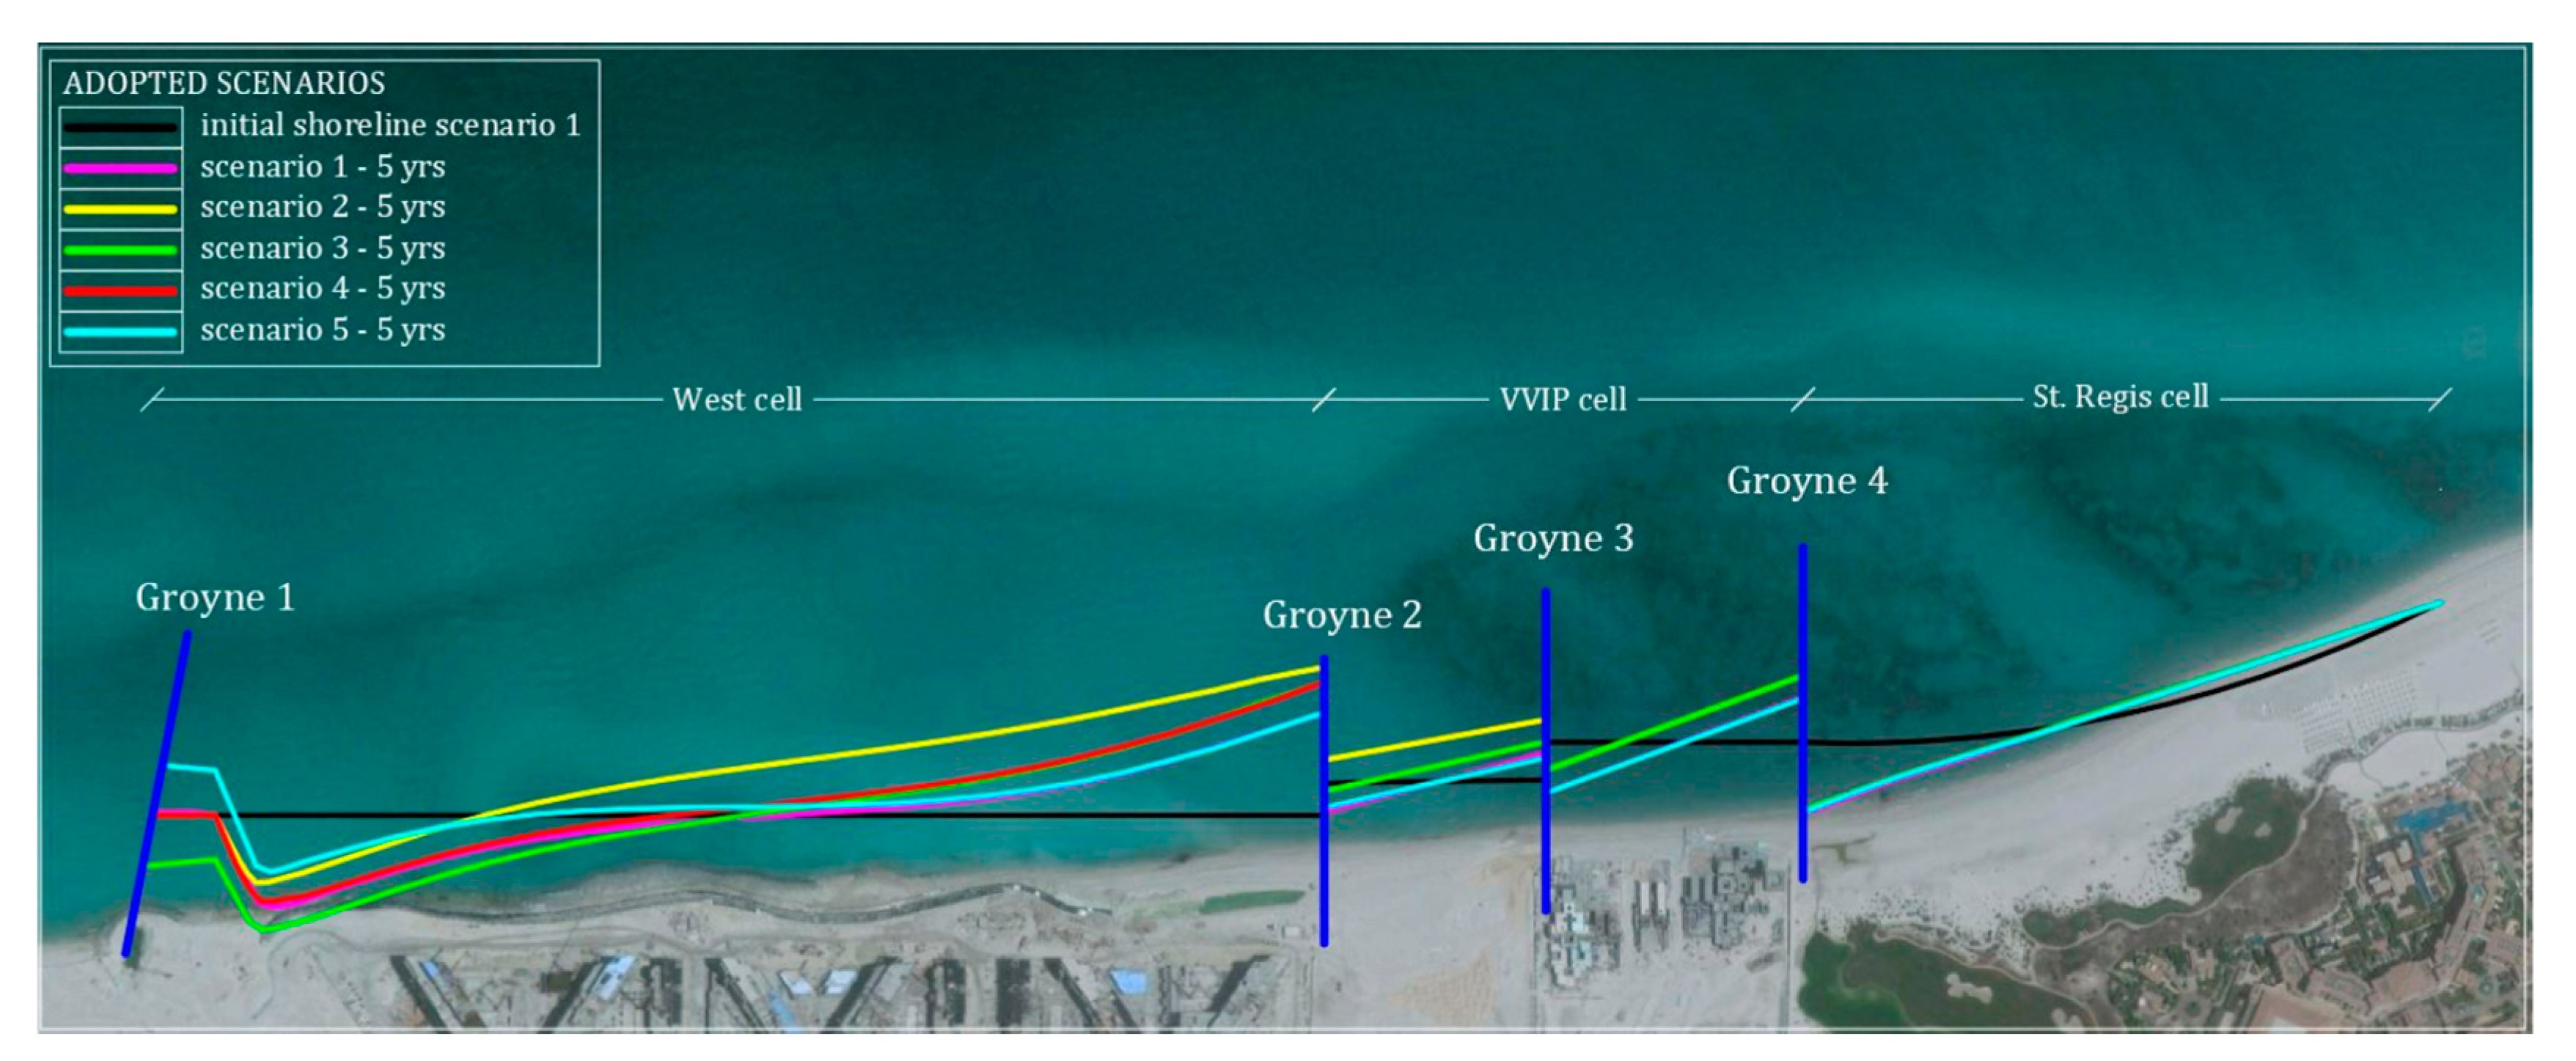
3.3. Shoreline Evolution for the Design Scenarios
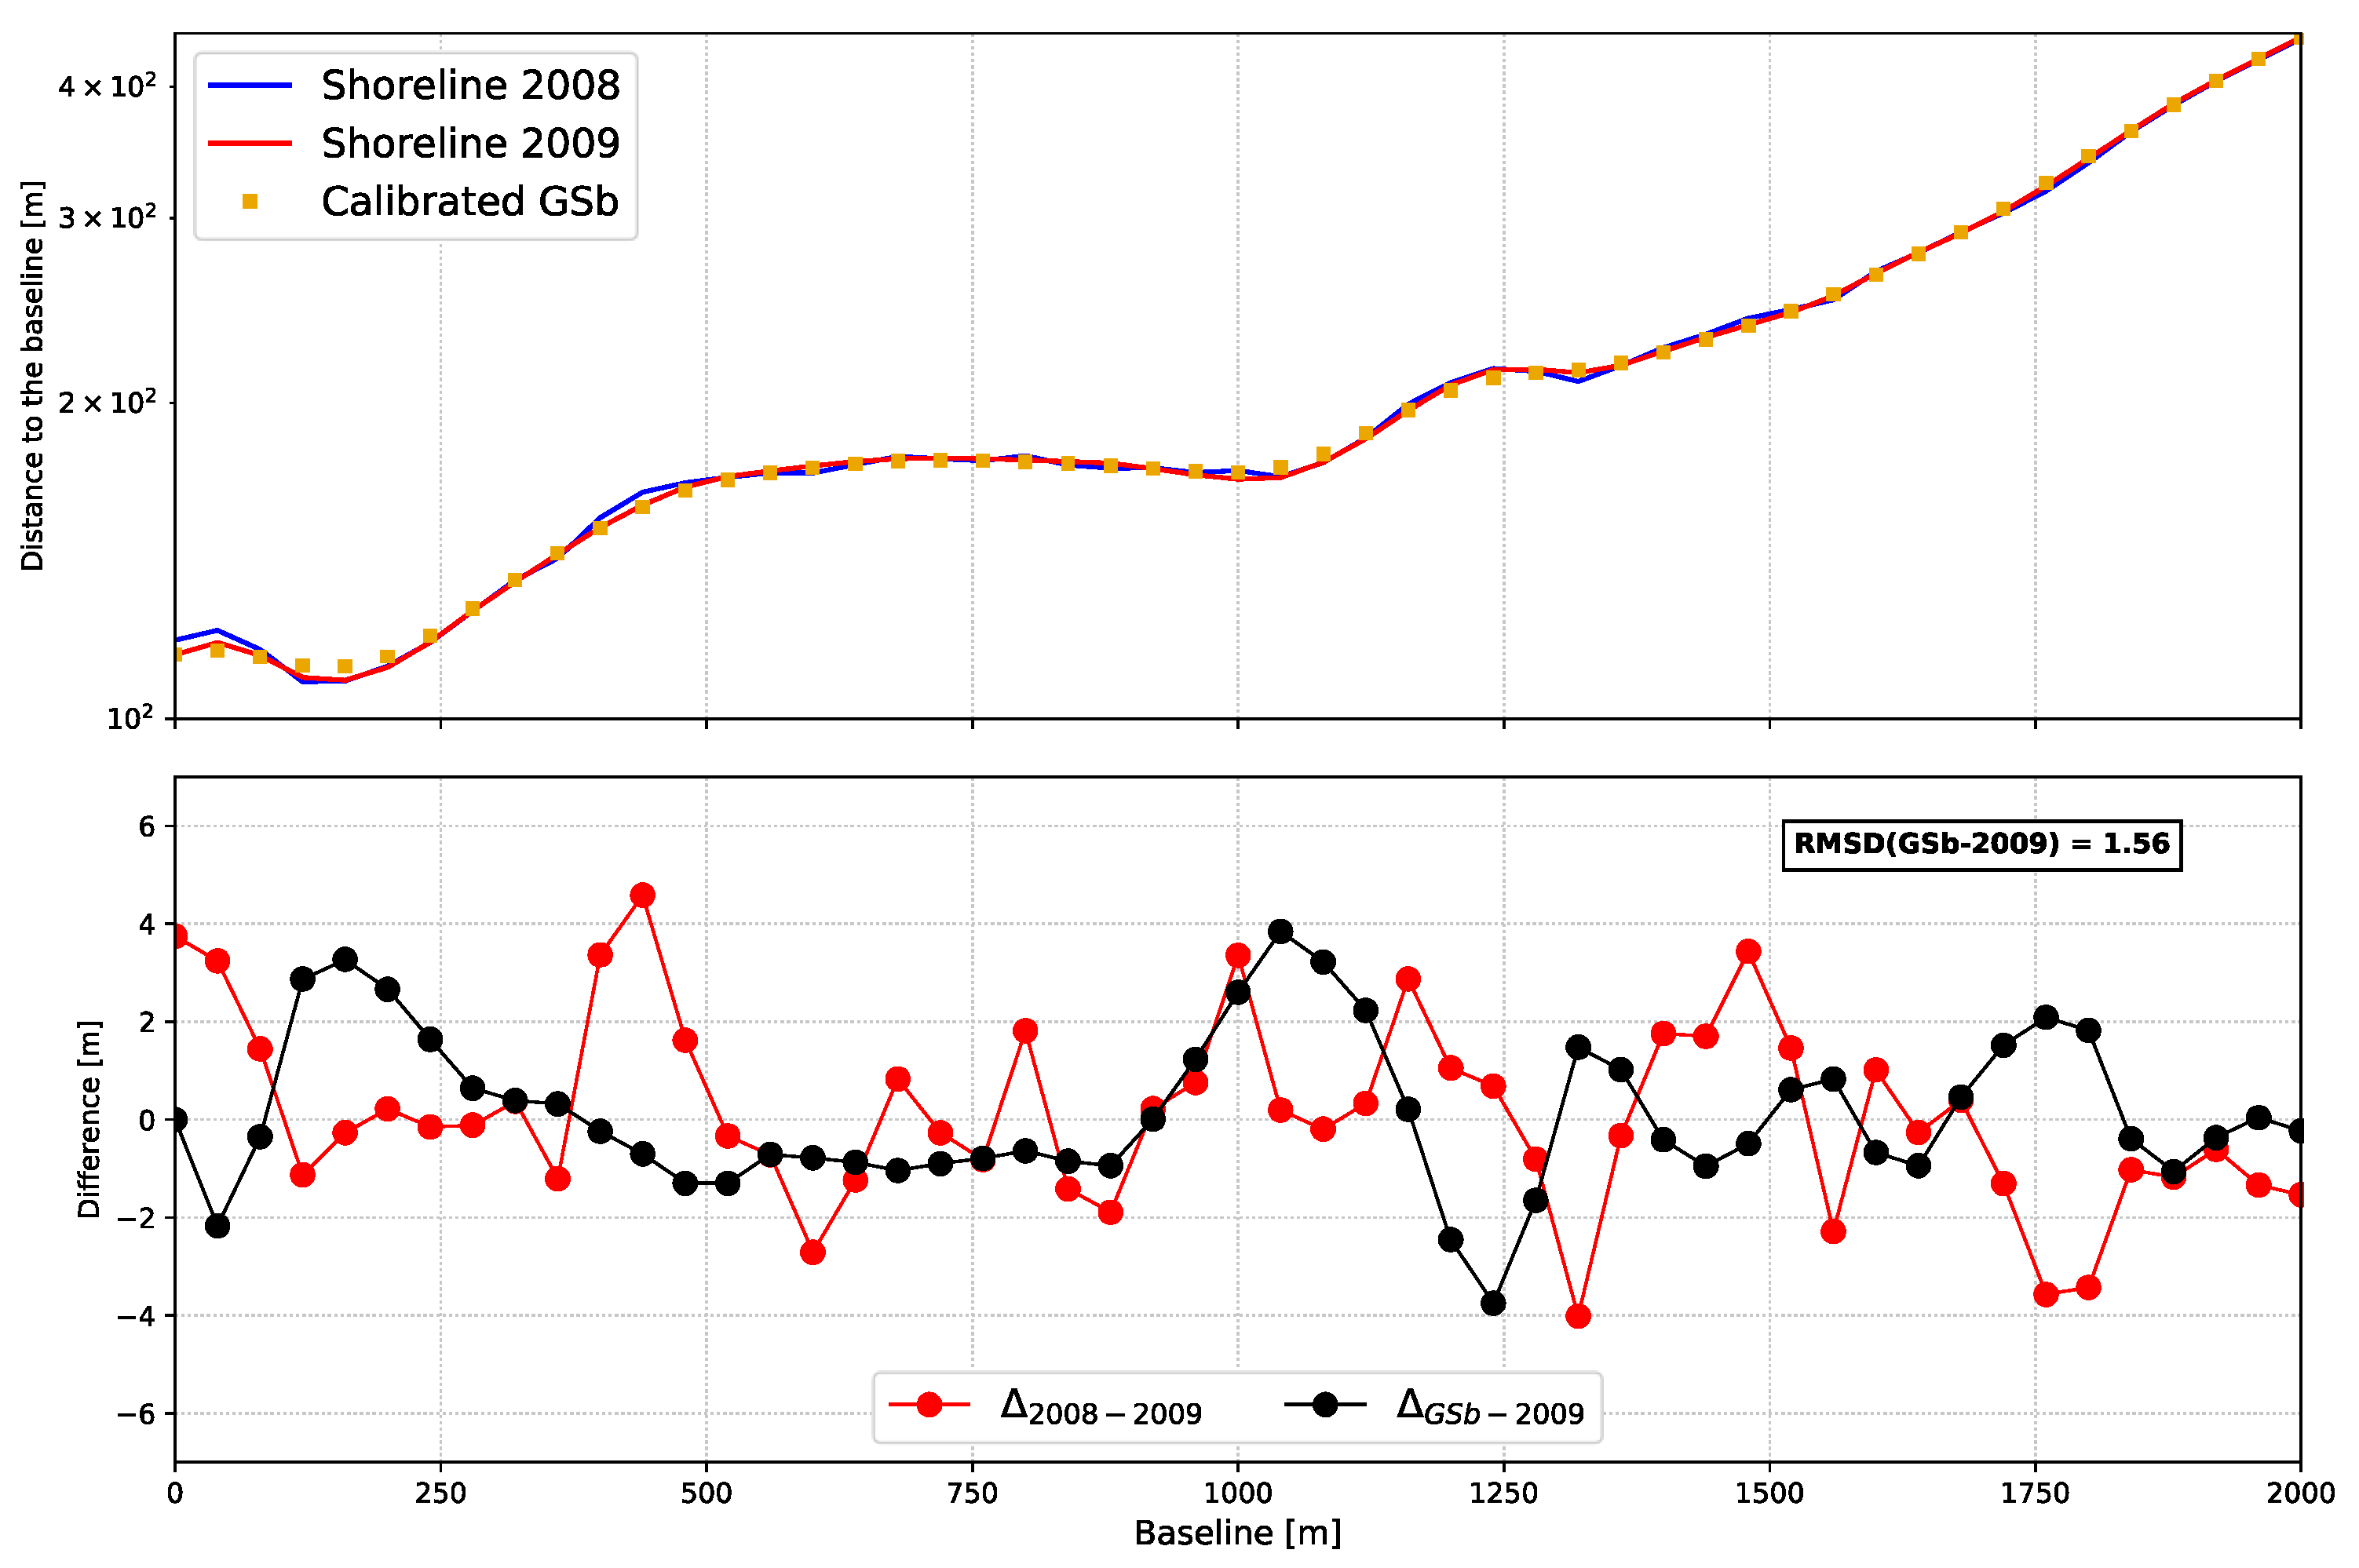
The shoreline evolution for each of the five considered scenarios has been modelled with the GSb model. The numerical simulations have been performed considering the evolution of the initial shoreline after 1 year, 2 years and 5 years from the end of the intervention.
Figure 9;
Figure 10 show a comparison between the results for, respectively, the evolution in 1 year and in 5 years, in terms of maximum accretion/recession.
The maximum accretion/recession volumes, i.e., the new beachline dry area as resulting from the shoreline shifts multiplied by the closure depth, in relation to the sand volume of the initial nourishment in the six sectors along the analysed shoreline, have been calculated. The shoreline shifts are calculated considering the new beach shoreline position as resulting after a fixed amount of time from the end of the intervention and the “as built shoreline after the nourishment intervention”. The results are shown in
Table 4 and
Table 5.
3.4. The Nourishment Performance Index
The optimal intervention scenario among the five proposed has to be individuated on the basis of the NPI, calculated using Equation (5), considering the maximum recession that will occur for each of the considered scenarios after 1 year from the intervention at sector 1 (S1) (
Figure 4), related to the initial volume of sand necessary for the nourishment, with
the initial design volume necessary for the nourishment of the West cell,
3.6 m, and
the area in recession in the emerged beach after 1/5 year, with respect to the initial shoreline. The areas in recession in the emerged beach result from the comparison of the original shoreline and the one simulated with GSb after 1 year or 5 years.
4. Discussion
From the results obtained in the present study, it has been found that the NPI allows selecting the optimal scenario based on the efficiency of the intervention.
Table 6 shows the values of NPI for the different considered scenarios. In the first column, the initial sand volume
, necessary for the nourishment intervention is indicated. The second column shows the area of the beach that will be eroded 1 year or 5 years after the intervention, simulated with the GSb numerical model. This area is calculated as the area enclosed by the simulated shoreline after 1/5 years from the intervention and the corresponding initial shoreline for each scenario separately. The third column shows the calculated NPI values. The fourth column shows the increase in percentage of NPI in the beach longevity, calculated with respect to scenario 1, assumed as a reference.
Regarding the West cell and the results relative to 1 year, with respect to scenario 1, the result for scenario 2 shows an increase of NPI (+29%), which is due in a large part to a significant larger volume of sand (from 600,000 m3 to 830,000 m3). Scenario 3 can represent a good option because of the good longevity percentage increase (+15%) obtained, while keeping the same volume of sand necessary for the initial nourishment (600,000 m3). Scenario 4 shows almost the same NPI of scenario 1, but at the price of a slightly larger increase in the necessary sand volume for the nourishment (from 600,000 m3 to 650,000 m3).
For the West cell and the 1 year simulation, scenario 5 presents the larger NPI increase, equal to +176%. This is not verified for the remaining cells and considering the results relative to 5 years; the scenario that offers the overall best nourishment performance is scenario 2. Estimate of the nourishment performance is not extended to the entire project lifetime but it is limited to 5 years. This limit is chosen because at this time, the nourished shoreline retreats at some transects reaching an unacceptable threshold for the touristic, aesthetic and recreational uses of the beach.
Consequently, comparison of different design scenarios has showed that the NPI value depends mainly on the as built nourishment shoreline. The recommended scenario (i.e., scenario 2) durability is sounding.
This interesting and potentially very useful methodology can be adopted for analysing and predicting shoreline development under different coastal engineering interventions. The need for such a methodology arises from the large number of coastal interventions that are planned in high number worldwide and from the need to protect those from the climatically induced sea level rise and its hazardous consequences. The advantage of this definition is that all factors are measurable in-loco, are quantifiable by the development firms, are based on the physical characteristics of the beach (e.g., morphology), but also on aspects concerning the planned intervention (nourishments, longevity).
A potential benefit of this methodology is the fact that it also gives indication about the environmental sustainability (ES) of the planned interventions. In fact, ES, specifically the careful use of natural resources to preserve the ecosystems, is required in planning complex engineering interventions. ES is also an essential factor in mitigating the effects of environmental catastrophic phenomena, related to climate change. Since water covers up Earth’s largest portion, it is a complex ecosystem; coastal engineers should include ES in the design of planned interventions.
The ES concept has been developed to ensure that in meeting its needs for water, food, shelter as well as engaging in leisure activities and entertainment where humanity does not cause damage to the environment or deplete resources that cannot be renewed [
42]. However, despite many studies, the practices in coastal management have not yet reached a point where natural resources are being used sustainably.
In general, given the complexity of the environment and the ecosystem, environmental indexes could provide a useful tool to highlight environmental conditions and trends for policy purposes by isolating key aspects from an otherwise overwhelming amount of information [
43]. Oftentimes, however, ES is difficult to translate in operational terms and many of the indexes proposed and mentioned above, include parameters, which are beyond the sphere of influence of local authorities/development firms [
44]. This supports the scope of this study, i.e., to investigate an index to support also environmentally sustainable engineering applications.
Moreover, the NPI can be adopted not only as a valuable database for making management decisions, but also it encourages the local community and stakeholders to engage in the safeguard of the environment, given the simplicity of its definition and its immediate and easy application in real cases. This is a key aspect in ES-oriented engineering interventions: in fact, since ecological boundaries rarely meet up with political jurisdictions, it is necessary to be aware of major environmental issues and the best option to preserve the environment for future generations [
45].
Specifically, the proposed NPI definition satisfies all the requirements for an environmental indicator to work well as a basis for policymaking [
46]: (1) data availability; (2) ecosystem specificity of indicators; (3) spatial and conceptual aggregation of indicators and (4) baseline or reference values for indicators. The proposed NPI definition, the availability of data since the initial nourishment volume, the recession area and the closure depth are all easily measurable and well defined. The ecosystem specificity of the NPI is ensured through its dependence from the closure depth and the recession area, the aggregation is ensured by the NPI dependence from both environmental aspects (
and
) and specific aspects of the intervention (W) and the baseline is clearly drawn from scenario 1.
5. Conclusions
Environmental sustainability (ES) is an essential factor in solving environmental degradation; this is especially true when designing complex coastal engineering interventions.
The present paper describes the methodology followed to design a sustainable beach at Saadiyat Island, of the Abu Dhabi Municipality in the United Arab Emirates. Specifically, a proposed nourishment performance index appears suitable to quantify the level of sustainability for different coastal engineering interventions. The nourishment performance index is based on factors such as the initial volume necessary for the nourishment of the intervention area, the area in recession 1 year after the intervention and the closure depth.
The proposed methodology can be used for analysing and predicting shoreline development under different coastal engineering interventions. The need for such a methodology arises from the large number of coastal interventions that are planned in high number worldwide and from the need to protect those from the climatically induced sea level rise and its hazardous consequences. The advantage of this definition is that all factors are measurable in-loco, are quantifiable by the development firms and are based on the physical characteristics of the beach (e.g., morphology), but also on aspects concerning the planned intervention (nourishments, longevity).
Results show that the NPI value depends mainly on the as built nourishment shoreline. The recommended scenario (i.e., scenario 2) durability is sounding from the environmental sustainability prospective.
In conclusion, the application of the presented methodology in the evaluation of the impacts of the planned interventions at Saadiyat beach has been shown to be promising and can assist the engineers and/or environmentalists for designing/evaluating coastal interventions that are foreseen in the area.


 ,
, 


