Article

Automation of Basketball Match Data Management

by
Łukasz Chomątek
* and
Kinga Sierakowska
Faculty of Technical Physics, Information Technology and Applied Mathematics, Lodz University of Technology, 90-456 Lodz, Poland
*
Author to whom correspondence should be addressed.
Information 2021, 12(11), 461; https://doi.org/10.3390/info12110461
Submission received: 23 September 2021 / Revised: 2 November 2021 / Accepted: 5 November 2021 / Published: 8 November 2021

Abstract

:
Despite the fact that sport plays a substantial role in people’s lives, funding varies significantly from one discipline to another. For example, in Poland, women’s basketball in the lower divisions, is primarily developing thanks to enthusiasts. The aim of the work was to design and implement a system for analyzing match protocols containing data about the match. Particular attention was devoted to the course of the game, i.e., the order of scoring points. This type of data is not typically stored on the official websites of basketball associations but is significant from the point of view of coaches. The obtained data can be utilized to analyze the team’s game during the season, the quality of players, etc. In terms of obtaining data from match protocols, a dedicated algorithm for identifying the table was used, while a neural network was utilized to recognize the numbers (with 70% accuracy). The conducted research has shown the proposed system is well suited for data acquisition based on match protocols what implies the possibility of increasing the availability of data on the games. This will allow the development of this sport discipline. Obtained conclusions can be generalized to other disciplines, where the games are recorded in paper form.

1. Introduction

Sport remains an integral part of the day of more and more people. We refer to a sport that is practiced by adult people who are passionate and committed to it, regardless of the season. Unfortunately, in Poland, we have many disciplines (such as women’s basketball), which are poorly financed, and they owe their development only to enthusiasts working for charity.
The competition represents an inseparable element of team sports. It takes place at various levels of advancement. In the Polish women’s basketball league, we distinguish three leagues (extra class, first and second league). During each match, a match report is drawn up, containing information, among others, about: players, referees, fouls or subsequent points scored by players. The details of match protocol preparation rules are shown in Appendix A.
The FIBA regulations [1] stipulate that the match protocols may be completed in paper or electronic form. The Federation provides software for running the protocol [1]. In Poland, especially in the lower divisions, the paper version of the protocol is often used. According to the regulations, the scan of the protocol is sent to the Association by Electronic System for Game Organization (abbreviated ESOR) [2]. The mentioned system only stores a digital copy (photo) of the scoresheet, but the correctness of data entered into the system must be checked manually.
The data from the minutes after each game are transferred to the official website of the competition (depending on the level, it can be, for example, pzkosz.pl, wozkosz.pl). It is quite a time-consuming and tedious process that requires a lot of concentration and good eyesight. It consists in rewriting data from A3 paper filled with tables. In addition, as it is quite an extensive process, the rewriter is not required to rewrite all the statistics, which results in a limited amount of information about the course of the match on the Internet.
The purpose of this study is to improve the process of importing data from match protocols to the system. It was assumed that this should be achieved with the use of commonly available devices-in particular, a smartphone.
The main contribution of the paper is as follows:
-
Examination of market position and requirements for game scoresheet processing system;
-
The proposition of the game scoresheet processing method, which includes basketball rules;
-
Experimental verification of proposed method.
The mobile application is the main module for the user. Its main functionality is scanning the basketball protocol. The selected image is cropped by the user to facilitate further data processing. A separate program, written in Python, is designed to extract data and return this data to the client application. It receives a protocol scan from the mobile application and then detects the appropriate lines and interprets the data about players, their fouls and points.
The work is organized as follows: We discuss works related to the processing of images with tabular data in Section 2. In Section 3, we gathered the analysis of requirements for the proposed system. In Section 4, we outlined our method. An example of results is shown in Section 5. Section 6 concludes the paper.

2. Related Work

In this paper, we deal with two issues related to image processing. The first is the correct detection of table cells which is the match report. The second is the recognition of handwritten digits that represent the score data. Both issues were often discussed in earlier works. However, in specific applications, some adaptations should be made.
Although the structure of the match protocol is well defined (Appendix A), it is necessary to designate the positions of individual cells in the user-provided photo. One of the first papers on this subject is [2], where the author identifies the position of table cells based on the presence of text blocks. This approach is not good because we mainly have numerical data, and empty cells are also important.
Two types of approaches are used for complex tables: rule-based and learning-based [3]. In rule-based methods, similar to [2], there is an assumption that a table is a block of text that follows some constraints. These constraints can be defined, for example, by grammar [4]. Grammar rules are especially useful when there are empty cells in the table. They allow for an unambiguous interpretation of data in the case when a space can mean both no data in a cell and be part of a cell covering several cells in the row below. An example of possible interpretations of tabular data is shown in Figure 1. A single cell with a height of two rows on the left side can be interpreted as two cells (cases (a) and (b) in Figure 1). A single cell two columns wide can be interpreted as two cells of which only one contains data (case c) in Figure 1). Of course, if a table has a very complex structure, there may be more such misinterpretations of its structure.
Newer studies use various methods to find interesting cells, such as clustering [5], neural networks [6] or graph structures [7].
In our case, we do not need any complicated rules for table construction, as the match protocol has a fixed structure. The method we use is described in detail in Section 4.
The second issue related to image recognition necessary in this work is the recognition of handwritten numbers. This issue is also widely discussed in the literature. Currently, the best results are obtained through the use of deep learning methods. Examples of works in this field are [8,9,10].
Various models of neural networks are used in the learning process. The layers used in these models are:
-
Convolutional layers—in such a layer, the relationship between the current pixel and its threshold of a specific size is considered.
-
Pooling layers are used to reduce the size of the data (down-sampling). Typical operations are selecting the average or maximum value.
-
Flattening layers—these are used to convert data to a single feature tensor, which is to be passed to the next layer. As a rule, the exit from the flattening layer is the entry into the layers responsible for classification.
-
Dense layers—each neuron of such a layer is connected to each neuron in the previous layer
To the best of our knowledge, there are very few works on handwritten multi-digit recognition [11,12]. This is important from our point of view because basketball scores consist of two digits for most of the game. The players’ numbers are also usually two-digit. In Matan’s et al. work [11], strings consisting of several digits (postal codes) were used to teach the neural network. In contrast, in Yang’s work, each digit was recognized separately, obtaining satisfactory results. It is more common to recognize multi-digit printed numbers [13,14]. However, they do not do much for handwritten numbers. Section 4 outlined issues regarding the classification of multi-digit numbers and proposed some techniques to improve classification accuracy.

3. Requirements Details

This section presents an analysis of the design of a basketball game data management automation system. The following sections describe:
-
Project goal, target group and competition assessment;
-
Functional requirements and business rules.

3.1. Project on the Market

The goal of our work was stated according to SMART methodology [15], which means it must be:
-
Specific (states the outcome);
-
Measurable (it specifies how to measure the outcome);
-
Attainable (it states the desired value of the indicator);
-
Realistic (achievable with available resources);
-
Time-bound (specifies time frames).
In our case, the goal is to build a system that will allow us to obtain data on the course of a basketball match based on the match protocol with an accuracy of over 70% regarding the course of the match, using machine learning methods.
The target group of project recipients is defined according to the geographical (region, place of living), demographic (age, gender, occupation, ethnicity), psychographic (personal features, lifestyle), and behavioral (in what situations user will use our system, how often, why) [16,17].
In the case of our system, the geographical criterion does not matter, except that the protocol read by the application follows the pattern used in Poland. However, the method is so general that it can also be applied to other protocol templates. The only demographic criterion is the occupation: the application is intended for referees, coaches and basketball players. For the application users, we have not identified psychographic criteria, but behavioral criteria are important. The application will be used after each match played. Its attractiveness results from the possibility of conveniently obtaining complete match data.
In order to determine the market position of the proposed product in relation to competitive solutions, an analysis was carried out following Porter’s five forces principle. These are [18]:
-
Competition in the industry;
-
Potential of new entrants into the industry;
-
Power of suppliers;
-
Power of customers;
-
Threat of substitute products.
The proposed system concerns the acquisition through image analysis and then the storage of the results of basketball matches. OCR tools can be used to extract data from images. These are paid applications and relatively difficult to use by the intended target group of the project recipients. The authors of such programs are probably not interested in creating dedicated solutions, e.g., for sports coaches. In addition to the creators of OCR tools, companies from the IT industry on the market can prepare a similar solution based on available libraries. However, it does not have to be attractive to them due to the limited group of recipients. As for a comprehensive solution dedicated to professional sports, it is not available to our knowledge. There are, of course, websites that aggregate data on games, but the method of obtaining this data is beyond their area of interest.
To prepare the proposed system, it is necessary to have some data storage infrastructure and knowledge of the programming language. Many suppliers in the infrastructure market have a diversified market share, but the offers are competitively priced. This is good in the context of the proposed product. The same applies to machine learning libraries. Currently, available solutions are available on the market, which is also an advantage.
Regarding the development platforms themselves, most technologies are available for free. The situation regarding tools is similar. The purchasing power of potential customers is relatively low due to the size of the target group. The threat of the emergence of a competitive solution can be assessed as probable only in the case of significant market success of the proposed solution.

3.2. Functional Requirements

The functional requirements for the data acquisition application have been collected in the form of user history:
  • As a user, I want to be able to analyze a protocol photo taken while using the application or selected from the photo gallery;
  • As a user, I want to be able to rotate the photo and correct the perspective;
  • As a user, I want to be able to complete the names and numbers of players;
  • As a user, I want to send a photo for analysis;
  • As a user, I want to pick up the photo and see the obtained data.
Business rules are related to the rules of the game of basketball. In particular, the following rules were taken into account when analyzing the protocols:
  • Player numbers cannot be repeated within one team;
  • Exactly five players are starting the match for each team;
  • The number of the scoring or foul player must match the players’ names assigned to them;
  • After a successful throw, the score may change by two or three points;
  • After free throws, the score may change by zero, one, two or three points;
  • The points scored in the flow chart are stored in chronological order.

4. Data Extraction Method

This section describes the principle of the form data extraction algorithm. The algorithm consists of two parts. The first part is responsible for identifying essential places in the table, while the second part is responsible for recognizing the entered numbers. The data recognition application was prepared in Python with the Django framework to handle HTTP requests. The OpenCV and Keras libraries were used for image recognition tasks.

4.1. Table Extraction

This step aims to identify the main lines in the protocol and then the table cells. The first step is to pre-prepare the image for edge detection by changing the color space to grayscale, binarization and negative.
Since the minutes of basketball games are standardized, we do not need to use very general methods to identify the table. To identify individual sections of the protocol, we identify the lines:
  • The protocol header that delimits at the bottom (being the top line of the section describing the course of the game and Team A);
  • Separating the data of Team A and Team B;
  • Separating the A Team data of Team B and the section containing a summary of the result and signatures.
For each line, we defined a set of rules which line must fulfill to be found—these are two intervals of percent values for horizontal and vertical placement of the line.
In the next stage, we detect the main vertical lines. We take advantage of the fact that there are very few lines in the part of the protocol containing the match summary and signatures. An example is shown in Figure 2.
We proceed in the same way when drawing lines in the table containing information about players and the course of the game.
The scoresheet table consists of vertical and horizontal lines that divide it into sections. We used the OpenCV Python library in the implementation process and wrote several routines to obtain a final result.
To find lines in the image, we use probabilistic Hough transform. The parameters we used are as follows: ρ = 1, θ = π/180, threshold = 50, minimum line length = 50, max line gap = 30. The parameters were the same for horizontal and vertical lines.
In the second step, we processed the lines to connect segments of the same line into one line. This step was needed as the original lines detected by PHT were fragmented. We assumed that line fragments must be merged if they have a similar orientation (we assumed the maximum difference of 2 degrees) and are close to each other (five pixels).
The outline of the method is as follows:
  • For each line:
    • Get the distance to the other lines.
    • If angle and distance criteria are satisfied, put lines in the same group.
  • Merge lines in the same group into one line:
    • Order lines by x and y coordinates.
    • hoose the minimum and maximum coordinates of the merged line based on the ordering.
Next, we separated vertical lines from horizontal lines. The lines that were neither vertical nor horizontal were not taken for further analysis. We assumed 5-degree tolerance for both horizontal and vertical lines.

4.2. Preparation of Numbers for Recognition

The neural network model was used to read the numerical data. To increase the accuracy, each of the separated cells was additionally subjected to edge removal treatment. The function responsible for this checks each image by looking at the pixel columns from the left, right and rows of pixels from the top and bottom. If there are more black pixels in the column/row than 50%, it means there is a contour line and should be deleted. The contour cleaning effect is shown in Figure 3.
To read two-digit numbers, first, separate them and then read each one separately. Moreover, we cannot always tell if we are looking for a two-digit or one-digit number. There are many ways to separate two numbers:
  • Cutting in the middle of the picture-ineffective in handwriting, the second digit can take up much more places than the first digit, and the writer could simply write the number closer to the left or right edge.
  • Intersecting the image with no black pixels—where two digits do not touch—is not adequate for handwriting because people often combine two digits, making it impossible to find a space between the digits.
  • Combining the above two methods—finding the smallest number of black pixels between 35% and 65% of the image gives the following effect for one and two-digit numbers (the green vertical line shows where the algorithm split the image—Figure 4):
When reading the course of the game in specific columns, we expect specific values. After checking if a given cell is not empty, we can proceed to read the number. For the columns with the players’ numbers, we are looking for numbers from the pool of a given team. For the minute column, we are looking for numbers from the 1–10 range, and we know that each subsequent value is greater than the previous one (in the case of the end of the quarter, we know that we start counting the minutes anew). Furthermore, for point columns, we always have four options for the next full cell: one, two, or three greater than the currently calculated result, or a minus. What is more, we can determine whether we are looking for a digit or a number (two-digit), which will further increase the accuracy of the numbers we are looking for.

4.3. Identification of Numbers

For the project, three neural network models for digit recognition were investigated. They were implemented using the Keras library, which allows choosing the number of layers, neurons, activation functions and other parameters. Moreover, with this library, after creating the network, it is possible to check its accuracy (the number of correctly predicted classes divided by the total number of tested objects) and losses (loss function based on the absolute difference between the values predicted by the model and the actual values of the labels). Two different models were considered for calculations: convolutional network and multilayer perceptron. The schemas of the models are given in Figure 5.

5. Results

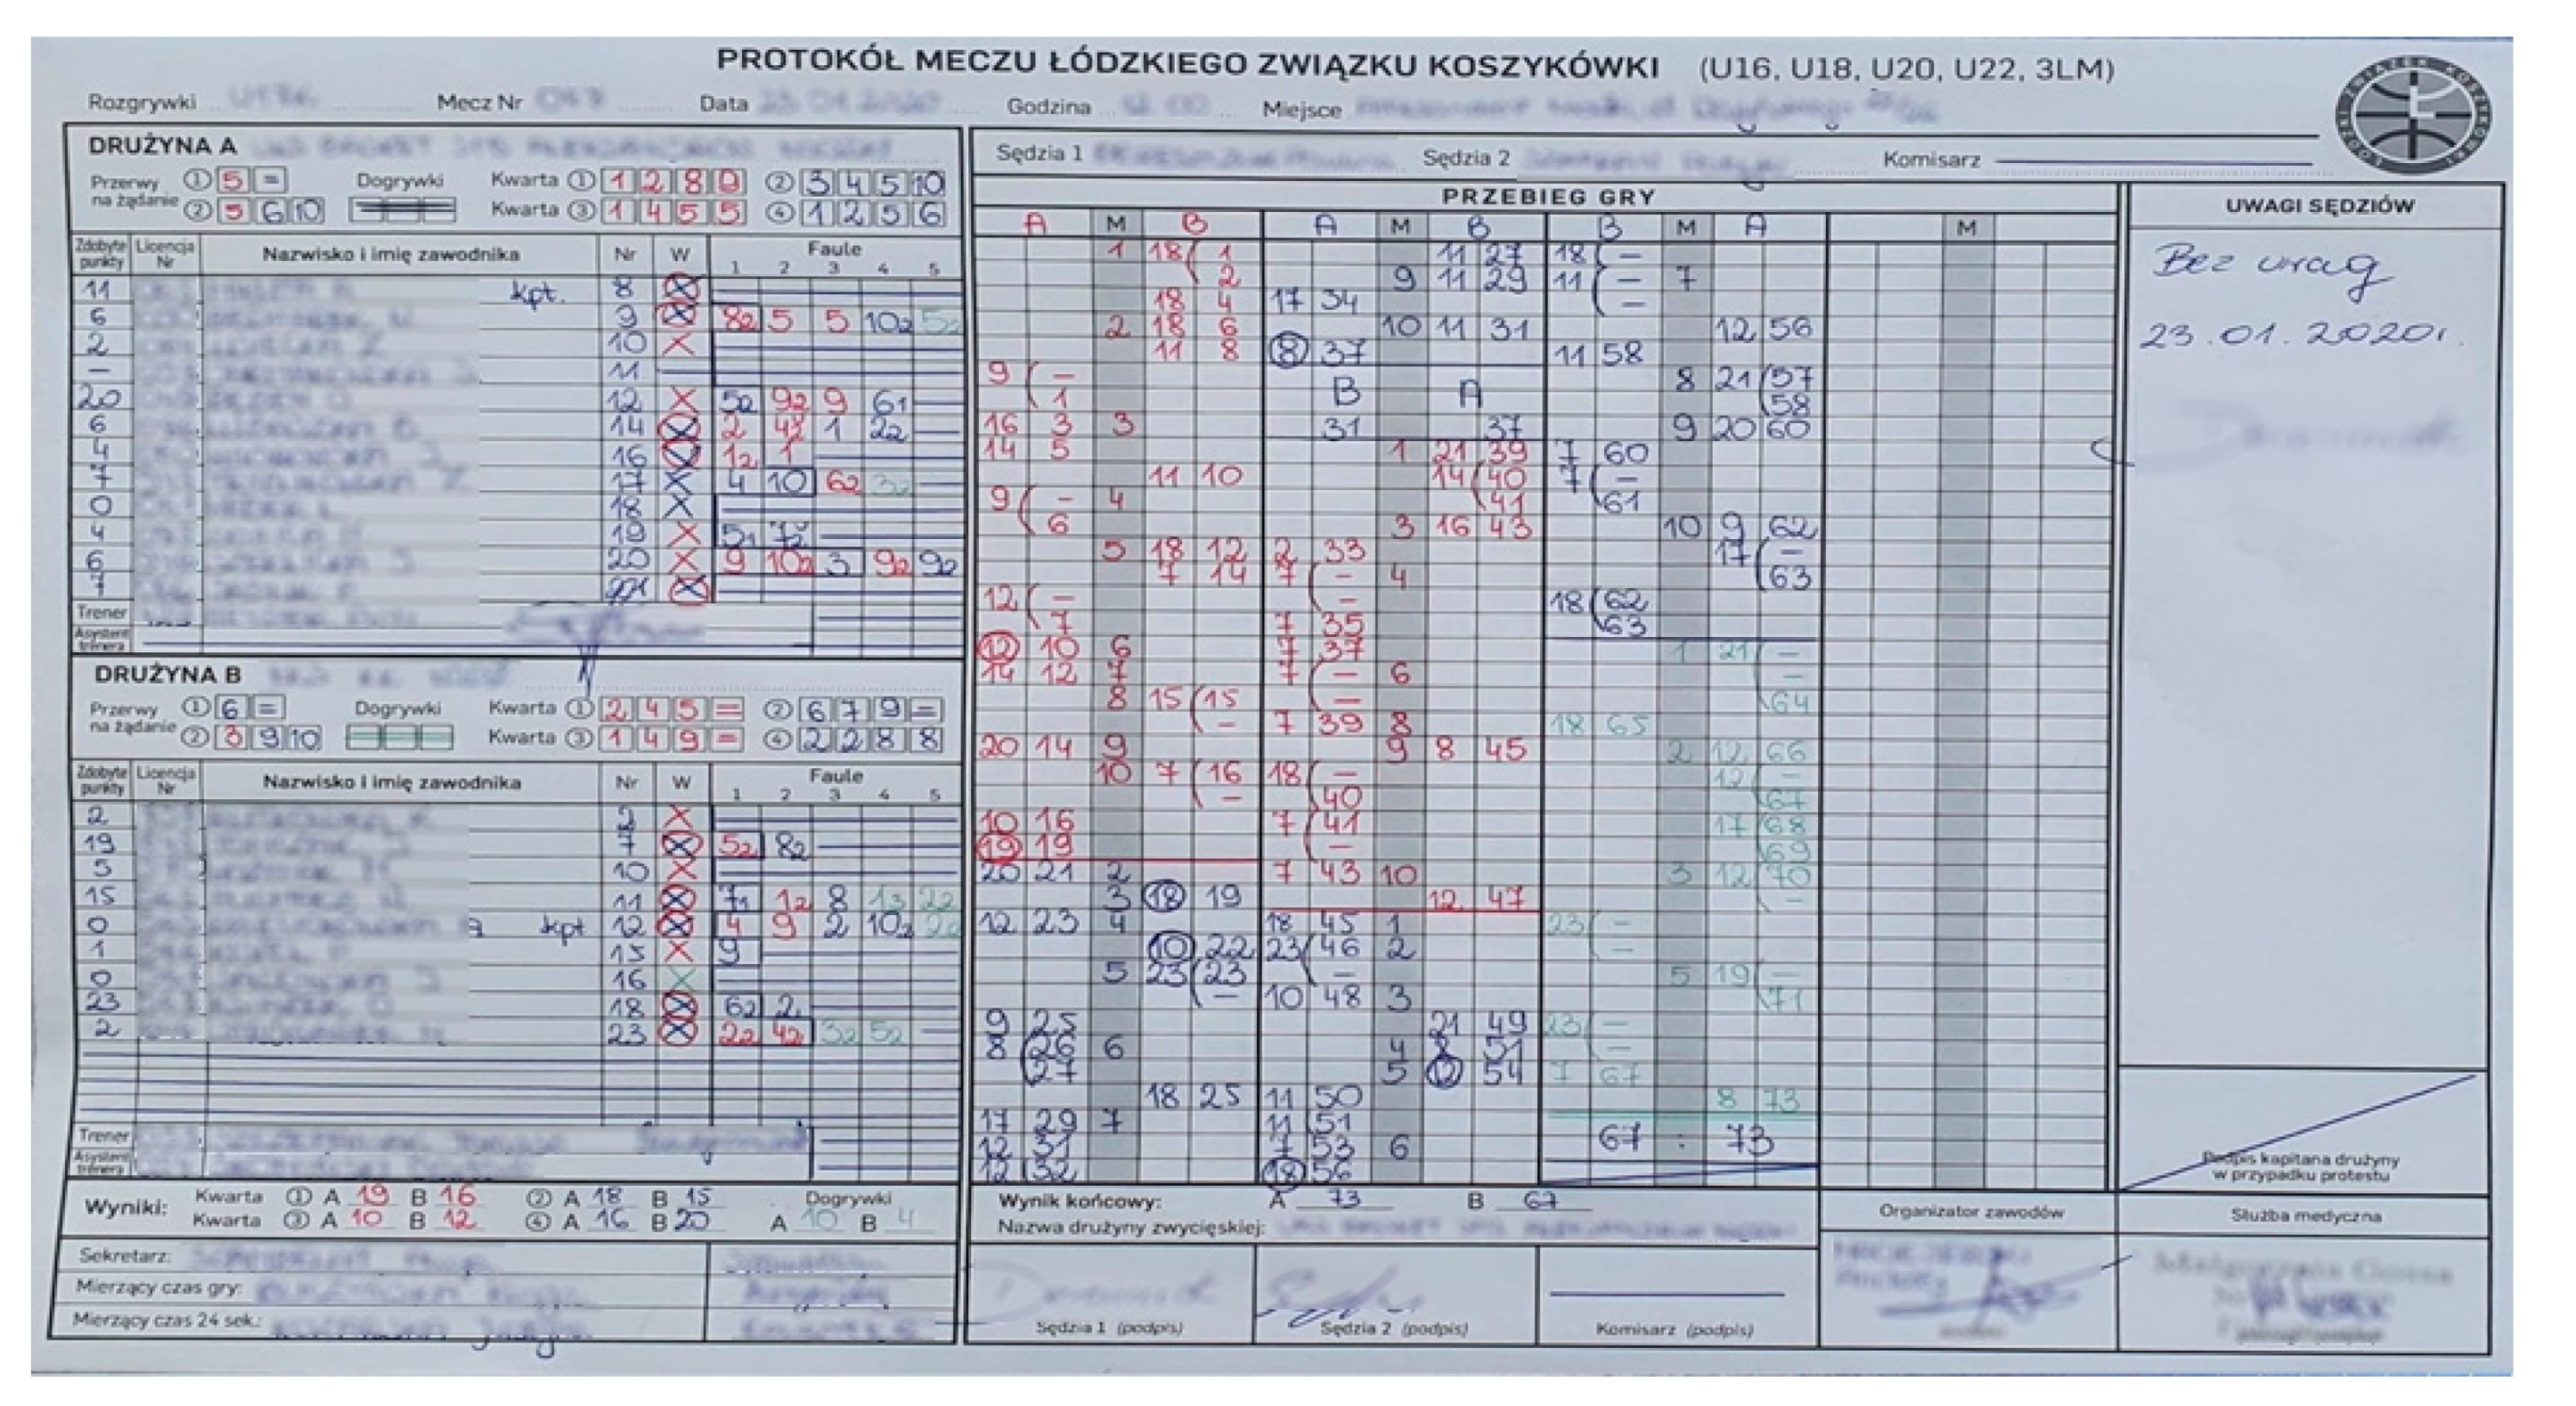
In this section, we show the results of image processing in our system. An example of a match protocol is shown in Figure 6. Players’ and officials’ data were blurred as it is not a subject of analysis.
As stated in Section 4.1, at first, we perform filtering on the image to identify lines correctly (Figure 7). On the left side, one can see gray-scaled image. It does not differ significantly from the base image. Some numbers and symbols on the scoresheets have lower brightness than others because of the different colors used in the protocol. The colors differ due to the scoresheet filling rules—odd quarters must be distinguished from even quarters. In our case, the typical brightness value for blue numbers was 60-90, and for red numbers: 90-140. Brightness for strong vertical and horizontal lines was ranged from 14 to 40. The thinner lines’ brightness was close to the red number brightness.
Binarization aimed to remove information from the image to identify main vertical and horizontal lines. As one can see, after binarization, most of the protocol looks clear. The main lines of the table are visible. There are also printed letters and some artifacts from the symbols on the scoresheet. On the right, we can see negated image that is ready for further processing.
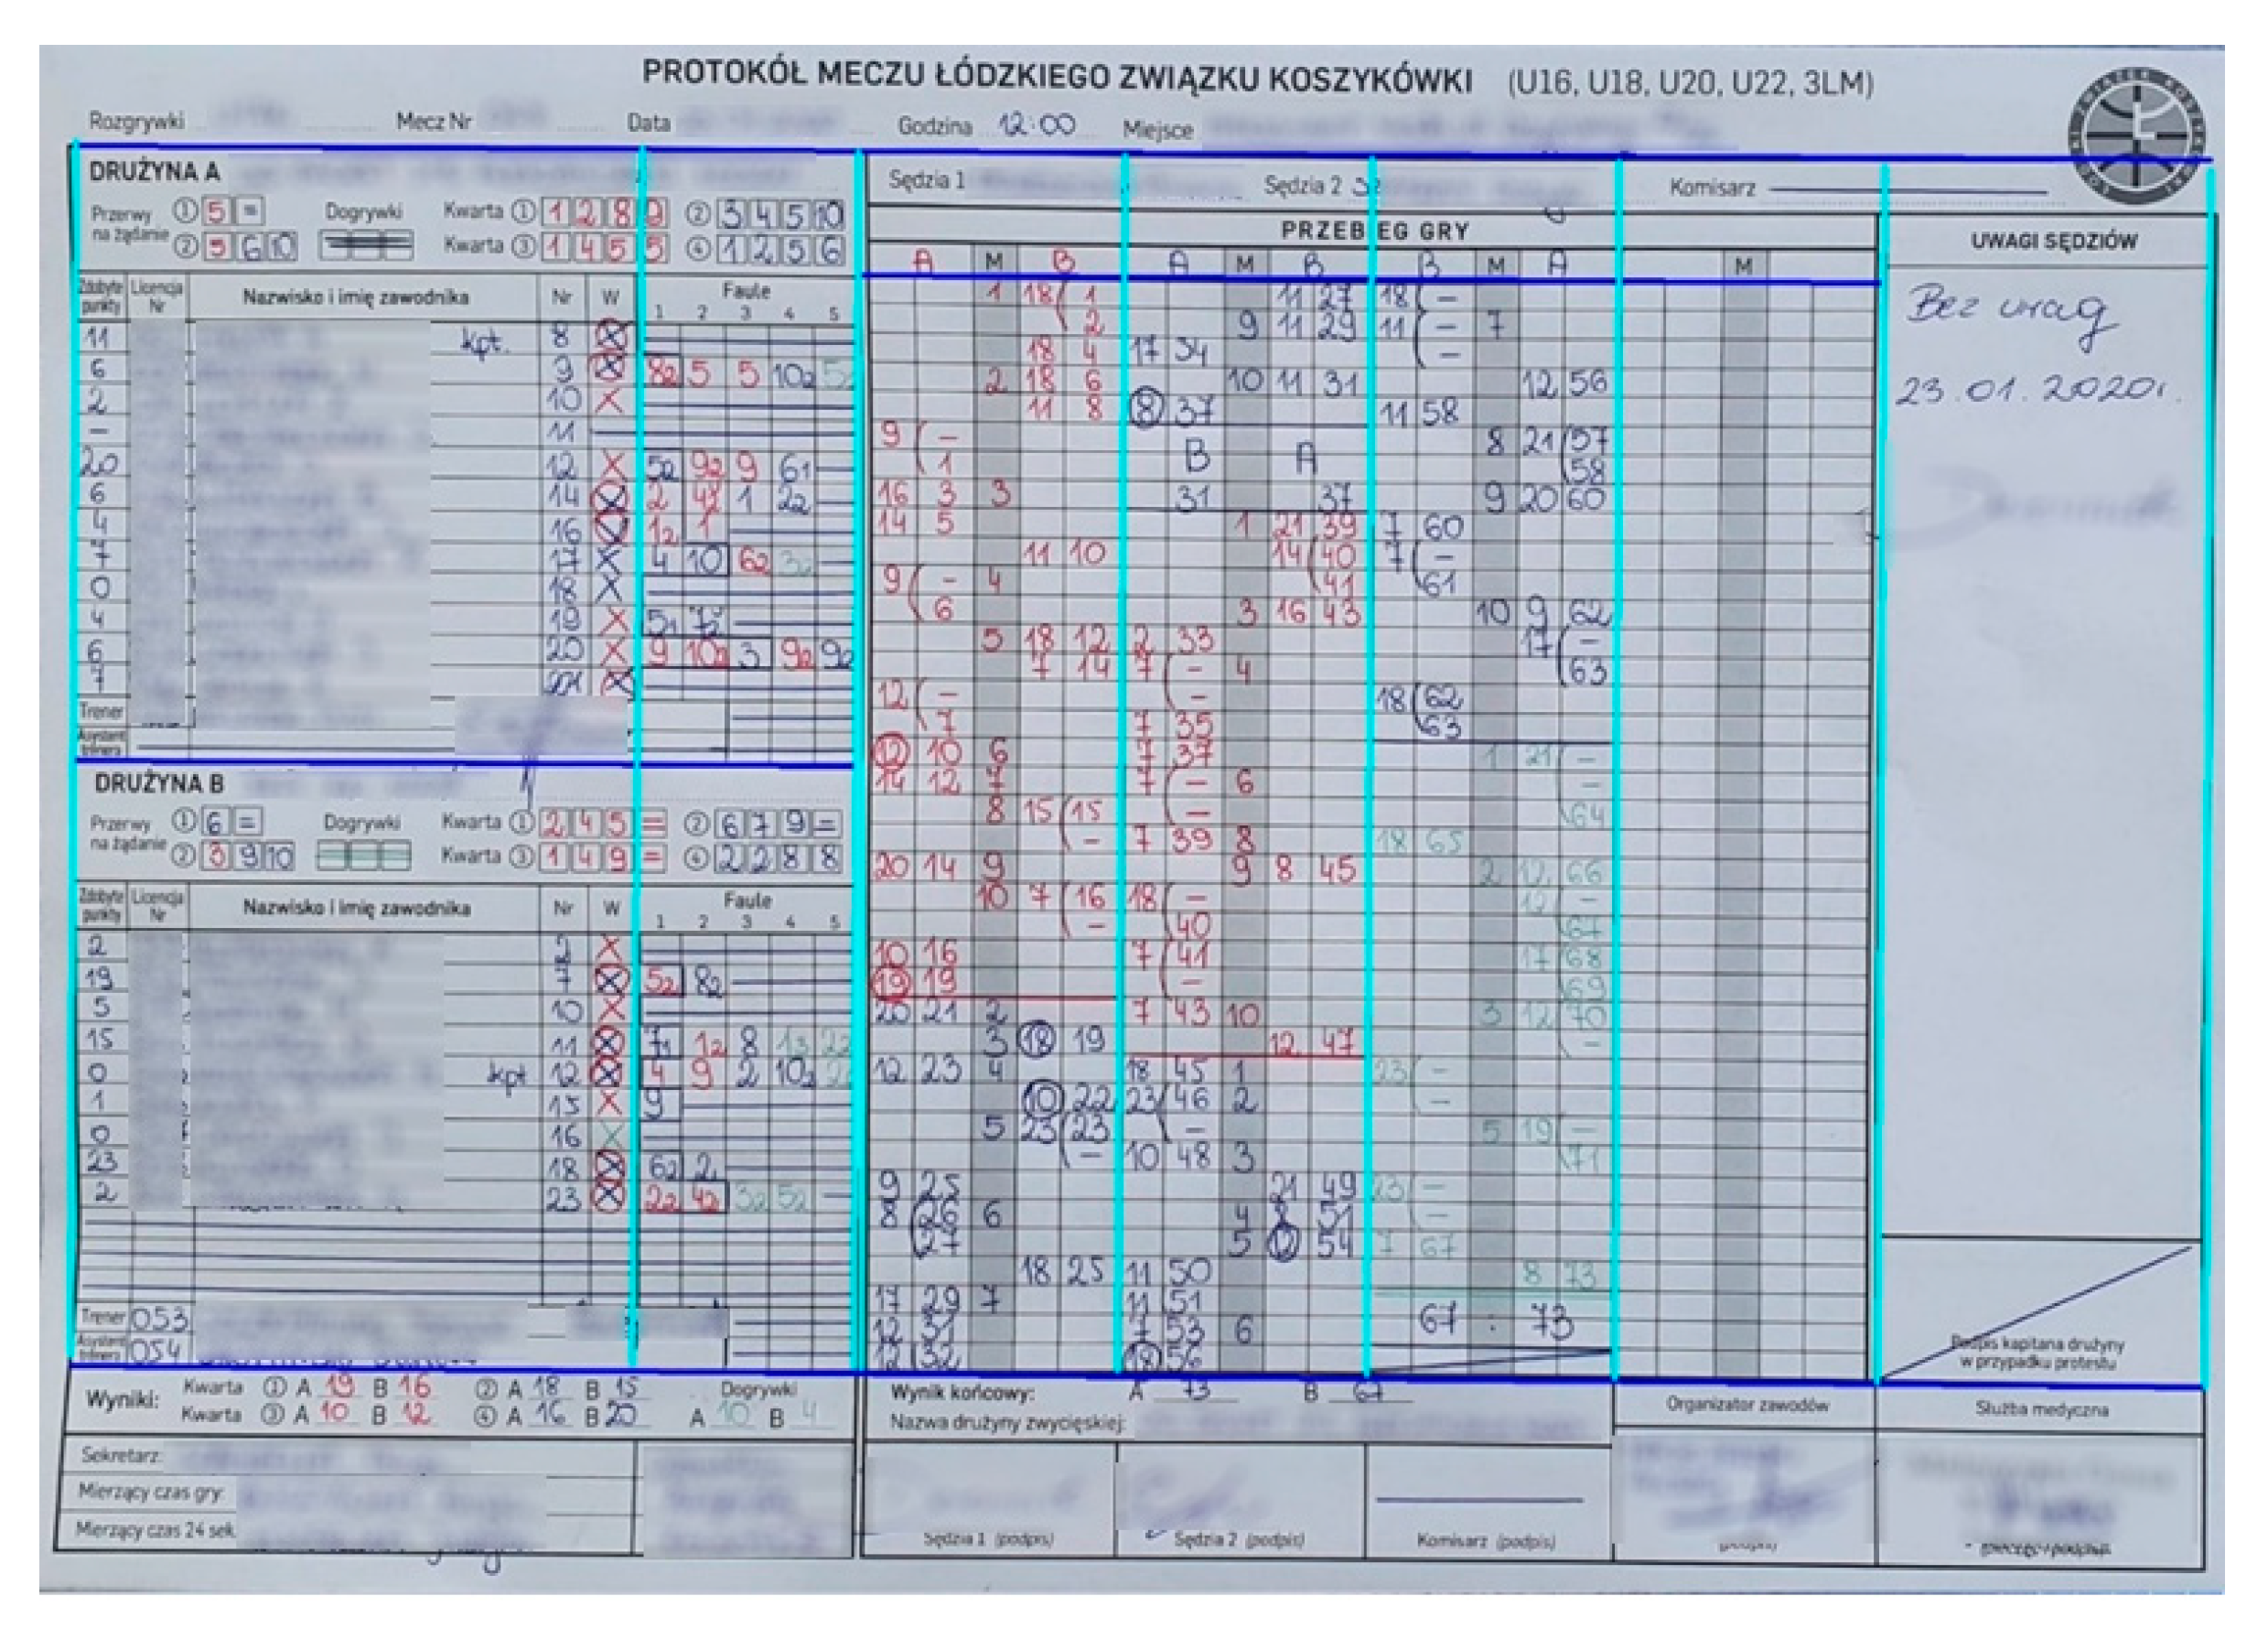
The next step of our method is to identify main lines and cells in the match protocol. The result is shown in Figure 8 and Figure 9, respectively. As one can see, the main lines in the game scoresheet are extracted correctly. The most interesting data are between the top and bottom blue lines. The most-left and most-right lines of the protocol are identified correctly as well. Gameplay columns are correctly separated, but the left and right borders are shifted by a few pixels. The reason is that the lines were not exactly vertical in the photograph. Such a situation may result in errors in the number-recognition step. This is the reason why we had to implement the contour removal described in Section 4.2.
Figure 9 presents the result of gameplay table structure extraction. As one can see, most cells are extracted correctly. We can see the artifacts on the left and right border of the structure (the violet lines do not strictly follow lines on the photograph). We can also see that cells in the bottom-right part of the table are identified correctly. This is caused by the fact that the line’s color did not belong to the specified threshold. We did not observe such behavior frequently.
However, the structure of the table was identified with very high accuracy. Sometimes some parts of the line were included in the identified cell. For all cells, we used a line-cleaning method described in Section 4.2.
The highest accuracy (98.86% on the training set) of number recognition was obtained for the convolutional neural network. The overall accuracy on multi-digit numbers was about 70%. The main problem in our work was that entered digits intersected the lines of the protocol—this misinterpretation of numbers by a neural network. Our contour cleaning method often removed some pixels that should be interpreted as pixels that belong to the number, not the table. This step needs some further research to improve the obtained result.

6. Discussion

In our work, we tried to resolve the problem of basketball game data management. Currently, paper scoresheets are filled during the game, and then, the results must be entered into the electronic system. This process is quite time-consuming as there are many numbers in such a scoresheet—teams score points many times in a single game, so the person who fills online data must check many positions to document the game correctly.
To automate the process, we implemented a solution in Python language that allows extracting data from a photography of the protocol. This is a two-step process. At first, the scoresheet table must be extracted, and then numbers must be recognized.
Regarding the table extraction process, some former approaches, either based on the predefined structure (grammar-based approaches) or more general approaches, can resolve table structure based on machine learning techniques. In our work, we decided to implement the table extraction process from scratch. We did not use the well-known grammar-based approach because there is only one table schema for the game scoresheet. As we did not need to use several templates of such protocol, we defined our own set of rules to identify interesting cells in the game scoresheet. The disadvantage of this approach is that we cannot simply revise our implementation in case of protocol structure changes. However, we have to specify the set of other rules to extract it correctly. On the other hand, the method we described in our work, in general, can be adapted to the other sports, but different rules for the lines in the protocol must be applied.
The table extraction process’s main issues regarded identifying the lines and connecting the lines into a table. These steps were needed to identify the meaning of data in the game protocol correctly. The first issue was to connect line segments identified by probabilistic Hough transform. We only needed to identify horizontal and vertical lines, so we did not need any unique merging technique. We analyzed only line segments which orientation was close to either horizontal or vertical and merged segments that were close to each other into bigger lines. The second issue we experienced was that extracted lines sometimes were not tangent. In such a case, we had to refine the lines by lengthening them to be tangent. This operation sometimes caused artifacts (the most-right vertical line and bottom-right cells on Figure 9).
To deal with the problem of table contours in the pixel range that was supposed to contain data, we implemented a contour removal algorithm. It analyzed border pixels of the identified area and removed contours. The condition we used was that 50% of pixels must be black to identify data as a contour. Examples of applications of such method are shown in Figure 3. Further, a 50% criterion was chosen because numbers do not have so many pixels in a single line.
The last problem was to recognize two-digit handwritten numbers. In basketball, most numbers are two-digits (most score data, players’ numbers). In the literature, we found two main approaches. The first approach applies two-digit numbers to train the neural network. We did not want to follow this approach as we had only a dataset containing one-digit numbers. The artificial connection of numbers into two-digit numbers did not seem valid to us. In the second approach, each digit is recognized separately. To separate digits, we counted black pixels in each column in the range of 35% to 65% of the cell and cut the column with the smallest number of black pixels. The results of this approach are shown in Figure 4. Obtained results show that digits are separated correctly.
During the number recognition, we observed that the overall accuracy of this process is significantly lower than one obtained on the training set. We think this is caused by the fact that numbers often crossed lines in the table in our protocols. During the contour removal process, pixels that belong to the number were interpreted as pixels that belong to the contour. This issue needs further investigation.
As a part of this project, we also implemented a small Android application that addressed functionalities and business rules specified in Section 3.2. The application was used during tests to obtain a photo of the game scoresheet and correct the perspective. Business rules mentioned in Section 3.2 were used to validate the data obtained from the extraction process. In this way, we calculated the accuracy of the number recognition. As the mentioned application was straightforward, we did not describe it in detail in this paper.

7. Conclusions

The work aimed to automate the process of extraction of basketball match data from the protocol. The prepared mobile application and the protocol processing application meet the following assumptions:
  • Basketball protocol scanning;
  • Sending an image to the server (application written in Python);
  • Discovery of tables in the log using the OpenCV library;
  • Recognition of scoring data from an image using a neural network model;
  • Sending data to a mobile application for final verification.
The system allows automating the record of match protocols. This is a significant improvement for basketball club employees, who usually perform this by transferring data from the protocol to the computer. Moreover, the employee was not required to rewrite all point data.
The application correctly reads the numerical data about 70%. Despite this, if the scorer writes two-digit numbers without separating them from each other, or the numbers intersect borders of the protocol table, the algorithm tends to separate them incorrectly, which in turn causes the number to be misread. In order to accept the data read from the protocol, one implemented business rules to check whether consecutive scores are possible to be obtained in the game.

Author Contributions

Conceptualization, K.S. and Ł.C.; methodology, K.S. and Ł.C.; software, K.S.; validation, K.S. and Ł.C.; formal analysis, K.S. and Ł.C.; investigation, K.S.; resources, K.S.; data curation, K.S.; writing—original draft preparation, K.S. and Ł.C.; writing—review and editing, Ł.C.; visualization, K.S. and Ł.C.; supervision, Ł.C.; project administration, Ł.C.; funding acquisition, Ł.C. All authors have read and agreed to the published version of the manuscript.

Funding

This research received no external funding.

Institutional Review Board Statement

Not Applicable.

Informed Consent Statement

Not Applicable.

Conflicts of Interest

The authors declare no conflict of interest.

Appendix A

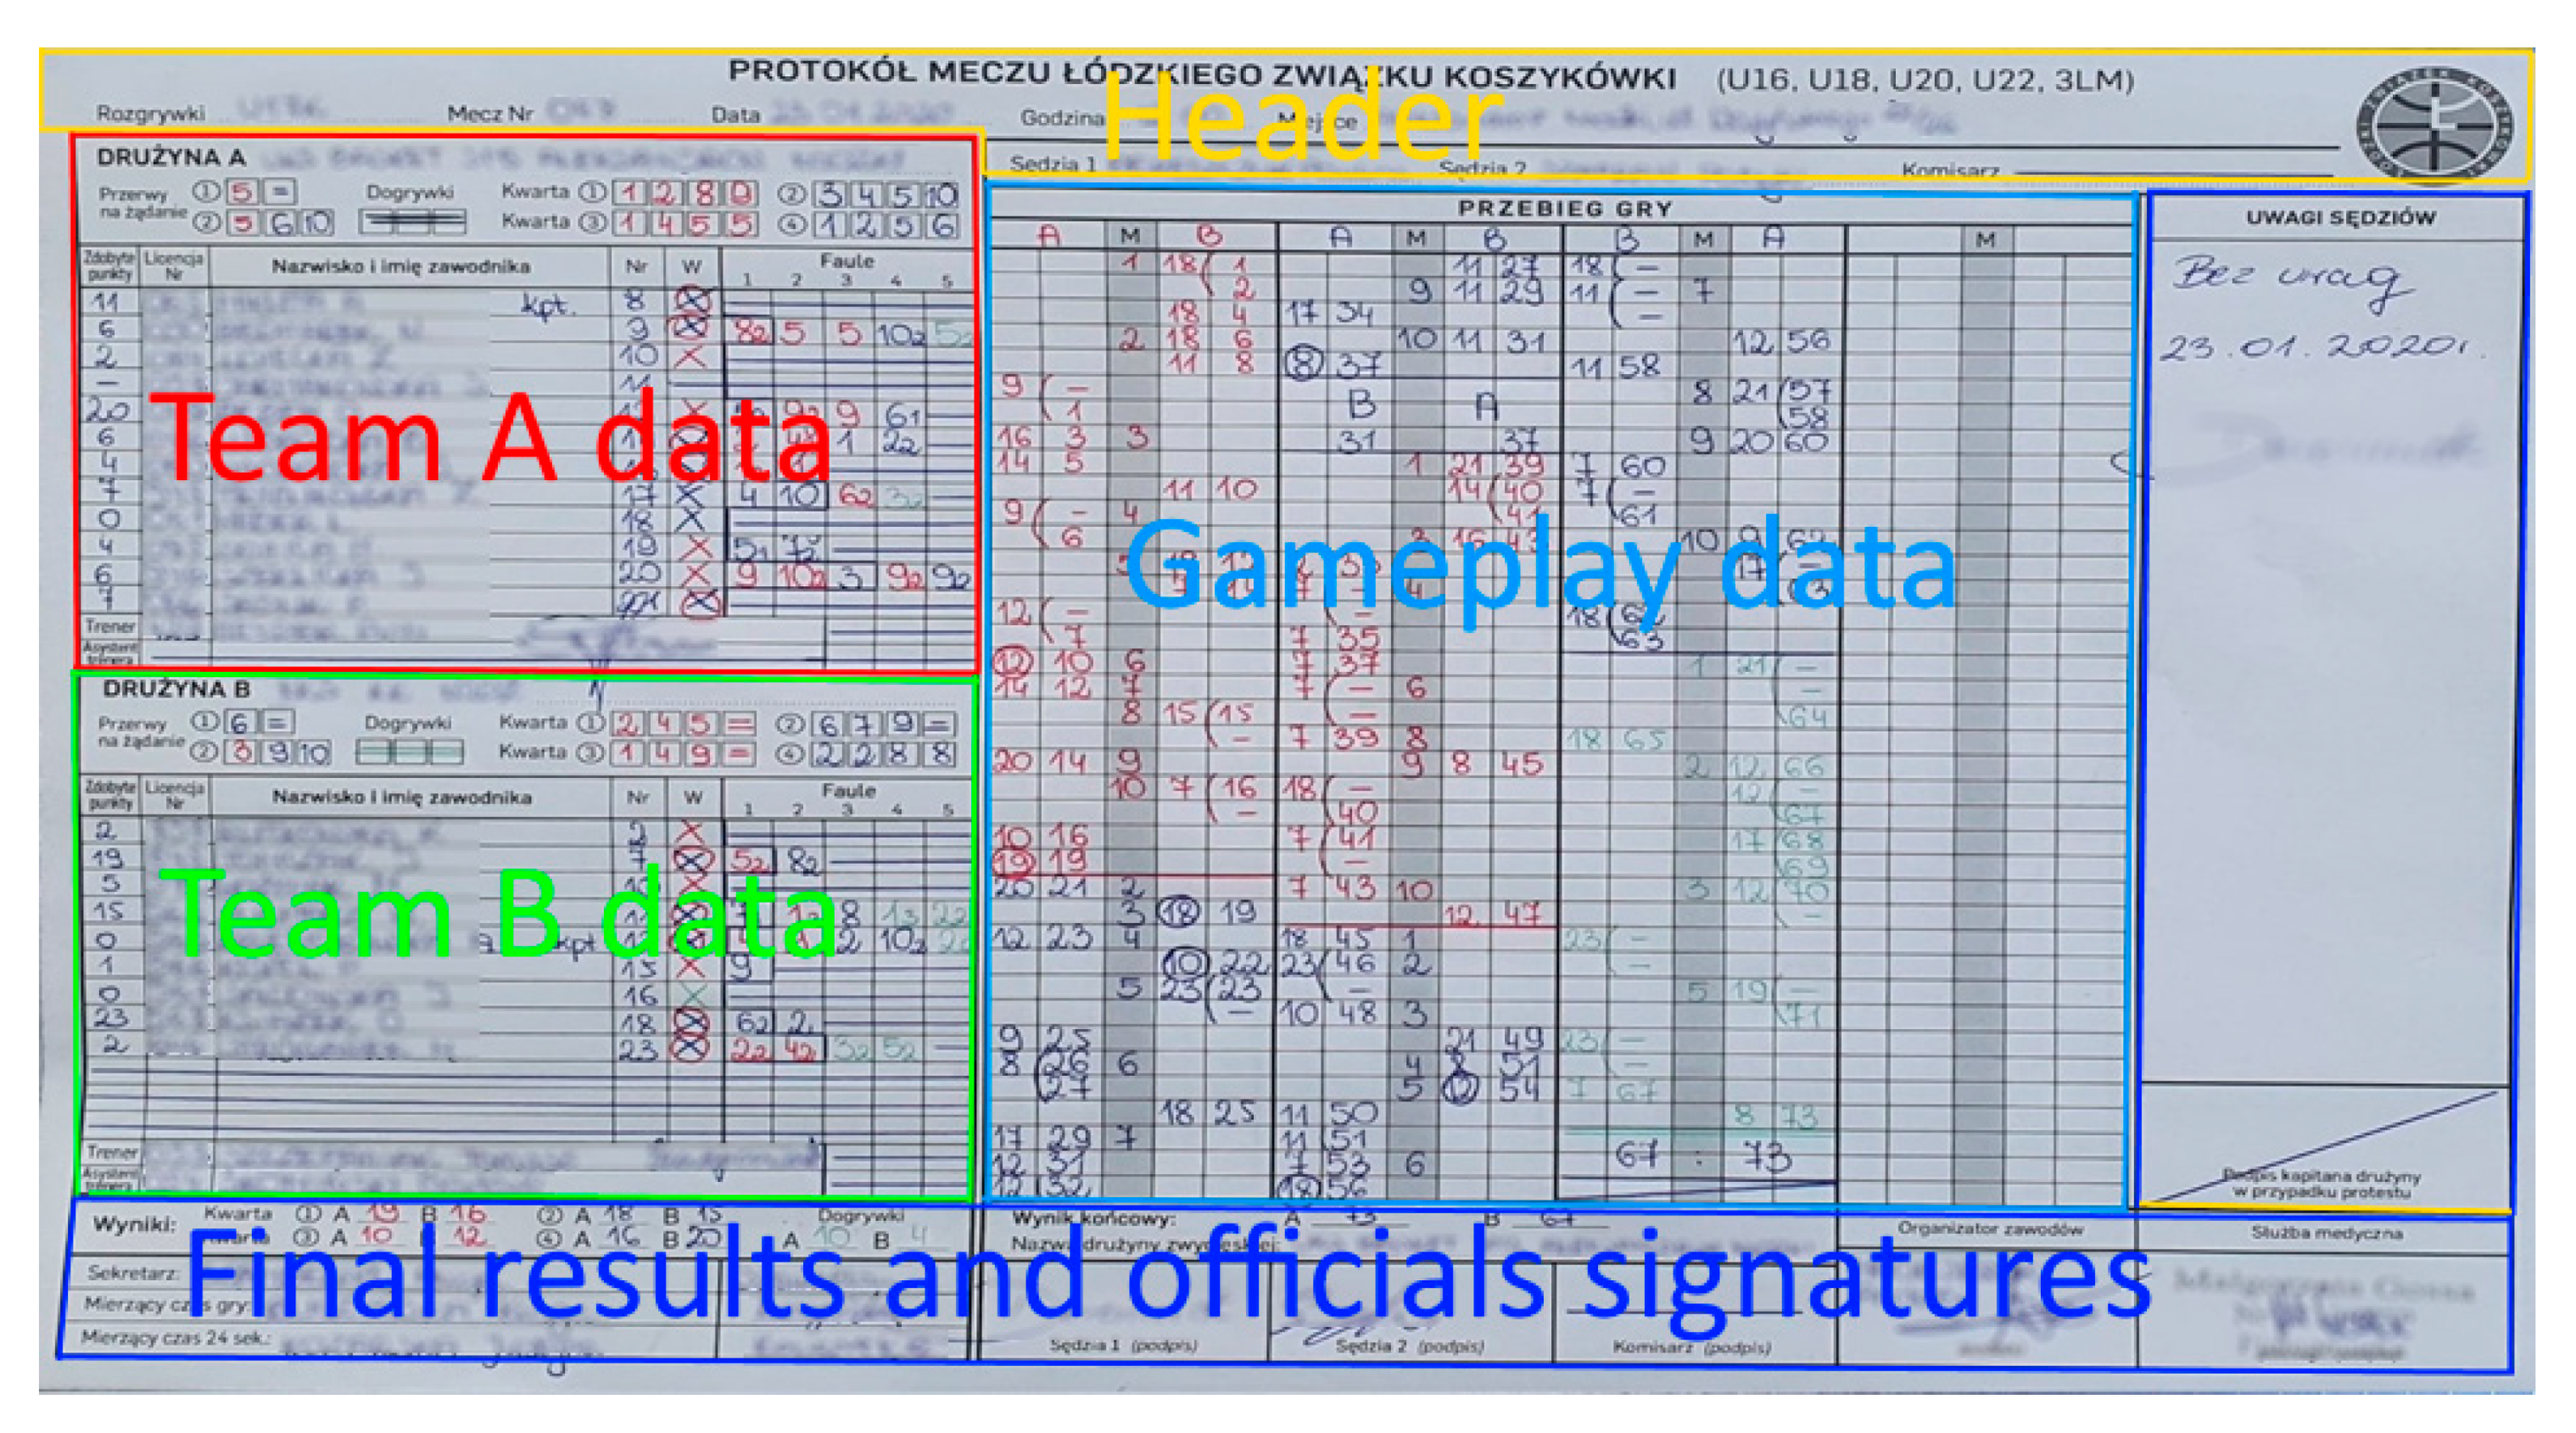
Match protocol contains general information about teams and players, date and place of the match, names of referees. For each player, the number of points and fouls committed is stored. The protocol also contains information about time, when points were scored.
The example protocol is shown in Figure A1. Players and teams’ data were removed as they do not matter in this case.
Figure A1. Structure of match protocol.
Information 12 00461 g0a1
At the top of the protocol, we have match data: date, hour and place, and league and match number. On the left side, we put information about the teams. Team A attacks the left side of the court at the beginning of the match. Each player in the team has a unique number. An example of the entry is shown in Table A1.
Table A1. Player details in match protocol.
Points GainedLicense NumberNameNumber1st SquadFouls
12345
100001John Smith7X6
30002Edmund High10 2572
In this example, we have data regarding two players. John Smith played with number 7. He was in the first squad, gained 10 points, and committed one foul in the game’s sixth minute. Edmund High has not played from the beginning and committed three fouls: in the second, fifth and seventh minute.
During the match, the referee puts information about the points gained on the right side of the protocol (denoted as gameplay data in Figure A1). If the player scores points, the referee enters his number in the left column “A” or “B” and the current result in the right column. Additionally, in the middle column “M” enters the minute of the quarter (1-10) in which the points were scored. Moreover:
  • A given minute is entered only once, even if there are several baskets in it.
  • If a three-point throw was hit, circle the player’s number
  • If there are free throws (one, two or three), then in the right-hand column in the “A” or “B” column, we enter the left-hand bracket in the height of one, two or three boxes, depending on the number of throws. We only enter the player’s number once during the first throw. An accurate throw is marked by entering the next point in a given box. The missed throw is marked with “-”.
In the example (Figure A2), the first points were gained in the first minute by the player with the Number 7 from Team A. He scored two points. In the same minute, the player with the Number 9 from Team B scored two points. In the second minute, the same player from Team B scored another two points, so the total result is four.
Figure A2. Example of score notation.
Information 12 00461 g0a2
Figure A3 shows a record of three different numbers of free throws. All the throws were made by the player with the Number 4. In the first case, he scored, and the current score is 12. In the second case, he had two misses, and on the third, he had scored two times and one missed, and the team’s current score is 14.
Figure A3. Notation of free throws.
Information 12 00461 g0a3
In the middle of the game, the teams change the baskets to which they will throw, and the columns representing the teams are changed in the score sheet. The letters “A” and “B” are entered into the protocol at the height of two grids in the reverse order, and the points of each team are rewritten. Moreover, two different pen colors are used to write the protocol so that the data on odd quarters is written in one color and even quarters in another. In the case of extra time, if we have the option of reaching for the third color.
Fouls are written in two places. Player fouls are completed next to their names, and team fouls are in four quadruple boxes under the team’s name. Player fouls are divided into:
  • An ordinary foul is marked with a minute next to the name of the fouling player.
  • The foul with free throws is marked with the minute with the free throws number in the subscript, next to the name of the fouling player.
  • Intentional/unsportsmanlike, technical and disqualifying fouls are marked as foul with personal throws, but additionally, in the superscript, we enter a letter denoting the type of foul.

References

  1. FIBA. Regulations for European Club Competitions. Available online: https://www.fiba.basketball/europe/RegulationsforEuropeanClubCompetitions2020-21.pdf (accessed on 31 October 2021).
  2. Itonori, K. Table structure recognition based on textblock arrangement and ruled line position. In Proceedings of the 2nd International Conference on Document Analysis and Recognition (ICDAR 93), Tsukuba Science City, Japan, 20–22 October 1993. [Google Scholar]
  3. Nazir, D.; Hashmi, K.A.; Pagani, A.; Liwicki, M.; Stricker, D.; Afzal, M.Z. HybridTabNet: Towards better table detection in scanned document images. Appl. Sci. 2021, 11, 8396. [Google Scholar] [CrossRef]
  4. Green, E.; Krishnamoorthy, M. Recognition of tables using table grammars. In Proceedings of the Fourth Annual Symposium on Document Analysis and Information Retrieval, Las Vegas, Nevada, 24–26 April 1995. [Google Scholar]
  5. Zucker, A.; Belkada, Y.; Vu, H.; Nguyen, V.N. ClusTi: Clustering method for table structure recognition in scanned images. Mob. Networks Appl. 2021, 26, 1765–1776. [Google Scholar] [CrossRef]
  6. Adiga, D.; Bhat, S.A.; Shah, M.B.; Vyeth, V. Table Structure Recognition Based on Cell Relationship, a Bottom-Up Approach. In Proceedings of the International Conference on Recent Advances in Natural Language Processing (RANLP 2019), Varna, Bulgaria, 5–6 September 2019. [Google Scholar]
  7. Chi, Z.; Huang, H.; Xu, H.-D.; Yu, H.; Yin, W.; Mao, X.-L. Complicated table structure recognition. arXiv 2019, arXiv:1908.04729. [Google Scholar]
  8. Ahlawat, S.; Choudhary, A.; Nayyar, A.; Singh, S.; Yoon, B. Improved handwritten digit recognition using convolutional neural networks (CNN). Sensors 2020, 20, 3344. [Google Scholar] [CrossRef] [PubMed]
  9. Albahli, S.; Alhassan, F.; Albattah, W.; Khan, R.U. Handwritten digit recognition: Hyperparameters-based analysis. Appl. Sci. 2020, 10, 5988. [Google Scholar] [CrossRef]
  10. Ali, S.; Li, J.; Pei, Y.; Aslam, M.S.; Shaukat, Z.; Azeem, M. An effective and improved CNN-ELM classifier for handwritten digits recognition and classification. Symmetry 2020, 12, 1742. [Google Scholar] [CrossRef]
  11. Matan, O.; Burges, C.J.; LeCun, Y.; Denker, J.S. Multi-digit recognition using a space displacement neural network. In Advances in Neural Information Processing Systems; Morgan Kaufmann Publishers Inc.: San Francisco, CA, USA, 1992. [Google Scholar]
  12. Yang, X.; Pu, J. MDig: Multi-Digit Recognition Using Convolutional Neural Network on Mobile. 2015. Available online: https://web.stanford.edu/class/cs231m/projects/final-report-yang-pu.pdf (accessed on 20 September 2021).
  13. Ciresan, D. Avoiding segmentation in multi-digit numeral string recognition by combining single and two-digit classifiers trained without negative examples. In Proceedings of the 2008 10th International Symposium on Symbolic and Numeric Algorithms for Scientific Computing, Timisoara, Romania, 26–29 September 2008. [Google Scholar]
  14. Goodfellow, J.; Bulatov, Y.; Ibarz, J.; Arnoud, S.; Shet, V. Multi-digit number recognition from street view imagery using deep convolutional neural networks. arXiv 2013, arXiv:1312.6082. [Google Scholar]
  15. Ogbeiwi, O. Why written objectives need to be really SMART. Br. J. Healthc. Manag. 2017, 23, 324–336. [Google Scholar] [CrossRef]
  16. Valenzuela, F. Marketing: A Snapshot; Pearson Higher Education AU: London, UK, 2013. [Google Scholar]
  17. Hailes, J. Business Analysis Based on BABOK® Guide Version 2—A Pocket Guide; Van Haren: Hertogenbosch, The Netherlands, 2014. [Google Scholar]
  18. Dobbs, M.E. Guidelines for applying Porter’s five forces framework: A set of industry analysis templates. Compet. Rev. 2014, 24, 32–45. [Google Scholar] [CrossRef]
Figure 1. Possible misinterpretations of complex table.
Information 12 00461 g001
Figure 2. Bottom of the protocol with vertical lines marked.
Information 12 00461 g002
Figure 3. Effect of contour cleaning.
Information 12 00461 g003
Figure 4. Number separation using the proposed method.
Information 12 00461 g004
Figure 5. Examined neural network models.
Information 12 00461 g005
Figure 6. Example of match protocol.
Information 12 00461 g006
Figure 7. Prefiltering of the protocol.
Information 12 00461 g007
Figure 8. Main lines identified on the protocol.
Information 12 00461 g008
Figure 9. Identification of lines in the gameplay section.
Information 12 00461 g009
Publisher’s Note: MDPI stays neutral with regard to jurisdictional claims in published maps and institutional affiliations.