3.1. Microstructure, Chemical Composition, and Crystallinity
The elemental composition of the deposited films can be seen in
Table 1. The hydrogen content of the reactive sputtered films was not considered; the results presented for the hydrogenated coatings show the sum of C, W, S and O being 100 at.%. Changing the power applied to the carbon target, the number of pellets used, or the partial pressure of the CH
4 gas clearly affected the C contents of the coatings. The oxygen content is up to 12 at.%, and the highest values for the co-sputtered coatings are probably a result of the target contamination, residual oxygen present in the chamber, and longer deposition times (3 h compared to 1–2 h used for the other methods).
The sulfur to tungsten ratio is of great importance in these films as it can affect the tribological performance [
17]. The values (1.6–1.7) for the co-sputtered coatings are in agreement with previous studies performed on co-sputtered W-S-C coatings deposited using the same equipment [
14]. The S/W ratio for the coatings deposited by sputtering a composite target ranges between 1 and 1.7, depending on whether the deposition is carried out in stationary or intermittent mode. Reactive sputtered films (D4) also seem to be poorly stoichiometric, with values between 1.23 and 1.5.
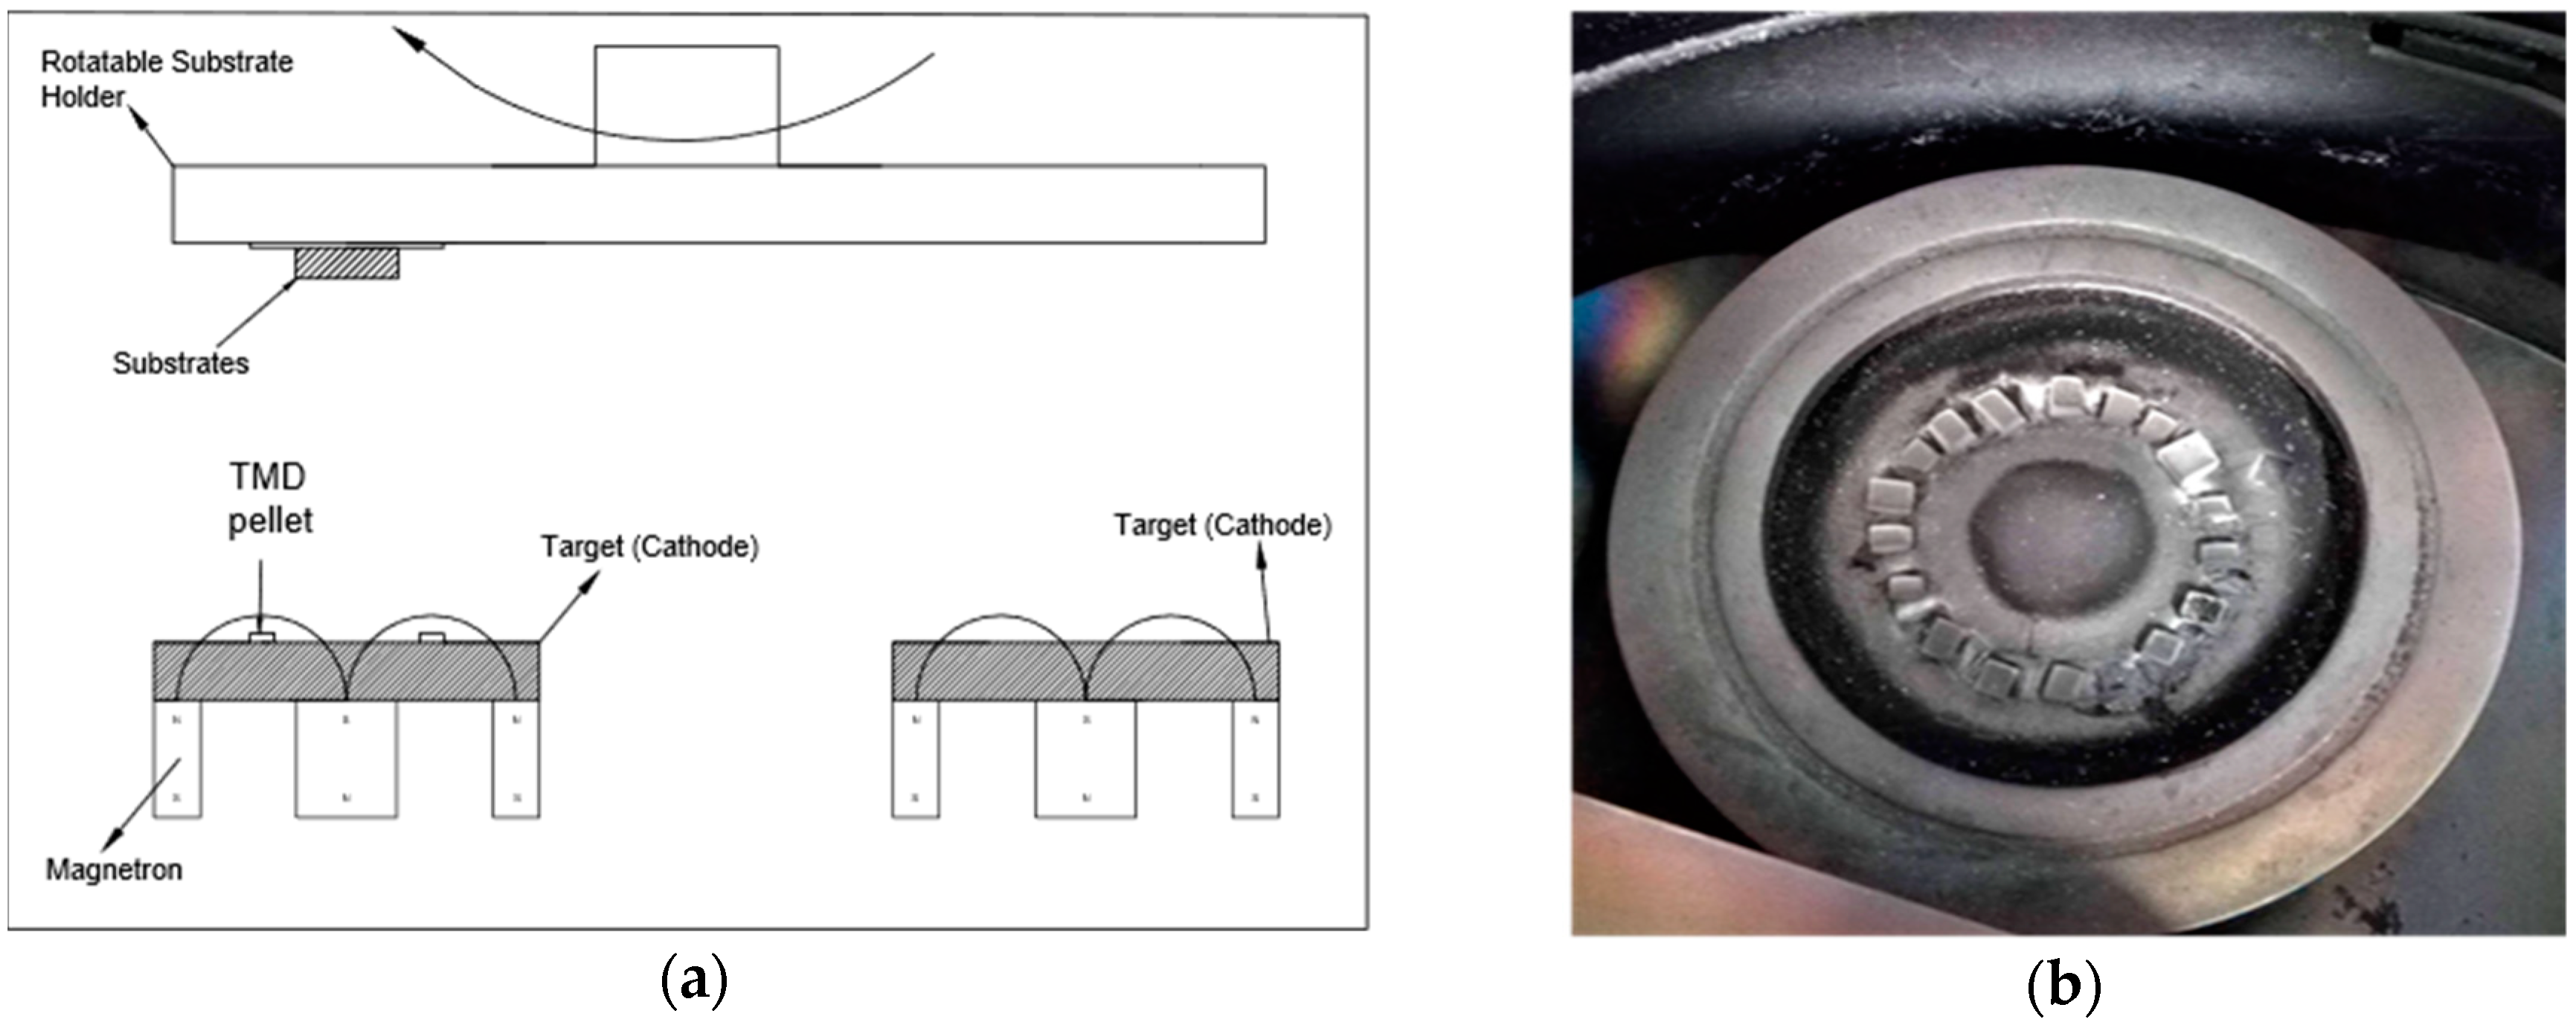
Three mechanisms are generally cited for understanding the compositional variations obtained during magnetron sputtering of TMDs:
Different scattering behaviors of sputtered atoms during their travel towards the substrate [
18];
Preferential re-sputtering of the sulfur atoms from the growing film as a result of energetic particle bombardment [
16];
Reaction of the sputtered species with the process gas and subsequent pump-out [
14].
A significant S deficiency can be observed for the D3 and D4 families of coatings. The low S/W ratio observed for these coatings is, very likely, due to both the difference in scattering behavior as well as bombardment with backscattered Ar neutrals. The sputtered species, C, S, and W in this case, will have different scattering behaviors during their travel towards the substrates. The lighter elements, C and S, will be deflected to a greater extent as a result of collision with the Ar gas present in the chamber. The W atoms, which are much heavier, will have straight traversing paths towards the substrates. In this context, it is expected that the D2 coatings will be richer in the lighter elements, as the probability of arrival of the species that scatter more will be higher when the substrate holder is rotating. On one hand, this was observed for S, as the S/W ratio was higher for the D2 coatings compared to the D3 coatings. On the other hand, the C content was lower, indicating that the mechanism of preferential re-sputtering should also be considered. The energy of the backscattered Ar neutrals is proportional to the target voltage. The target voltage for the D2 coatings was higher (~800 V) compared to the D3 ones (~500 V), indicating that the energy of the backscattered Ar neutrals will be higher in the D2 case. Although the energy of the backscattered Ar neutrals is higher for the D2 coatings, these coatings still had a higher S/W ratio. Considering the lower S/W ratio and higher carbon content of the D3 coatings, it is very likely that these coatings are subjected to a higher flux of backscattered Ar neutrals with high energy. One of the parameters that should also be considered in this case is the substrate location. As the target-to-substrate distance is constantly changing for the D2 case, when the substrates are further away from the target there will be arrival of the lighter sputtered species that scatter more in the chamber (C and S), while the energetic argon neutrals will have significantly lower energy due to an increased number of collisions. In this context, it is expected that D2 coatings will have higher S contents. The increased carbon content for the D3 coatings is very likely because of the lower sputtering yield of carbon.
The lower S/W ratio for the D4 coatings (deposited in reactive mode) may be further caused by reaction of the sputtered S atoms with the H present in the chamber, and formation of H2S gas and subsequent pump-out. The bombardment with backscattered Ar neutrals will also be amplified as the introduction of the reactive gas causes target poisoning, evident from the observed increase in the target voltage. The target voltage values varied between 1100 and 1200 V, with an increase with increased partial pressure of methane. This increase in target voltage will result in the generation of backscattered Ar neutrals with much higher energy.
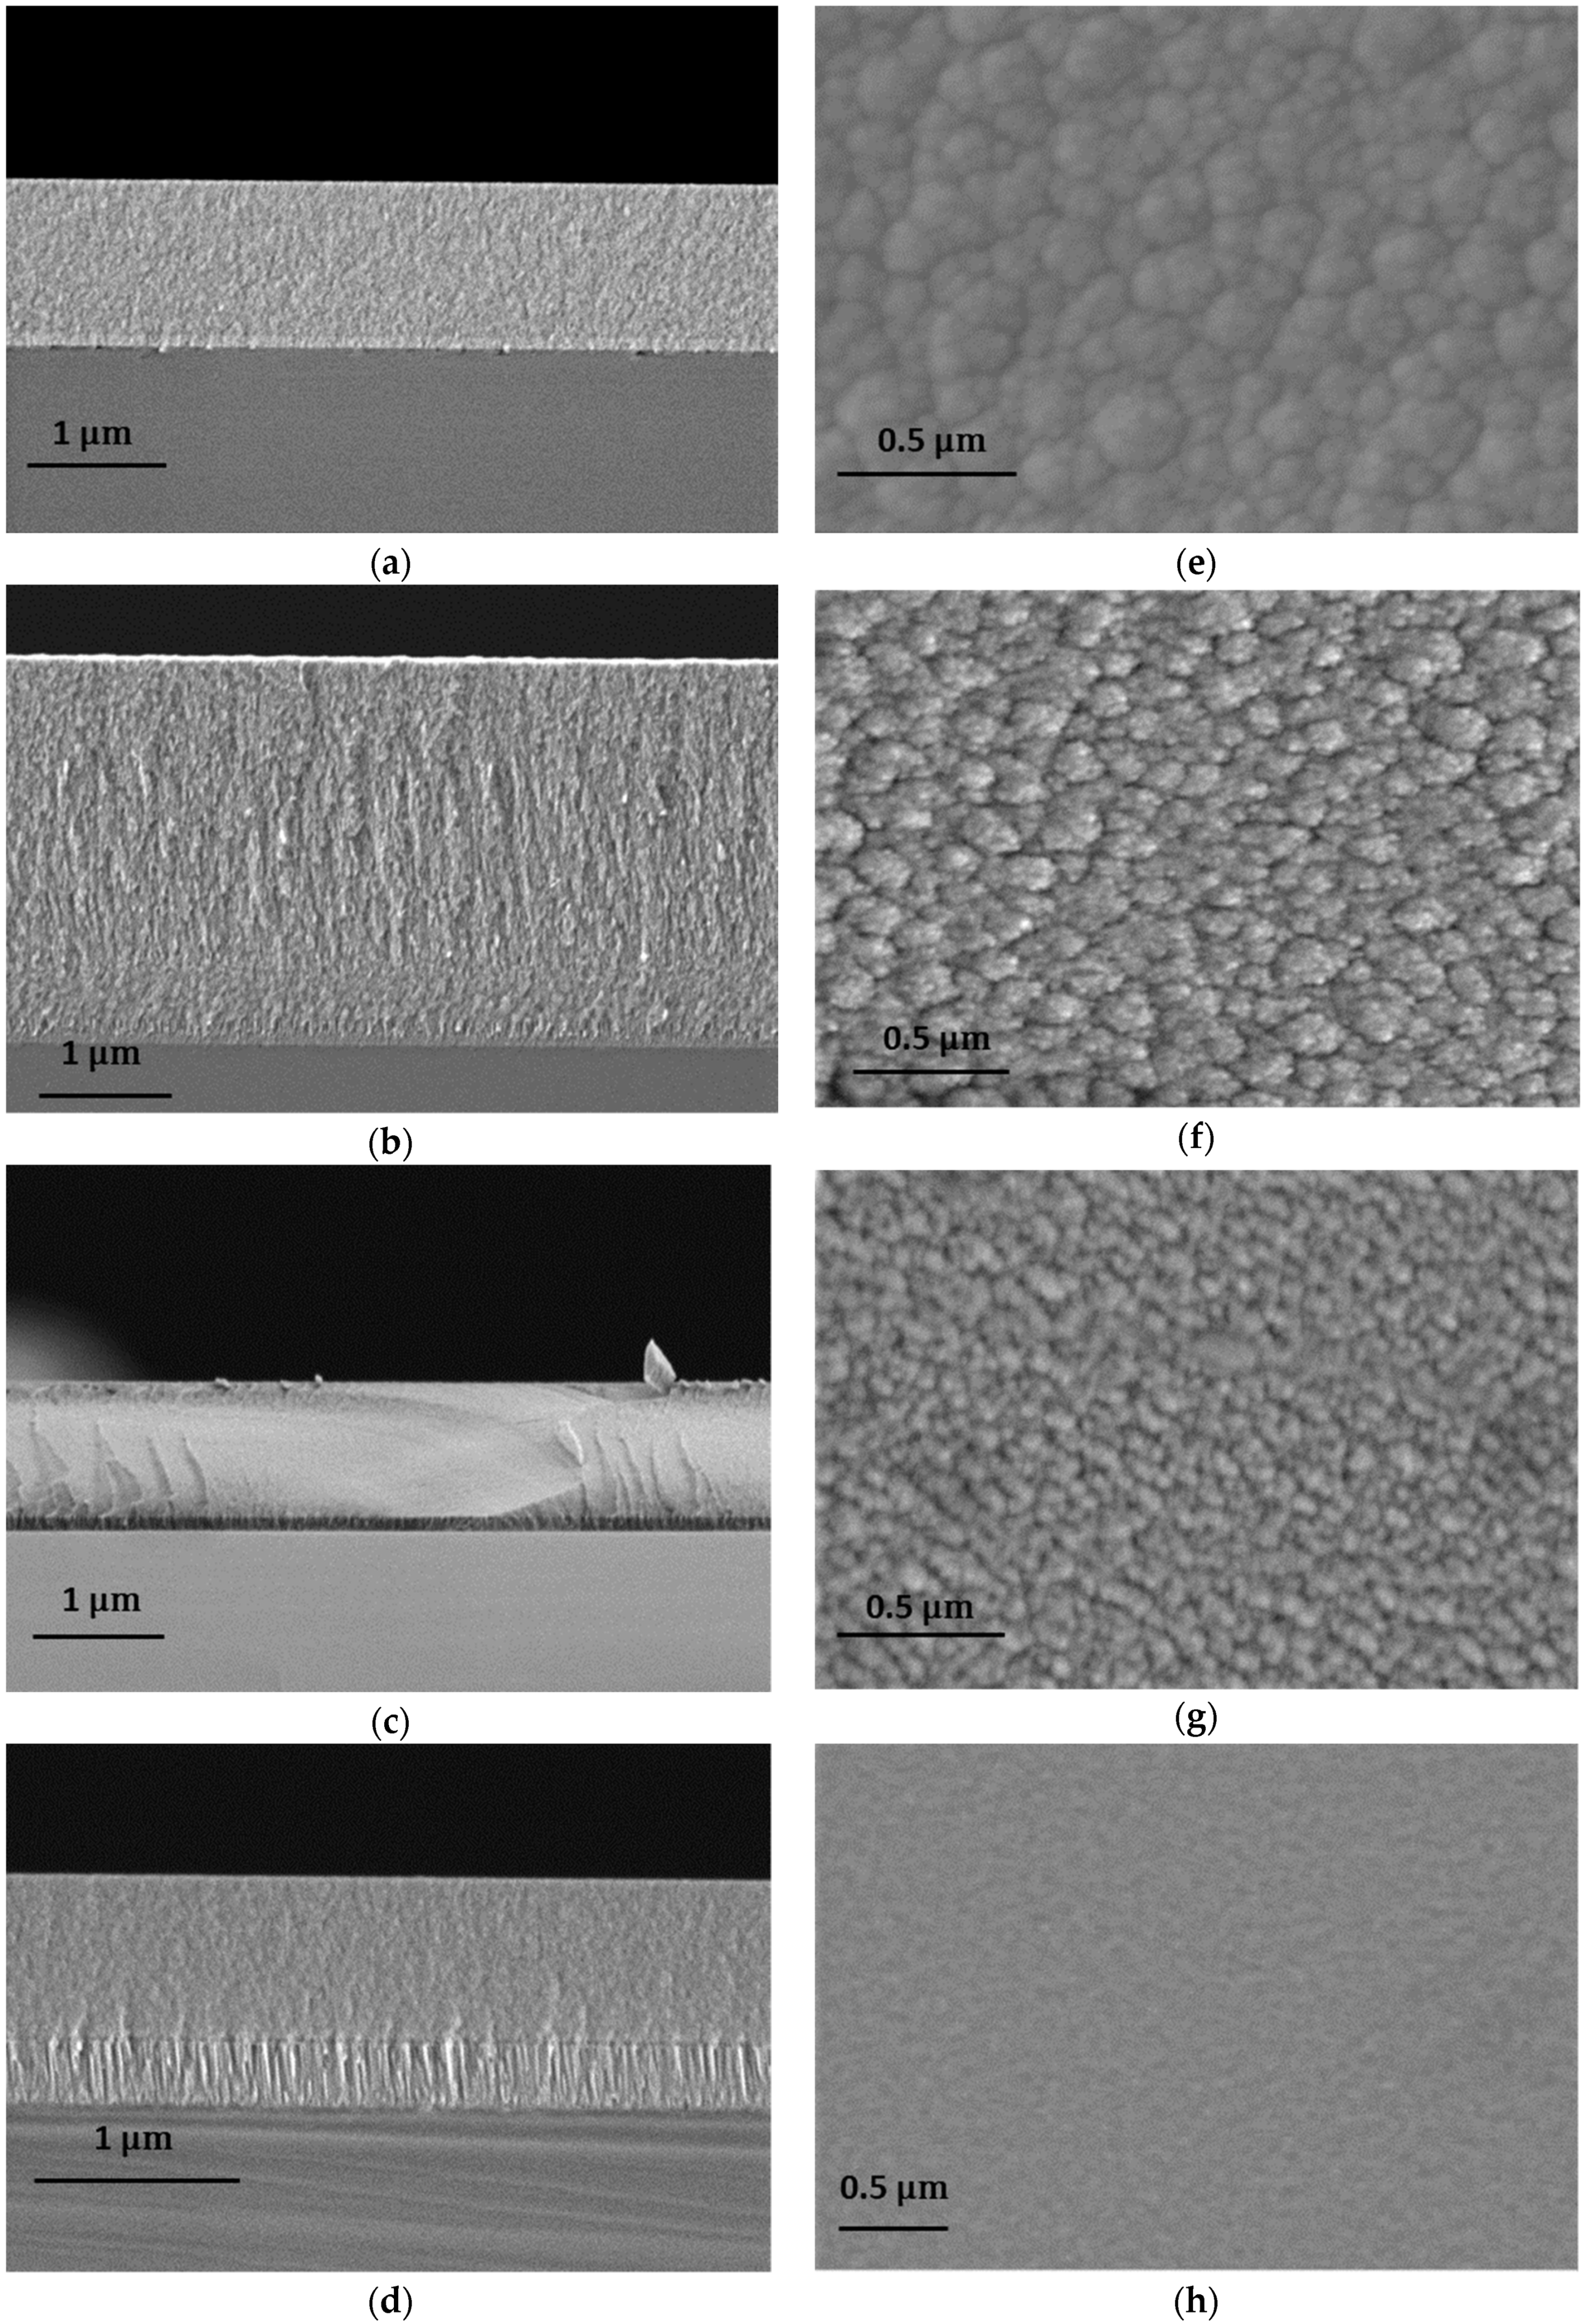
Cross-sectional and top-view SEM micrographs for selected thin films are shown in
Figure 2. The films generally have a compact morphology. Some porosity and signs of columnar growth can be observed for the D2-17 coating, which has a rather low amount of C (26 at.%). All the other cross-sectional micrographs present compact and featureless morphologies. Top-view micrographs show cauliflower-like structures. This morphology is typical for films deposited by magnetron sputtering under the influence of the atomic shadowing effect. It should be mentioned that the cauliflower features were not clearly evident for the coating deposited in reactive mode (see
Figure 2h), and the micrographs revealed a smoother morphology. The smoothening is very likely due to the increased bombardment of the growing film with reflected Ar neutrals, since the energy (proportional to the target voltage) of the backscattered Ar neutrals was the highest in this case. Bombardment of the growing film with energetic species increases the adatom mobility and thus reduces the atomic shadowing effect [
19].
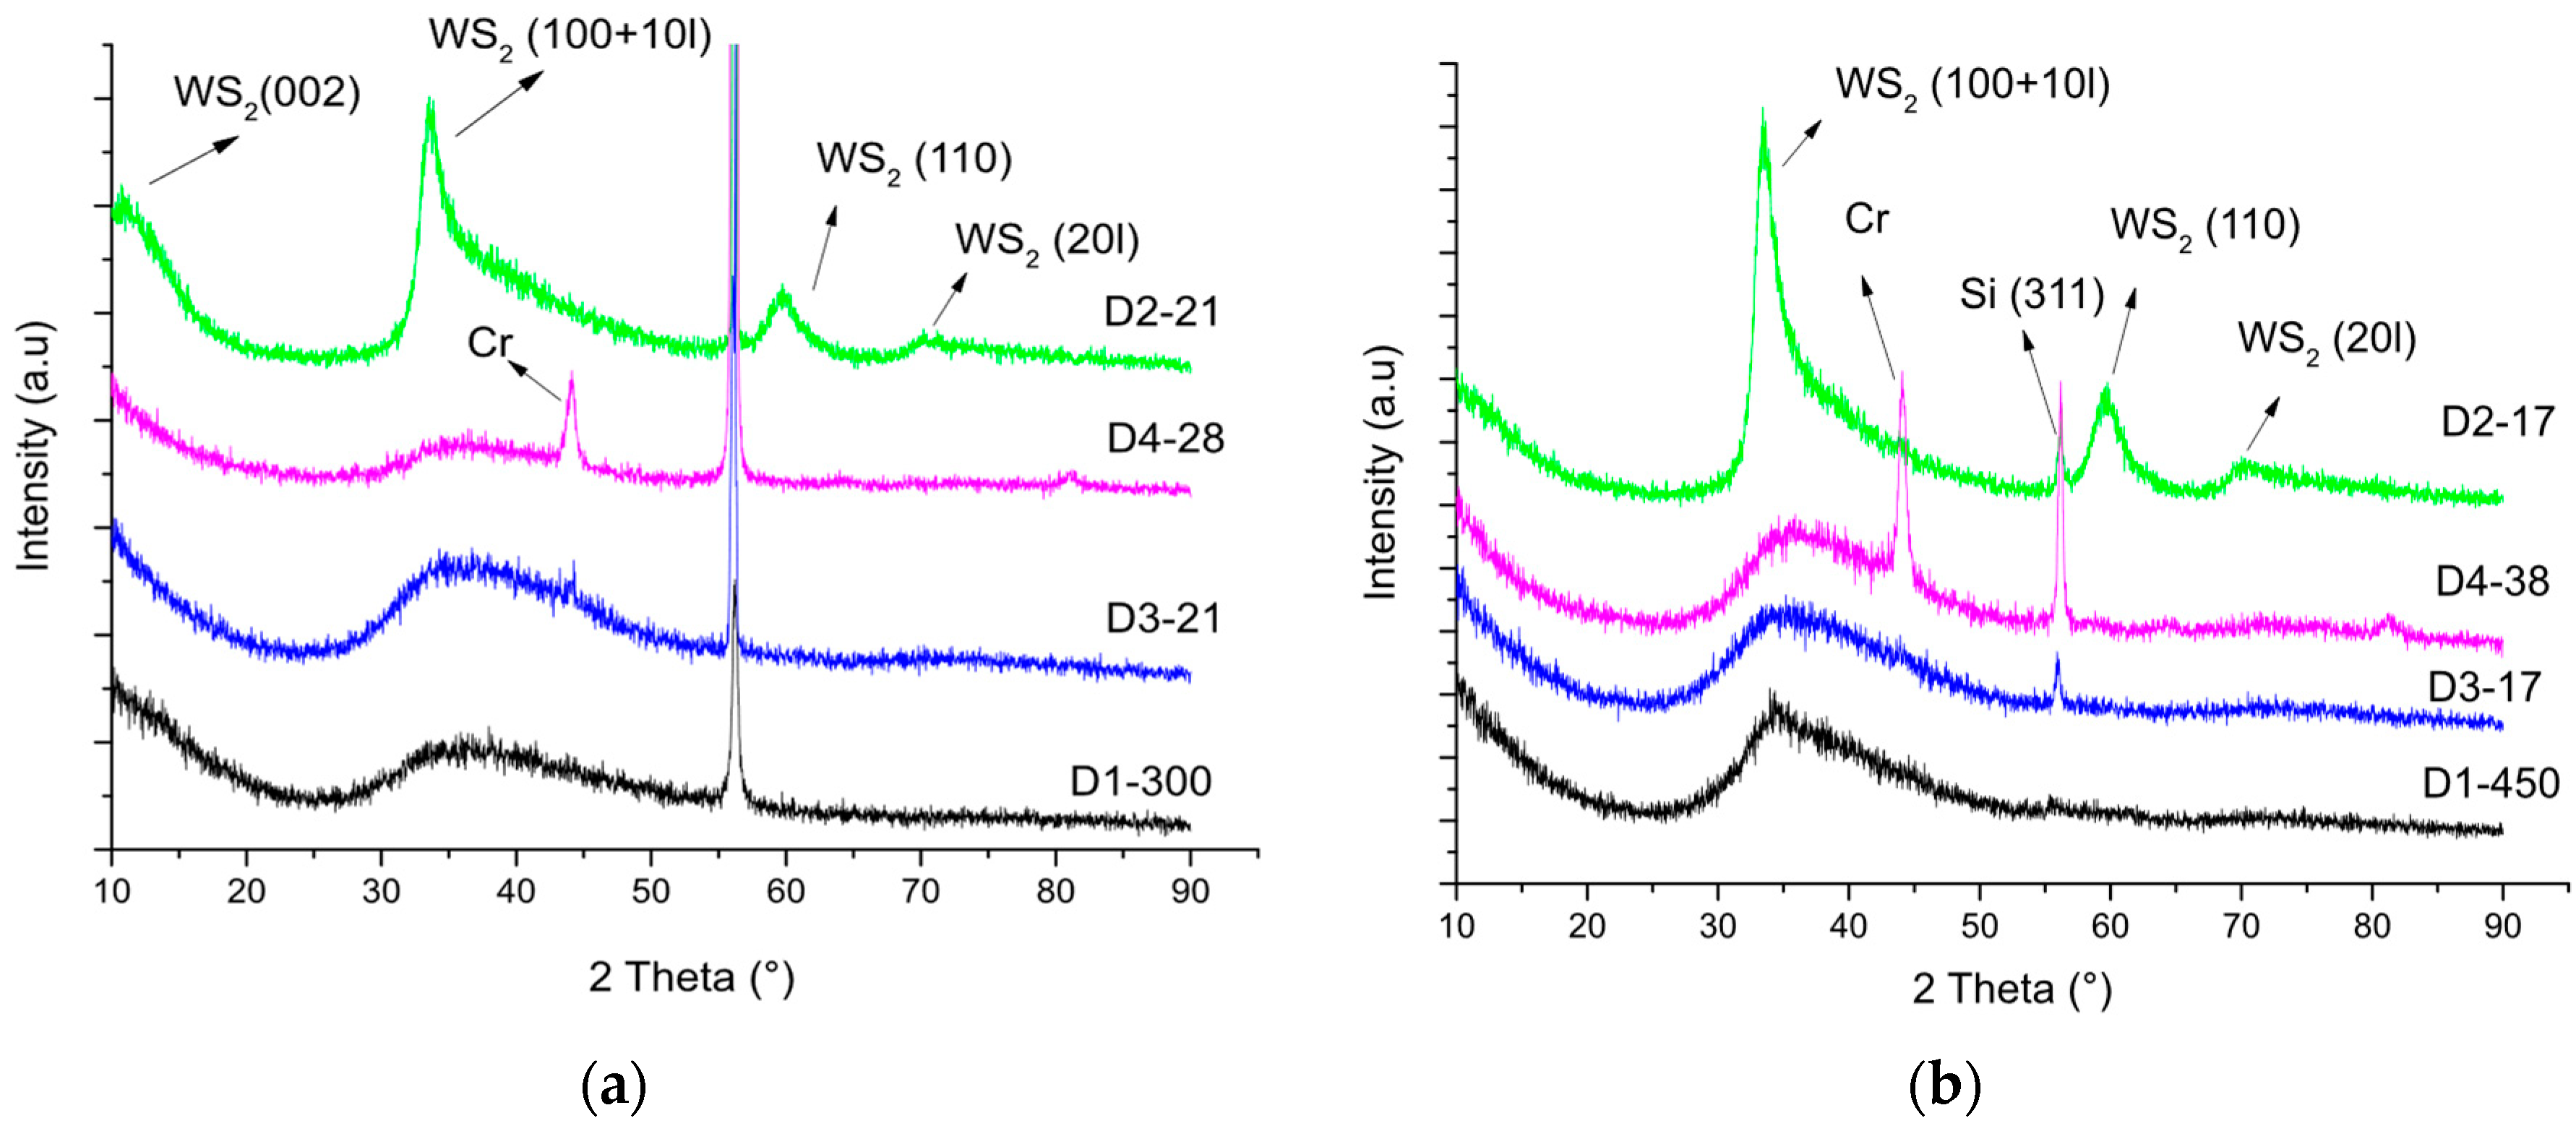
GIXRD results are shown in
Figure 3. Common for all patterns is the presence of a broad peak starting at 2θ~33°, which is associated with the (100) peak of WS
2 (ICDD card no. 00-008-0237), with a tail towards higher angles representing a turbostratic stacking of the (10l) family of WS
2 planes with l = 1.2.3 [
20]. Only the D2 films with low carbon contents have a sharper (100) peak and an additional (110) peak at 2θ = 59°. A small contribution of the (20l) family of planes with l = 0, 1, 2, 3 at 2θ~70° was also detected for these coatings. The small (002) reflection from the WS
2 phase (representing the basal planes parallel to the substrate) at 2θ~14° can only be seen on the pattern obtained for the D2-21 film. The Cr peak observed in the D3 and D4 films stems from the interlayer. The presence of tungsten carbides is difficult to detect from the XRD patterns as there are several W
2C- and WC
1−x- related peaks in the region of 2θ = 34.5–39° (ICDD card numbers: 00-035-0776, 00-020-1316) overlapping with the (10l) family of planes for WS
2. Some of the peaks often observed for magnetron-sputtered WC/a-C films are W
2C (100) at 2θ = 34.5°, W
2C (002) at 2θ = 38°, and WC
1−x at 2θ = 37° (see ref. [
21,
22]), with the authors of these previous studies reporting a broad peak in the range of 2θ = 34.5–39°.
3.2. Chemical Bonding and Raman Spectroscopy
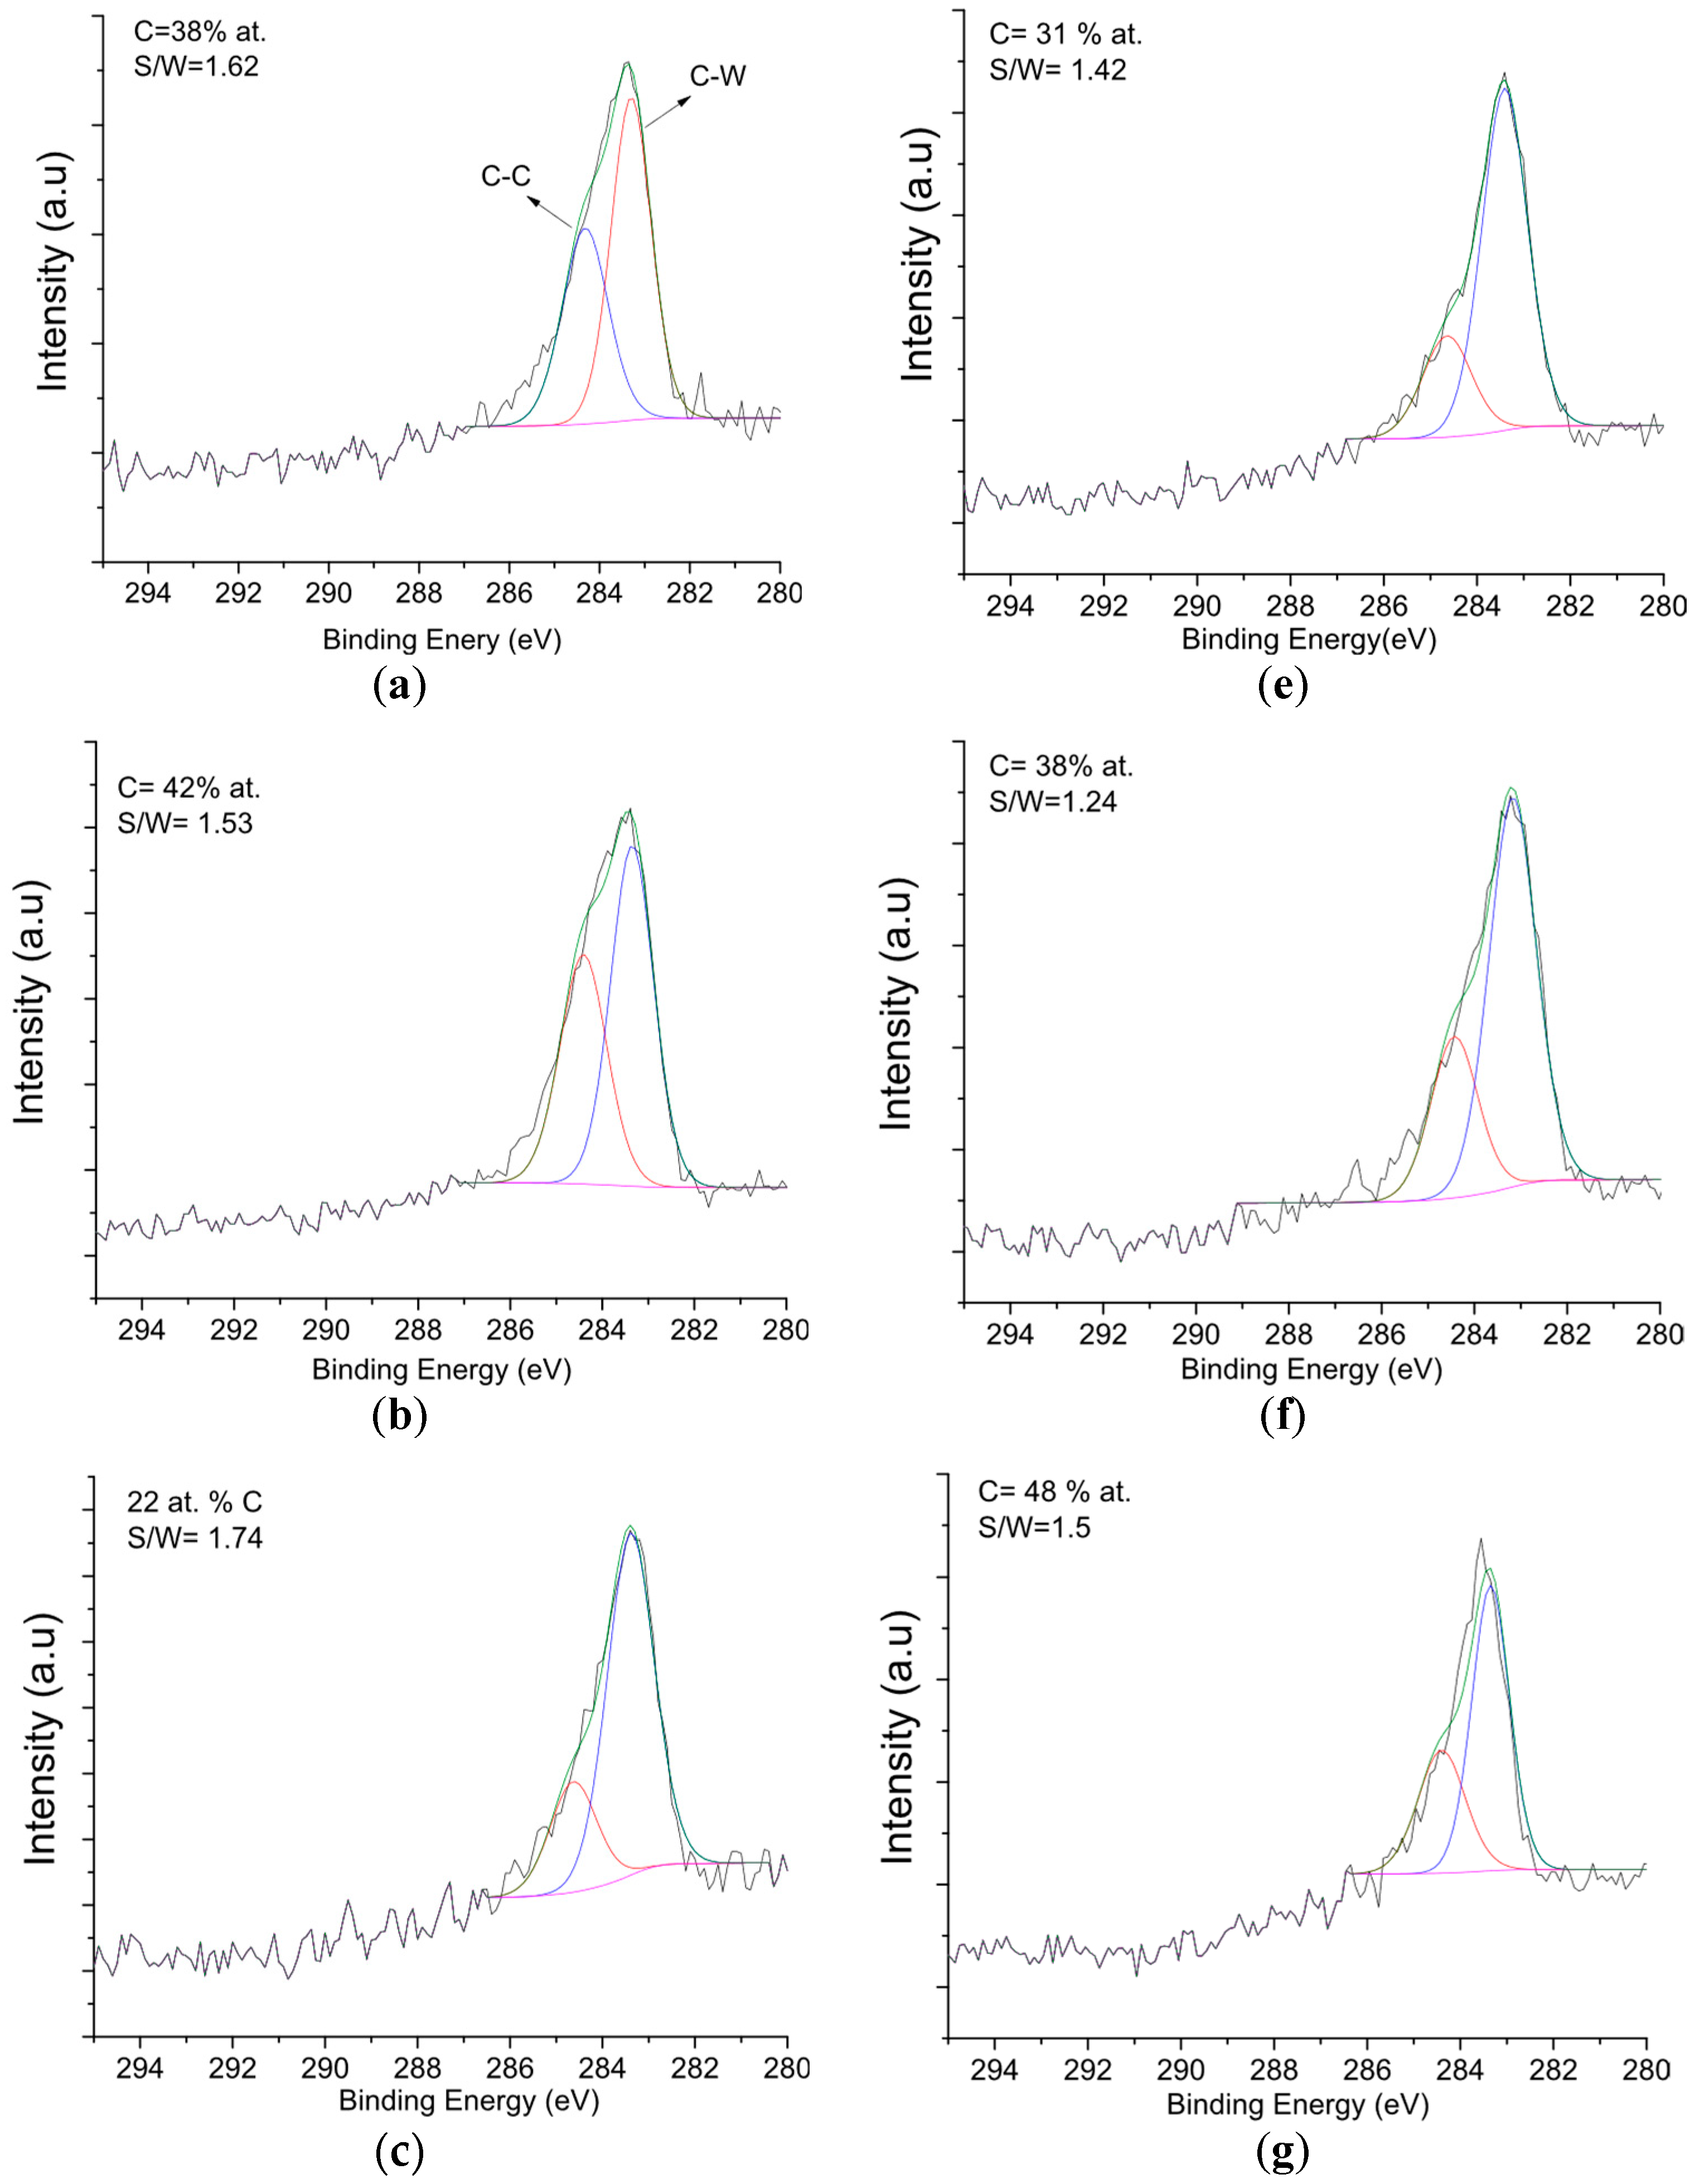
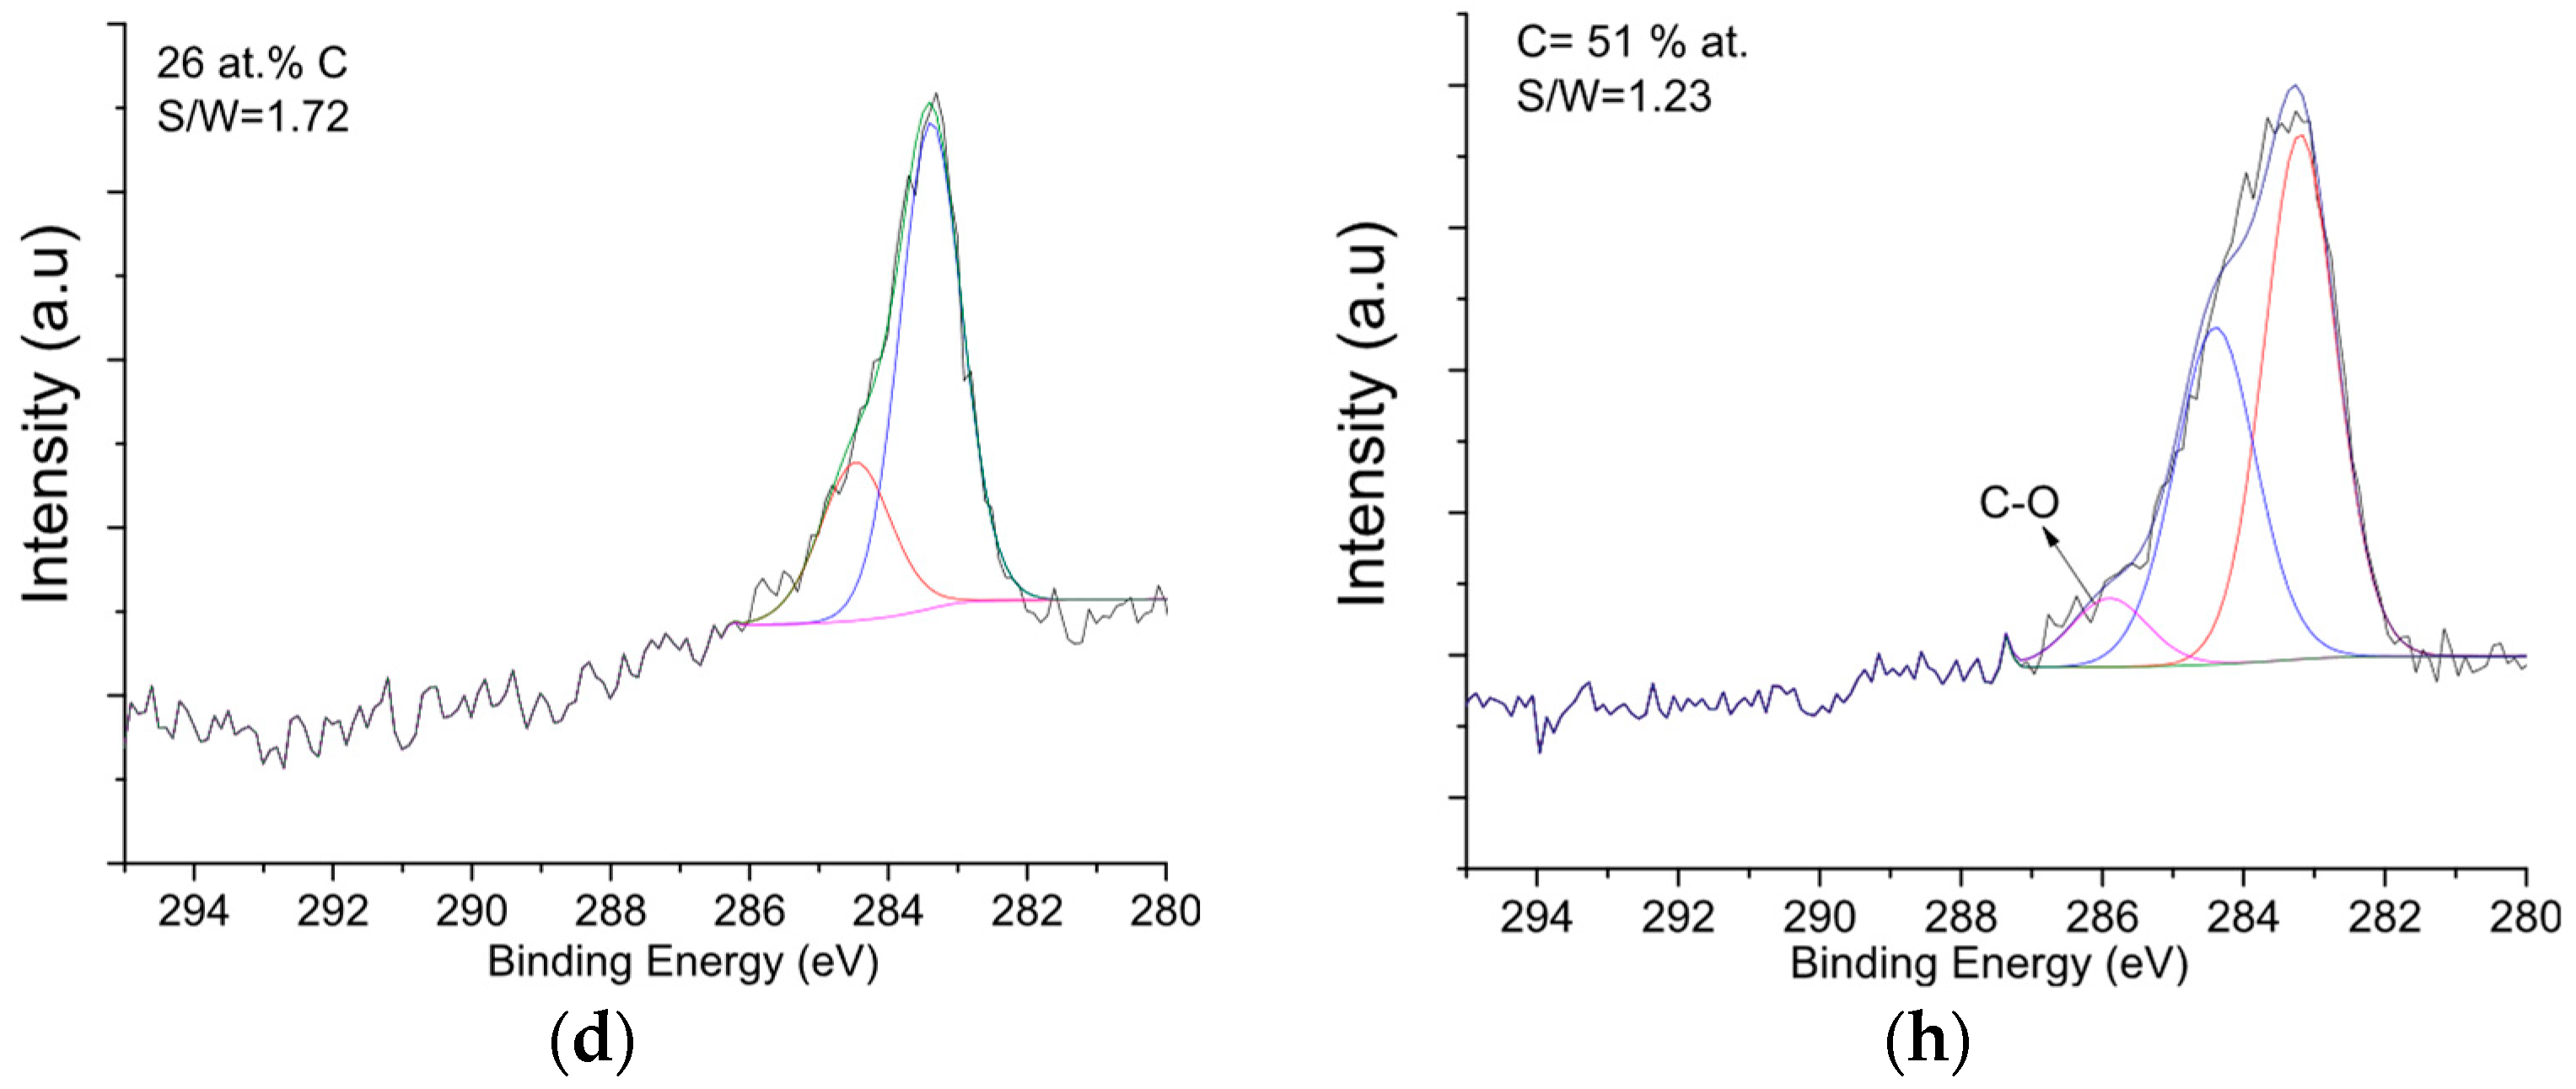
To reach a better understanding of the chemical bonding in the coatings, XPS and Raman spectroscopy (Horiba XploRA, Longjumeau, France) were performed on selected coatings from every deposition route. The spectra from the carbon region of interest, after sputter cleaning of the samples, are shown in
Figure 4. Spectra before etching (not shown) generally consisted of a main carbon peak at a binding energy (BE) of 284.5 eV, which was identified as a C-C bond originating from the presence of adventitious carbon. The presence of adventitious carbon was confirmed by the presence of C-O bonds at a BE of 286 eV and C=O bonds at 288 eV. A small contribution from C-W bonding was also observed at the typical location of ~283–283.3 eV [
23]. Fitting of the spectra obtained after etching (see
Figure 4) was performed using two peaks, except for the spectrum obtained for the D4-48 coating, for which an additional peak was added at a higher binding energy to complete the fitting, which was identified as C-O bonding. Fitting was constrained by setting the maximum values of the full width at half maximum (FWHM) to 1.2 eV, with the location of the C-C bonding originating from the a-C phase being positioned at a BE location higher than 284.4 eV, and with the C-W bonding set to a BE location lower than 283.3 eV [
21,
22]. This fitting procedure resulted in a residual standard deviation of less than 1.5. Bonding of the C-W type was observed for all coatings. A major trend observed in the spectra is the dominance of the C-W bonding type for the coatings with low amounts of C (e.g., D2, D3-21). Increasing the C contents of the coatings results in larger areas for the peak related to C-C bonding (e.g., D1-450, D4-38), indicating the existence of increasing amounts of a-C. These trends were also observed for WC/C [
21] and TMD-C [
7] coatings in previous studies.
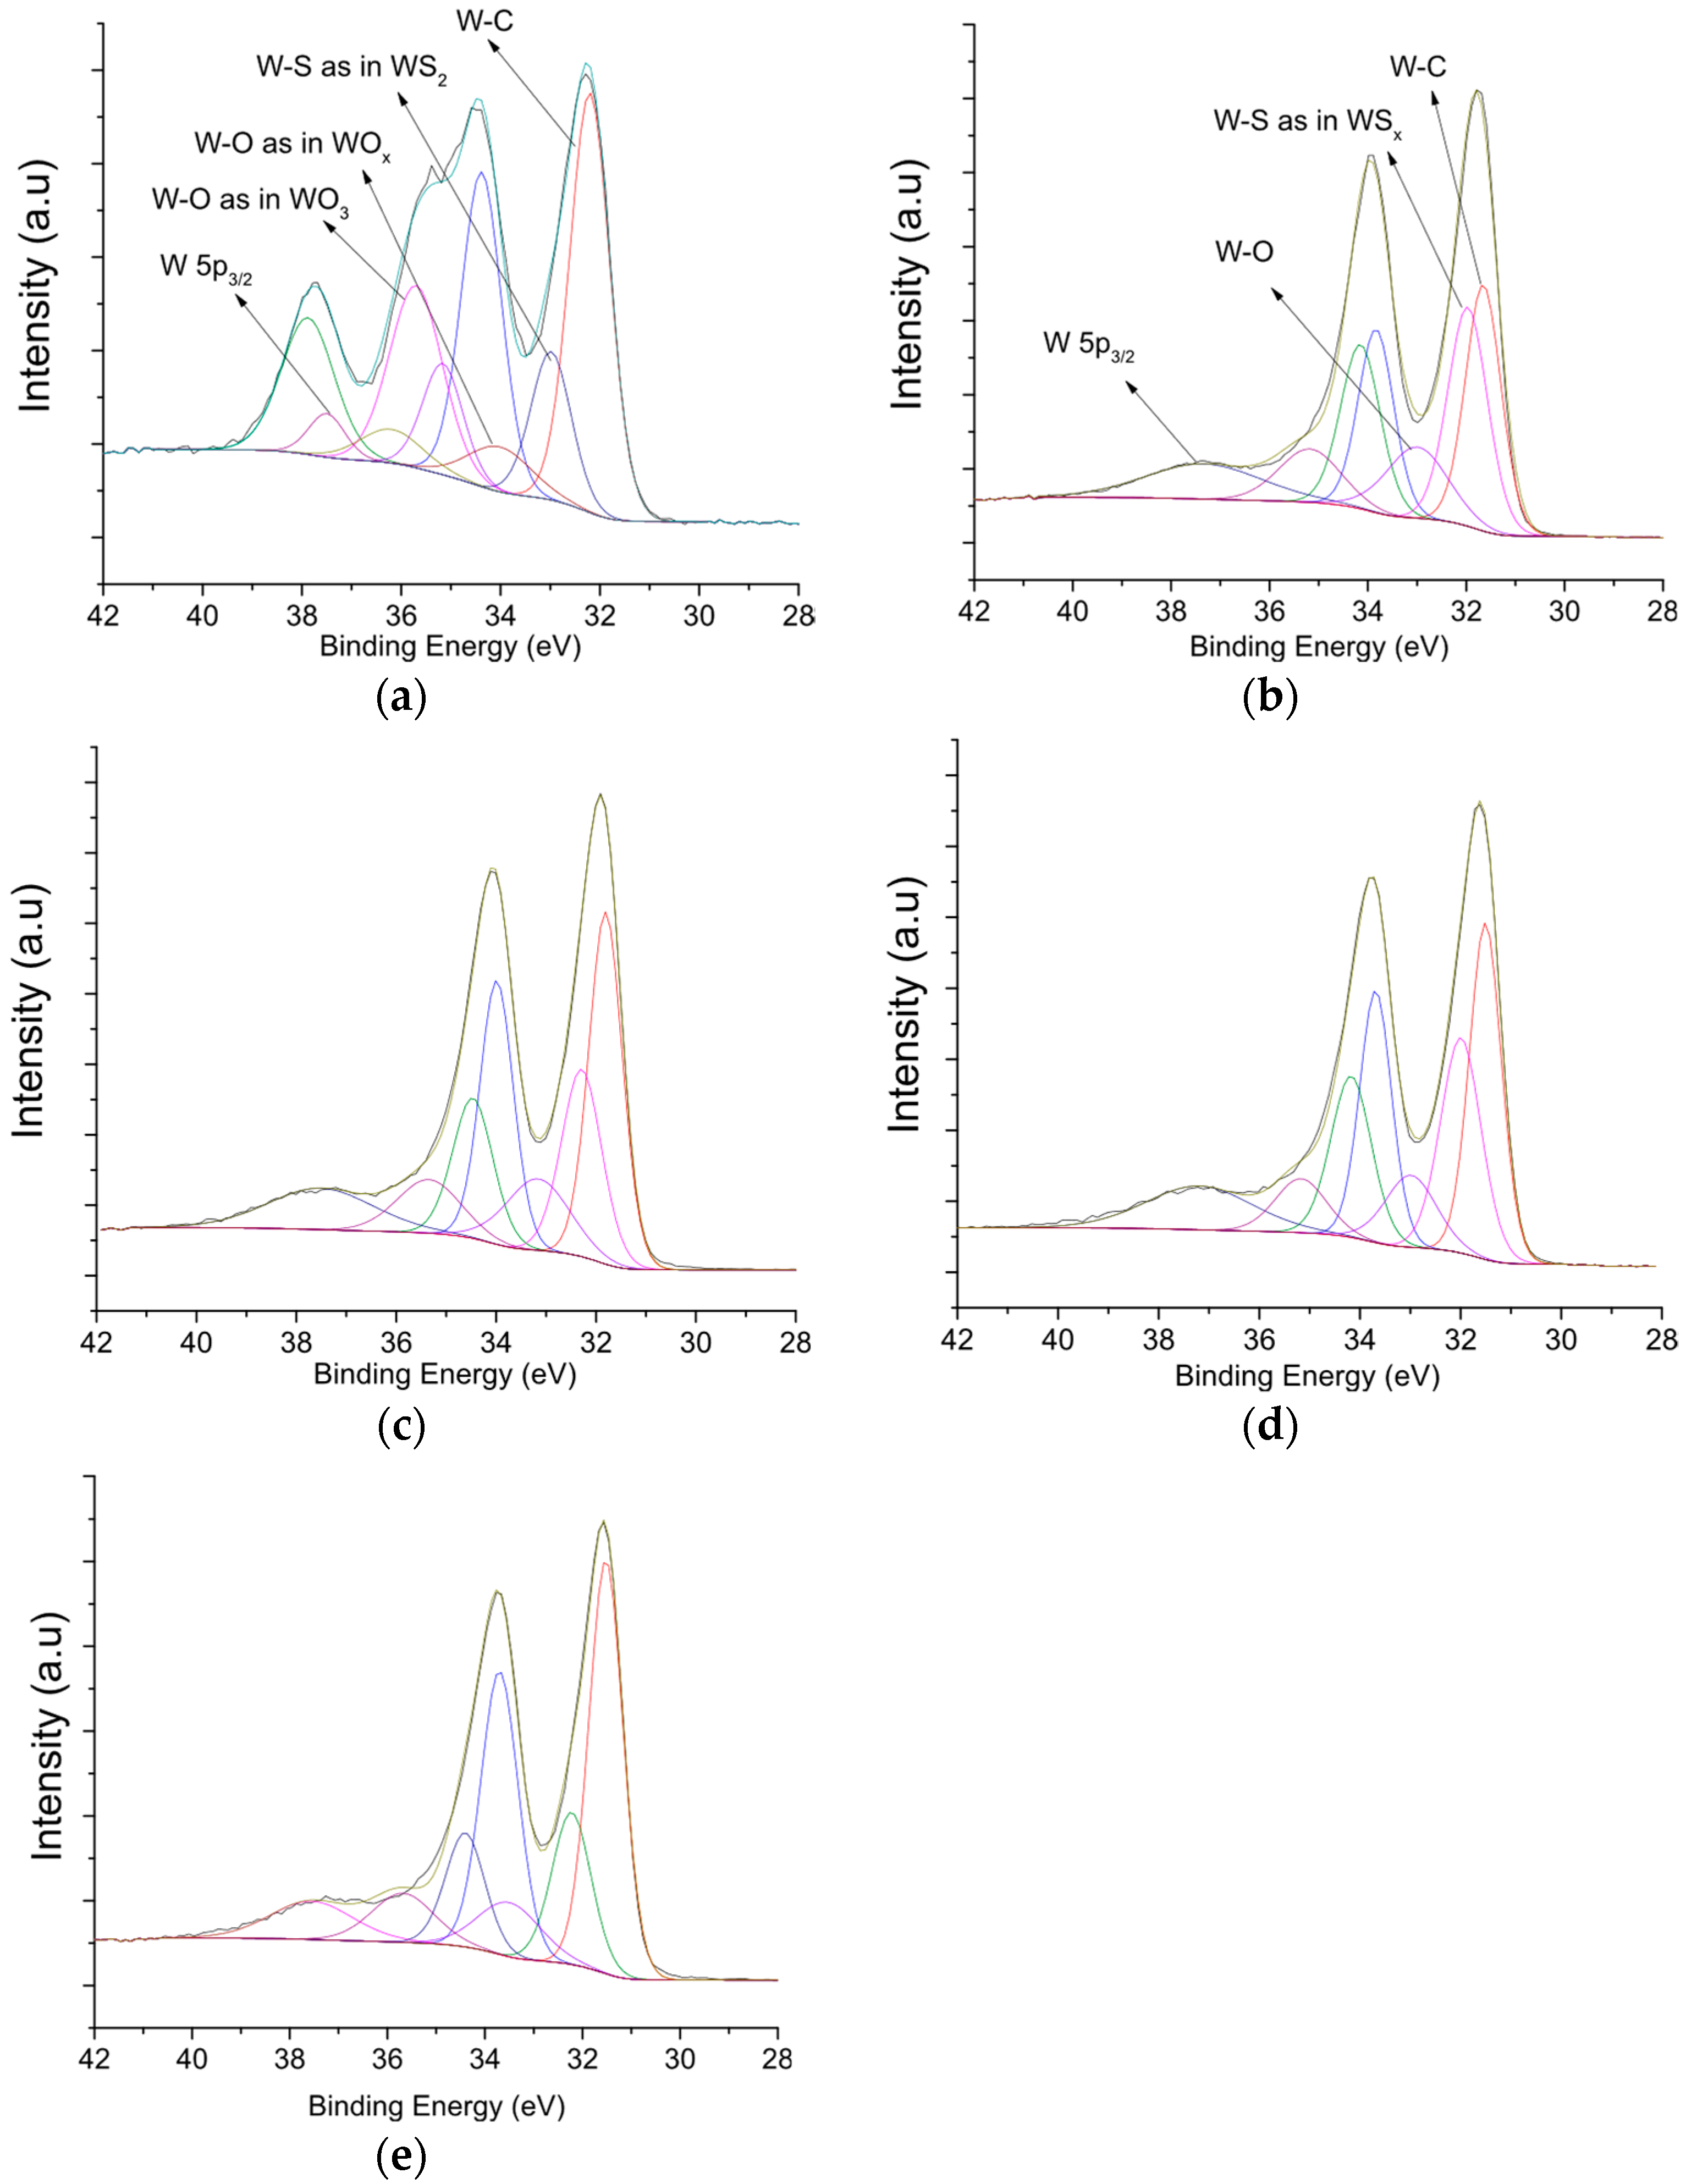
The spectra acquired from the W4f region of interest can be seen in
Figure 5. The spectra obtained before sputter cleaning were quite similar, and only one is shown as a reference (
Figure 5a). For the spectra obtained after sputter cleaning, a representative spectrum obtained from a coating deposited by each deposition route is shown in each case. Spectra acquired before sputter cleaning of the samples show strong features at higher binding energies, indicating the presence of tungsten oxides. The fitting was performed by setting the separation between the energy of the W4f
7/2-W4f
5/2 doublet to 2.18 eV, with the peak area ratios between W4f
7/2 and W4f
5/2 peaks set to 4:3 [
24]. A total of four doublets were used to fit the spectra acquired before sputter cleaning.
The location of the doublets is further indicated by the location of the W4f
7/2 peak. The location of the first doublet is at a BE of 32 ± 0.1 eV for all coatings, a location which is lower than the typical location of W-S bonding in WS
2 often reported at 32.6–32.8 eV [
25,
26]. Considering this location, this peak was identified as W-C bonding. The second peak located at a BE of 32.6 ± 0.1 eV originates from W-S bonds in WS
2. The peak located at 33.6 ± 0.2 eV is associated with W-O bonds in a sub-stoichiometric WO
x compound. The final doublet with the W4f
7/2 location at 35.6 ± 0.1 eV is in excellent agreement with the reference values for WO
3 [
23,
24,
26,
27], which also indicates that the charge correction method is appropriate. A single peak was also used at BE 37–38 eV, which represents the W5p
3/2 peak. Spectra obtained after sputter cleaning were fitted using three doublets. The main doublets are shifted towards lower binding energies compared to the spectra obtained before sputter cleaning. The location of the first doublet is at a BE of 31.7 ± 0.1 eV, which is in the typical range (31.5–32 eV) for W-C bonds presented in the literature [
17,
18,
22]; the identification of C-W bonds in the C1s spectra confirms the identification of the W-C bonding from the W4f spectrum obtained after sputter cleaning. The second doublet at a higher binding energy of 32.1 ± 0.1 eV was identified as W-S bonds in a sub-stoichiometric WS
x compound. A shift towards a lower binding energy of the W4f peak representing W-S bonding is expected, which is a result of preferential sputtering of the chalcogen atom (S in this case) during sputter cleaning of the samples [
28]. The third doublet added at a BE of 33-33.2 eV represents W-O bonding in WO
2. To finalize the fitting, a broad W5p
3/2 peak was added at a BE of 37–38 eV. The intensity of the third doublet might be exaggerated as the fitting of W-S bonding and W-C bonding is performed by asymmetric lineshapes, with asymmetry towards higher binding energy. As a result of the interaction between the core-hole and conduction electrons, XPS core level spectra of metals are often fitted with asymmetric lineshapes, with pronounced asymmetry towards higher binding energies (e.g., Doniach–Sunjic lineshape) [
23,
29,
30,
31]. In a recent XPS study on tungsten carbide nanopowders, Krasovskii et al. [
23] reached a good fit on W4f core-level spectra using asymmetric lineshapes representative of W-C bonds, with asymmetry towards higher binding energy. The high-resolution core-level W4f XPS spectra of WS
2 powder performed by Morgan [
25] were also fitted using asymmetric lineshapes representative of W-S bonding. The introduction of asymmetric lineshapes for fitting the spectra will significantly increase the complexity of the fitting procedure because of the additional fitting parameters; therefore, fitting was performed using symmetric Gaussian–Lorentzian lineshapes.
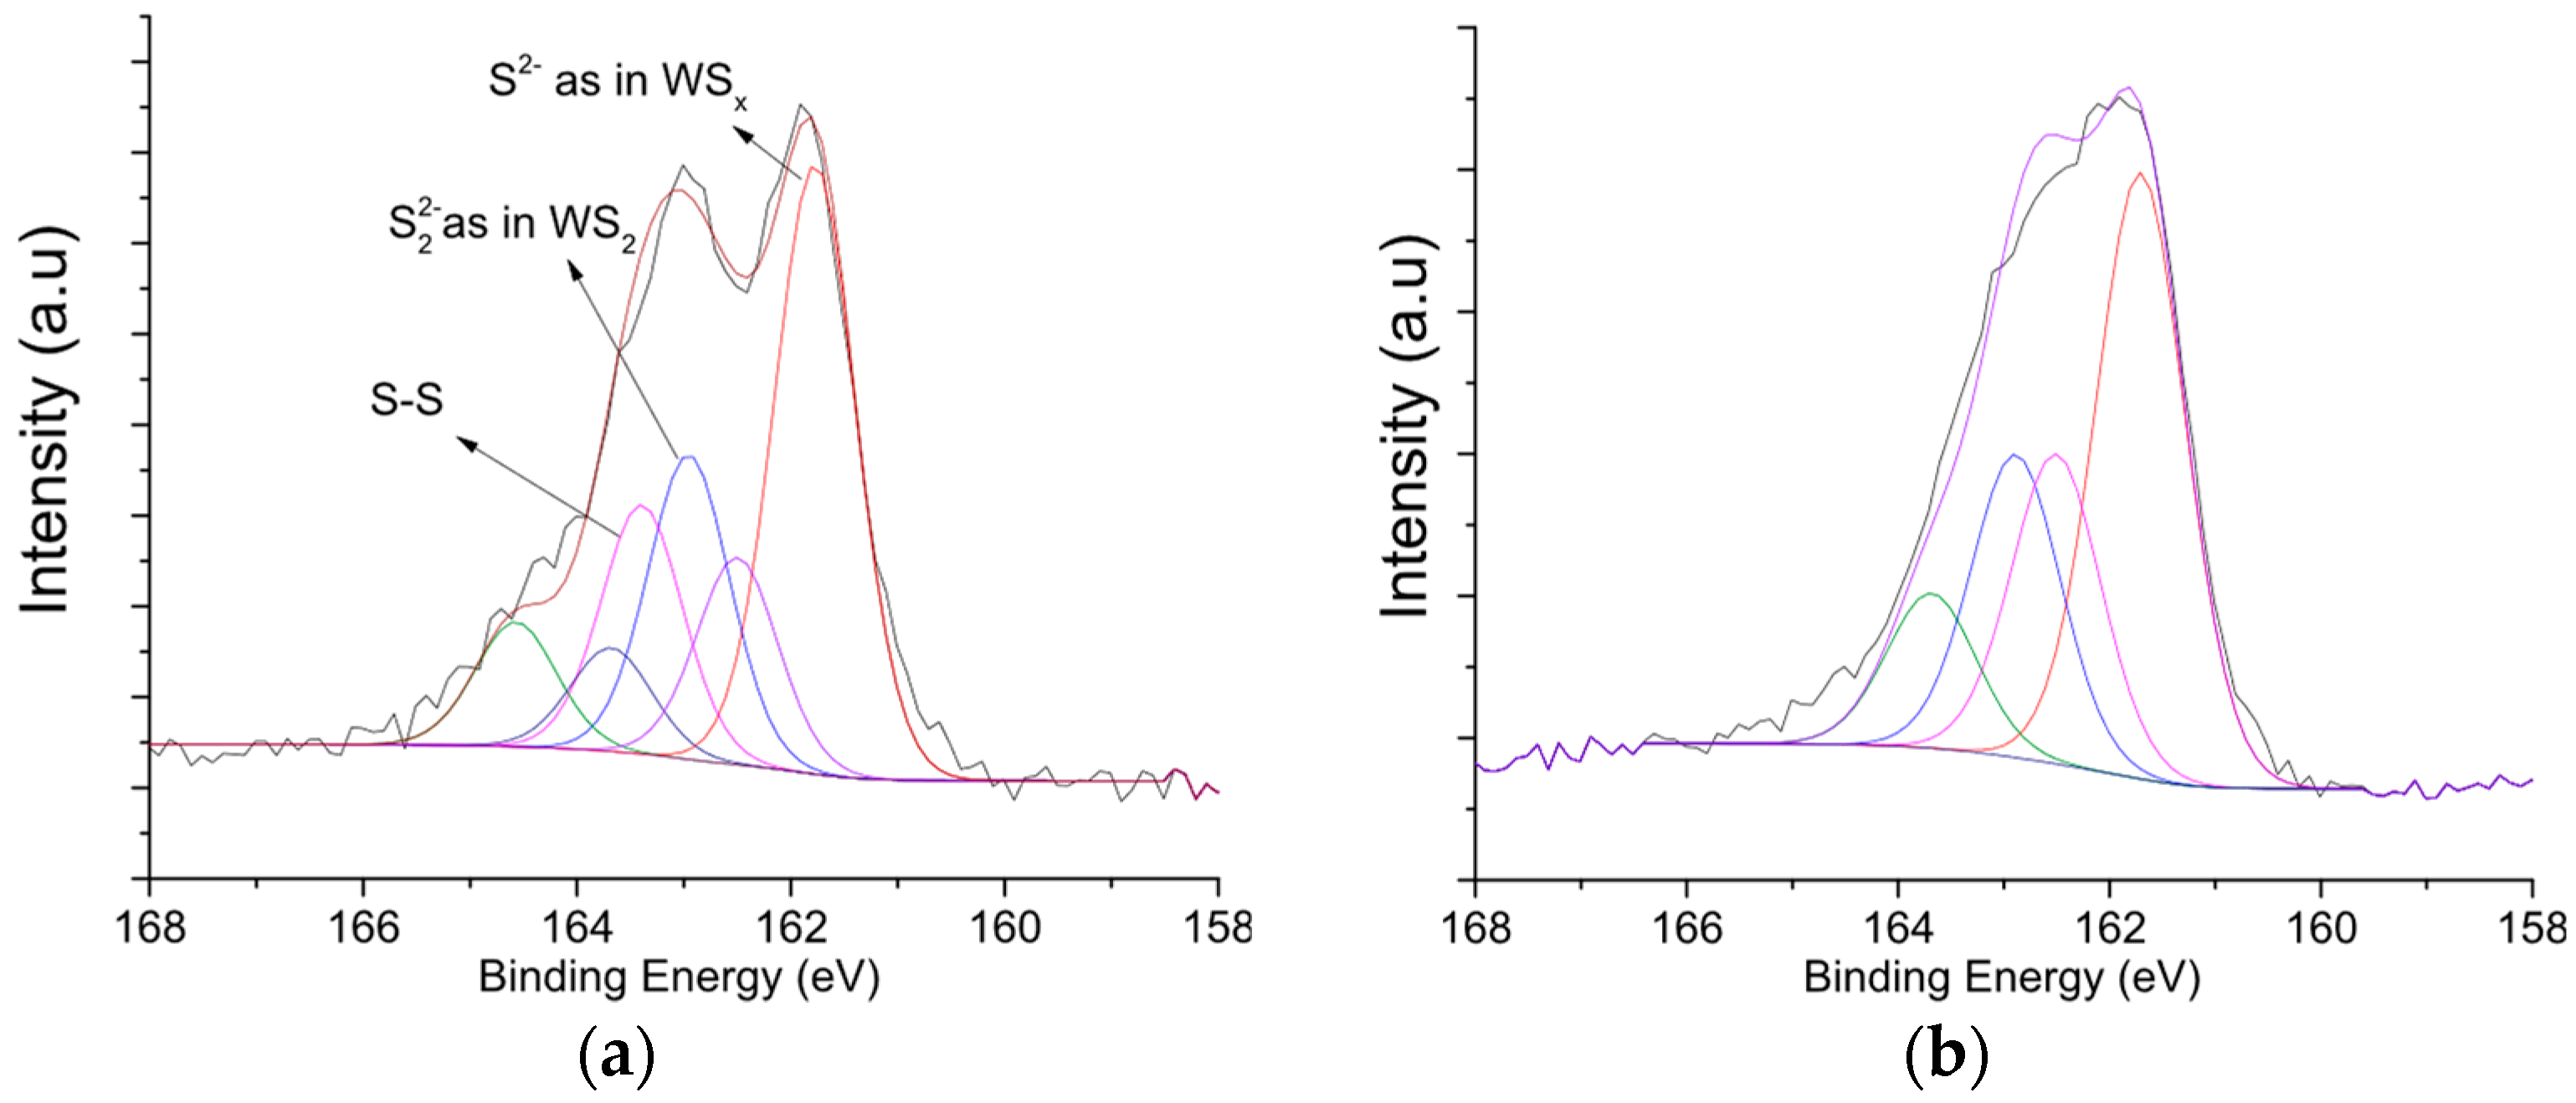
Representative spectra from the D3-17 coating, before and after etching, in the S2p region of interest are shown in
Figure 6. Fitting was done using 1.18 eV separation for the S2p
3/2- S2p
1/2 doublet, with their peak area ratios set to 2. Spectra acquired before etching were fitted with three doublets. The first doublet located at a lower binding energy with a BE location of 161.6 ± 0.1 eV was at the location typical for sulfide ions (S
2−) originating from a sub-stoichiometric WS
x compound [
26,
32]. A second smaller doublet was added at S2p
3/2 BE energy of 162.2–162.5 eV, at a location representing disulfide ions (S
22−) originating from WS
2 [
25,
26,
33]. To finalize the fitting, a doublet at a higher binding energy (163.4 ± 0.1 eV) was introduced, related to S-S bonding [
33,
34]. In an XPS study on WS
2 thin films, Zabinski et al. [
33] also observed intensities at higher binding energy in S2p spectra, which the authors correlated with elemental sulfur condensed on the surfaces after deposition. Sulfur with high vapor pressure can be still present in the chamber even after discharge is stopped, resulting in subsequent condensation on the substrates. S2p spectra acquired after etching were fitted in a similar manner to the spectra acquired before etching, the differences being the usage of only two doublets in some of the spectra (see
Figure 6b) and a reduction of the intensity in the higher binding energy portion of the spectra. Considering that the intensity at high binding energy is reduced, it is likely that there is condensation of residual sulfur present in the chamber after the discharge at the cathodes is stopped.
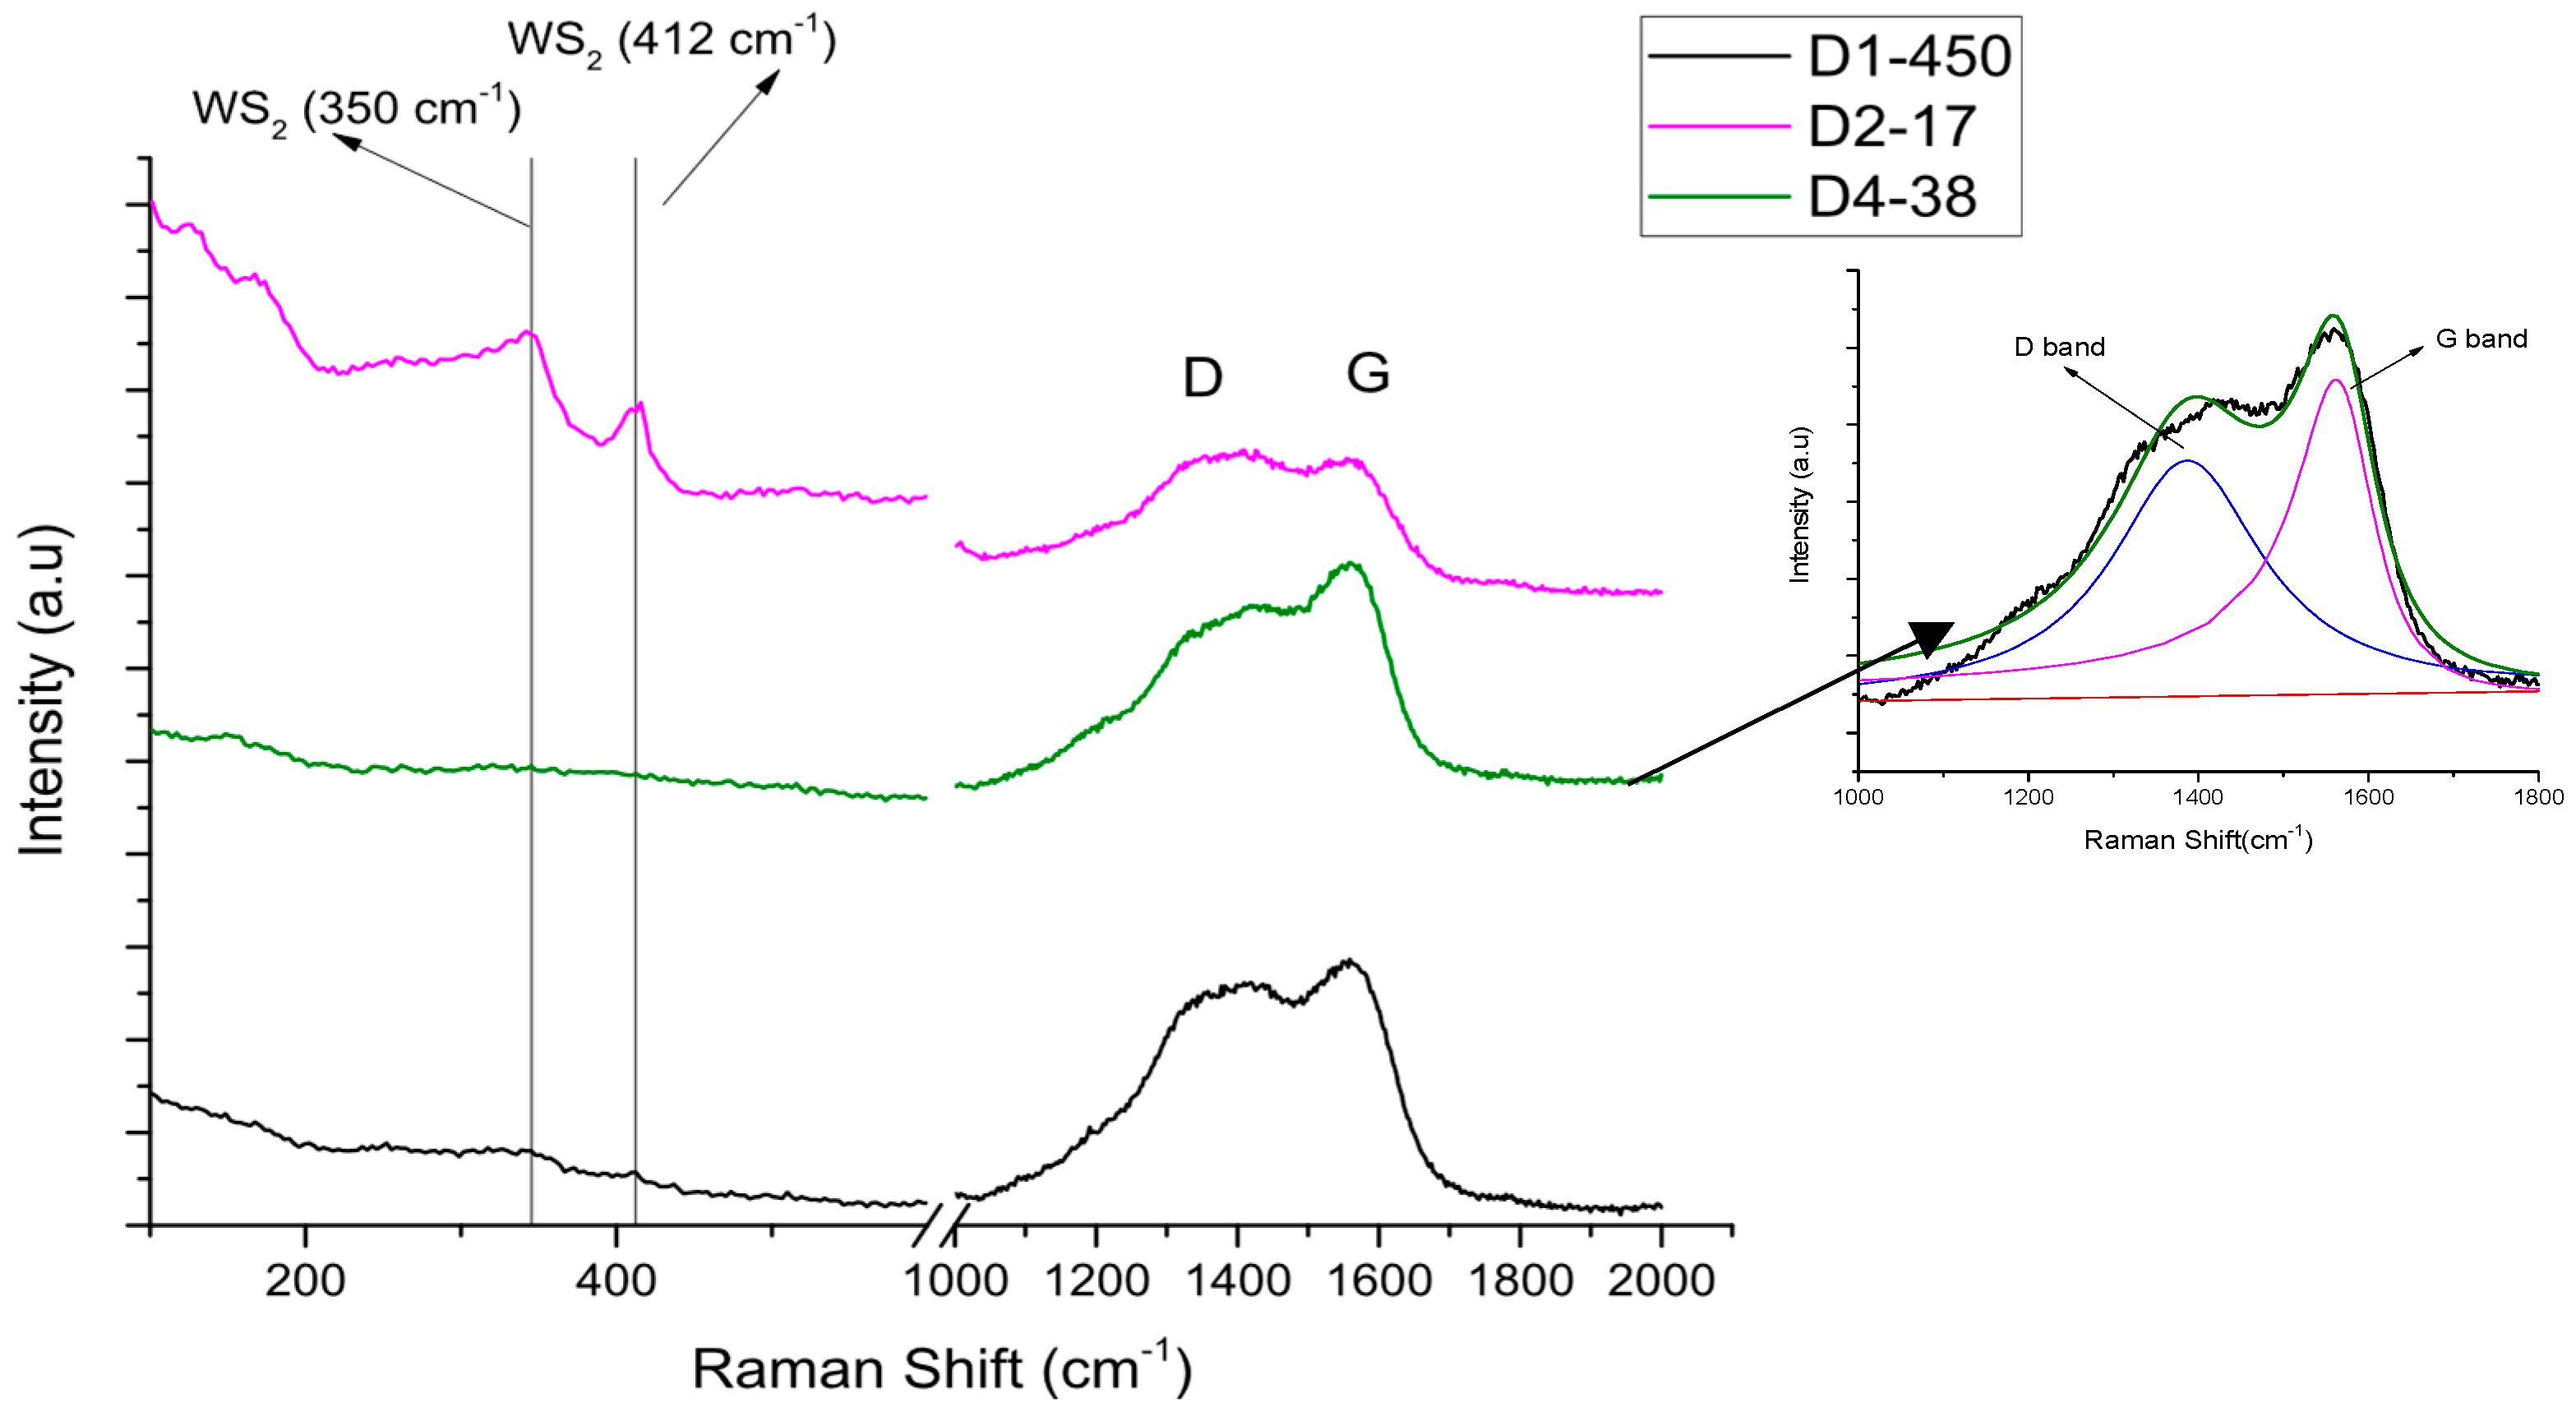
Raman spectra of selected coatings representing each route of deposition in the range 100–2000 cm
−1 are presented in
Figure 7. Magnetron-sputtered TMD-C films generally have two regions, with features representing different phases present in the film. The first region at Raman shift values of 300-450 cm represents the presence of the TMD phase. For WS
2, there are two distinct peaks. The peak at 350 cm
−1 is related to the in-plane phonon mode E
12g(Γ), while the peak at 412 cm
−1 represents the out-of-plane phonon mode A
1g(Γ) [
35]. Distinct peaks related to the WS
2 phase can be observed for the D2-17 coatings. These features are in agreement with the XRD results. The coatings with higher carbon contents (representative spectra are shown from the D1-450 and D4-38 coatings) showed more featureless spectra in the WS
2 region of interest, confirming the poor crystallinity of the WS
2 phase.
The second region between 1100 and 1800 cm
−1 contains the D and G bands of carbon. These peaks were fitted using a Breit–Wigner–Fano lineshape for the G peak and a Lorentzian lineshape for the D peak, as proposed by Ferrari et al. [
36]. The fitting resulted in the ratios of the intensity of the D and G peaks (I
D/I
G) having values in the range 0.8–1.1. The location of the G band was typically below 1580 cm
−1. Considering these values and according to the four-stage model proposed by Ferrari et al., the carbon phase is in the second stage where it is present as amorphous carbon with predominant sp
2 bonds and a minor presence of sp
3 bonds.
3.3. Mechanical Properties
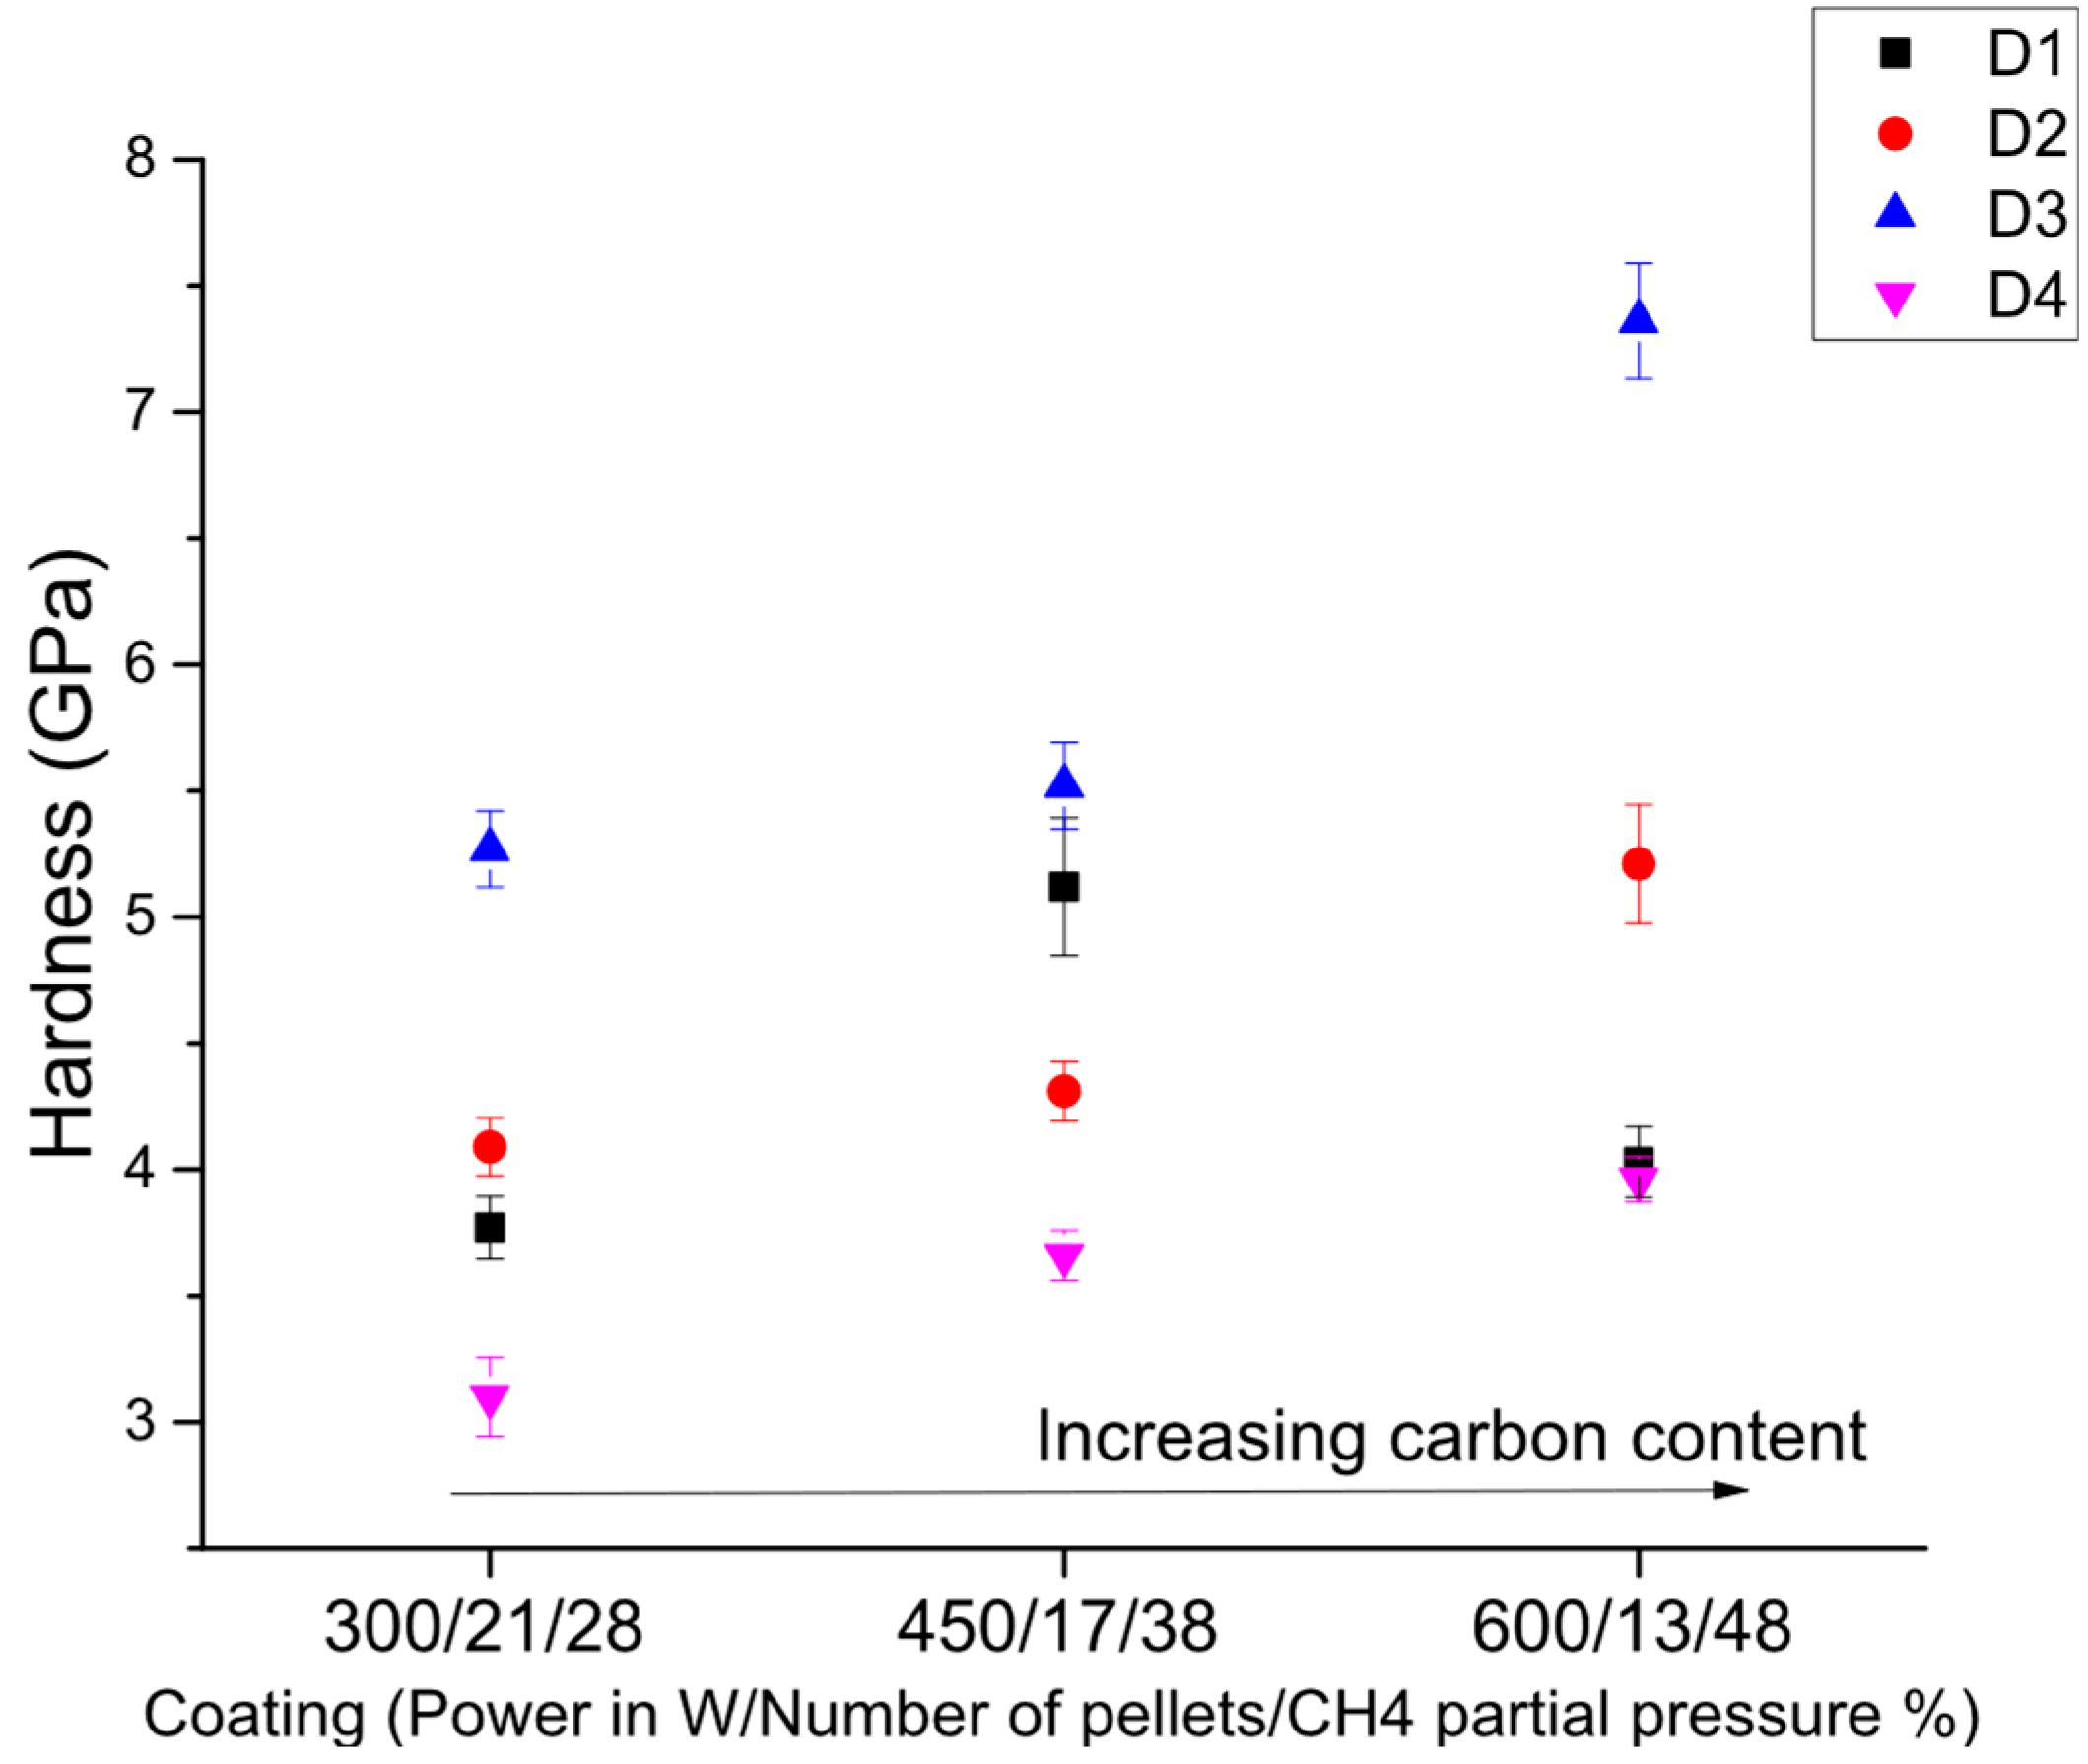
The hardness results from nanoindentation experiments are shown in
Figure 8. The horizontal axis shows the power to the carbon target, the number of pellets used for deposition, or the partial pressure of the CH
4 gas, depending on the deposition procedure.
The highest hardness was measured for the coatings deposited by sputtering a composite target in stationary mode (D3), followed by the films deposited by co-sputtering (D1), and sputtering a composite target in intermittent mode (D2). The coatings deposited in reactive mode generally showed lower hardness. The D3 coatings are harder compared to the D1 coatings, although they contain lesser amounts of carbon. The higher hardness is very likely because of the lower S/W ratio, which can be indicative of increased amounts of harder WC inclusions. The increased presence of WC is further supported by the higher peak area ratio between the C-W and C-C peaks in the C1s spectra for the D3 coatings as compared to the D1 ones (for example, compare
Figure 4e and
Figure 4a). Additionally, these coatings deposited with the stationary holder in front of the target are subjected to higher bombardment with reflected Ar neutrals. In this context, it is expected that these coatings are more compact and hence harder. The lower hardness observed for the reactively sputtered coatings can be related to the hydrogenation of the a-C phase, as hydrogenated carbon coatings are often softer compared to their hydrogen-free counterparts [
37]. The hardness values generally follow increasing trends in relation to C content, except for the co-sputtered coating (D1-600) with the highest C content (~48 at.%), which has a lower value compared to the coating with 42 at.% C (D1-450). The presence of higher C contents improves the compactness of the coatings, resulting in higher hardness. A pure carbon coating deposited using the same equipment has a hardness of ~8 GPa [
38]. The higher hardness of D1-450 compared to its counterpart (D1-600) with a higher C content can be associated with the lower S/W ratio observed for this coating. The lower S/W ratio can be related to an increased presence of harder WC inclusions.
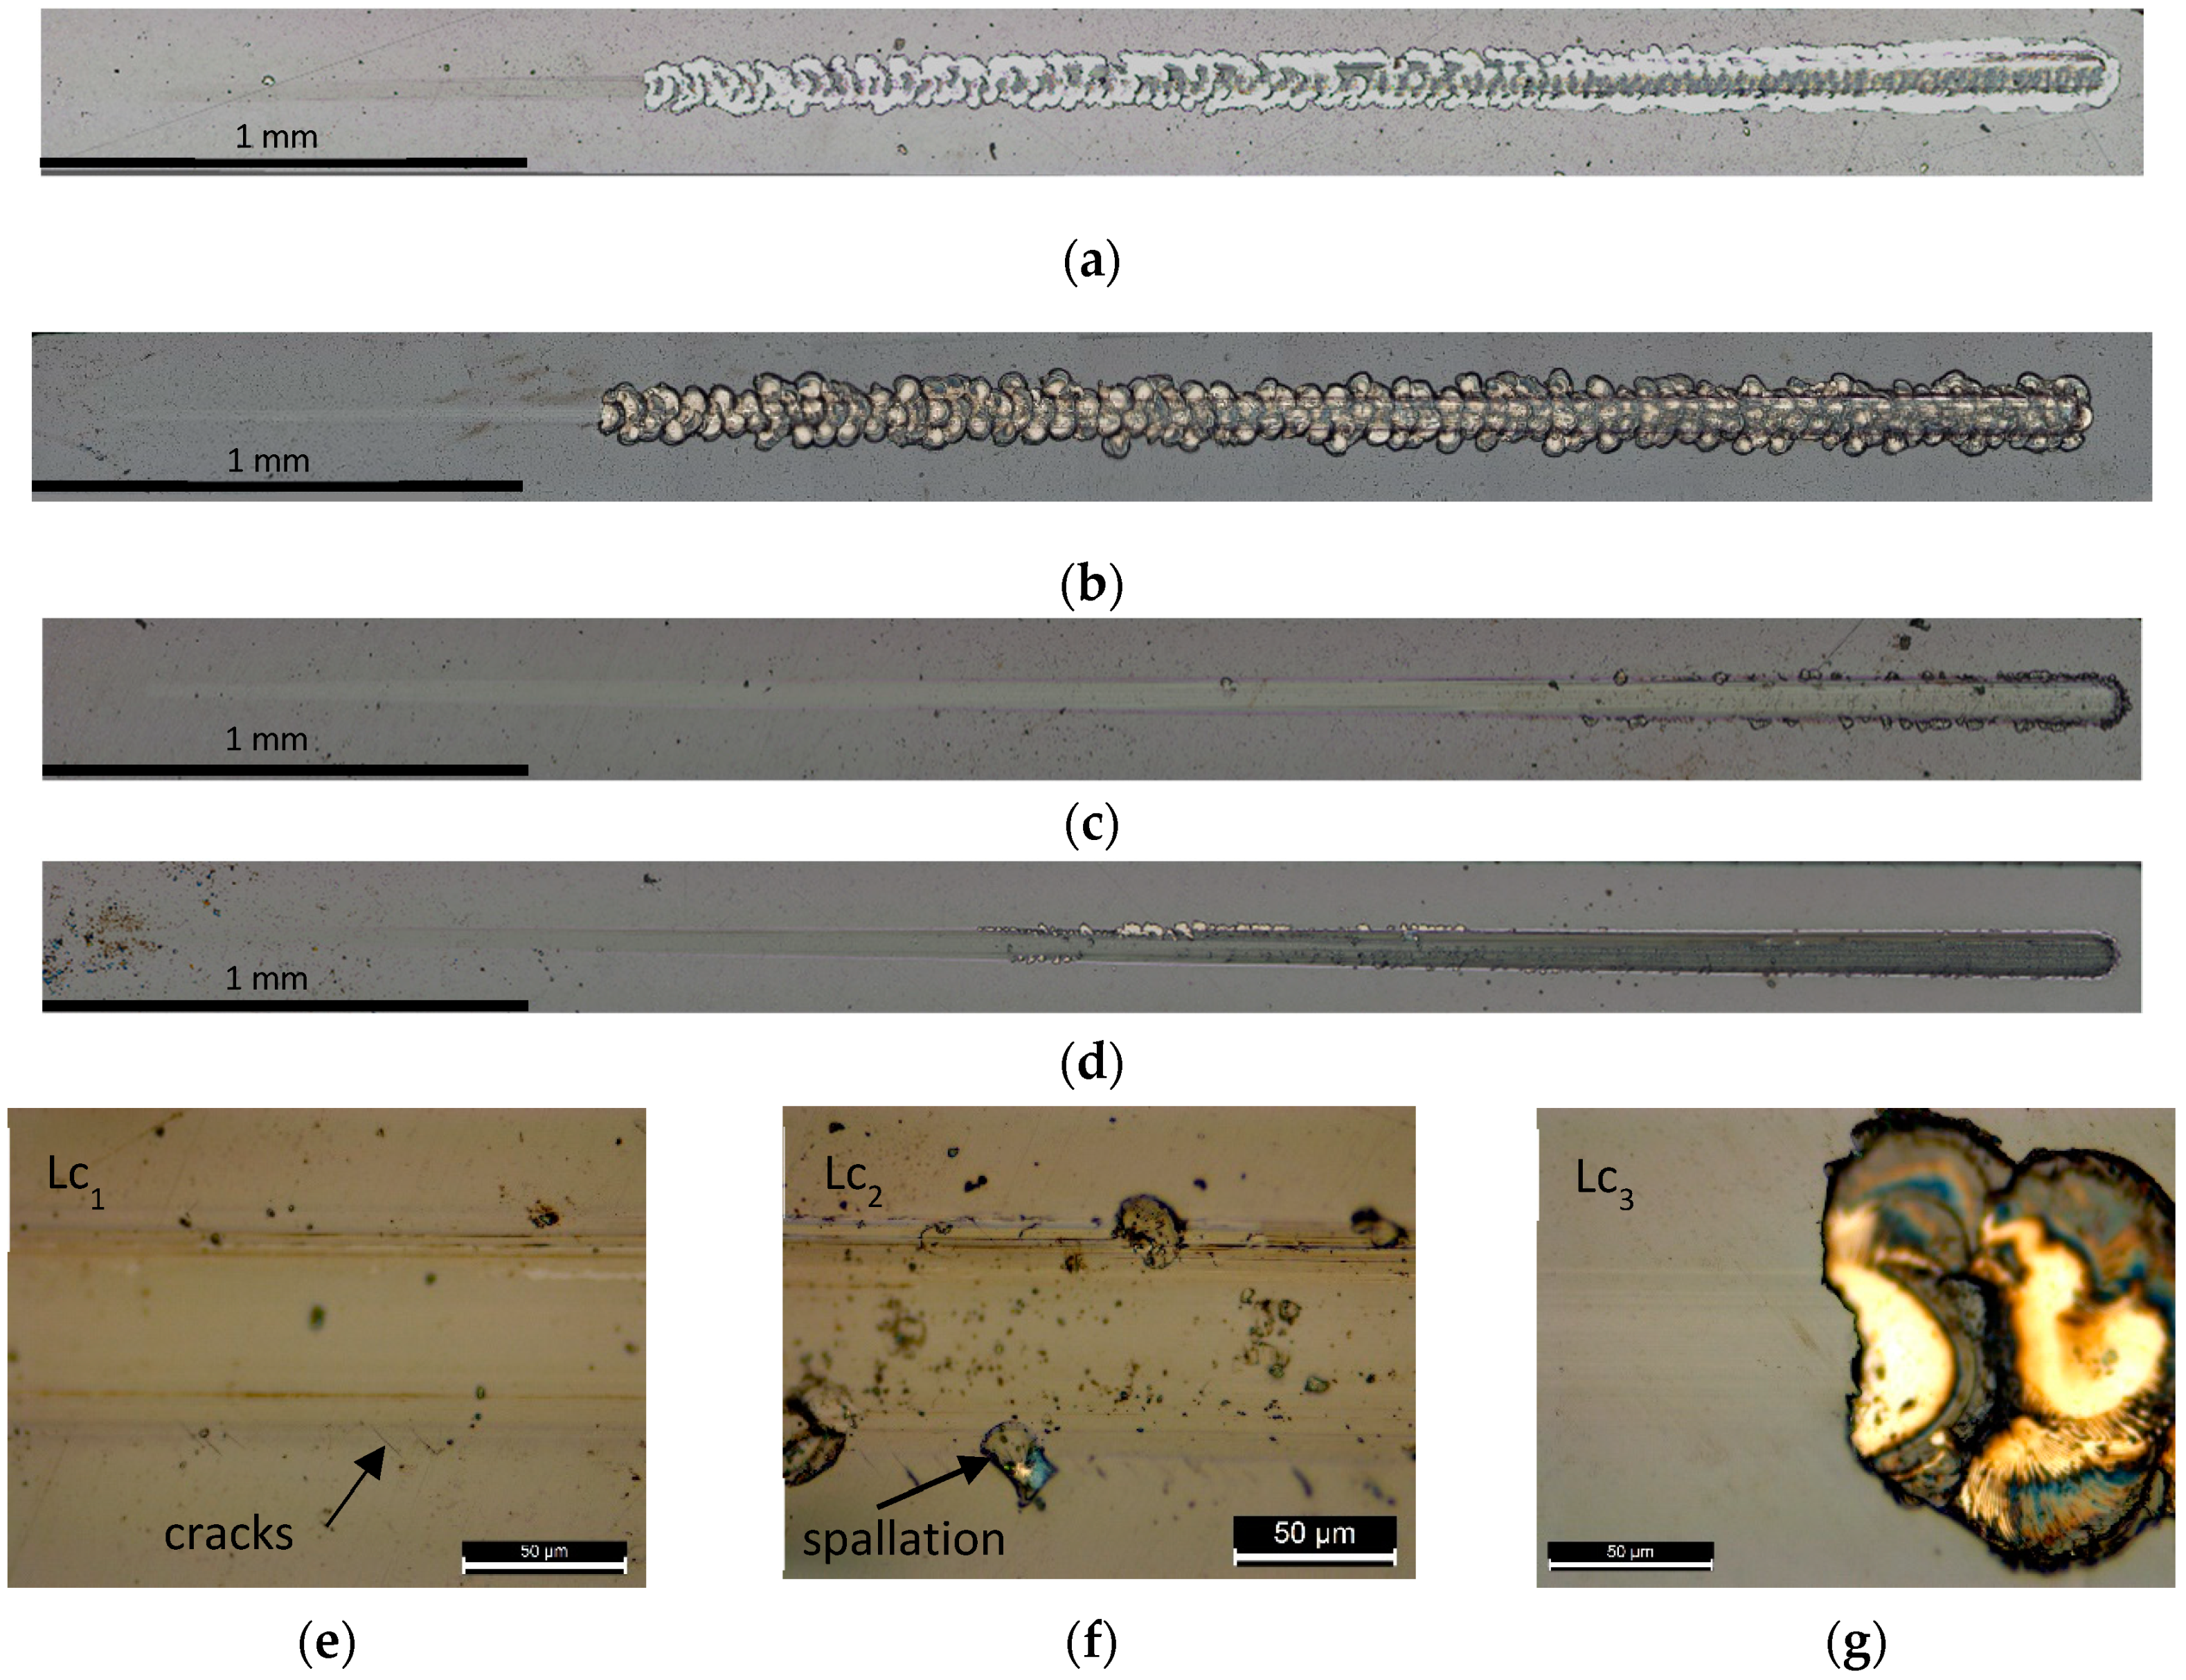
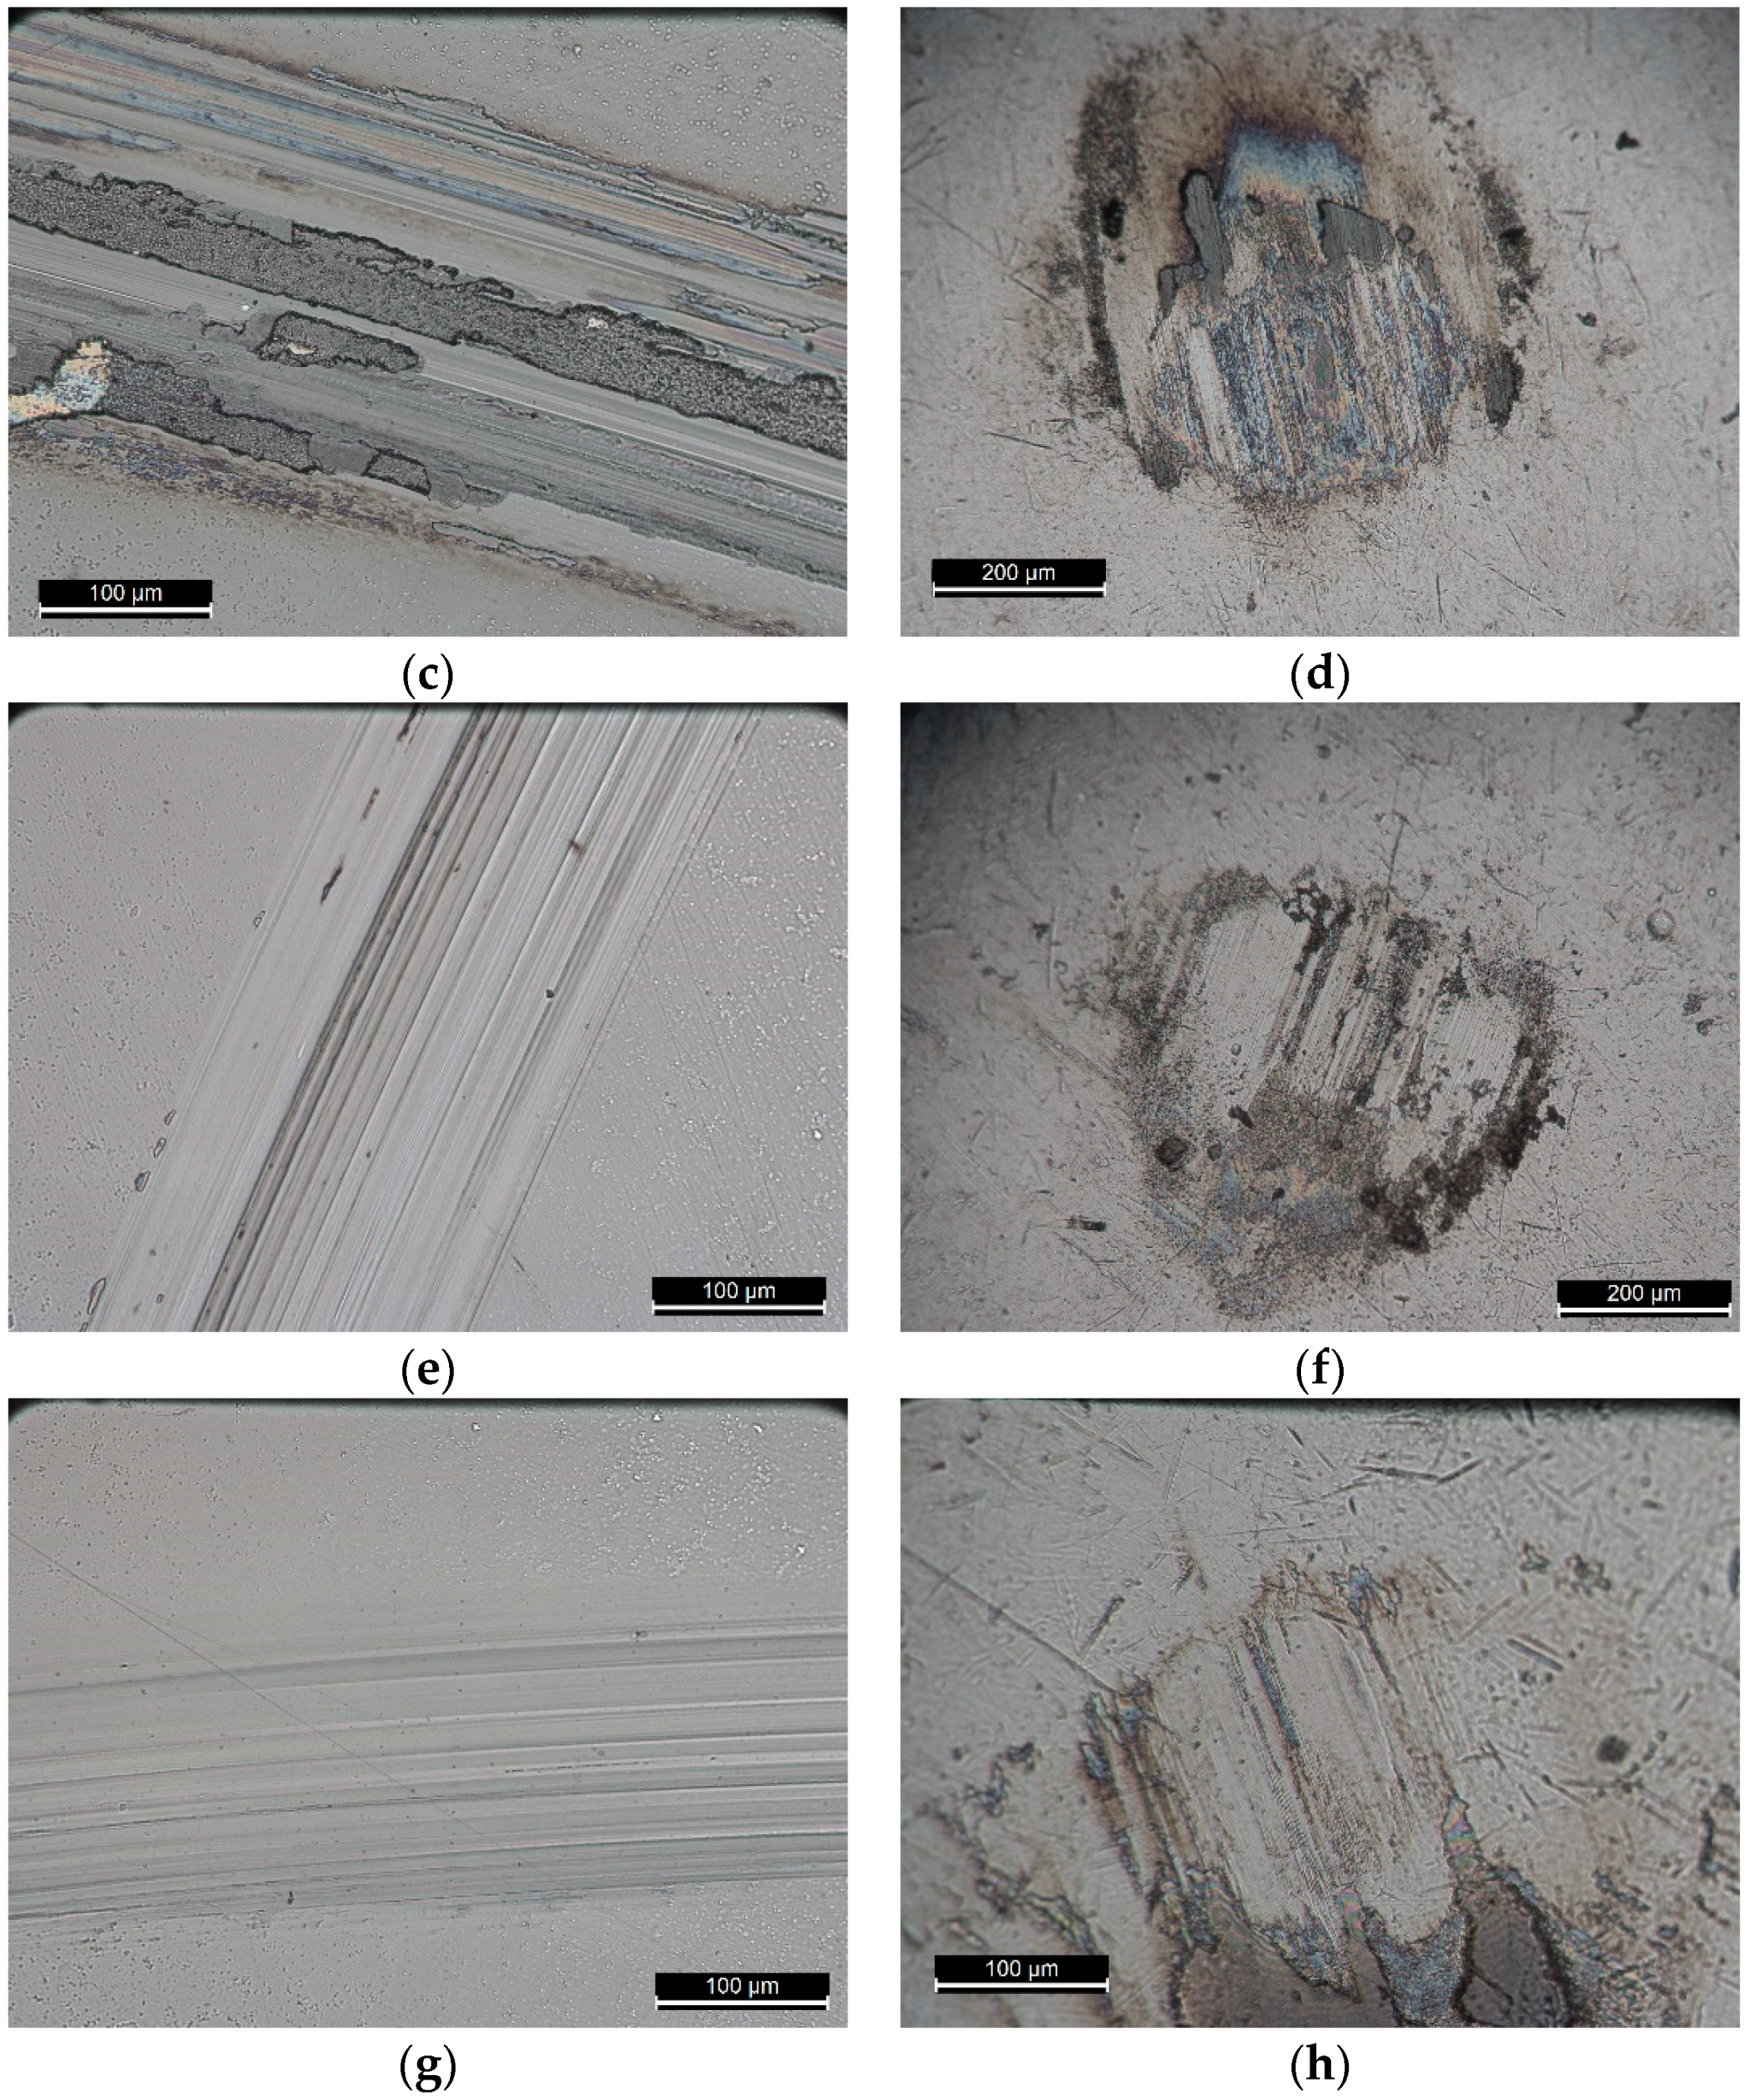
Scratch scar optical micrographs are shown in
Figure 9. A single scar from each deposition route is shown because the features observed were quite similar between coatings deposited by the same deposition route. The results associated with critical load are presented in
Table 2. Lc1 corresponds to the first appearance of cracks on the edge of the scratch scar. The critical load of the Lc
2 type corresponds to the first delamination (chipping) occurring on the sides of the scratch scar, while the Lc
3 critical load is the load at which the coating is totally removed from the surface [
39]. Coatings of D1 and D2 types showed adhesion failures with Lc
3 critical loads of 14 N (for D1-450) and 13 N (for D2-17). Lc
1 and Lc
2 loads were not detected (no cracking or chipping on the sides of the scar was observed) in these cases. As soon as the loads of 13–14 N were achieved, gross spallation was observed. The failure mode for these coatings was identified as wedge spallation.
The D3 and D4 coatings showed improved adhesion. Cracking was observed for the D3 coatings as well as for the D4 coating deposited under the lowest partial pressure of CH
4. The Lc
1 loads were in the range of 12–19 N for the D3 coatings and ~11 N for the D4-28 coating. A representative detail regarding the cracking observed is shown in
Figure 9e. The Lc
2 loads (a representative detail is shown in
Figure 9f) were between 20 and 28 N for D3 coatings, and 19 and 21 N for the D4 ones. It should be noted that no complete removal of the coating occurred in the current load range for the D3 and D4 coatings.
The deteriorated behavior for D1 coatings can be related to the inability to deposit an interlayer. Delamination of the coating from the substrate in this case is very likely due to the bonding type mismatch between the coating and the substrate. As for D2 coatings, the spallation is most probably due to the columnar morphology, which is more porous by nature, with the presence of columnar boundaries. The presence of columnar boundaries is unfavorable in terms of crack initiation and propagation and, hence, the films are more prone to spallation. The improved behavior for D3 and D4 films is associated with the compact featureless morphology and the presence of the Cr interlayer.
3.4. Tribological Properties
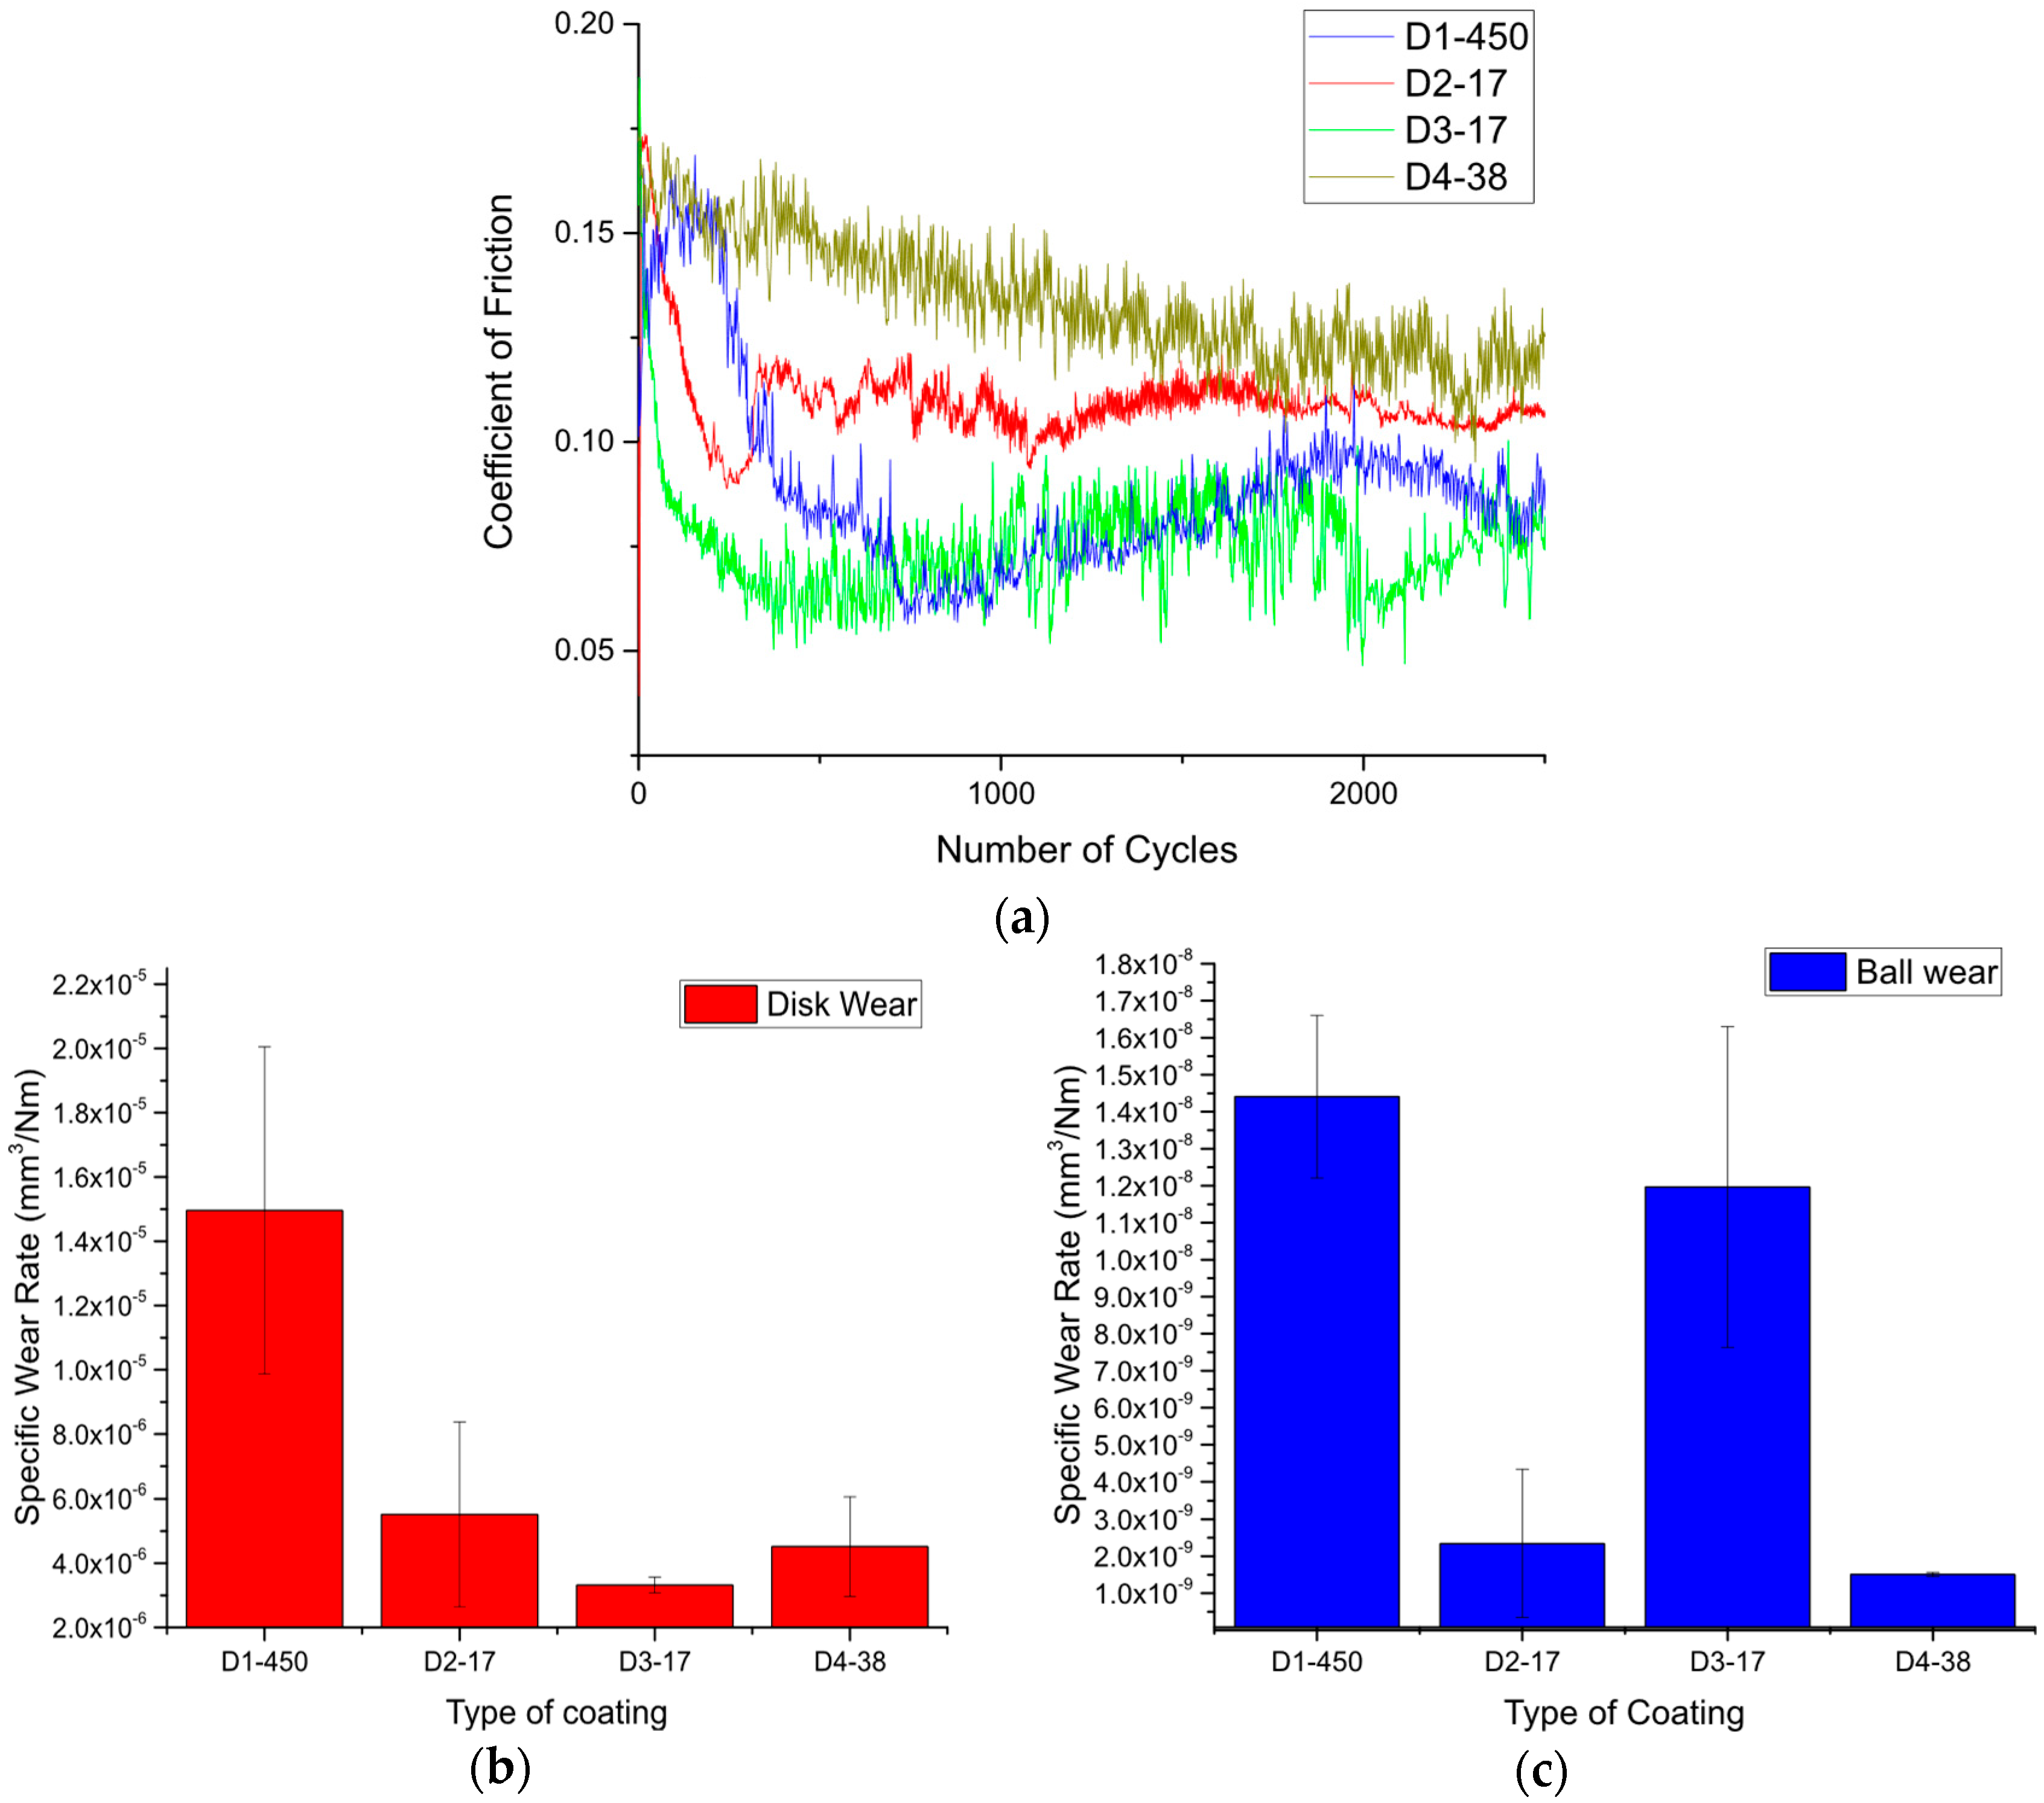
Results from the tribological tests are shown in
Figure 10. A coating with intermediate carbon content was selected from each deposition process.
The coating deposited by co-sputtering (D1-450) shows a steady running-in period with a drop of friction coefficient to ~0.06 at ~800 cycles; furthermore, fluctuations at values around 0.06–0.08 were observed for ~500 cycles, followed by an increase in friction, indicating potential failure of the coating. The 2D profilometry shows wear depths of ~1.5 µm, a value which is close to the thickness of the coating. The optical micrograph obtained for the wear scars shows large delaminated areas. The wear rate of the coating was the highest, with a value of 1.5 × 10
−5 mm
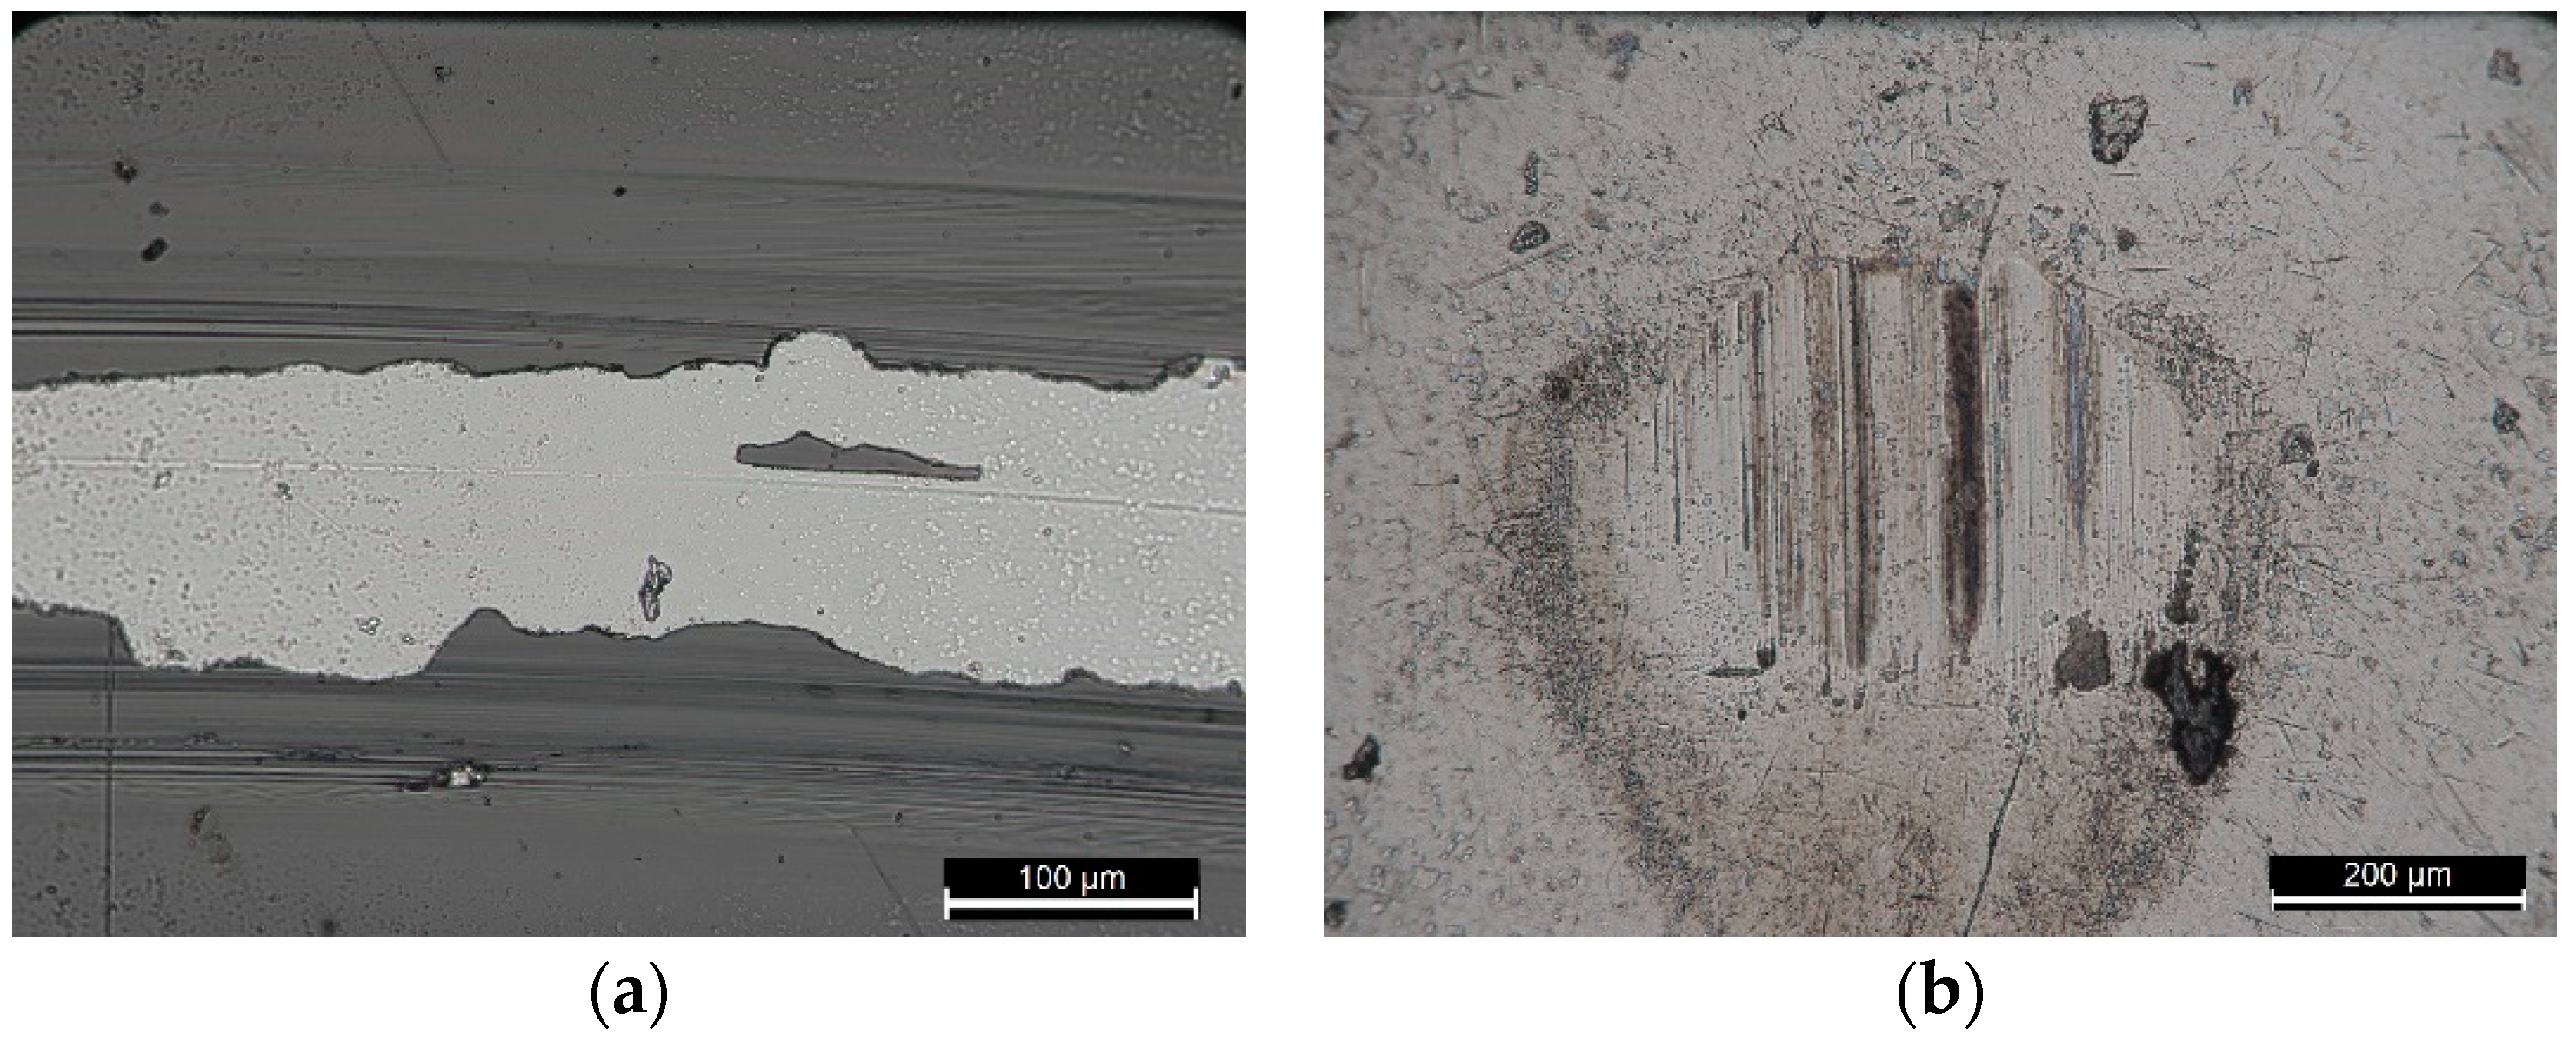
3/Nm. The drop of the friction down to 0.06 indicates the presence of a TMD tribofilm at the sliding interface, but the inability to deposit an interlayer was probably crucial as rapid wear of the coating occurs, which can be related to poor adhesion of the coating (large delaminated areas are observed on the wear scar). The behavior of the D2-17 coating is slightly different, with a short running-in period, after which the friction coefficient drops to 0.09–0.1, followed by a small increase and stabilization of the friction coefficient at a value of ~0.11–0.12. The specific wear rate was ~ 5 × 10
−6 mm
3/Nm, a much better value compared to the D1-450 coating. The optical micrograph (see
Figure 11c) shows areas on the wear scars in which the coating is worn through, but not to the same extent as the D1-450 coating. The coating D3-17 shows the best performance as the coefficient of friction was quite low, dropping to ~0.06 in the first ~700 cycles, with fluctuations between 0.06 and 0.08 for the remaining time of the test. This coating also outperformed the other coatings in terms of wear resistance, with a specific wear rate of 3 × 10
−6 mm
3/Nm. The optical micrograph (
Figure 11e) of the wear scar does not show any signs of delamination. The reactive sputtered coating (D4-38) had a higher friction coefficient compared to the other coatings, with a starting value of 0.16, a value that steadily dropped to ~0.12 by the end of the duration of the test. The integrity of the coating was preserved during testing (see
Figure 11g), with a specific wear rate of ~ 4 × 10
−6 mm
3/Nm.
In terms of ball wear, higher values were observed for the D1 and D3 coatings (~ 1 × 10⁻⁸ mm3/Nm). The higher wear for the ball counterpart sliding against the D1 coating is very likely due to the increased interaction of the ball with the harder steel counterpart, further resulting in generation of an iron-rich third body, which can cause third body abrasion. This process will result in an increased coefficient of friction as the iron rich debris does not possess low shear strength. As for the ball sliding against the D3 coating, the increased wear may be due to the increased hardness of the D3 coating. The harder D3-17 coating most probably contains more WC inclusions, which are very hard and can cause abrasive wear on the steel counterpart. In the case of the D2 and D4 coatings, the formation of a protective transfer film results in reduced wear of the counterbody.
Considering the low value observed for the friction coefficient (~0.06–0.08) in the D1-450 and D3-17 coatings, it can be assumed that the friction is at least partially governed by a WS
2 phase. It should be noted that pure carbon films deposited using the same equipment, sliding against a steel counterbody, under similar conditions, show a coefficient of friction of ~0.2 (see Ref. [
40]). The D2-17 coatings, despite having a significant amount of WS
2, showed a higher coefficient of friction, which may be related to the partial interaction between the steel counterbody and the steel disk due to the presence of areas on the wear track where the W-S-C coating was delaminated. In the case of the reactively sputtered coatings, the friction was slightly higher, but stable. Considering the high amount of C contained in the coating, and the higher overall friction coefficient, it is very likely that the carbon phase plays the main role in governing the friction.
In summary, the best performance was observed for the coating deposited by sputtering a composite target with the substrate holder being stationary (D3). Its good performance may be related to the compact morphology resulting from the optimal carbon content and a suitable S/W ratio. Moreover, the coating responded well to scratch testing, with the highest value of the Lc2 load and no gross delamination.


