4.2. Raman Spectroscopy
PAni EB, CMP, and PAni EB binder samples were analyzed by Raman Spectroscopy and the spectra are shown in
Figure 2 and
Table 1. The binder spectrum is similar to a typical PAni EB spectrum, where the band at 1628 cm
−1, attributed to the CC benzenoid ring stretch and another band at 1588 cm
−1, corresponds to the C=C elongation of the quinoid ring. The bands at 1492 and 1465 cm
−1 are attributed to the C=N stretch of oxidized PAni, the band 1412 cm
−1 to the CC stretch of the quinoid ring, the band at 1218 cm
−1 to the C–N stretch, and the deformation of quinoid ring C–H appears in 1165 cm
−1 [
12,
13,
14].
As shown in
Figure 2 and
Table 1, CMP has certain peaks close to those of PAni EB because the molecule has aromatic characteristics. The differentiation of the samples occurs with the presence of bands in the region of 400 to 800 cm
−1, which characterize the presence of C–Cl and C–O bonds. The band in the 1340 cm
−1 region is attributed to the axial deformations of the C–O bonds that are associated with the aromatic ring and the 1390 cm
−1 band is attributed to the –CH
3 angular stretch [
12,
15].
The Raman analyses of the PAni EB and the PAni EB binder present similar bands, previously described, that characterize the oxidized and non-conductive PAni, the PAni EB. The reduced state of PAni is related to the conformational changes that occur in the quinoid and benzenoid rings, which are attributed to changes in the 1588 and 1165 cm
−1 bands of the oxidized state of PAni, something not shown in
Figure 2. In case the PAni is in the protonated state, the Raman spectrum should have a band in the region of 1300 to 1350 cm
−1, which would characterize the quinonic stretch C–N
+, which is attributed to the protonated form of the PAni EP, a fact that is not observed in PAni EB film [
16,
17,
18]. With the obtained spectra, it can be stated that the PAni EB present in the binder remains in the oxidized state.
Thus, it was possible to observe that the CMF does not act reduction or protonation the PAni present in the binder produced. The plasticizer does not induce alteration in the oxidized and insulating state of PAni EB, which is a necessary condition for its future use as a component of some protective coating that promotes the anodic protective effect on passivable metals, and associated with the barrier effect produced by the coating.
As shown in
Figure 3 and
Table 2, the CEP and IEP samples showed similar spectra, with the presence of band in the 1097 cm
−1 region that can be attributed to the –CH
2– groups that are present in the TBI. Intensity peaks at 1184 cm
−1 correspond to aliphatic glycidyl groups (COC) characteristic of epoxy resins, but for IEP samples can also be attributed to PAni EB C–N bonds. Bands in the 1441 cm
−1 region are attributed to the presence of OH groups of CEP, and to IEP samples can be associated with C–N bonds of PAni EB binder. The bands at 1603 cm
−1 represent the presence of C=C bonds in CEP aromatic rings for the three samples [
13,
15,
18].
Raman analyses for the IEP samples did not show spectra that indicate the presence of PAni binder in CEP that modifies the structural characteristics of the PAni EB polymer chain, as some intensity peaks characterize the presence of PAni EB binder if it overlaps with CEP characteristic links, which are associated with the low concentration of the PAni EB binder and the CEP for the formation of the IEP, make it difficult to identify a possible chemical interaction of the PAni EB binder and the CEP, which could alter the oxidized and non-conductive state of the PAni, due to the chemical variability of the components that make up a commercial paint.
4.3. Scanning Electron Microscopy/Dispersive Energy Spectroscopy
The CEP micrograph, shown in the SEM image in
Figure 4a–c, presents a relief altering morphology, which shows the presence of dark and light regions, which were evaluated by EDX, at points 1 (P1) and 2 (P2). The EDX spectra of P1 and P2 have chemical elements characteristic of the CEP forming resin, such as C, O, and the presence of pigments and fillers, such as Ba, Ca, Al, and Si [
19]. The presence of a characteristic excitation peak of Au is attributed to the metallization process.
The surface micrograph of an IEP film, shown in the SEM image in
Figure 5a–c, shows a film with homogeneous distribution of its constituents. EDX analysis performed on the IEP sample, at the P1 and P2 sites, indicates, beyond the presence of the characteristic chemical elements of the CEP used, the presence of the N element that corresponds to the presence of the PAni EB contained in the IEP forming binder, and the presence of the Cl element assigned to the CMP of PAni EB binder that is contained in the IEP, also confirming that the PAni EB binder is dispersed in the coating produced [
11]. The presence of a characteristic peak excitation of Pt is attributed to the metallization process.
SEM/EDX assays gave answers indicating that at least part of the PAni EB binder was dispersed for IEP formation because the PAni EB binder that forms IEP is observed in micrometric points, without the presence of particles in the form of pigments.
4.4. Cyclic Voltammetry Assay
CV tests were performed on samples of uncoated AISI 1010 steel and samples of uncoated Pt in order to identify potential values that represent the oxidation and reduction regions at the metal/coating/electrolyte interface, and which consequently result in the formation of a protector’s oxide surface layer in these metals, i.e., the passivation of the metal. The metals were submerged to aqueous solution of 2 mol L−1 of H2SO4.
As observed in
Figure 6a, CV analysis was performed on AISI 1010 steel from the (round-trip) potential scan of −1.00 to +2.00 V
Ag/AgCl, the rate of 25 mV s
−1, where it was observed that the potential from −1.00 to −0.50 V
Ag/AgCl represents a cathodic active region (reduction) in which the metal is immune to the electrolyte medium. Later, the potential reaches an anodic active region (oxidation), which represents the corrosion of the metal [
8,
20].
From the +0.39 V
Ag/AgCl potential, the metal passivation region begins, with the presence of the Flade Potential, where current density stabilization (I (A cm²)) occurs, indicating the formation of a compact and adherent layer of iron oxides. After the potential +1.75 V
Ag/AgCl, the transpassivation process occurs that allows the evolution of oxygen in the form of gas [
20]. Thus, it can be said that the AISI 1010 steel is passive when submitted to an aqueous solution of H
2SO
4 at a concentration of 2 mol L
−1, within a potential region of +0.39 to +1.75 V
Ag/AgCl.
The analysis of CV was performed in the uncoated Pt, shown in
Figure 6b, for which the potential scan occurred from −0.50 to +2.50 V
Ag/AgCl with a rate of 25 mV s
−1,where it was observed that the potential of −0.50 at −0.30 V
Ag/AgCl represents a cathodic active region (reduction) in which the metal is immune to the electrolyte medium. Between the potentials of −0.30 to +1.75 V
Ag/AgCl, the region of immunity continues, where there is stabilization of current density I (A cm²), which indicates a stable region of potential that allows the evaluation of a possible performance of the proposed coating.
CV results for the working metals, AISI 1010 steel and Pt, allow us to infer that it is possible to use coatings with electrochemical properties such as the produced IEP, and that they could promote the anodic protection of these metals.
4.5. Open Circuit Potential Assay
OCP x time electrochemical characterization tests were performed on uncoated AISI 1010 steel and coated AISI 1010 steel sample with CEP and IEP. OCP x time measurement of samples uncoated Pt and coated Pt with CER and IP of CER was also performed to verify the electrochemical capacity of the PAni EB binder contained in commercial coatings, which could allegedly interfere with their electrochemical properties due to their constituents. The assays were performed during the period in which the maintenance of the potential of passivation of metal occurred, to the period in which potential levels that characterize the corrosion of the metal are reached.
OCP determination was required to verify the potential values over time in the metal/coating/electrolyte interfaces, where responses with potential values beyond the potential of Flade indicate the passivated state, or for potential values below the potential of Flade, out of passivation condition.
As shown in
Figure 7a, the OCP measurements for the uncoated AISI 1010 steel sample showed, of constant form, a potential value of −0.41 V
Ag/AgCl throughout the assay, indicating that the metal is in the process of being corrosion installed because it is the region of potential in which the corrosion process of the metal exposed to this electrolyte occurs, according to the CV analysis in
Figure 6a [
21]. The CEP coated carbon steel sample had an initial potential of around +0.15 V
Ag/AgCl at time 467 s, which can be attributed to the barrier effect produced by the commercial coating; afterwards, a decay to potential −0.42 V
Ag/AgCl reached in 7150 s, which is within the oxidation potential range of the metal corrosion characteristic installed and maintained until the end of the analysis, can be attributed to the failure of the barrier effect produced by the commercial coating.
IEP coated AISI 1010 steel showed instantaneous decay to the potential +0.49 V
Ag/AgCl, and then the potential stabilized at +0.46 V
Ag/AgCl over 10,968 s, as shown in
Figure 7a. In
Figure 7b, the continuity of the previous test for longer times is observed and the maintenance of the potential until 140 h; after this period occurs, there is a gradual decay of the potential until the time 148 h, reaching the potential of −0.40 V
Ag/AgCl, no longer rising until the end of the assay. The behavior of this analysis indicates that the IEP sample has a period of 140 h under potential conditions above the Flade Potential (+0.39 V
Ag/AgCl), i.e., in the passivation region, shown in
Figure 6a. The OCP decay can be attributed to the rupture of the protective oxide layer and the total reduction of PAni, indicating the end of the IEP acting period [
4,
21].
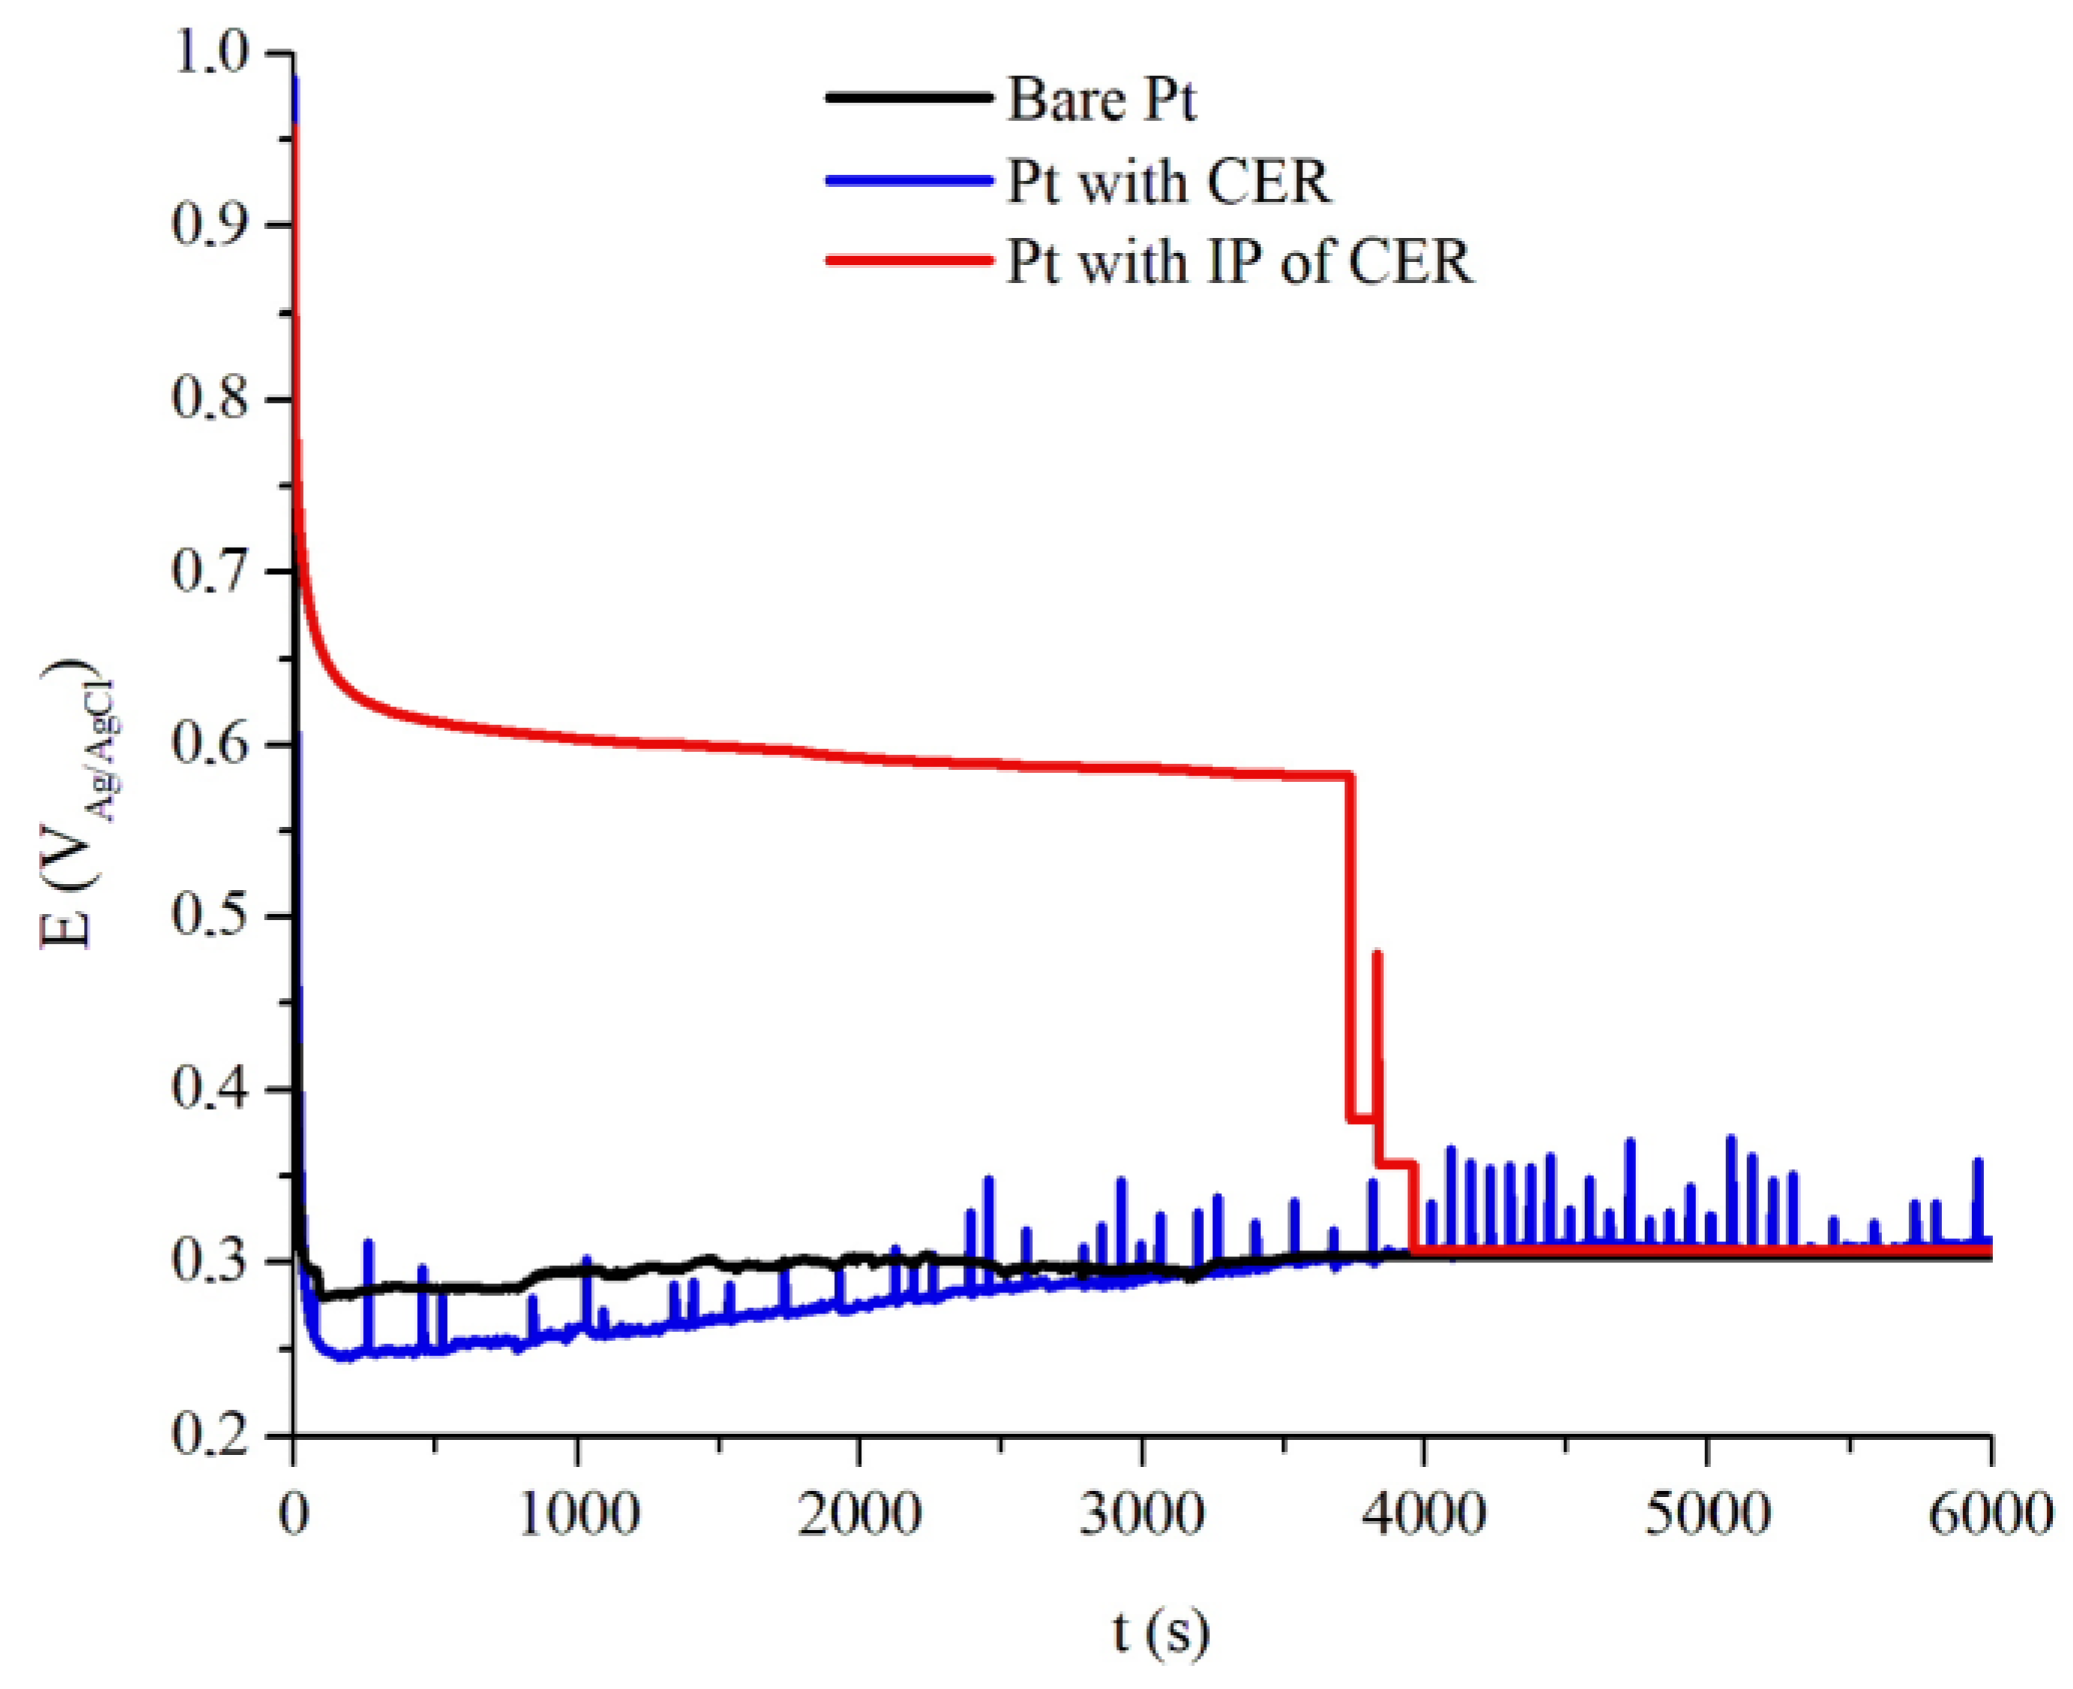
Figure 8 shows the OCP vs. time assay of the uncoated Pt and coated Pt with CER, average thickness of 165 μm, and IP of CER, with average thickness of 145 μm, where the samples were exposed to aqueous solution of 2 mol L
−1 H
2SO
4. Uncoated Pt behavior during the test was the instantaneous initial decay to the potential value of +0.28 V
Ag/AgCl, remaining until the end of the analysis; this potential indicates Pt oxidation in this medium.
Coated Pt with CER,
Figure 8 shows an immediate initial decay to the potential +0.24 V
Ag/AgCl, with a gradual increase in potential until the end of the analysis, to the potential +0.29 V
Ag/AgCl. This result allows us to affirm that the presence of CER does not give any protection against corrosion to Pt, and not even the barrier effect of coating itself or electrochemical actuation, since the CER coated Pt has the same potential region as the uncoated Pt.
The samples of coated Pt with IP of CER had a mild decay of potential at the start of the assay until the potential of +0.58 VAg/AgCl, until 3757 s, when a sharp decay starts until +0.28 VAg/AgCl, identical to the potential of the uncoated sample. During the time period 3757 s and 3949 s, the potential decay is associated with the presence of potential elevation peaks, an aspect that can be attributed to the end of the intelligent paint containing an electrochemical PAni ability to promote oxidation and reduction reactions in the interface electrolyte/coating/metal. This result demonstrates that the presence of the PAni EB binder in the CER gives Pt a more noble electrochemical condition compared to the CER sample and uncoated.
Figure 9a shows an image of an IEP coated AISI 1010 steel sample that was intentionally scratched to perform the OCP assay over an area without a barrier effect of the coating. The purpose of this process is to verify only the electrochemical action of the coating without possible “help” that the barrier effect provided by the coating may cause in the study against corrosion.
OCP assay of the AISI 1010 steel sample coated defective IP of CER, shown in
Figure 9b, has an initial decay to the potential of +0.41 V
Ag/AgCl, for which the potential remained until 1797 s. This potential region can be attributed to the formation of the protective oxide layer on the metal surface, triggered by the oxidation and reduction reactions produced in the medium/IP/metal system. Later, there is a gradual decay of potential, with the presence of potential elevations, and decreases in a discontinuous manner, until reaching −0.40 V
Ag/AgCl. This process indicates that, after 1797 s, PAni EB no longer has electrochemical capacity to promote the formation and/or maintenance of protective oxides, as it has been totally reduced, and thus the metal is exposed to the action of the medium, that is, in the degradation phase by the corrosion process.
OCP analysis of IP of CER shows that the IEP containing the PAni EB binder provides corrosion protection of AISI 1010 steel subjected to 2 mol L−1 aqueous H2SO4 solution not as a barrier effect but as an active ingredient. This result proves the action of the anodic corrosion protection provided by IEP, which maintained the potential in a region above the Flade Potential for 1797 s, without the presence and aid of a possible barrier effect.
4.6. Electrochemical Impedance Spectroscopy
Electrochemical characterization tests of the EIS were performed on uncoated Pt and coated Pt samples with the CER and IP of CER, and on uncoated AISI 1010 steel and coated AISI 1010 steel samples with CEP and IEP. Measurements made on AISI 1010 steel and Pt when coated were performed according to the possible acting of IP of CER and IEP in anodic metal protection when immersed in aqueous solution of 2 mol L
−1 of H
2SO
4, shown in
Figure 7.
Figure 8 shows that the evaluated frequency range was 10
5 Hz to 10
−2 Hz, with a 10 mV synodal signal.
Initially, an EIS assay of uncoated Pt, represented by the Nyquist diagram of
Figure 10, was performed during the 0.25 h exposure period in aqueous solution of 2 mol L
−1 of H
2SO
4, where the measured OCP potential (
EOCP) was +0.29 V
Ag/AgCl, characteristic of Pt, where it an incomplete arc with a resistance value of 2.75 × 10
6 Ω cm
2 was observed. This spectrum indicates that the sample has a protection against the oxidation process, due to the presence of a surface layer of protective oxides attributed to Pt passivation, since the value of actual impedance is quite high when compared to a metal such as steel. After the 24 h exposure period, the
EOCP was at the potential value +0.28 V
Ag/AgCl, and the obtained spectrum represents a semicircle with resistance value on the order of 1.00 × 10
6 Ω.cm
2, indicating a decrease of protection by the natural oxides of Pt, but still with high resistance values when compared to ordinary values of metals not considered noble.
EIS assay for the CER coated Pt sample was immersed in a 2 mol L
−1 H
2SO
4 aqueous solution for 0.25 h, with the
EOCP measured at +0.27 V
Ag/AgCl. As shown in
Figure 11, the obtained spectrum has a resistance arc in the order of 2.5 × 10
8 Ω cm
2, which can be attributed to the barrier effect produced by the coating, as this result represents a resistance of two orders of magnitude higher. The CER coated Pt sample was immersed for 24 h in 2 mol L
−1 H
2SO
4 solution with
EOCP of +0.29 V
Ag/AgCl, where the spectrum obtained had a resistance arc of 7.5 × 10
6 Ω cm
2.
These results indicate that the samples have a higher resistance than the uncoated sample after 24 h exposure in 2 mol L−1 H2SO4 solution. Spectra obtained in the EIS assay for the CER coated metal sample indicate that there is possibly a barrier effect, even flawed, which provides greater electrical and/or ionic resistance than the uncoated sample.
For the coated Pt with IP of CER (
Figure 12a,b), an EIS assay showed an E
OCP value of +0.49 V
Ag/AgCl for a 0.25 h exposure period in 2 mol L
−1 H
2SO
4 solution, and produced a spectrum with three distinct frequency regions: the first, (1) at high frequency, is represented by a value resistance arc on the order of 1.2 × 10
5 Ω cm
2; a second region in medium frequencies (2) is indicated in the spectrum as an elevation of inclination line close to 45°; and a third at low frequencies (3) presents a straight line to the end of the analysis [
8,
22,
23].
The high frequency region (1) in the form of a semicircle is attributed to the process of charge and/or anion transfer in the metal/coat/electrolyte system, when charge accumulates in the coating/electrolyte system and there is a transfer of electrons from the metal for the coating and/or the medium. The region in medium frequencies (2) is attributed to the diffusion process of characteristic Warburg impedance ions, due to the transport of the HSO
4− doping ions from the solution to the interior of the coating, which causes PAni EB doping, represented in the spectrum as the capacitive resistance increases in the system. The low frequency region (3), represented as a vertical straight line, indicates that the diffusion of ions at the metal/coat/electrolyte interface has been interrupted, and this becomes purely capacitive, which corresponds to the presence of oxides on a metal surface [
8,
22,
24].
Figure 12a shows the EIS assays of the coated Pt with IP de CER, after 24 h immersion in 2 mol L
−1 H
2SO
4 solution, an
EOCP of +0.29 V
Ag/AgCl was shown, similar to uncoated Pt or uncoated of PAni EB. The sample presented spectrum with resistance arcs of 6.00 × 10
8 Ω cm
2. This obtained spectrum has two orders of magnitude larger than the resin without PAni, for the same time of exposure to the medium, which can be attributed to the formation of a layer of thicker or more organized Pt oxides, induced by the presence of the PAni EB binder contained in the IP.
The proposed equivalent electrical circuit for representing Nyquist for IP of CER coated Pt, after 0.25 h exposure in 2 mol L
−1 H
2SO
4 solution, shown in
Figure 13, indicates an electrolyte/coating/metal system that is subjected to an R
m of H
2SO
4 2 mol L
−1 solution, and that there are two simultaneous subsystems in which one Ri represents the charge transfer and/or anions of the electrolyte to the IP and W the diffusional process of HSO
4− ions, increasing the capacitive resistance of the system.
Re represents the resistive behavior for the transport of electrons from the metal to the IP and
Cd generated at the IP border and the electrolyte medium. The IP/metal subsystem represents a constant phase element in which the behavior of IP as
Cd is conditioned on the transport of electrons from the metal to the coating [
23,
24,
25].
In order to evaluate the performance of intelligent paints isolated from the barrier effect, an EIS test was realized for samples damaged purposely, in the form of a hole up to metal surface.
Figure 14a shows the EIS spectrum for the scratched IEP coated steel sample, and was performed after 0.25 h exposure in 2 mol L
−1 H
2SO
4 solution when the
EOCP was +0.42 V
Ag/AgCl, compatible with a possible performance of IEP in anodic metal protection. The obtained spectrum can be divided into high frequency (1) and low frequency (2) regions. At high frequencies, there was a resistance arc with a value on the order of 1.05 × 10
6 Ω cm
2, the region (1), which can be attributed to electron transfer at the metal/coating interface. In low frequency regions (2), it is possible to observe the projection of a second resistance arc with a value of 7.4 × 10
6 Ω cm
2, which may correspond to the ion transfer at the coating/electrolyte interface. The frequency diagram shows incomplete semicircles due to the high speed at which charge transfer occurs in the metal/coating/electrolyte system [
22,
24].
The EIS spectrum for the scratched IEP coated steel sample, after 24 h of electrolyte exposure,
Figure 14b, when the E
OCP was at −0.40 V
Ag/AgCl, shown in
Figure 7a,b, has a resistance arc on the order of value 3.72 × 10
3 Ω cm
2. The diagram obtained can be attributed to the presence of failure of the protective oxide layer on the metal surface, which is characteristic of a possible past passivation, and that IEP no longer has the electrochemical capacity to promote redox pair formation in the metal/coating/middle interfaces, and thereby promote passivation.
EIS results for IEP coated AISI 1010 steel samples, purposely produced defective, for the exposure period of 0.25 h in the 2 mol L−1 H2SO4 solution allow us to indicate a possible acting of the PAni EB binder mixed in CER to promote the passivation of metal, even in uncoated areas, but close to the coating.


