3.1. Galvanic Current Distribution Maps of the WBE
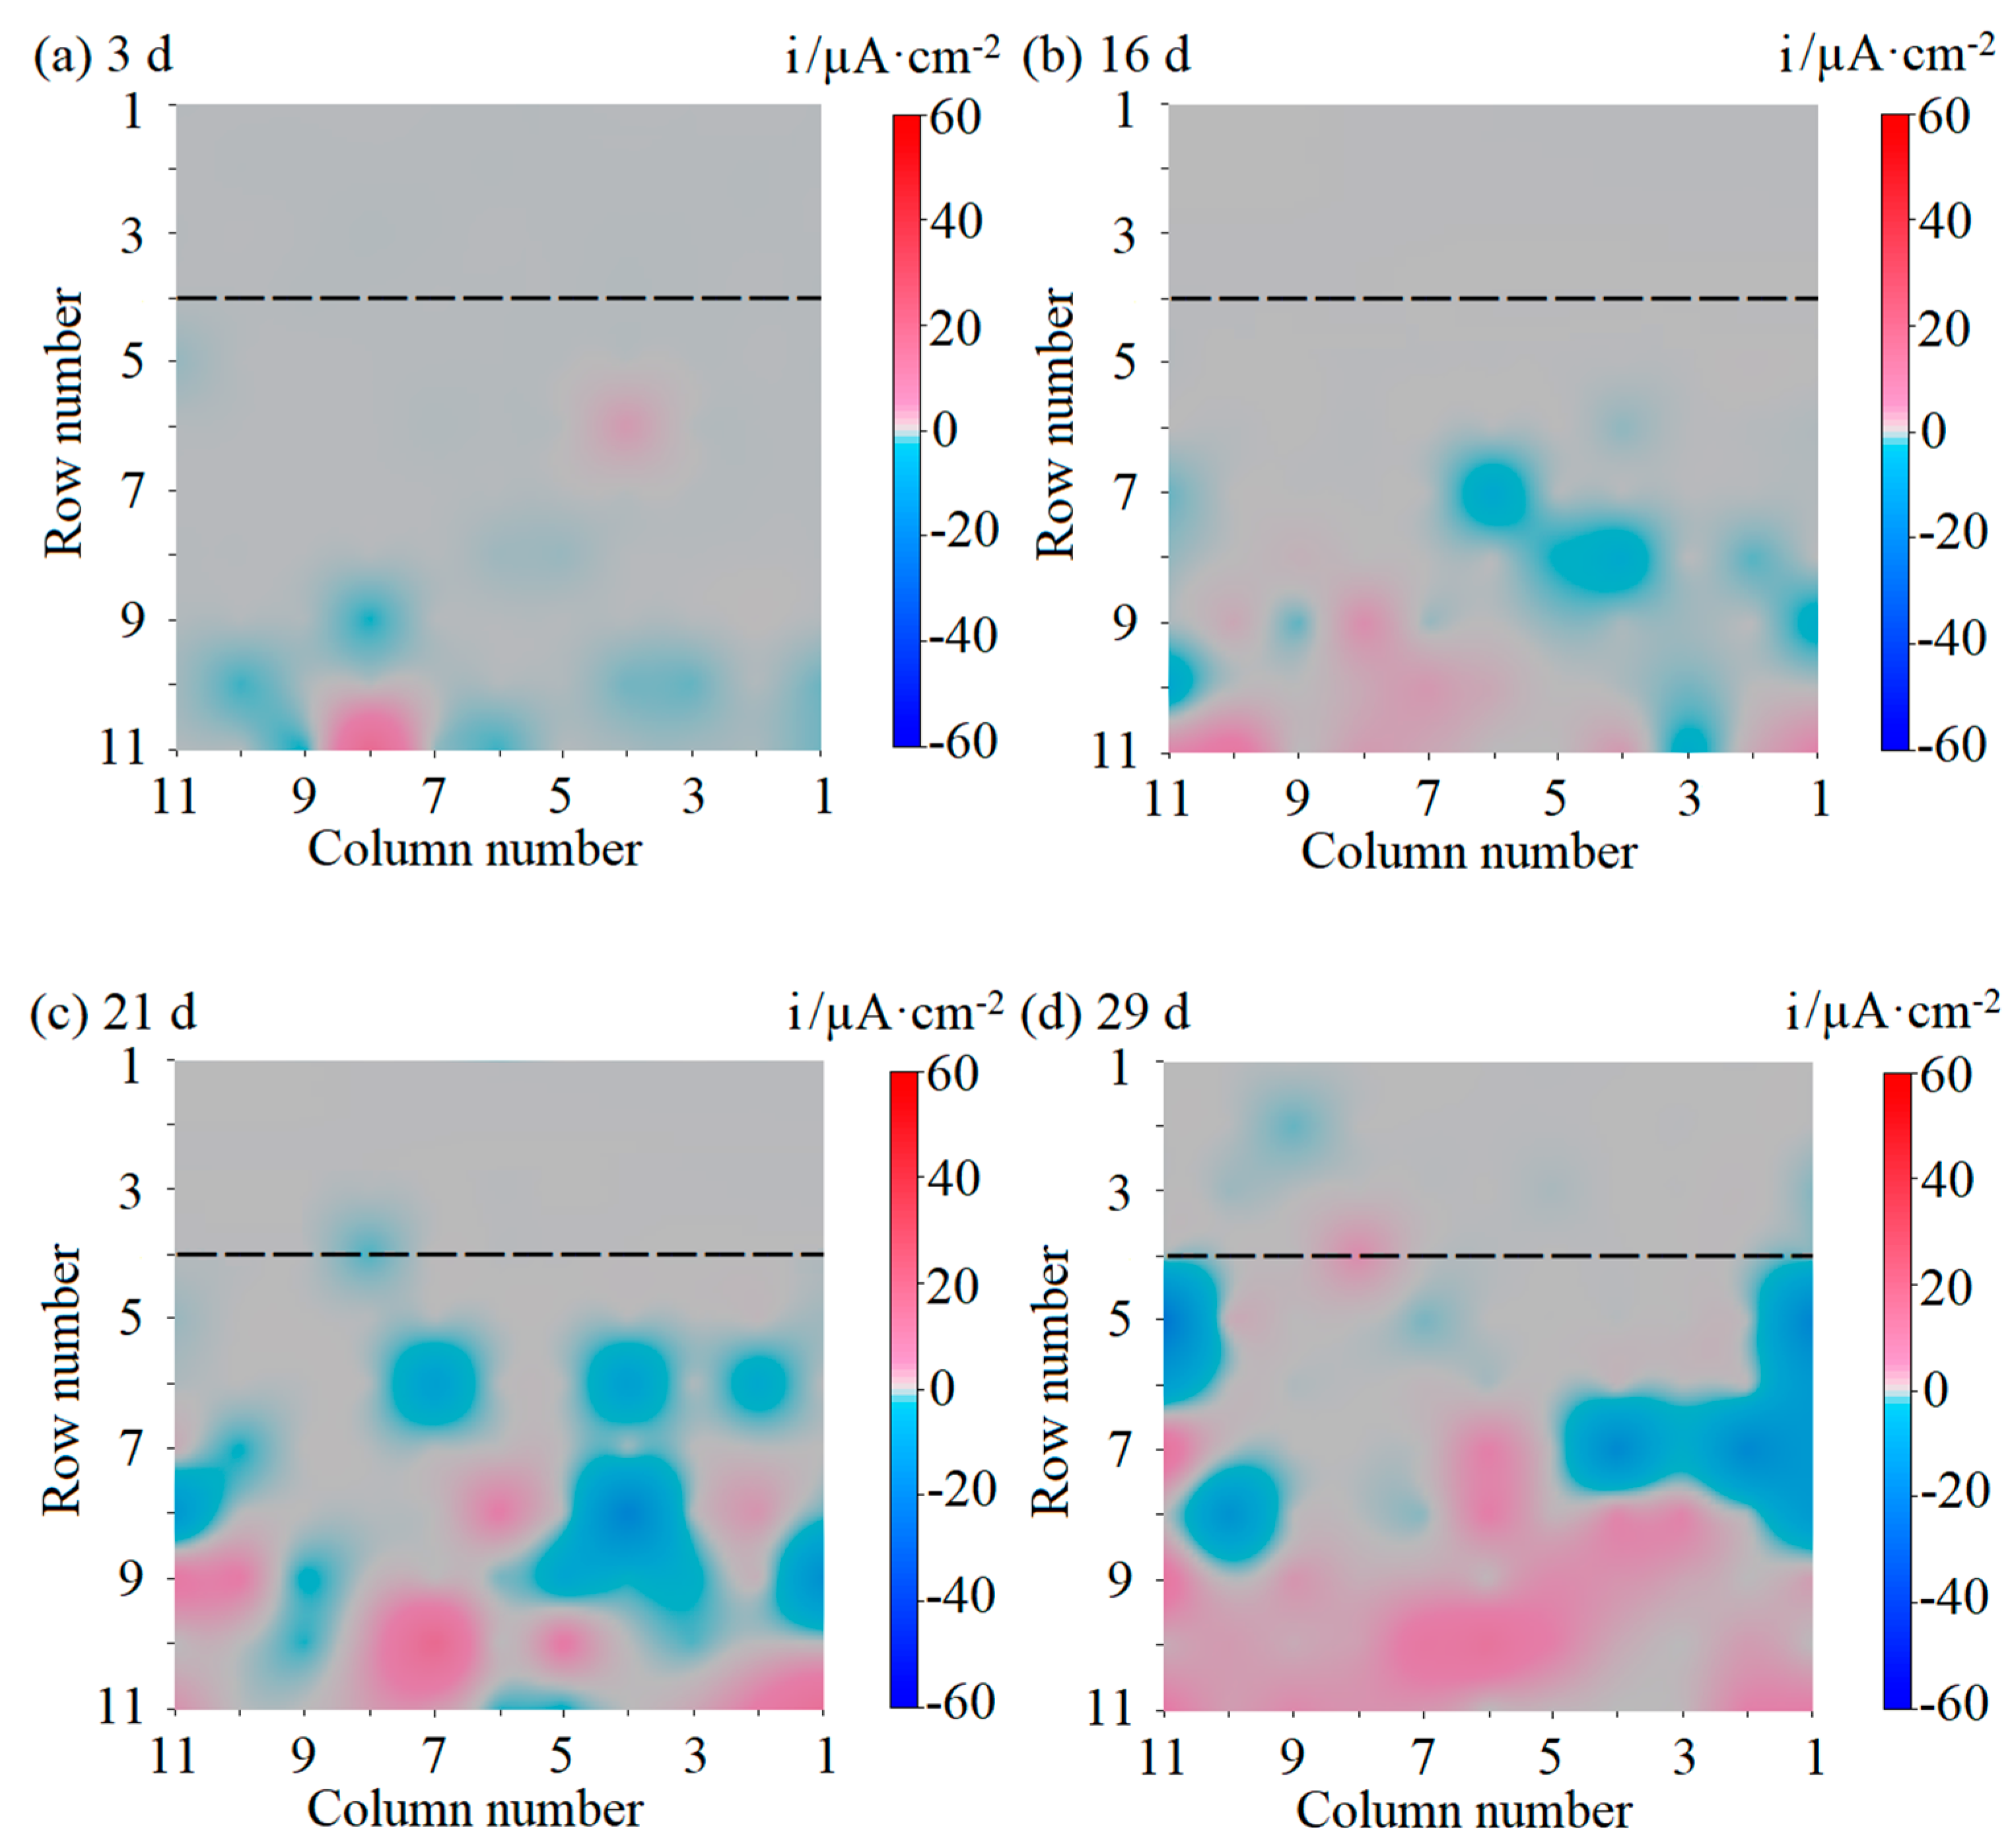
Figure 2 displays the galvanic current distribution maps of the WBE in 3.5 wt.% NaCl for various days. In the first two days, no local high anodic or cathodic current appeared in the current distribution map, suggesting that the base metal was effectively protected by the coating and the underlying corrosion reaction did not occur. This period corresponds to the water penetration stage [
9].
On the 3rd day, the anodic current was observed at the 11th row and the 8th column electrode (11–8# for short hereinafter) and 6–4# showed as anodic current on Day 3, while the cathodic current was found at 9–8#, 10–3#, and 11–10# (
Figure 2a). The presence of cathodic and anodic sites indicated that water and aggressive ions had diffused to the substrate/polymer interface, thus establishing the galvanic cell and also initiating the electrochemical reaction [
10]. This scattered distribution of cathodic and anodic sites is considered to be due to the non-uniform water penetration processes of the coating [
11]. Hydrophilic pathways developed during water sorption from the electrolyte solution into organic coating eventually widened to form ionic transport channels connecting the substrate and electrolyte, enabling localized underfilm corrosion [
12]. The distribution of these ionic transport channels on the coating surface was not uniform, causing the random distribution of cathode and anode sites.
Notably, the polarity of 9–8#, 11–1#, and 11–10#, which were located in the bottom of the electrode, reversed from cathode to anode on Day 16. In the meantime, new cathodic sites (7–11#, 8–2#, and 11–3#) appeared in the upper part of the anodic region, as shown in
Figure 2b. The delamination of coating was affected by many factors, and there is no definite conclusion on the exact factors of coating delamination. The exact mechanism of coating delamination needs to be further studied. Previous studies speculated that cathodic reactions can significantly reduce the bonding force of the substrate/polymer interface and accelerate the delamination of the coating [
13,
14]. When vast aggressive ions penetrated into the interface, the exposed “fresh” substrate tended to be anodically dissolved.
On Day 21, the anodic sites of 7–11#, 8–2#, and 11–3# reversed to the cathodes (
Figure 2c). Cathode sites such as 4–8#, 6–2#, 7–10#, 8–4#, 9–3#, 10–3#, and 11–6# were observed simultaneously. Affected by the DACs, the cathodic regions continued to expand upwards, and the uppermost area of the region reached water-line position 4–8#. Further, the anodic regions expanded upward due to the reversal of the polarity of the cathodic regions.
As the polarity of the cathodic points at the bottom of the electrode reversed to the anode on Day 29 (
Figure 2d), the anodic current region was distributed in a sheet shape on the lower portion of rows 9 to 11. It should be noted that the polarity of the 4–8# at the water line reversed to the anode, and a new cathodic site (2–9#) was found in the atmospheric region above the water-line.
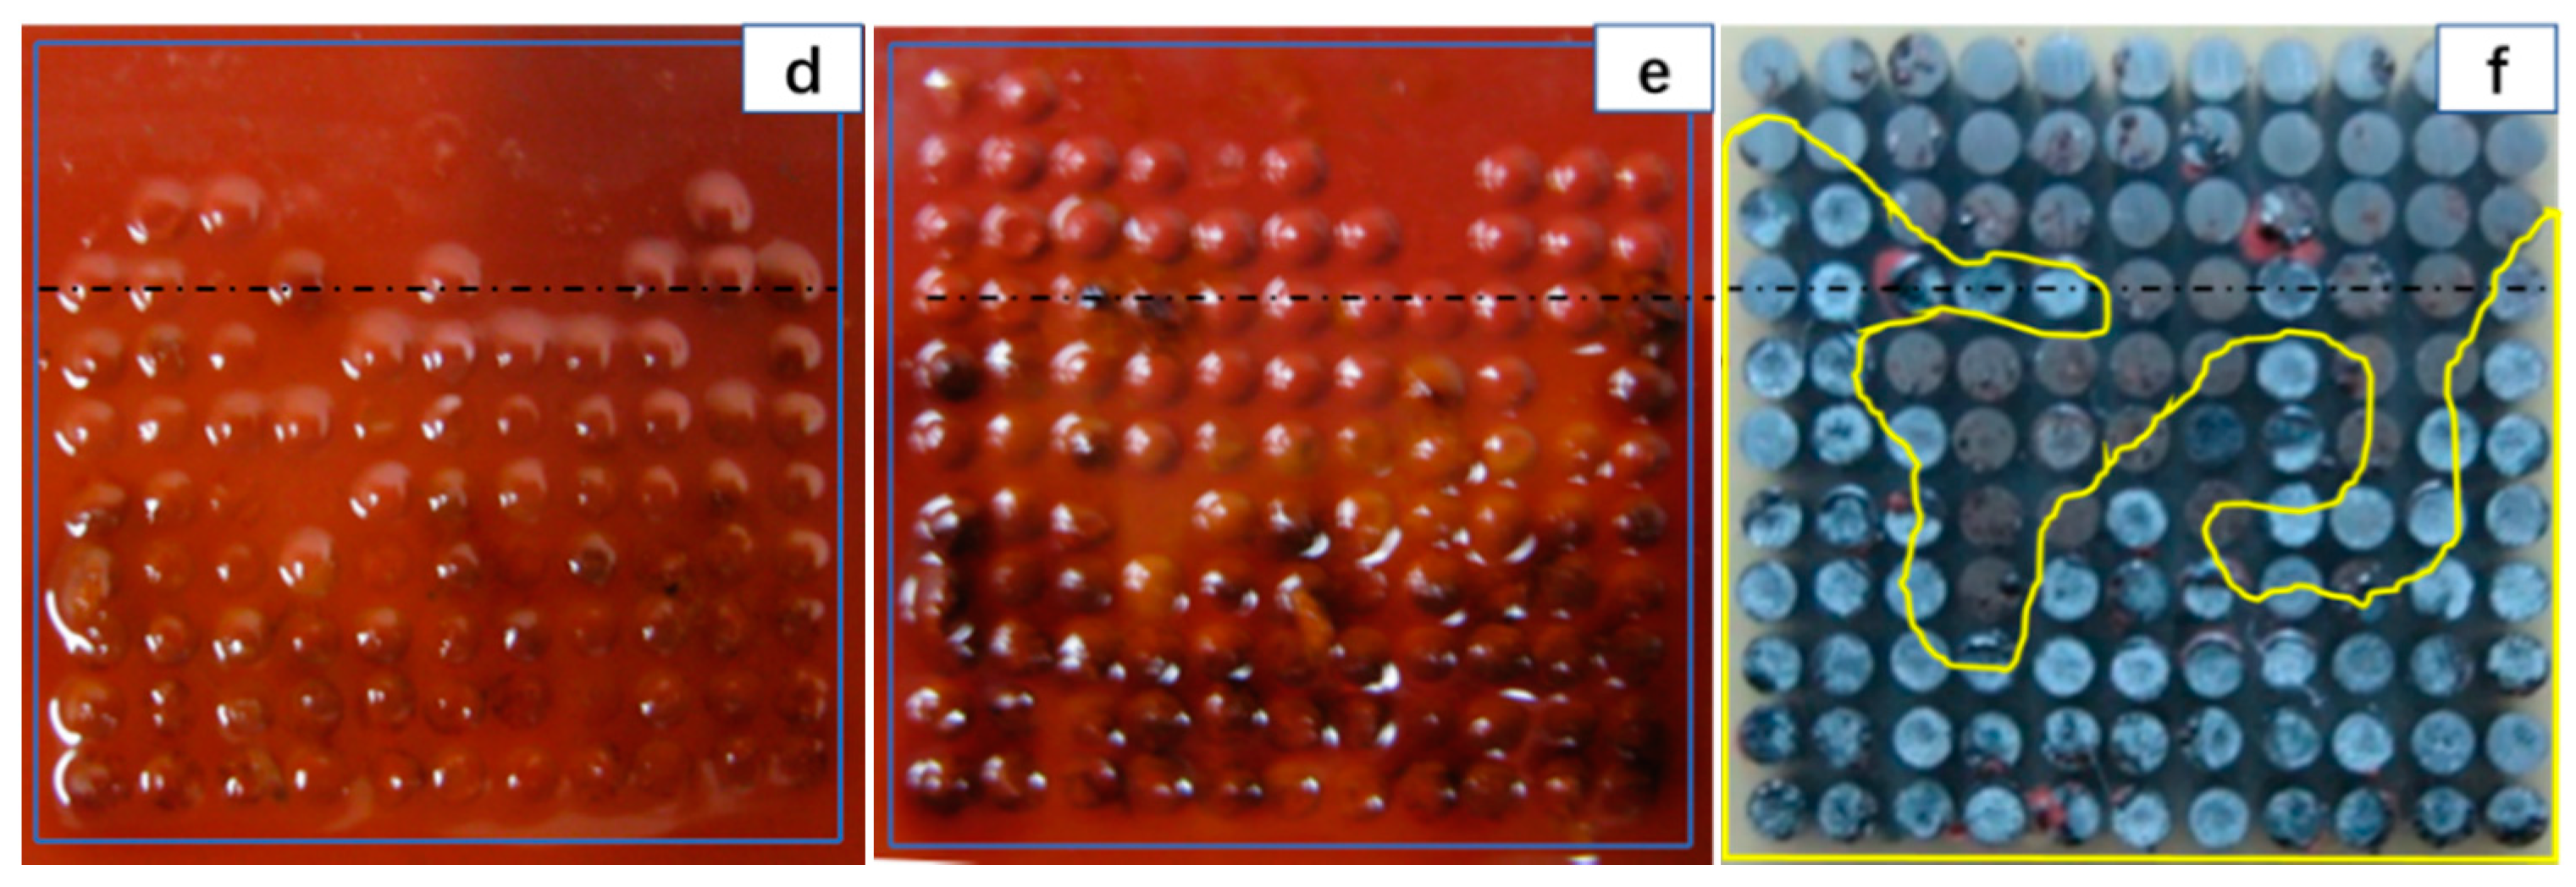
The cathodic sites above the water line rapidly increased on Day 47 (
Figure 2e) as compared with the changes on Day 29. By the 76th day, a higher cathodic current was detected in all cylinders from the 1st to 3rd rows located above the water-line, except for two anodic sites of 3–11# and 3–10# (
Figure 2f).
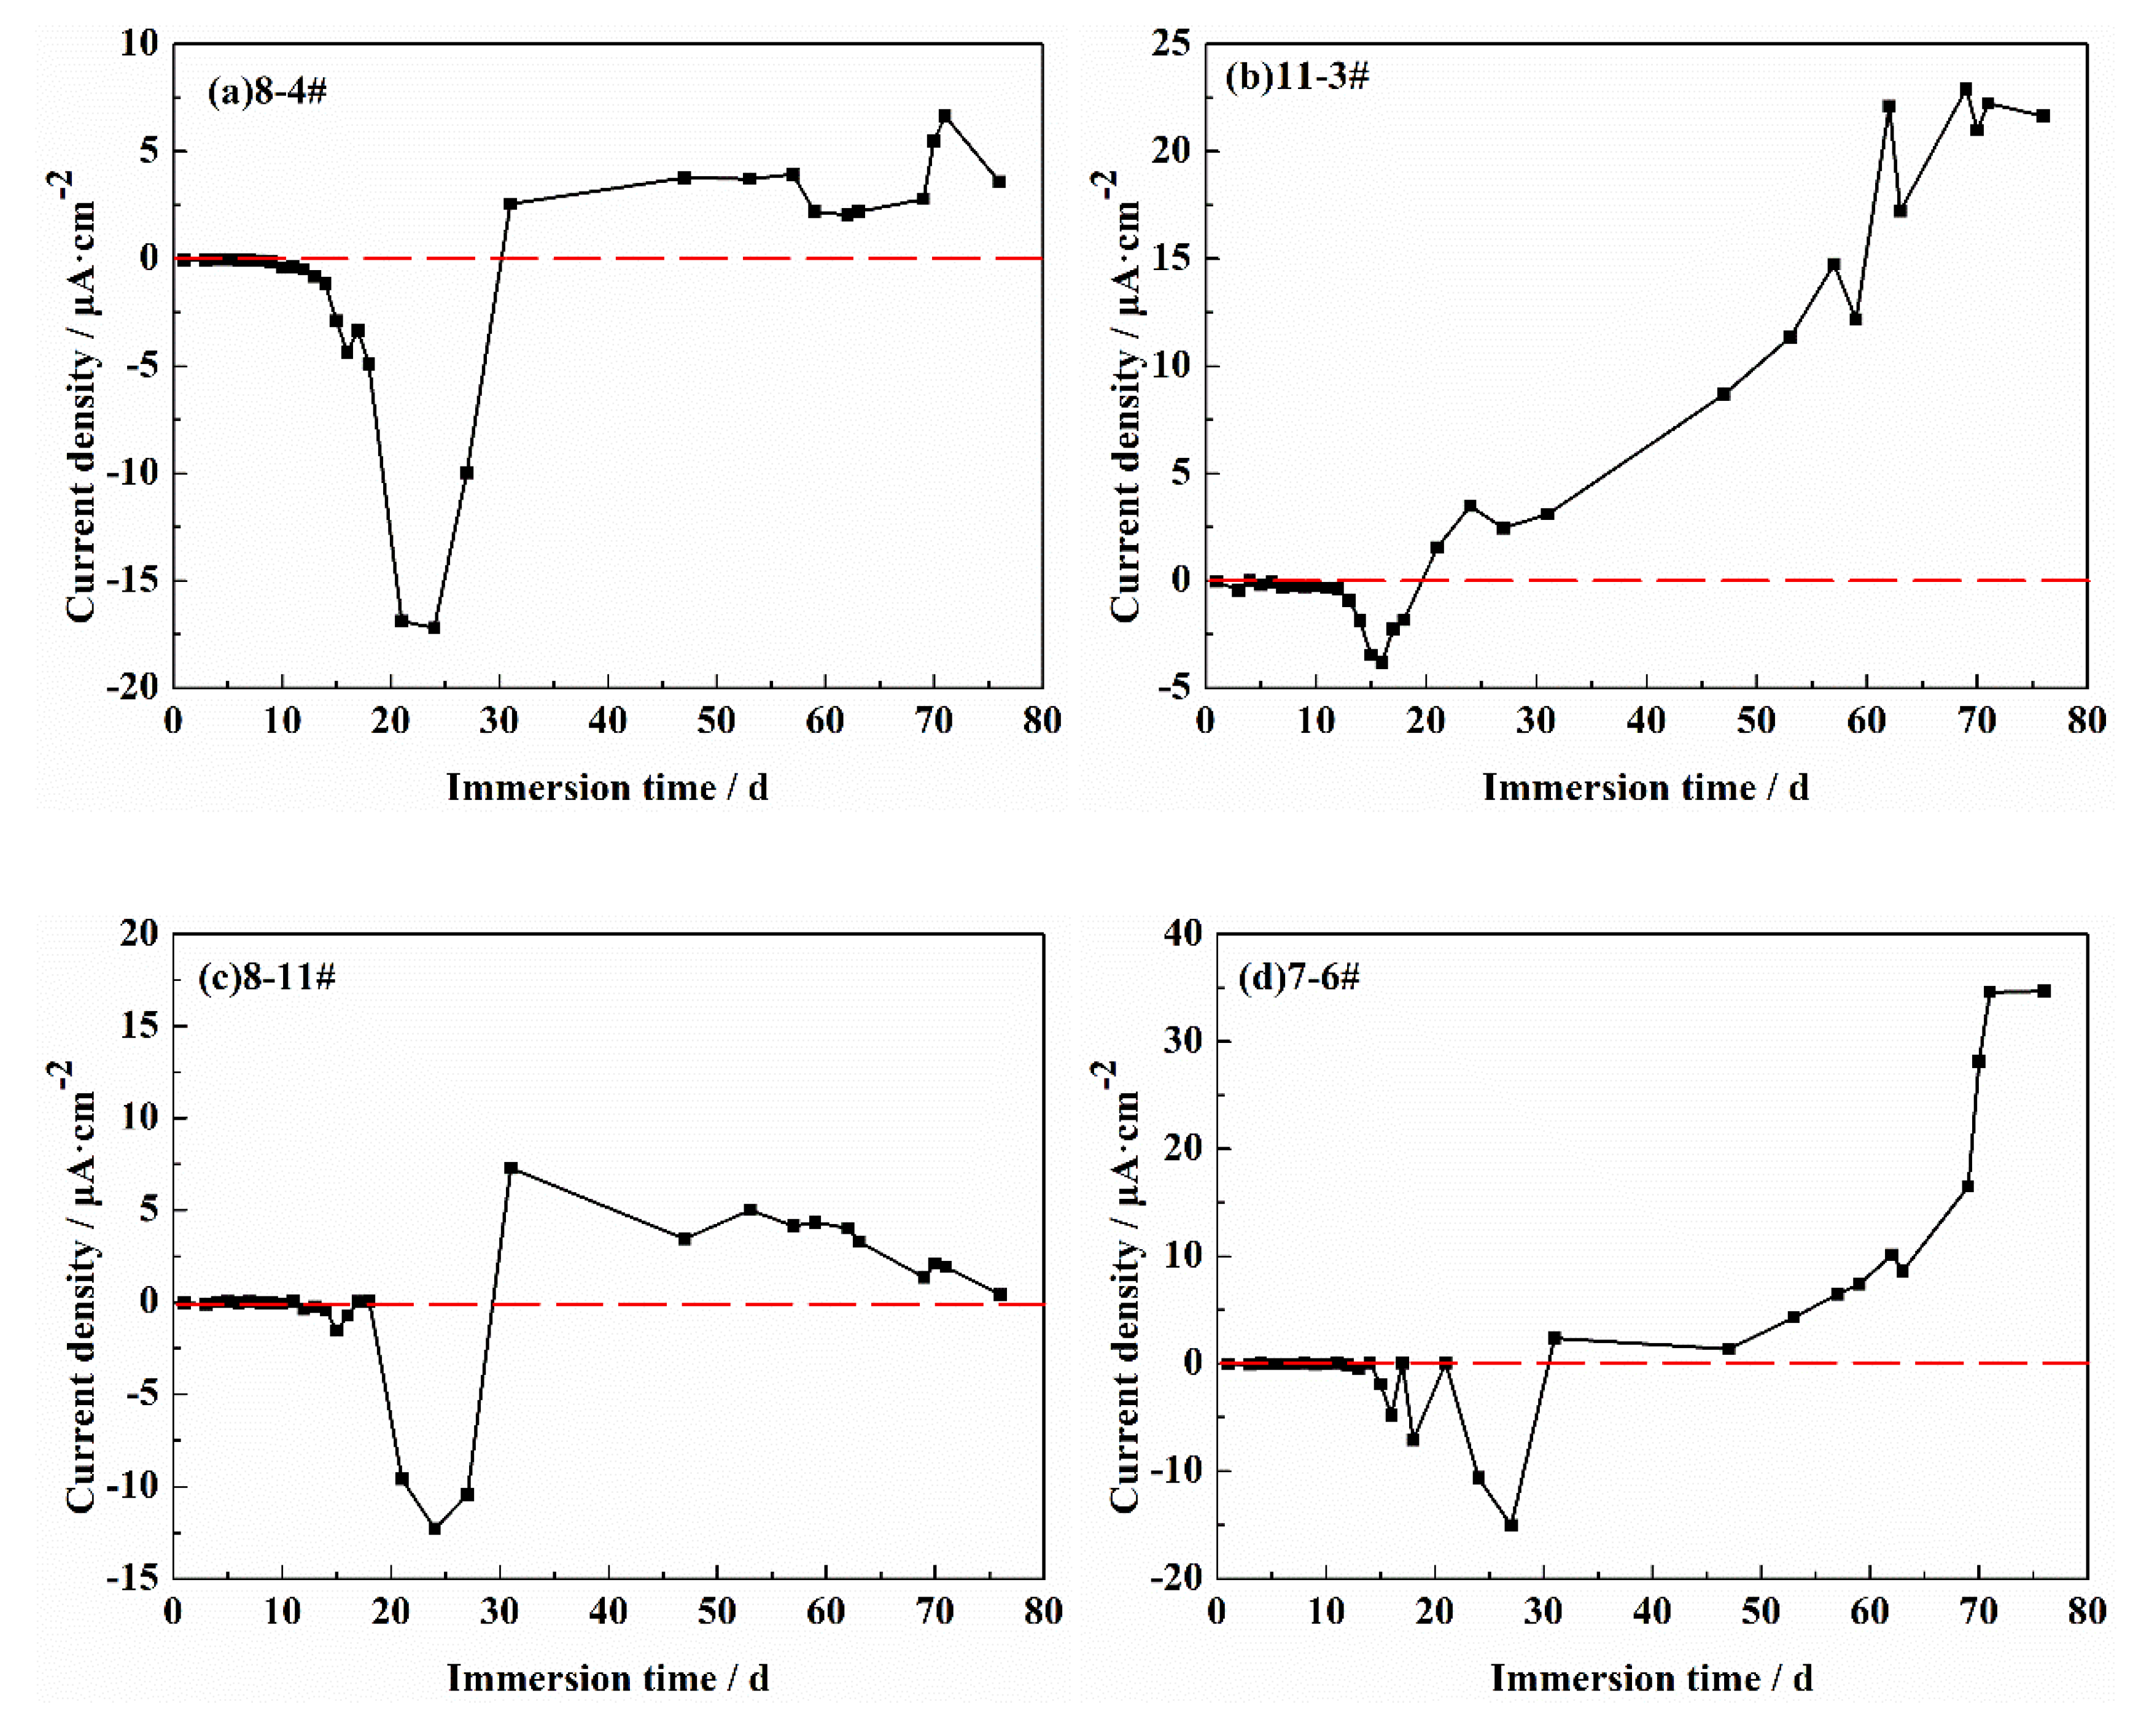
Statistical analysis was performed on all anodic sites (except the initial anodic sites) throughout the experimental period. These sites experienced a period of cathodic current at first and then the anodic current.
Figure 3 demonstrates four electrode sites (8–4#, 11–3#, 8–11#, and 7–6#) as examples. It was concluded that the cathodic reduction reaction of dissolved oxygen in the interface region led to the delamination of the coating from the metal surface and then induced the anodic dissolution of the base metal.
The polarity reversal of the current had been reported under the rust layer and the coating [
11]. Iron in the weak points of the coating acted as the local anode, wherein iron dissolution became prominent. The delaminated part was considered as the local cathode, and within this area, only oxygen reduction took place [
13]. However, the rust was also found to act as a cathodic reactant and further led to the development of new anodes beneath the coating once the rust deposited at the defects or later beneath the coating [
15].
In general, the corrosive galvanic cell circuit could not form between the atmospheric and the immersion region due to the lack of electrolyte solution. Cathode and anode points with high current densities appeared in the gas phase region above the water line (Rows 1 to 3), indicating that there was an ion channel between the area and the bulk solution, forming a galvanic cell surrounding the water line. We proposed that the ion channel should be a thin liquid film on the electrode surface in the atmospheric region.
We speculate that this thin liquid film above the waterline is a “water-absorbing paint film” formed by the capillary action of the cross-linked micropores inside the organic coating. It could also be the result of the Three-Phase Boundary (TPB) spreading upward and the width increasing [
16].
3.2. The Current Density Vector Sum
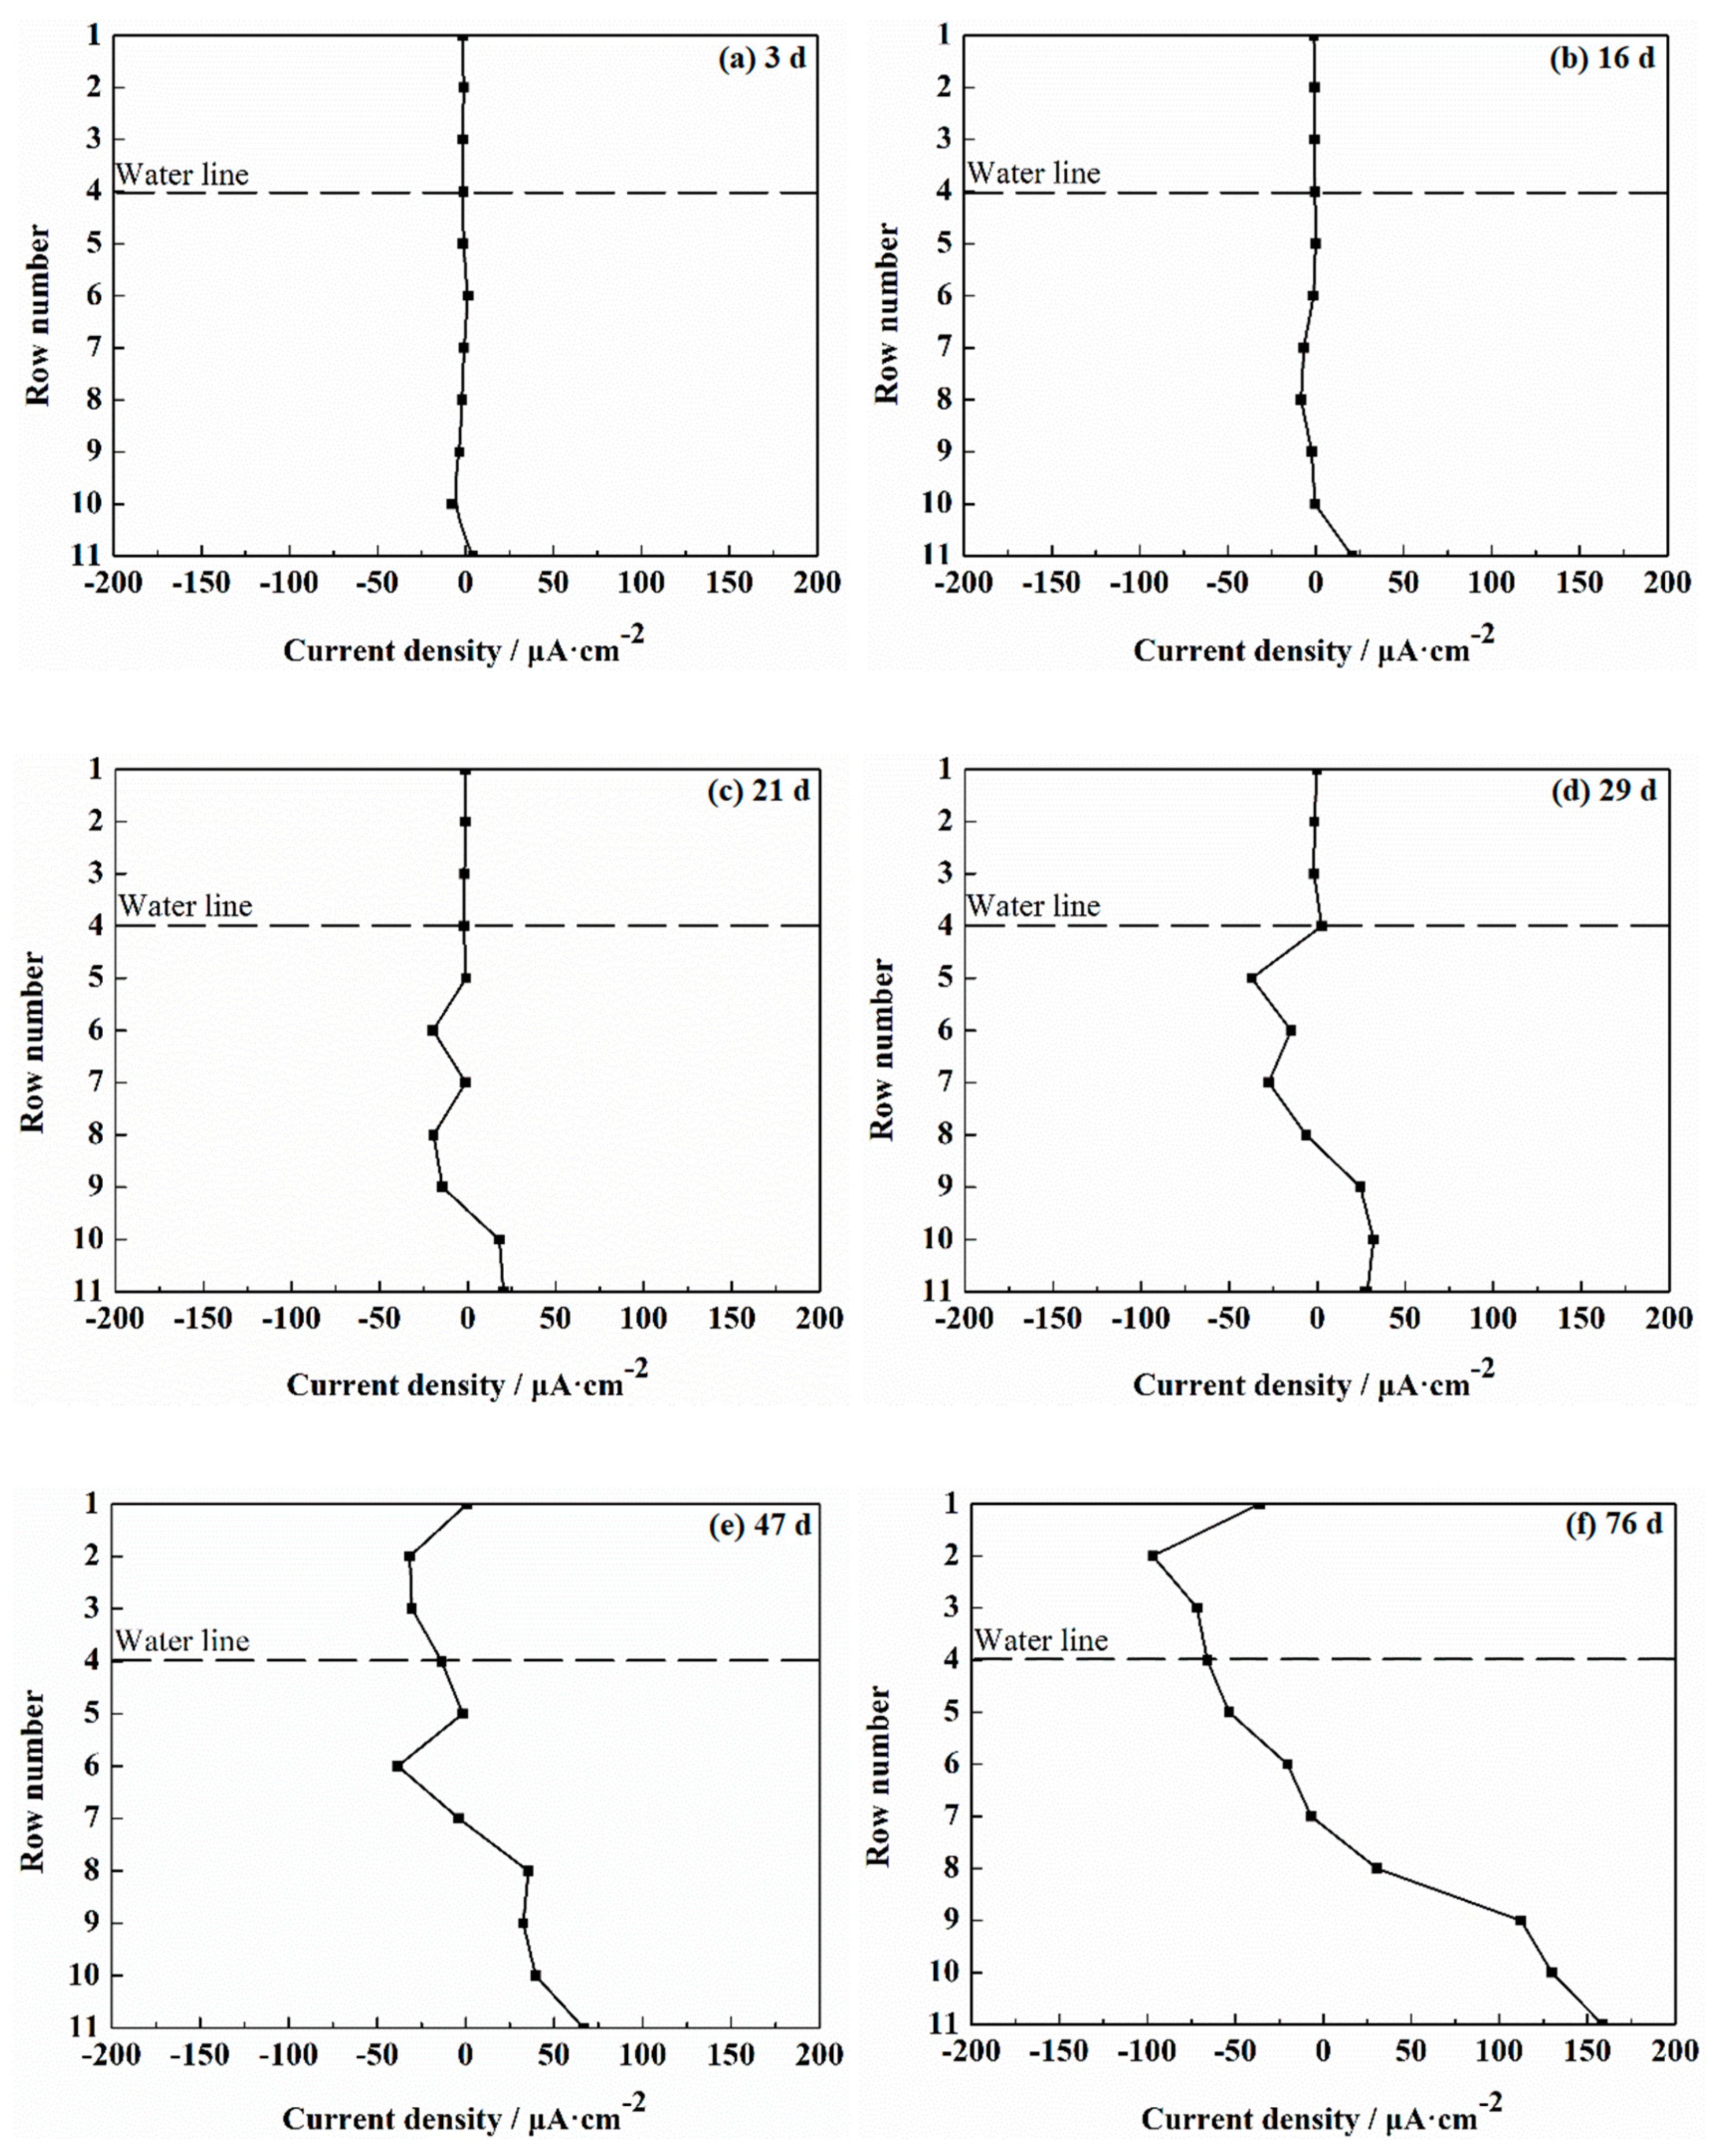
The degradation process of the coating is random under the influence of water penetration. In order to eliminate the impact of this random factor and better understand the effect of DACs, we introduced the concept of single-row current density [
6]. The current density of each row (11 cylinders) was added to obtain the single-row current density.
Figure 4 displays the current density vector sum at various immersion times. It should be noted that if the current density of a row is positive, this does not imply that all the electrodes in the row have an anodic dissolution reaction; the reverse is the same.
As shown in
Figure 4, the cathodic region was initially at the upper portion, while the anodic region was at the lower portion, but both the cathodic and anodic regions gradually expanded toward the water line together. For example, on Day 3, both the cathode and the anode were located in the bottom of the electrode with the 10th row acting as the cathode and the 11th row acting as the anode (
Figure 4a). On Day 16, the cathodic area extended upward to the 7th–10th rows, while the anodic area remained at the 11th row (
Figure 4b). By Day 21, the cathodic region extended upward to the 6th–9th rows. The polarity of the 10th row reversed to the anode; therefore, the anode region extended upward to the 10th and 11th rows. Thereafter, the cathode region continued to expand toward the water line. As the polarity of the cathode bottom reversed, the anode region also gradually expanded upward (
Figure 4c). On Day 29, the cathodic area extended to 5th–8th rows with the polarity reversal in the 9th row. The anodic area was located in the 9th–11th rows (
Figure 4d). The cathodic area expanded to the 2nd–7th rows and began to enter the atmospheric area situated above the water line on Day 47. The polarity of the 8th row reversed to an anode (
Figure 4e). On Day 76, the cathodic area expanded to the 1st–7th rows, and the anodic area was located in the 8th–11th rows (
Figure 4f).
As the cathodic and anodic regions expanded upward, the maximum single-row cathodic and anodic currents increased gradually. When the cathodic sites entered the thin liquid film area on the water line, the vector sums of single-row current density of both the cathode and anode showed rapid increases. For instance, the current density of the 11th row was only 4.3 μA·cm−2 on Day 3, but it rapidly increased to 20.6 μA·cm−2 on Day 16. On Day 29, the anode current density in Row 11 was only 28.4 μA·cm−2 when a cathodic current point was found above the water line. By 47 days, the anode current density had increased rapidly to 66.7 μA·cm−2 as the cathode point spread above the water line. The anode current density reached 158.6 μA·cm−2 on Day 76 when water line was almost completely occupied by the cathode.
Previous results revealed that the thin liquid film zone is a high-speed cathodic reaction region [
17,
18], in which the diffusion rate of oxygen is much higher than that in bulk solution [
19]. Probably, this explains the largest cathode current density reaction zone spotted from Rows 1 to 3 above the water line on Day 76.
The cathodic reaction does not directly involve the loss of the metal substrate. The cathodic reaction is particularly important for two reasons. Firstly, the cathodic reaction was coupled to the anodic reaction. Impeding the cathodic reaction would also impede the anodic reaction. Similarly, accelerating the cathodic reaction would also accelerate the anodic reaction [
20]. Secondly, the cathodic reaction at the coating/metal interface is an important influencing factor that destroys the adhesion between the coating and metal. On Day 76, strong cathodic reaction zones were formed in the 1st–3rd rows. Therefore, the maximum single-row anodic current density in row 11 showed a rapid increase.
3.3. Morphology of the Coating and Substrate Metal Surface
Figure 5 shows the changes in the morphology of the coating and substrate metal surface at various immersion times. The increase in corrosion current was consistent with the increase in the delamination area (also the delamination area) on the coating surface (
Figure 2a–f and
Figure 5a–e). The blisters on the coating surface began to spread from the bottom of the electrode to the upward region with the progress of the cathode reaction on the electrode surface. As the delamination area continued to increase, the area of the exposed base metal increased accordingly, resulting in the gradual increase of the corrosion current.
Oxygen reduction at the coating/metal interface is an important influencing factor that destroys the adhesion between the coating and the metal, leading to the delamination and delamination of coating [
21,
22]. For example, the 8–11# electrode behaved as the cathode for the first 30 days, and the cathode current density increased from 0.4 to 9.6 μA·cm
−2 across Day 12 to Day 21 (
Figure 3c). On the 12th day, the surface coating of 8–11# showed slightly visible blisters and subsequently developed into obvious blisters on the 21st day, as shown in
Figure 5a,b.
However, the interfacial cathodic reaction does not always lead to delamination. For example, the cathode current of the 4–8# electrode was significantly high on Day 21 (
Figure 2c), but no delamination could be observed (
Figure 5b). Until Day 29, the electrode (4–8#) showed a large anode current and blisters appeared (
Figure 2d and
Figure 5c). Although the cathodic reaction can destroy the adhesion between the coating and the metal and cause the coating to peel off, delamination does not occur immediately due to the strong viscoelasticity of organic coating.
The cathode and anode current density distributions measured in the test are in good agreement with the corrosion morphology of the base metal. On the 76th day, the area of the anode current on the electrode surface (designated by the yellow curve) showed corrosion pits of different depths due to the dissolution reaction of the base metal. The surface of the substrate in the cathode reaction zone (outside the yellow curve) was free from corrosion, despite the loss of metallic luster (
Figure 2f and
Figure 5f). The results also directly proved that WBE is a reliable testing technology for studying coating degradation and underlying metal corrosion processes.
3.4. Coating Deterioration and Underlying Metal Corrosion Processes in Water-Line Area
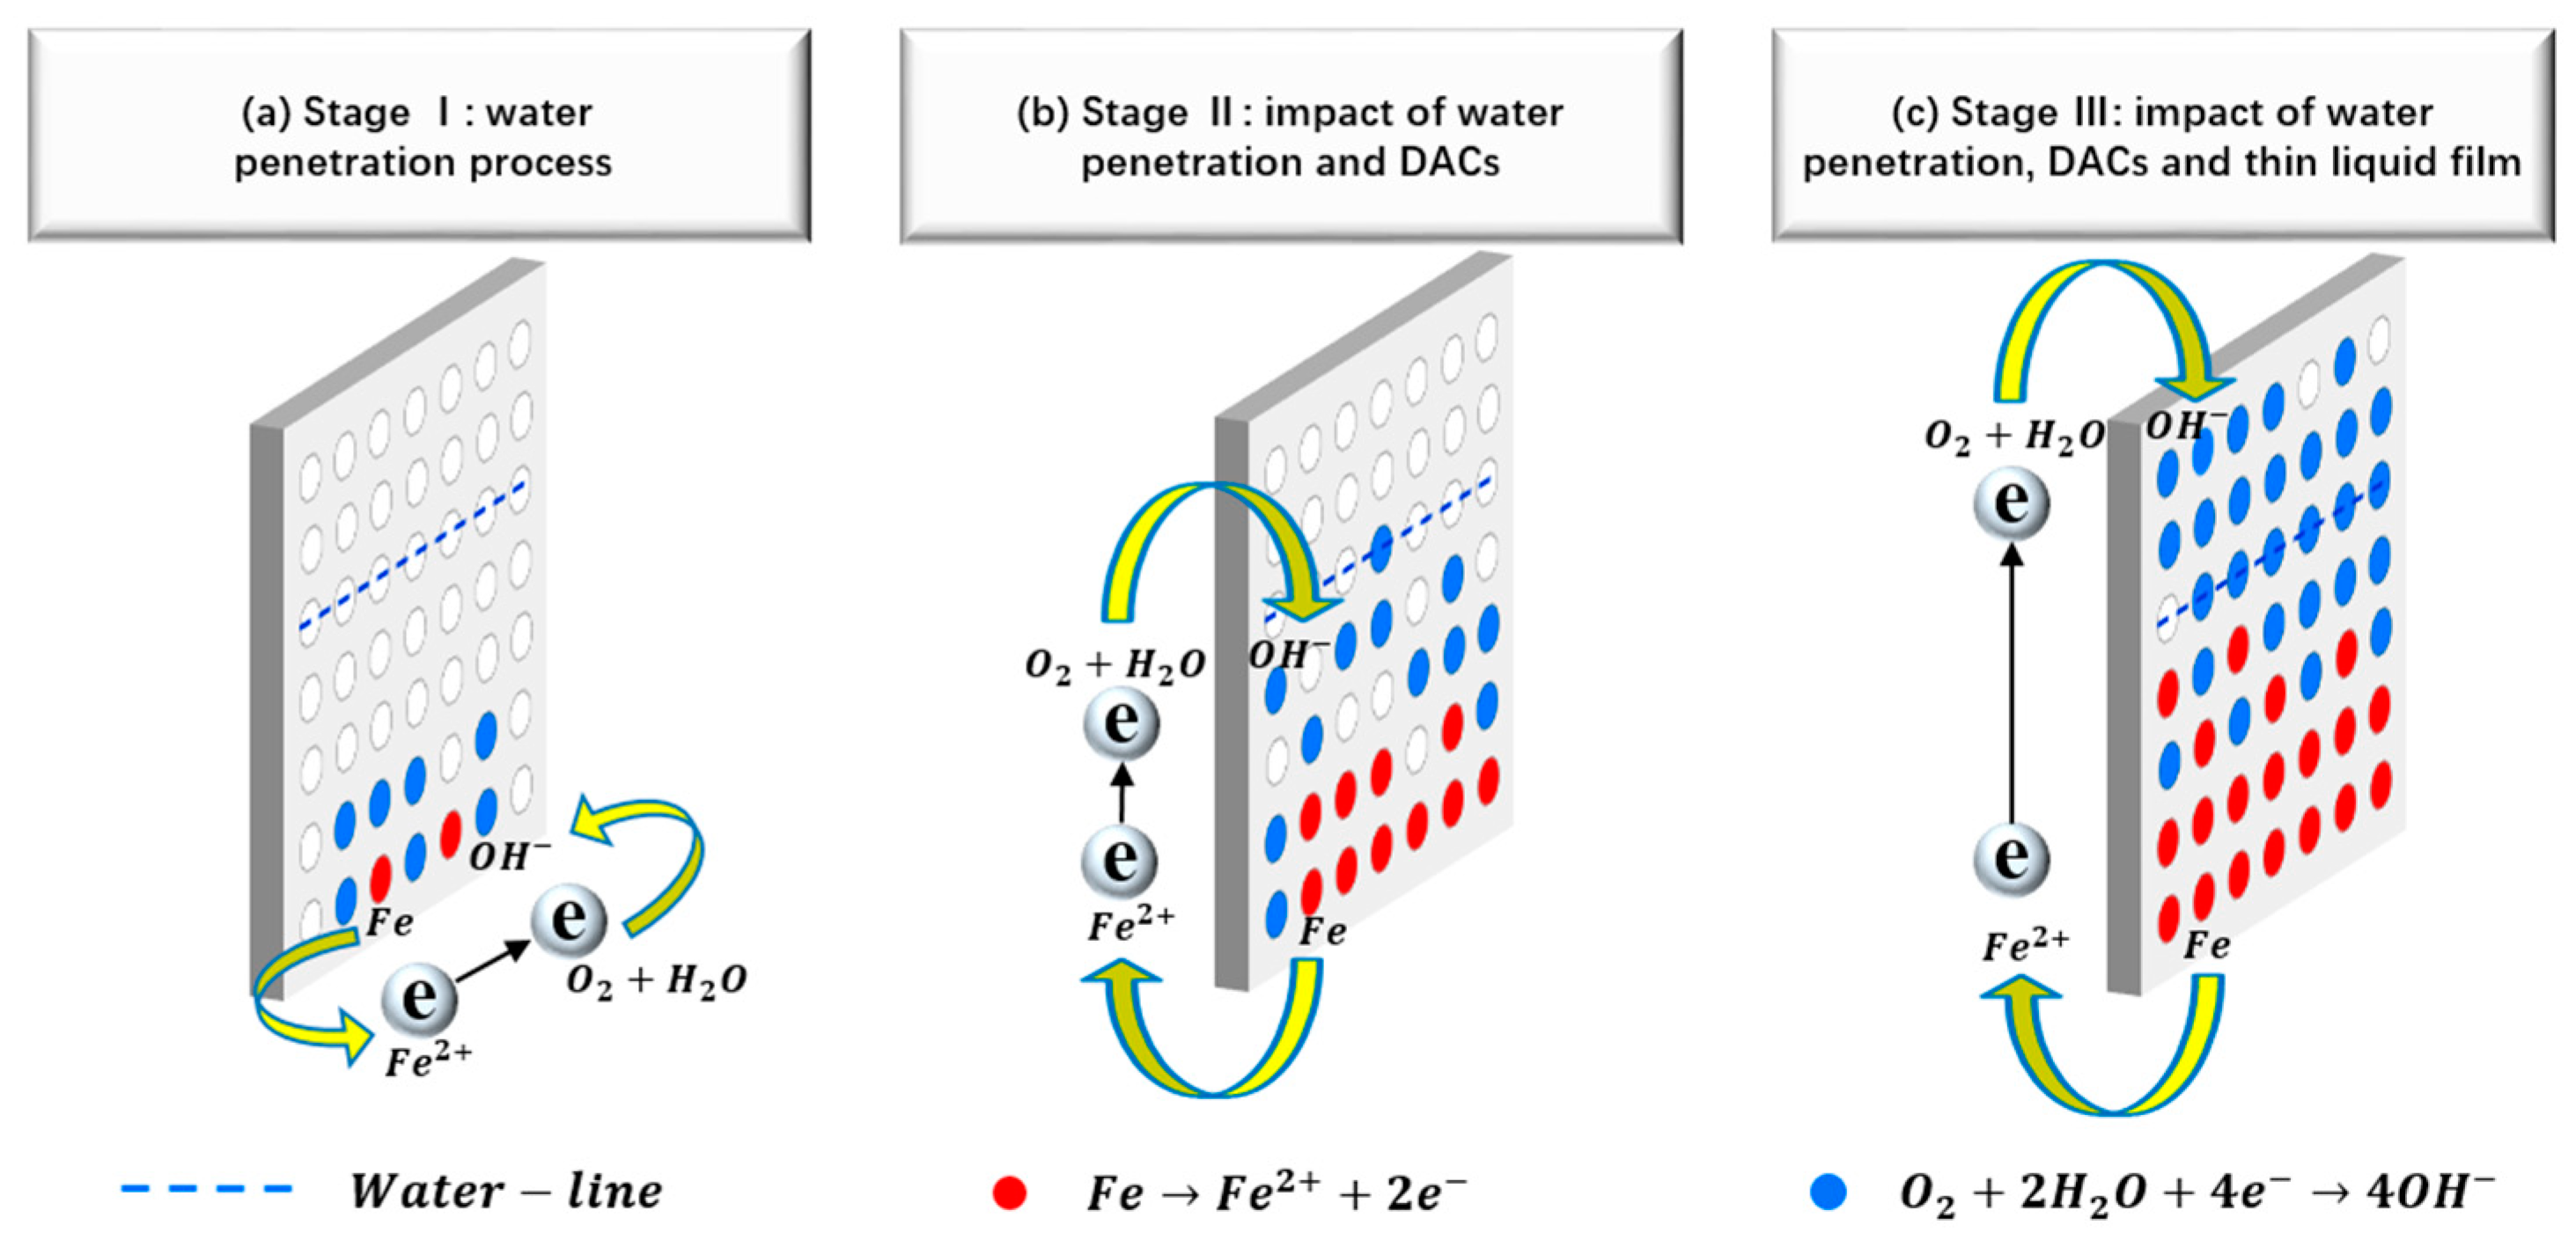
The degradation processes of the organic coating can be divided into three typical stages: water penetration, underlying corrosion initiation and corrosion development and expansion [
9,
23]. The coating degradation processes in the water-line area are mainly affected by water permeation and DACs. The first stage is the process of water penetration, as shown in
Figure 6a. The ionic transport channels of the coating accelerate the water penetration process, and the corrosion of the base metal occurs preferentially [
24]. The second stage is affected by water penetration and DACs, as shown in
Figure 6b. The difference in aeration caused the cathodic reaction to occur adjacent to the water line while the anodic reaction occurred in the lower part [
25]. The last stage is affected by water penetration, DACs, and thin liquid film, as shown in
Figure 6c. When the cathodic zone extended to the gas phase area above the water line, this area becomes the strongest cathodic zone under the action of the thin liquid film. Affected by the non-uniform water penetration process of the coating and the DACs, the process of the coating degradation shows both randomness and regularity.

 ,
, 


