3.1. Waterproof Bonding Layer Properties
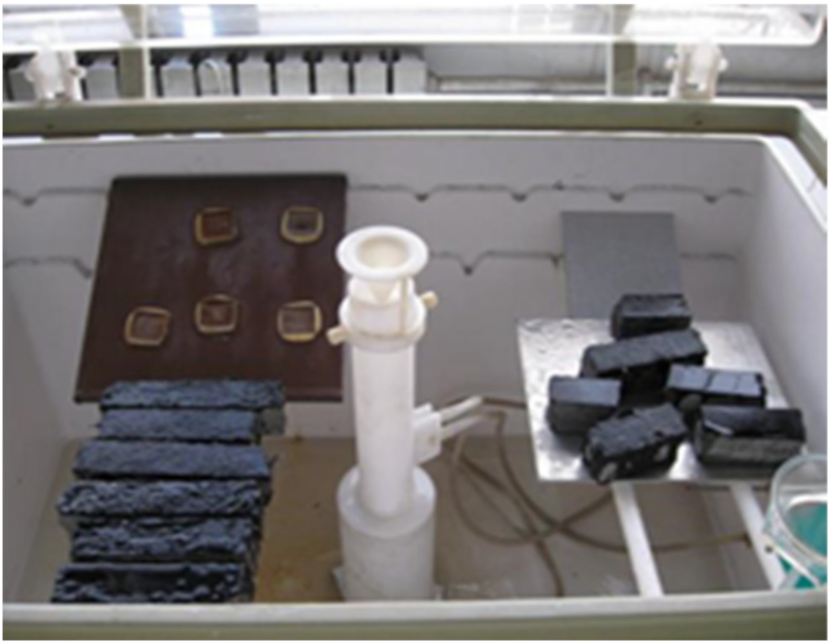
(1) Impermeability of waterproof bonding layer
There was no water seepage in the four waterproof bonding layer structures after water injection for 24 and 48 h. This indicated that the four kinds of waterproof bonding systems had good permeability resistances.
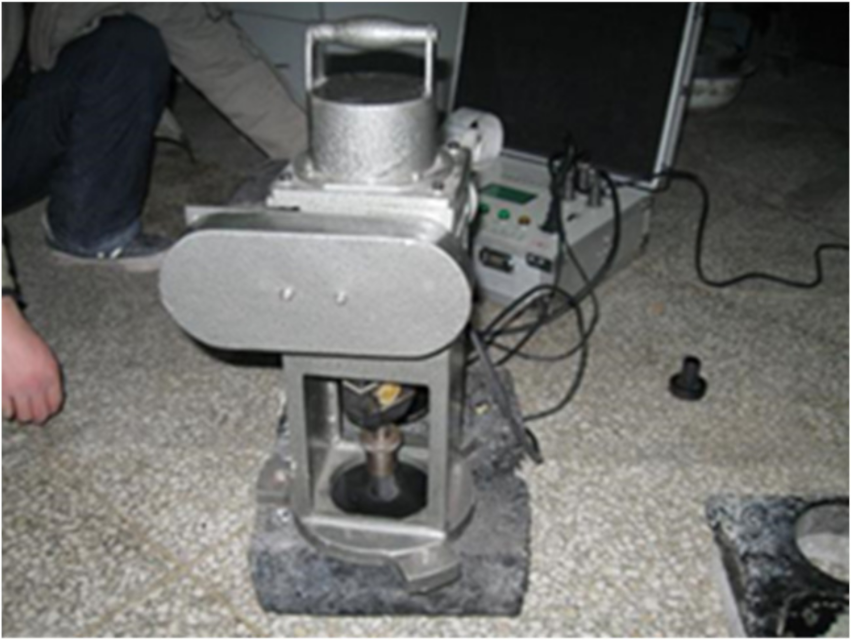
(2) Scalding resistance of waterproof bonding layer
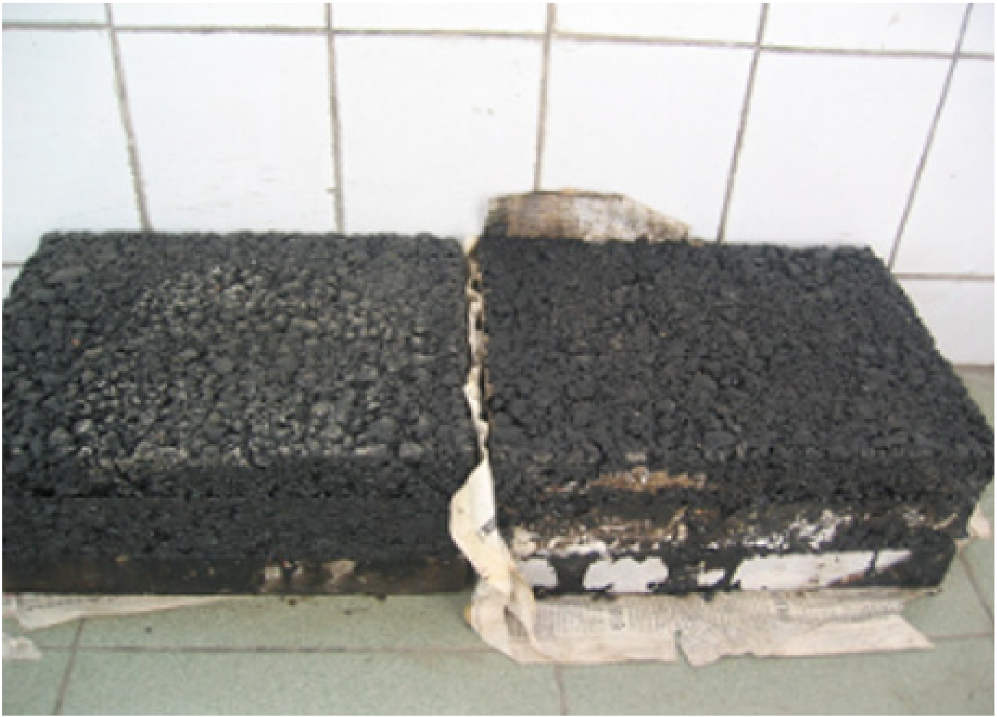
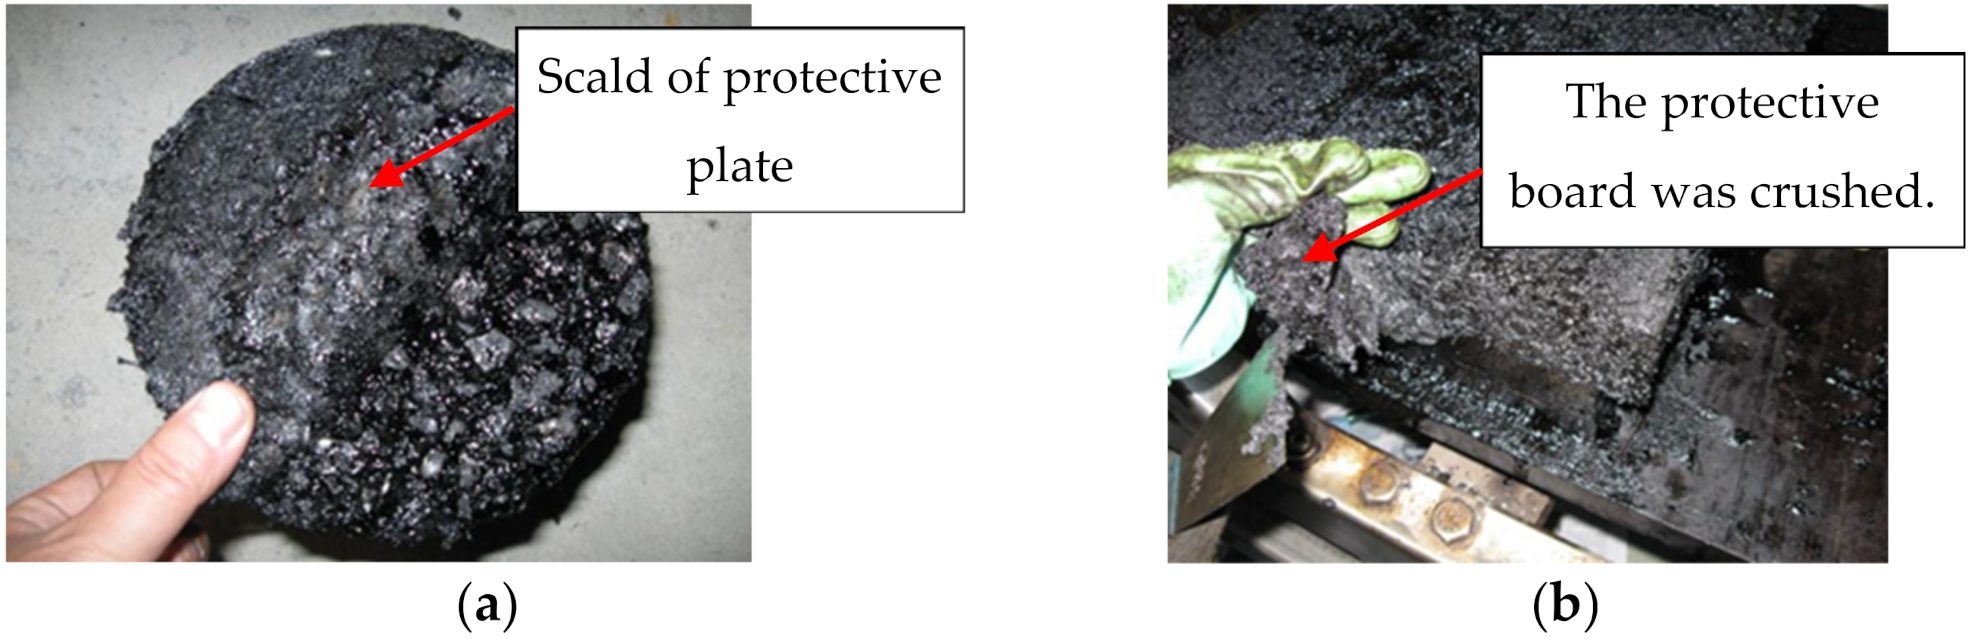
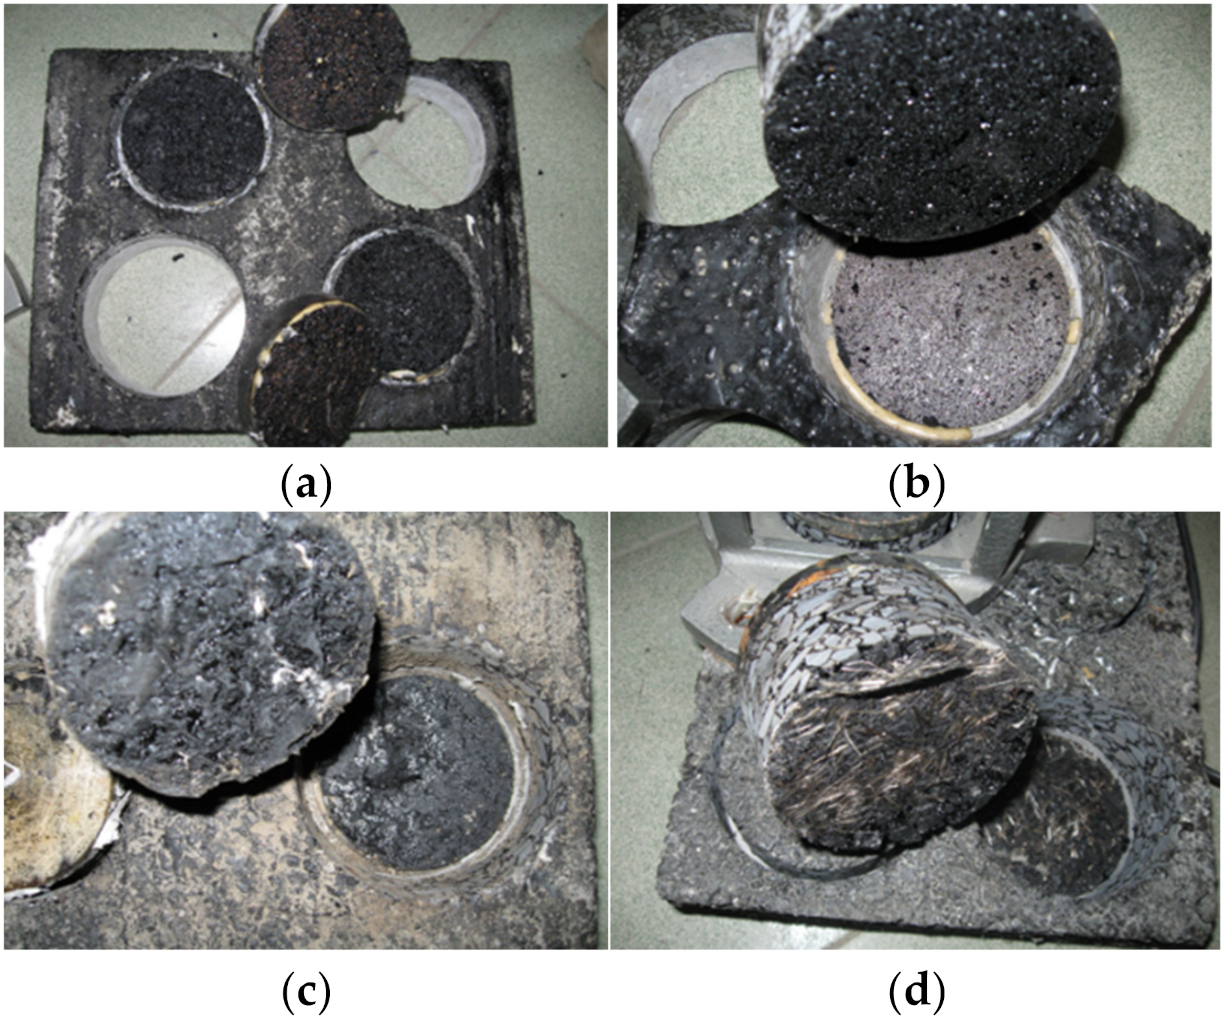
The surface of the waterproof bonding layer had various degrees of damage after rolling. However, the damage of scheme II was the greatest. In the process of rolling, the board that played a protective role was more complicated. When the lower rubber asphalt was less and the concrete slab was relatively flat, the underside of the protective board became scalded as shown in
Figure 9a, and there was a layer of non-sticky fiber plant between the rubber asphalt and the concrete, as shown in
Figure 9b. In most cases, the protective plate was crushed, resulting in local enrichment. The protective plate was much less viscous than rubber asphalt, which could affect the bonding strength between the layers.
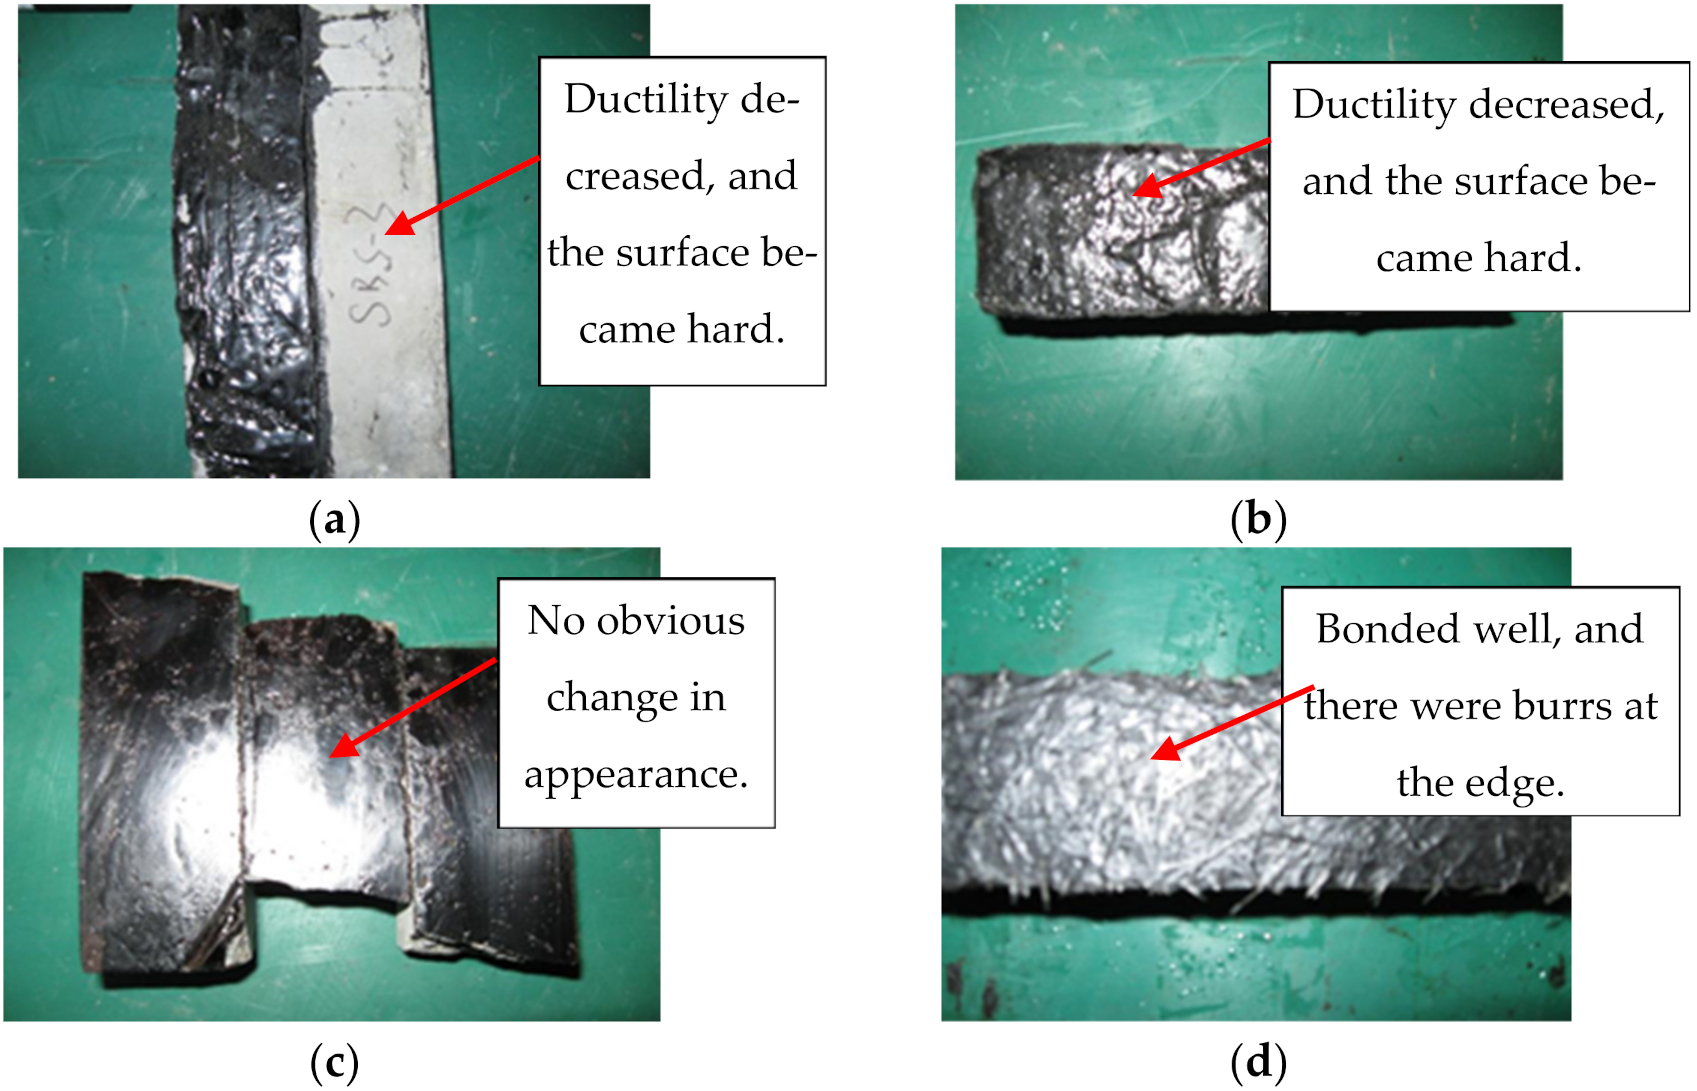
(3) Corrosion resistance of waterproof bonding layer
The test results of the corrosion resistance test are shown in
Figure 10.
As shown in
Figure 10, after repeated freezing and thawing cycles and salt spray corrosion, the four waterproof layers or undercoats were all well connected to the cement concrete bridge deck. However, the surfaces of schemes I and II became hard when pressed with a finger. The reason may have been that the chemical properties and physical composition of SBS–modified asphalt and rubber asphalt changed after the high-temperature and low-temperature cycles, and the viscosity and toughness decreased. There was no significant change of scheme III, indicating that the GIS–I–type primer had strong durability and corrosion resistance. Scheme IV bonded well, and there were burrs at the edge. Therefore, the long-term coupling effects of water, temperature, and salinity would accelerate the deterioration of waterproof layer materials in a short time. Thus, the influence of these factors should be considered in the design of bridge deck pavement structures.
3.2. Interlayer Bonding Characteristics
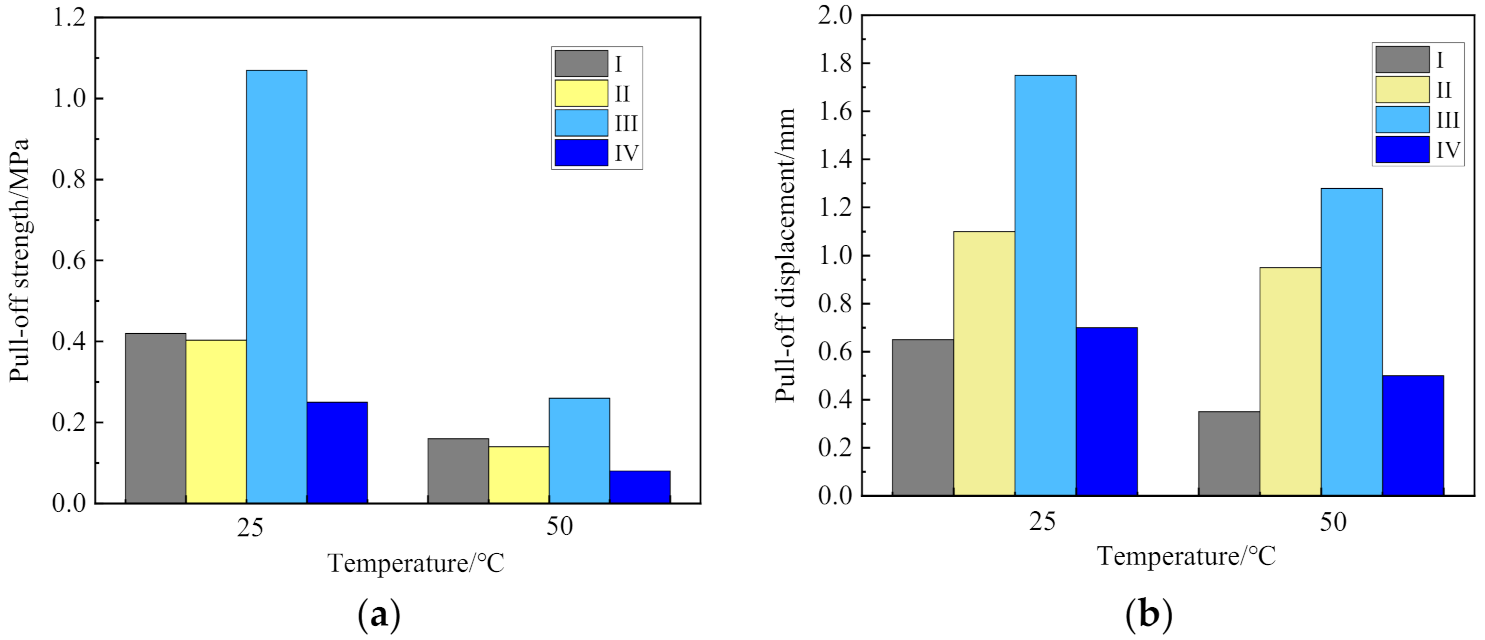
The pull-off test results of the four schemes are shown in
Figure 11, and the section forms after the pull-out test are shown in
Figure 12.
(1) Pull-off strength and deformation
The pull-off strength and deformation of bridge deck pavement scheme III were the largest at 25 and 50 °C. The pull-off strengths of scheme III at 25 °C were about 2.5-, 2.5-, and 4-times those of schemes I, II, and IV, respectively, and the pull-off strengths at 50 °C were about 1.6-, 2-, and 1.6-times those of schemes I, II, and IV, respectively. Hence, the order of the pull-off strengths of the bonding materials in the different schemes was as follows: III > I > II > IV, indicating that the order of the bonding performances between different waterproof bonding composite systems and cement concrete slab was as follows: III > I > II > IV.
The pull-off strengths of schemes I and II were relatively close, and the pull-off strength at 25 °C was greater than that at 0.35 MPa, which could meet the technical requirements of bridge deck pavement in “Technical Specifications for Construction of Highway Asphalt Pavement” (JTG F40–2004). The bonding principles of the two pavement structures were the same. The modified asphalt waterproof membrane achieved a good connection with the cement concrete bridge deck, and the bonding with the upper SMA–13 pavement layer was enhanced by the modified emulsified asphalt layer. However, the high-temperature pull-off test results showed the bonding strength of scheme II decreased rapidly, indicating that the thickness and temperature stability of the asphalt film determined the stability of the bonding layer. Therefore, it is necessary to optimize the distribution of modified asphalt and the appropriate thickness of rubber asphalt during the design of the bridge deck pavement structure.
The pull-off strength of scheme IV was not ideal. The reason may have been that the manual distribution method was used in the indoor tests, which could not accurately simulate the roller brush construction process. This affected the distribution uniformity of alkali-free glass fibers, resulting in partial thickening and strong plate properties and affecting the connection with the upper layer. Otherwise, based on the damage condition after the pull-off tests, the waterproof coating was well connected with the bridge deck. It cracked at the connection with the upper paving layer or between the waterproof layer. This indicated that scheme IV overemphasized the connection with the bridge deck and the overall anti-cracking capacity, while the current distribution amount and number of glass fibers made the waterproof coating too hard, and the contact area with the mixture of the upper paving layer was small. This reduced the pull-off strength between layers.
The pull-off deformation amounts and pull-off strengths of the four schemes at 50 °C were less than those at 25 °C. The variation range of scheme IV was small, which was mainly due to the low-temperature sensitivity of the cold-constructed GIS–I–type primer, and the temperature had little effect on its resistance to pull-off deformation.
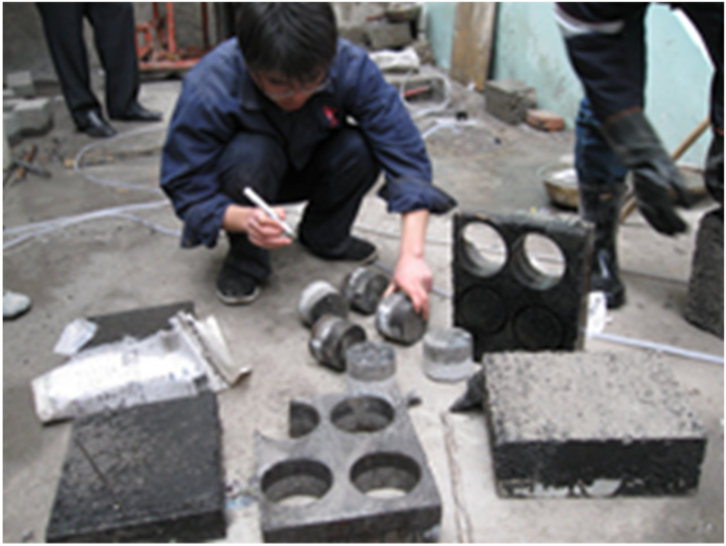
(2) Failure section after pull-off test
The pull-off failure section of scheme III appeared between the pull-off head and the epoxy layer, as shown in
Figure 12c. The reason was that, on the one hand, the GIS–I organic solvent was used as the bonding layer material, which had a strong permeability and improved the surface characteristics of the cement concrete bridge deck. On the other hand, the pouring asphalt concrete had a small porosity, good durability, strong adhesion, and good adaptability with deformation. Thus, it increased the interlayer bonding strength.
3.3. Bridge Deck Pavement Structural Properties
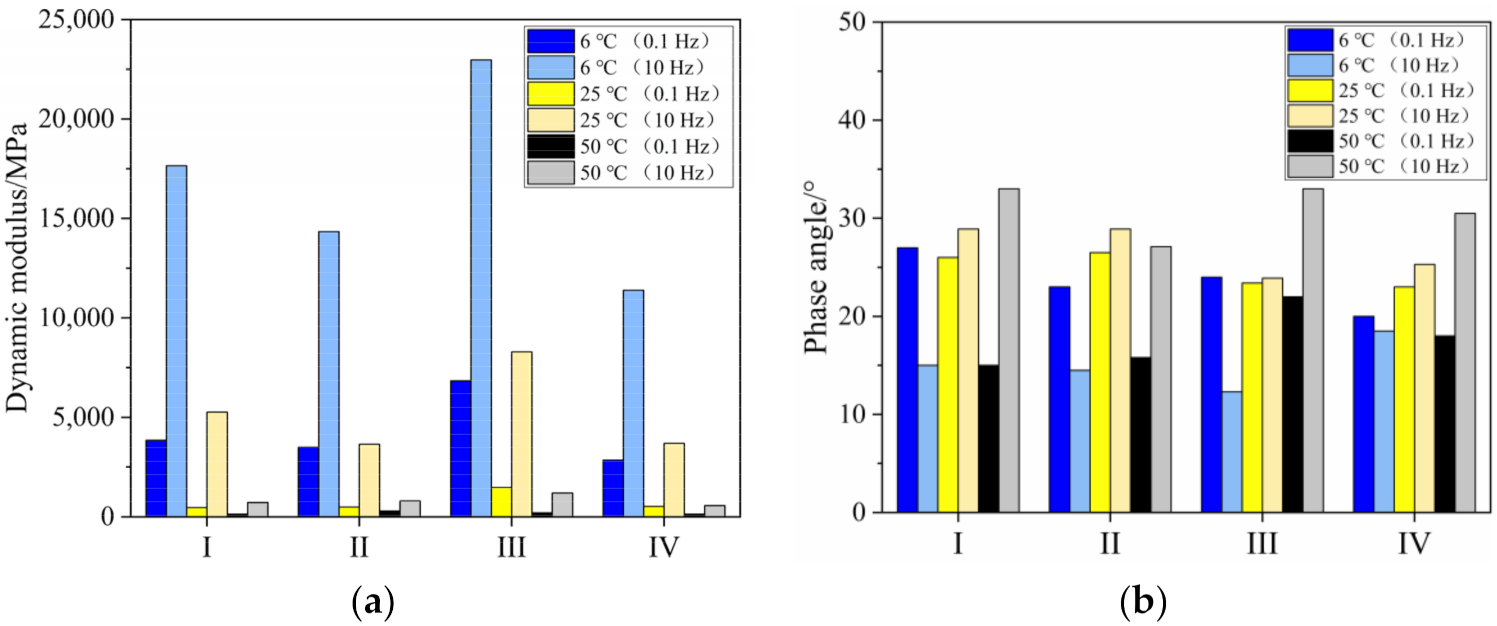
(1) Dynamic mechanical properties
The dynamic modulus test results are shown in
Figure 13.
For the same bridge deck pavement structure, the higher the test temperature was, the smaller the measured value of dynamic modulus was. The higher the test frequency was, the larger the measured value of dynamic modulus was. Hence, the order of the dynamic modulus of the different schemes was as follows: III > I > II > IV. The dynamic modulus of scheme III was higher than those of the other three schemes. The dynamic modulus of scheme III at 6, 25, and 50 °C were, respectively, 1.5–2.4 times, 1.5–3.0 times, and 1–2.2 times those of schemes I, II, and IV. This indicated that scheme III exhibited good dynamic mechanical properties.
With the loading frequencies of 0.1 and 10 Hz, the phase angles of the four bridge deck pavement systems changed between 15–30°, indicating that the viscoelastic properties of the four composite structures were stable in the service temperature range of 6–50 °C, which was very beneficial to the stress of the whole bridge deck pavement structure.
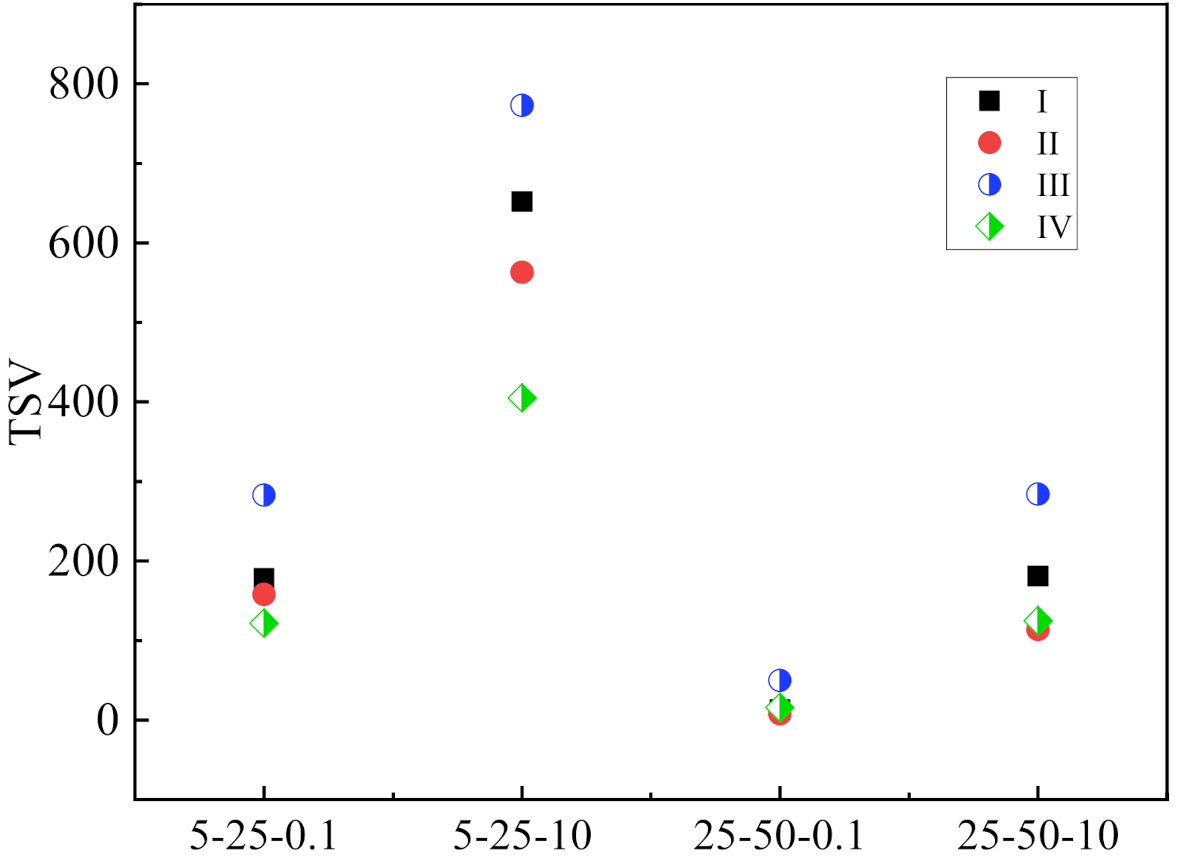
To analyze the influence of the temperature on the dynamic modulus of different bridge deck pavement structures, the temperature-sensitive values (TSVs) of each bridge deck pavement structure with different temperature ranges were calculated. The formula is as follows:
where
and
are the dynamic modulus of the pavement structure at test temperatures
and
j (°C). The calculation results are shown in
Figure 14.
The TSVs of scheme III in the low- and high-temperature ranges were greater than those of the other three schemes, indicating that scheme III’s dynamic mechanical properties were greatly affected by the temperature. Although scheme III had good comprehensive properties in the medium-temperature region, it was still possible to be brittle at low temperatures and creep at high temperatures. This may have been caused by the high asphalt content of GA–10. The TSVs of schemes I and IV were less than those of the other three schemes, indicating that schemes I and IV had good temperature stability.
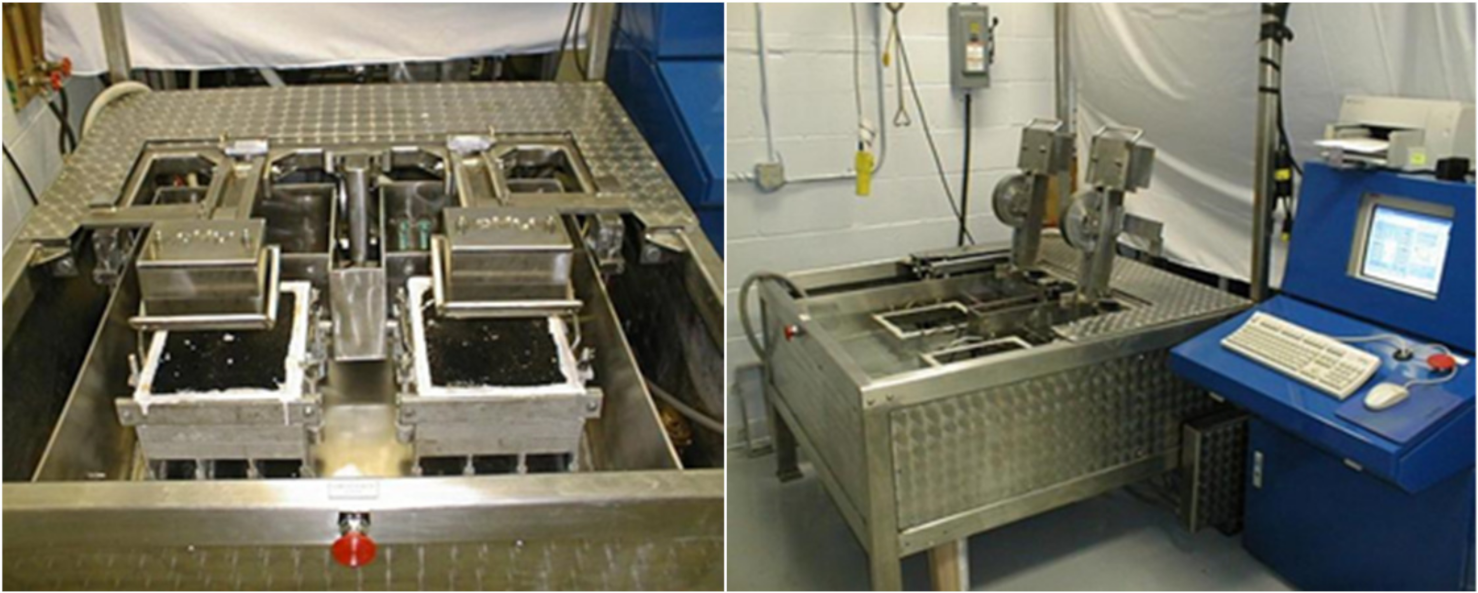
(2) Water-temperature stability
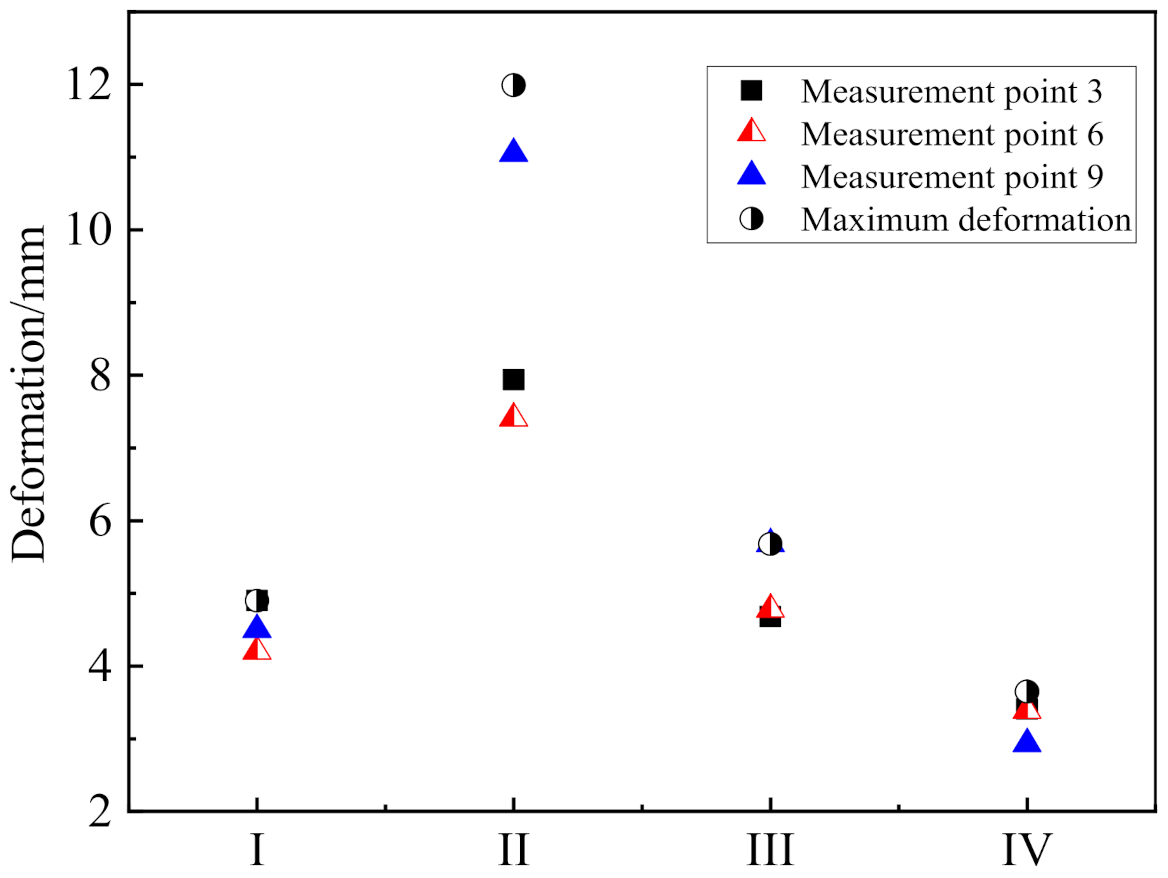
Until the Hamburg wheel tracking test stopped after 20,000 loading cycles, inflection points of the four bridge deck pavement systems did not appear, so the peeling inflection points were not obtained. The Hamburg wheel tracking test system automatically recorded the deformation of 12 points of the left and right wheel ruts, and the maximum deformation generally occurred near point 6. Therefore, the rutting depth and maximum rutting depth of each structure at points 3, 6, and 9 were collected, and the data are shown in
Figure 15.
Figure 15 shows that the maximum deformation and the deformation at measurement point 9 of scheme II were larger than 10 mm, while the deformation values of the other three schemes did not exceed 8 mm, indicating that the water-temperature stability of scheme II was poor. Thus, it was not suitable for high-temperature environments.
The order of the deformation amounts of the different schemes were as follows: II > III > I > IV, indicating that the order of the water stabilities of the different waterproof bonding composite systems were as follows: IV > I > III > II. The deformation of scheme I was between 4–5 mm, that of scheme III was between 4.5–6 mm, and that of scheme IV was the smallest, between 2.5–3.5 mm. These results indicated that the water temperature stabilities of schemes I, III, and IV were good. Scheme IV showed an excellent water temperature stability. The reason may be that the fibers played a reinforcement role, effectively improving the overall strength of the waterproof bonding layer and the puncture resistance during construction. Furthermore, it could adapt to the dynamic load and the compression and tensile characteristics of the bridge, and it exhibited good waterproof performances and corrosion resistance.
(3) Static mechanical properties
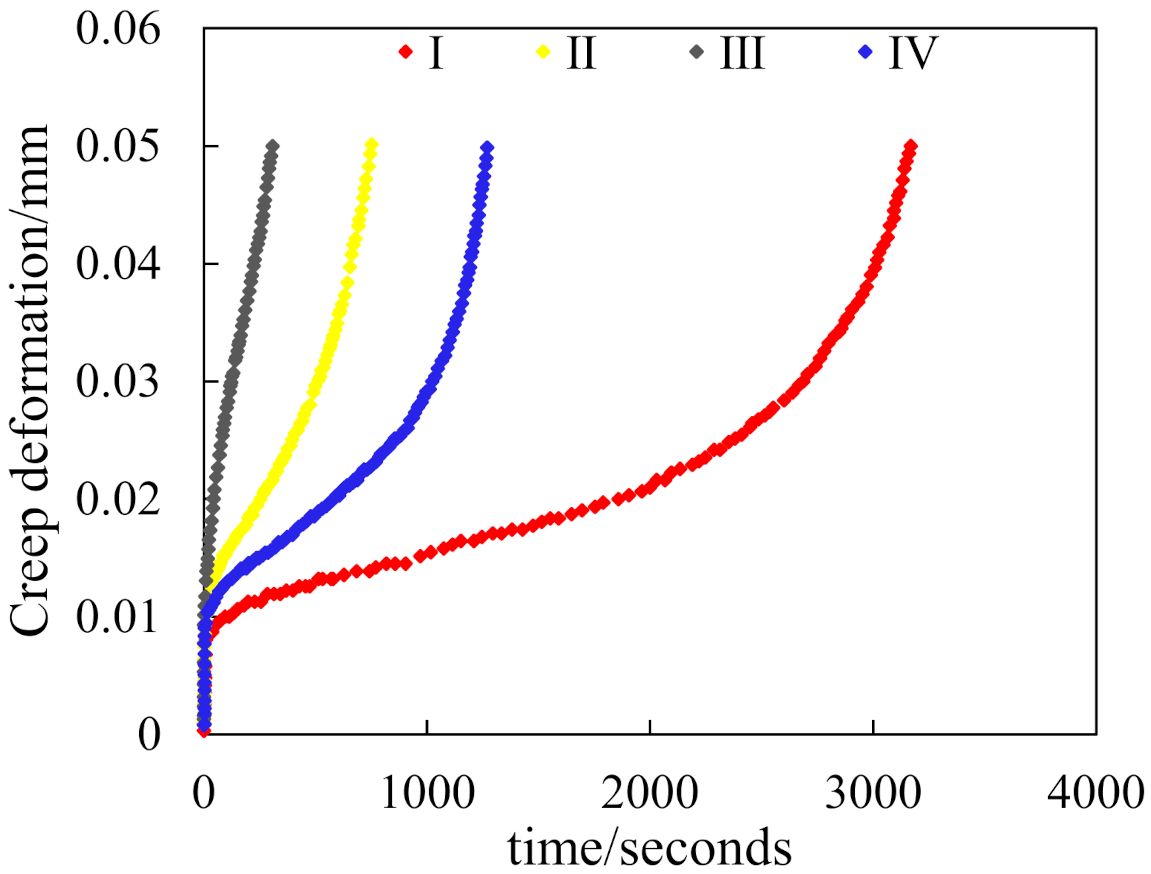
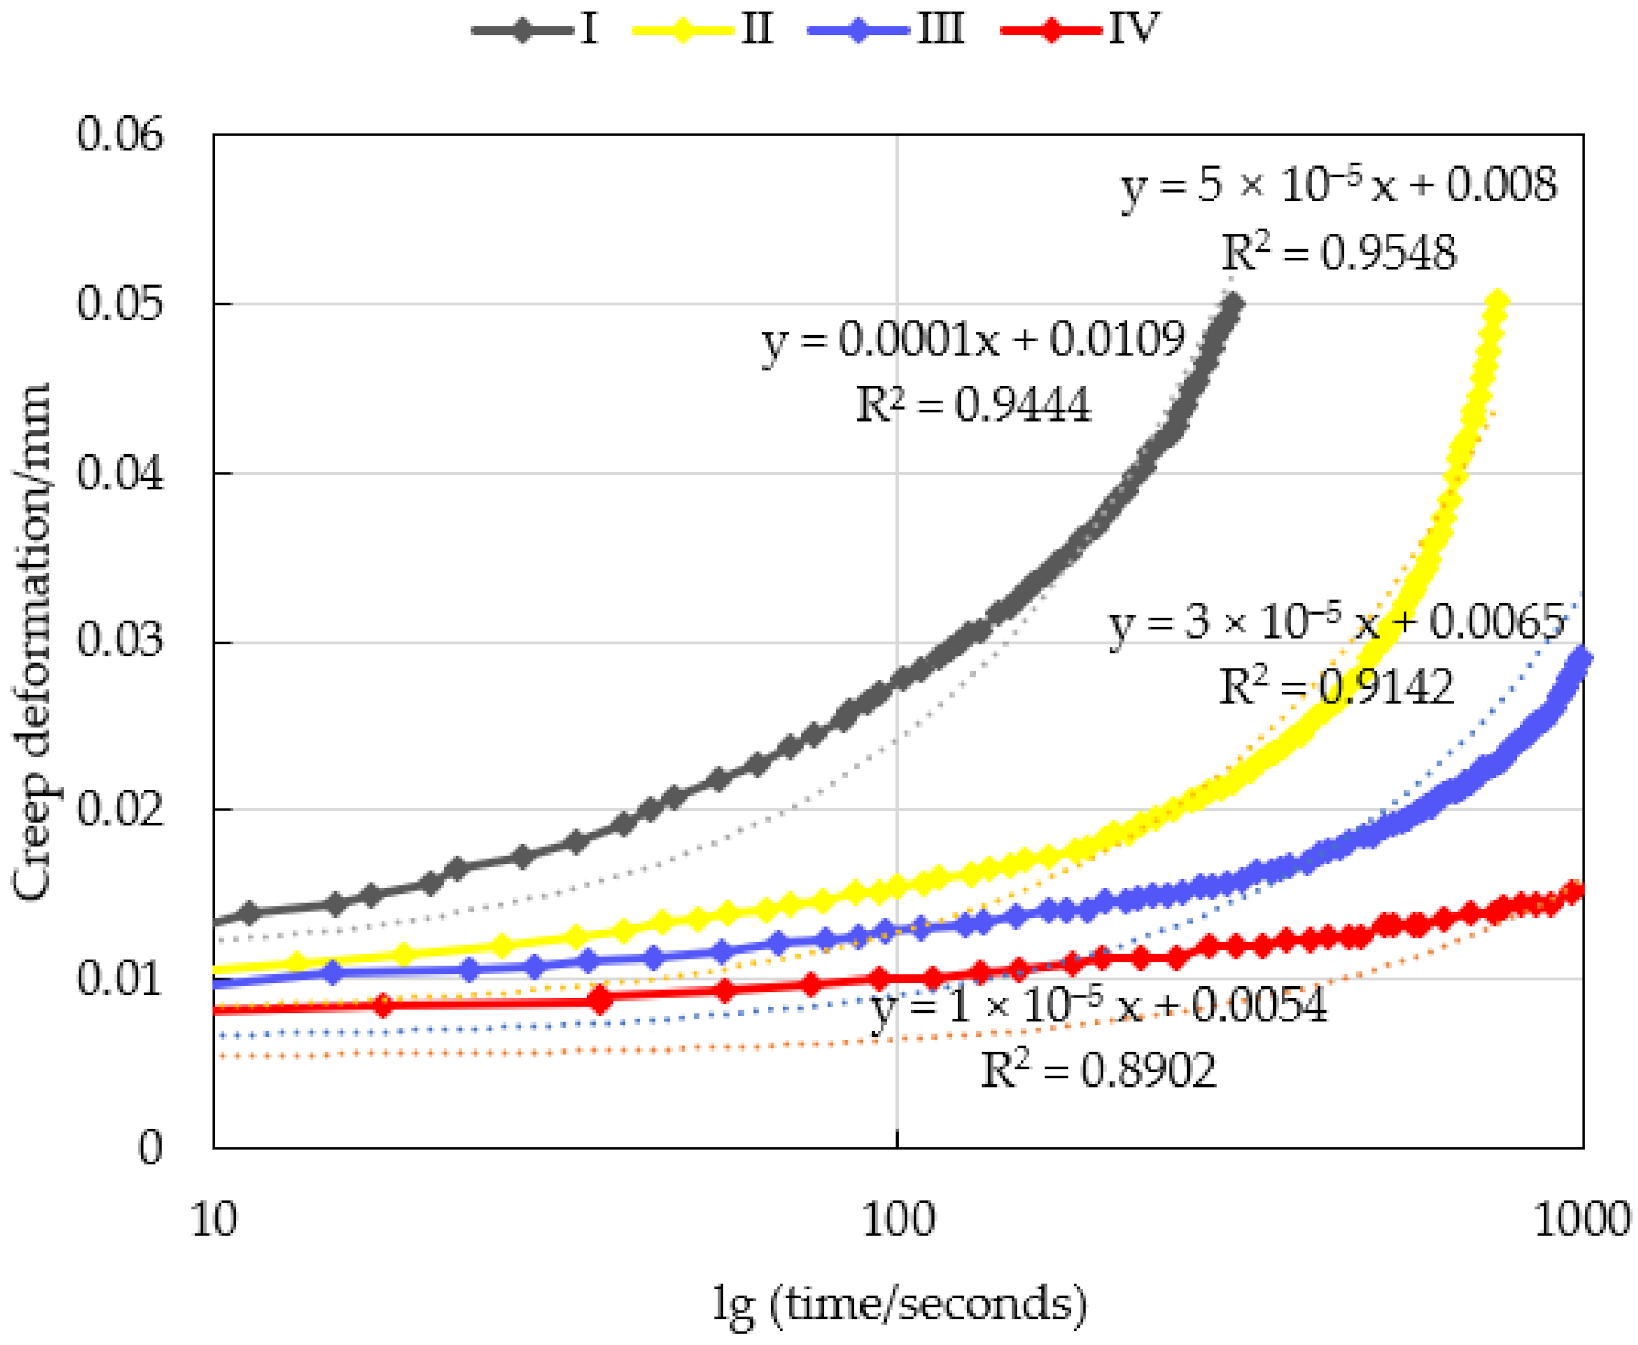
Figure 16 shows the creep deformation and time curves of the four schemes measured by static load creep test. Although the creep deformation increases of different schemes were different at 50 °C, the variations were consistent. If the relationship between the creep deformation and time before rheology was plotted on semi-logarithmic coordinates, there was a good linear relationship between them, the linear correlation formulas were shown in
Figure 17. Thus, according to the linear correlation formulas the creep deformation of the four structures can be predicted easily.
The creep deformation amounts of the four schemes under load went through three stages. First, in the migration period, the deformation increased quickly with time. Second, in the stable period, the deformation increased steadily. Third, the deformation increased rapidly with time until failure. The rheological time was defined as the time when the total volume did not change, that is, the beginning of the third stage was the rheological point, and the corresponding time was the rheological time (Ft). Thus, the Ft values of the four schemes were calculated, as shown in
Table 7.
The rheological time of scheme IV was the longest, and it was 4.5-, 5.5-, and 1.8-times those of schemes I, II, and III, respectively. The rheological time of scheme III was about 2.5- and 3.0-times greater than that of schemes I and II, respectively, indicating that the schemes III and IV had strong high-temperature deformation resistances. Scheme II had the weakest high-temperature deformation resistance. This result was consistent with the test conclusion of the Hamburg rutting test. Therefore, when the ambient temperature was high, scheme III is recommended.


