
Analyzing Pore Evolution Characteristics in Cementitious Materials Using a Plane Distribution Model

 ,
,
Abstract
:1. Introduction
2. Materials and Methods
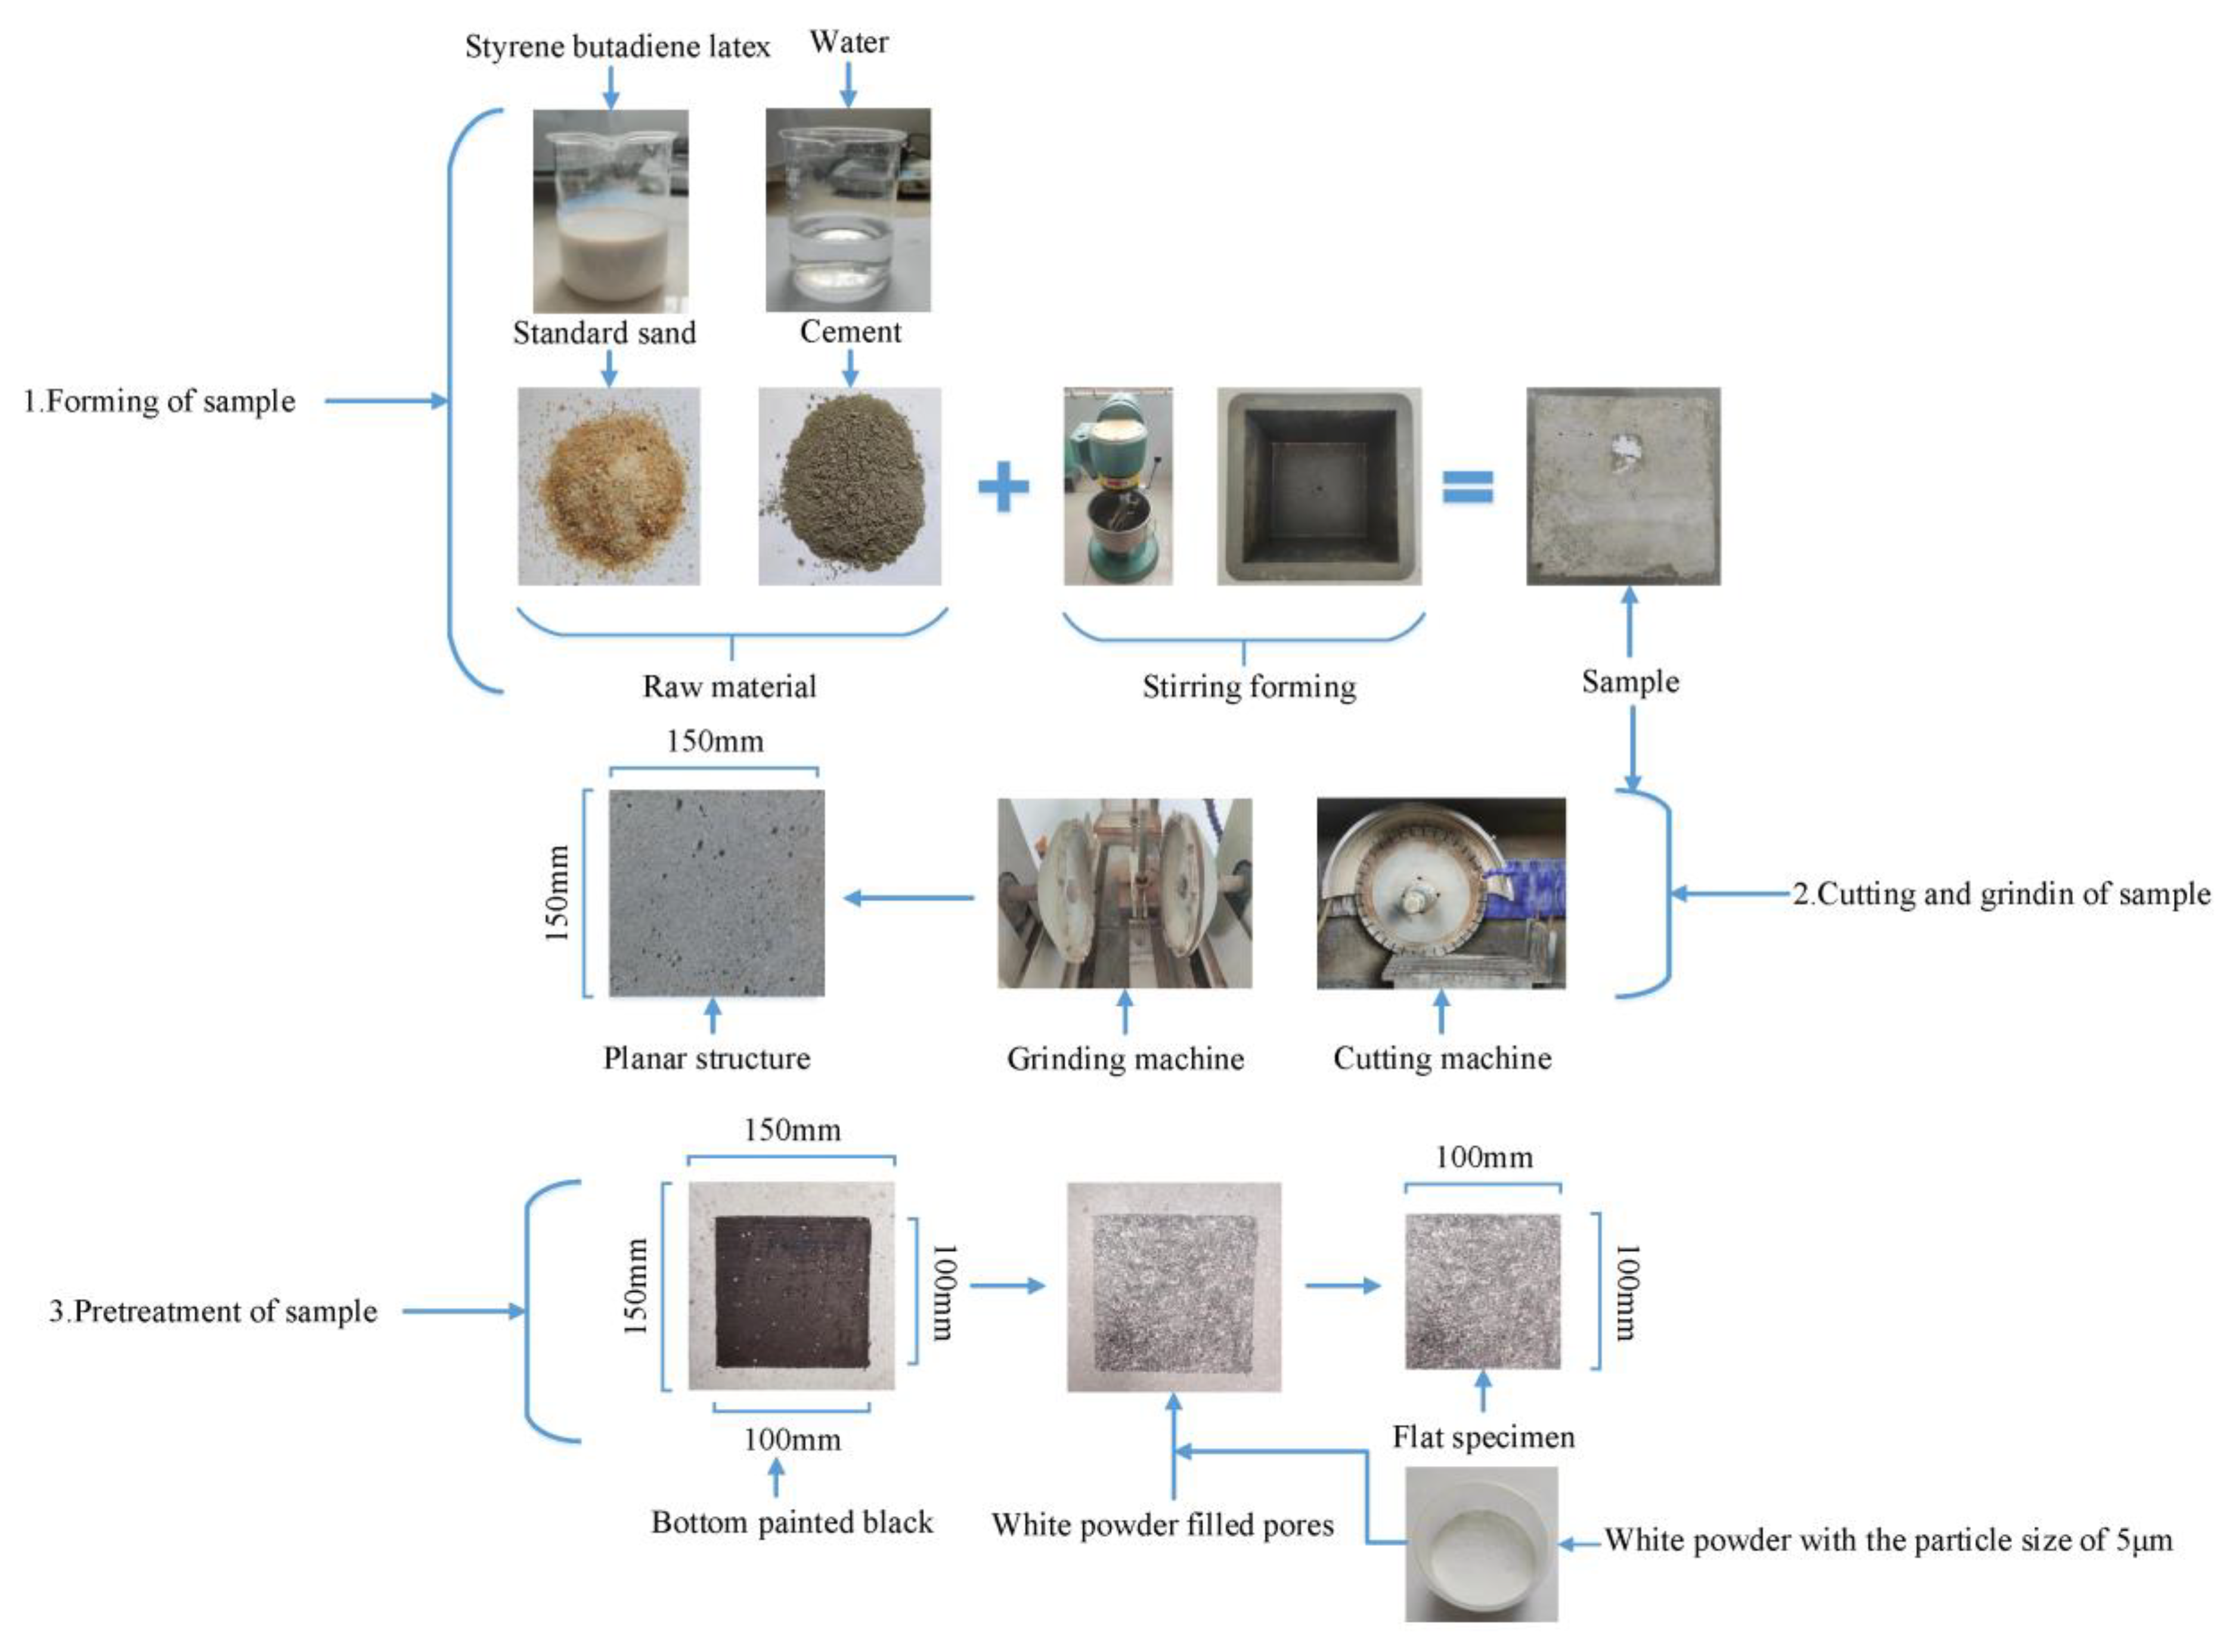
2.1. Raw Materials
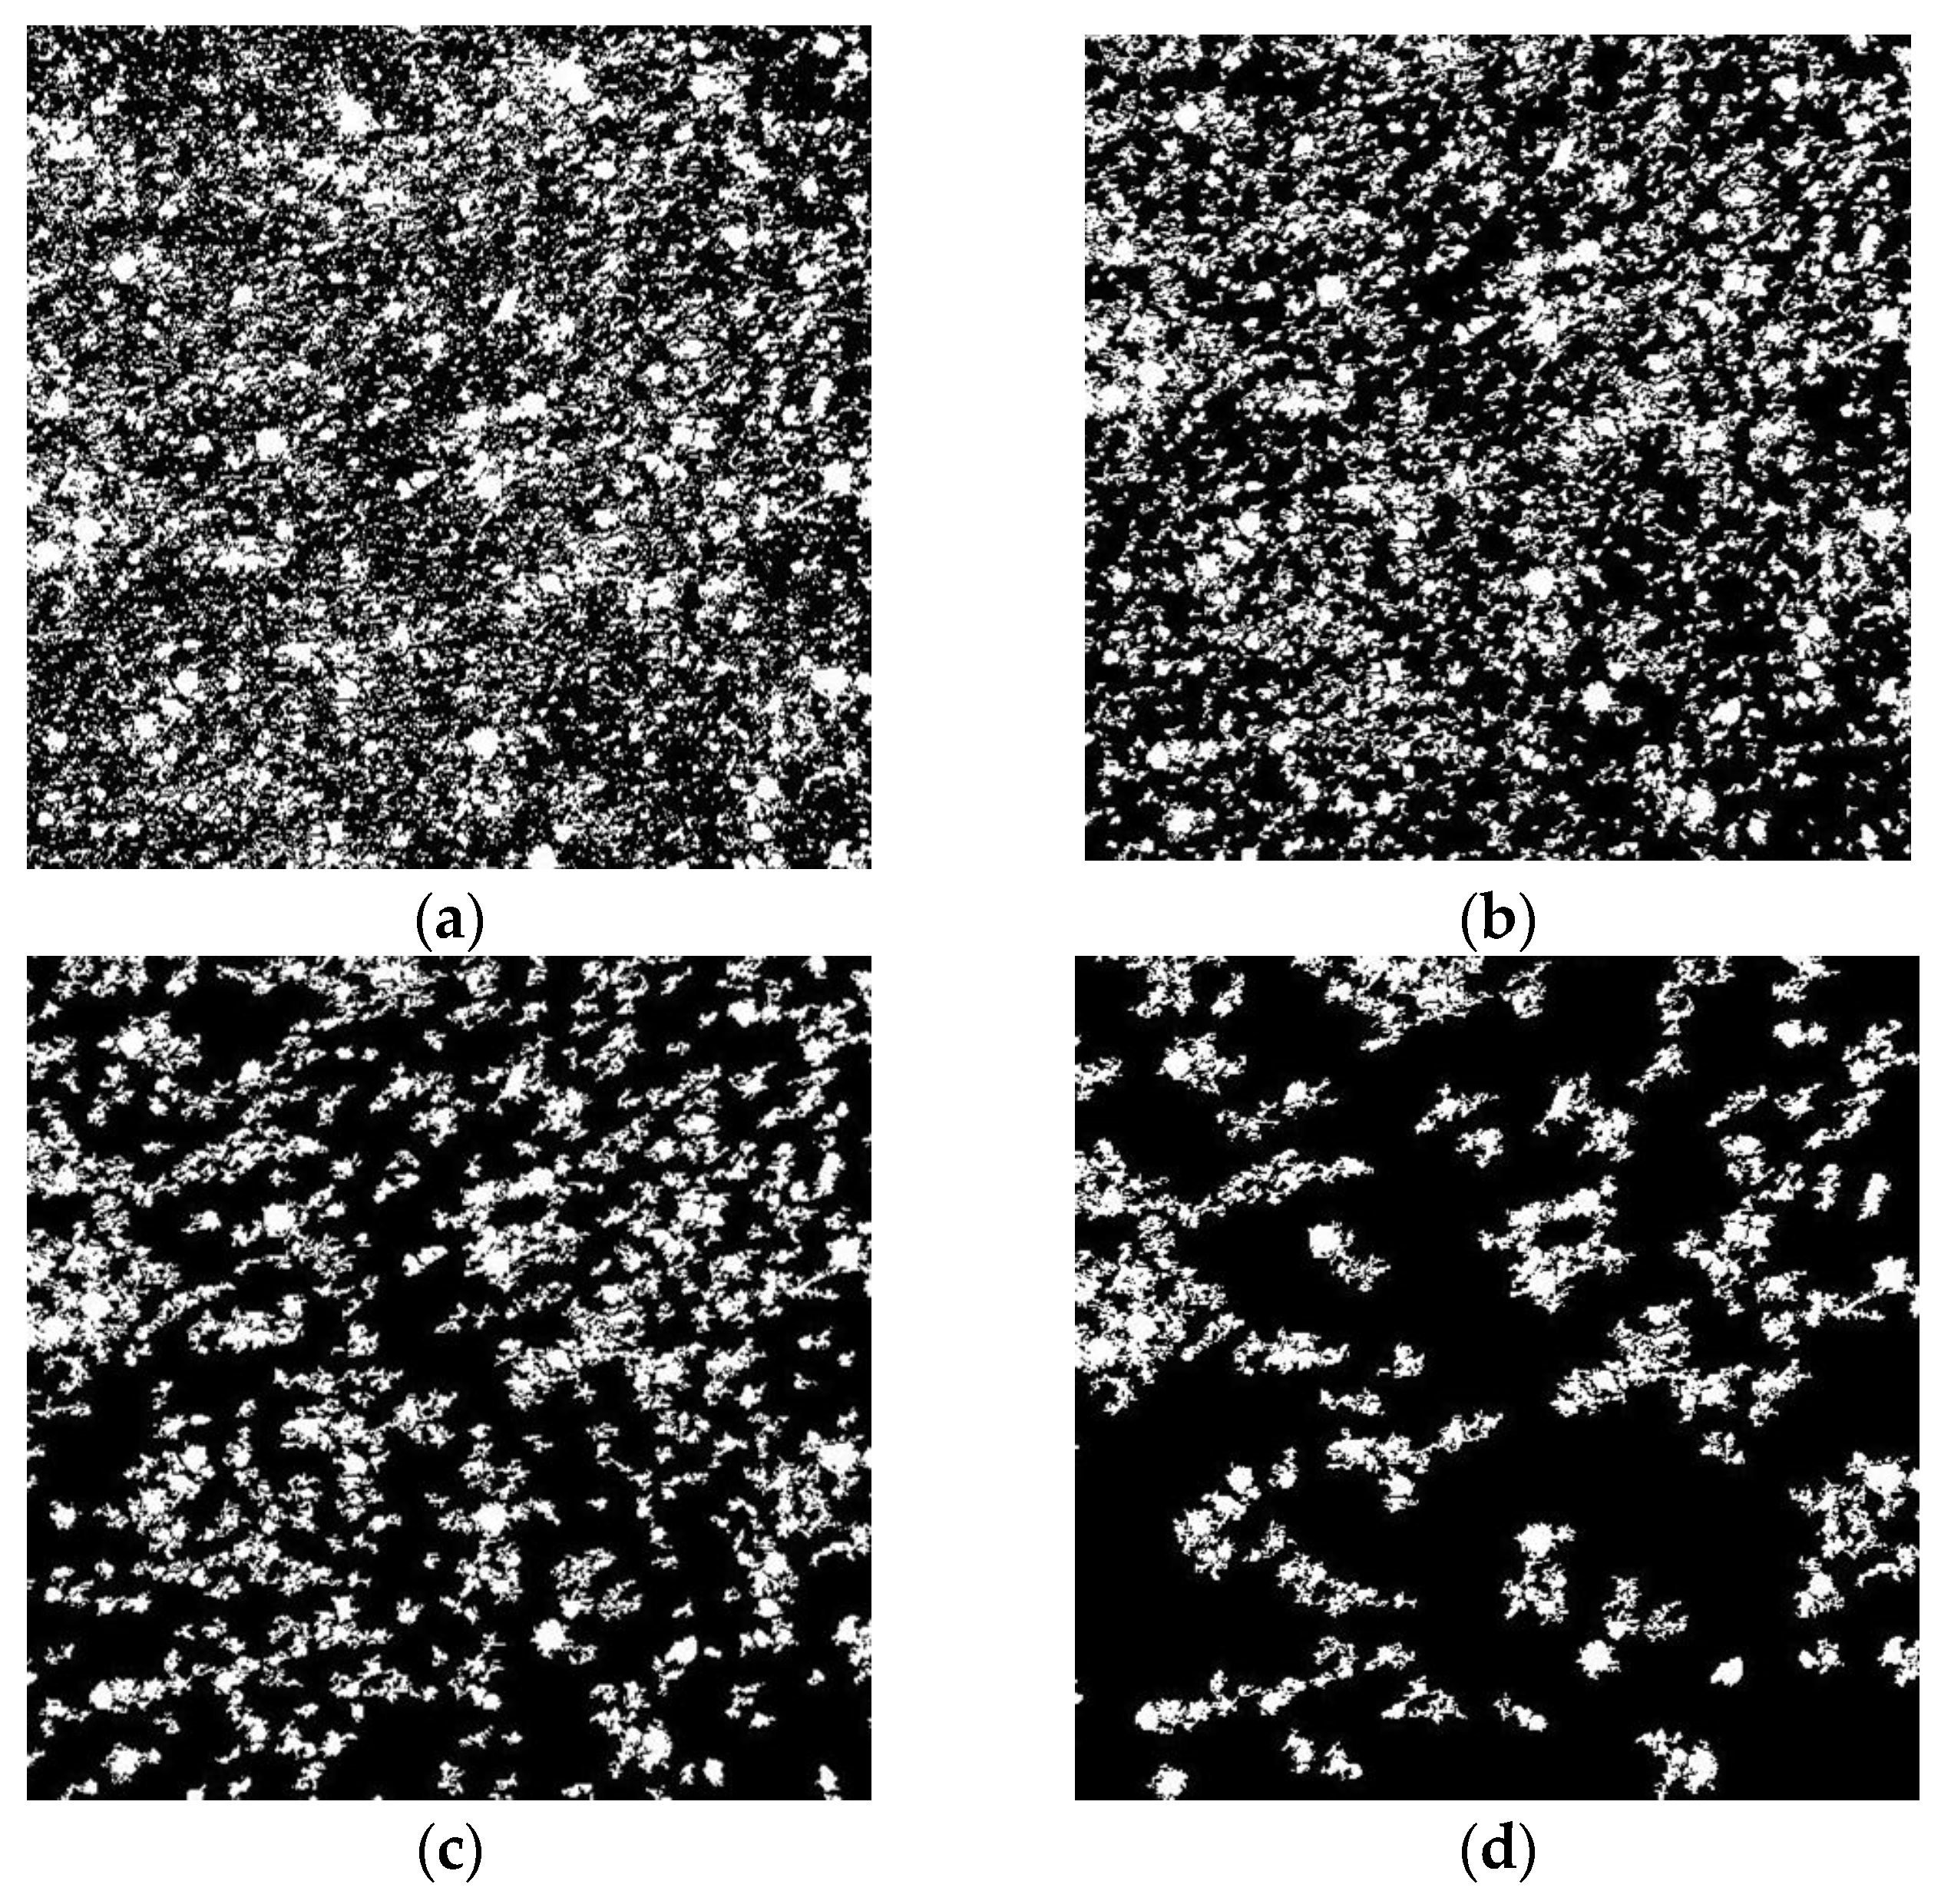
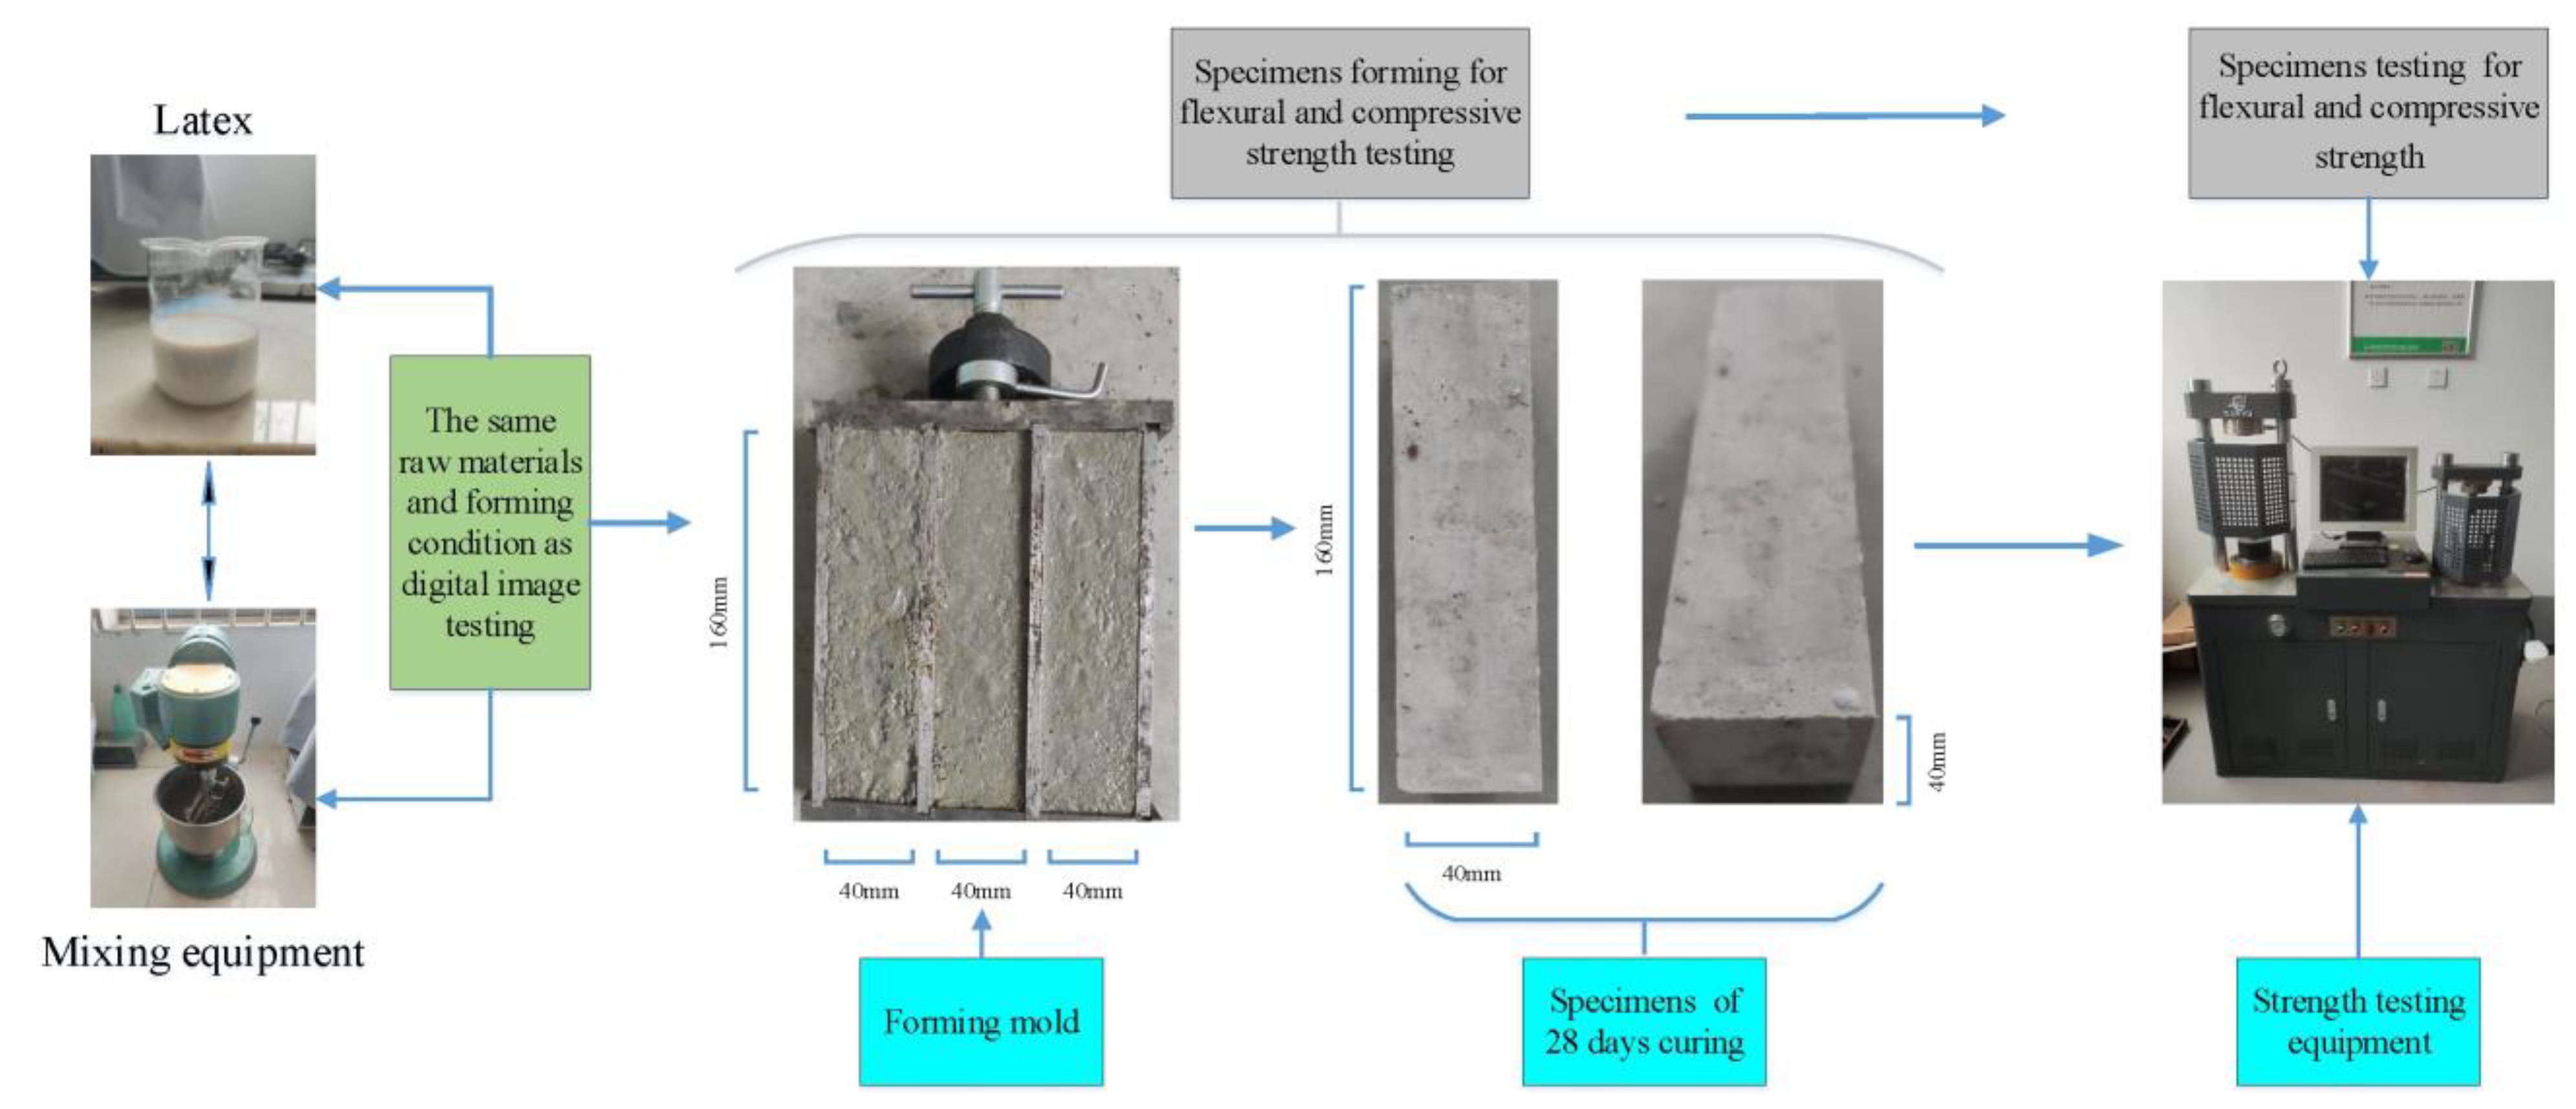
2.2. Methods
3. Results and Discussion
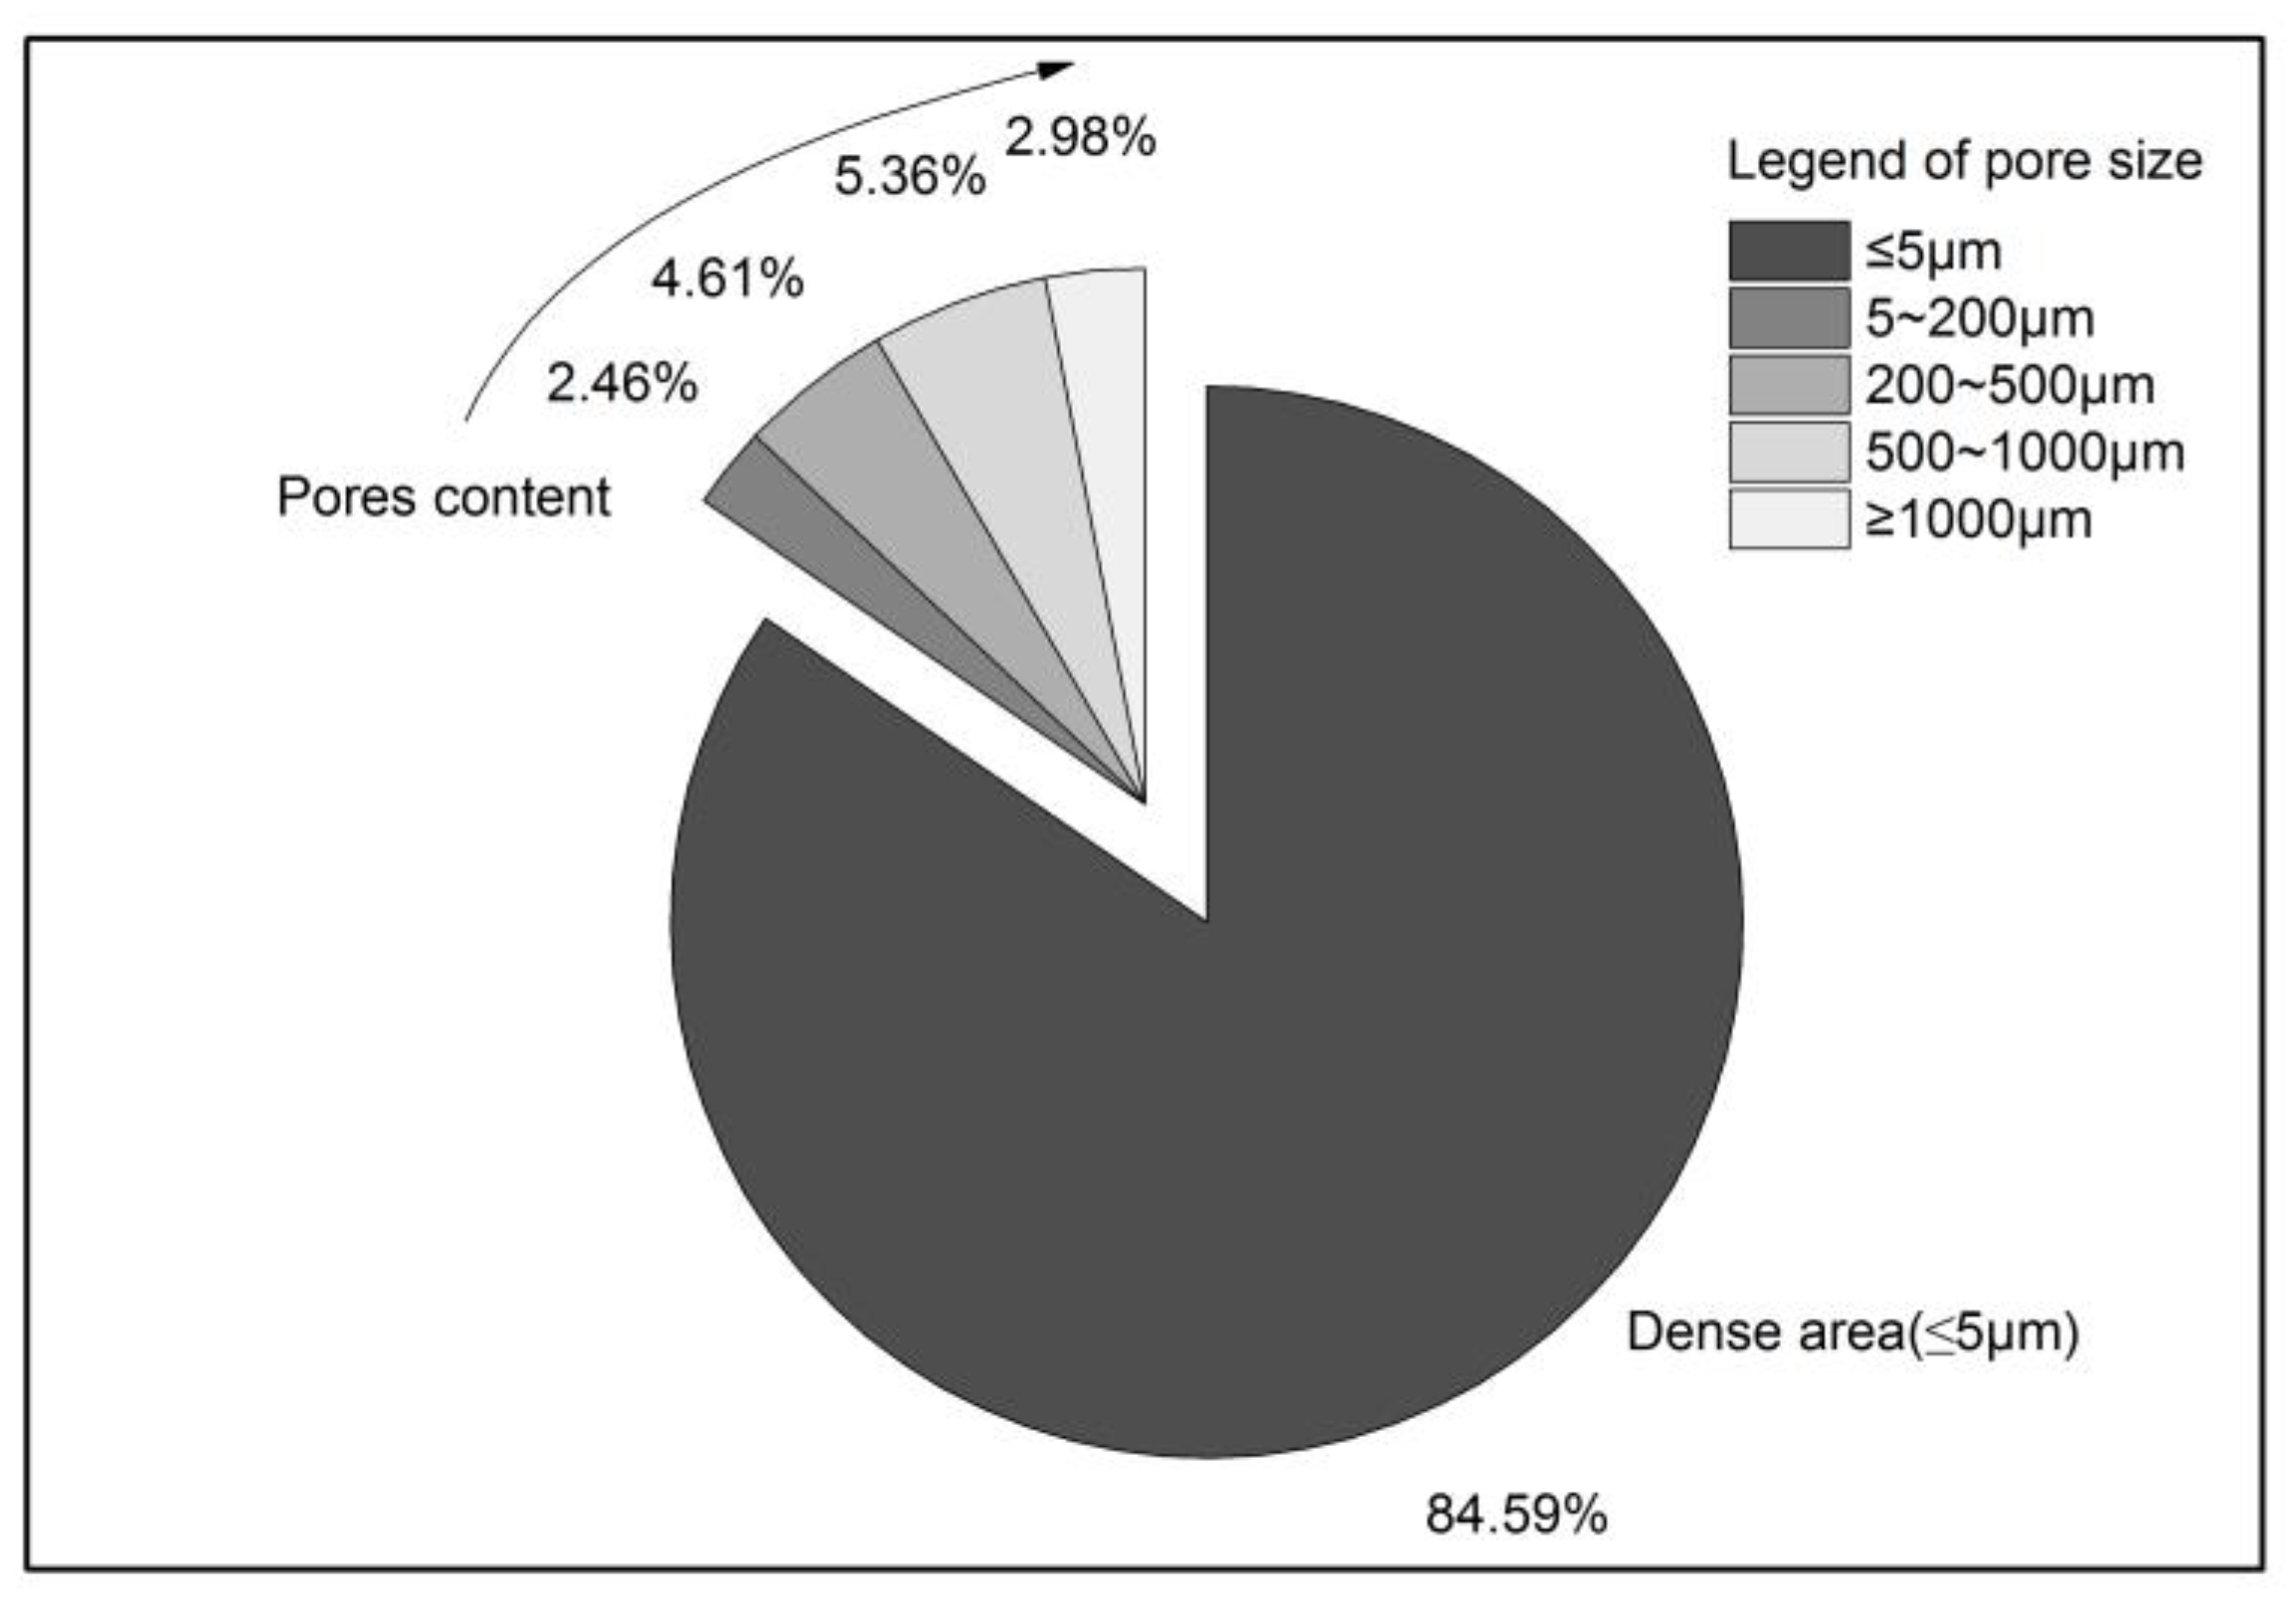
3.1. Analysis of Evolutionary Pattern of Total Stomatal Volume
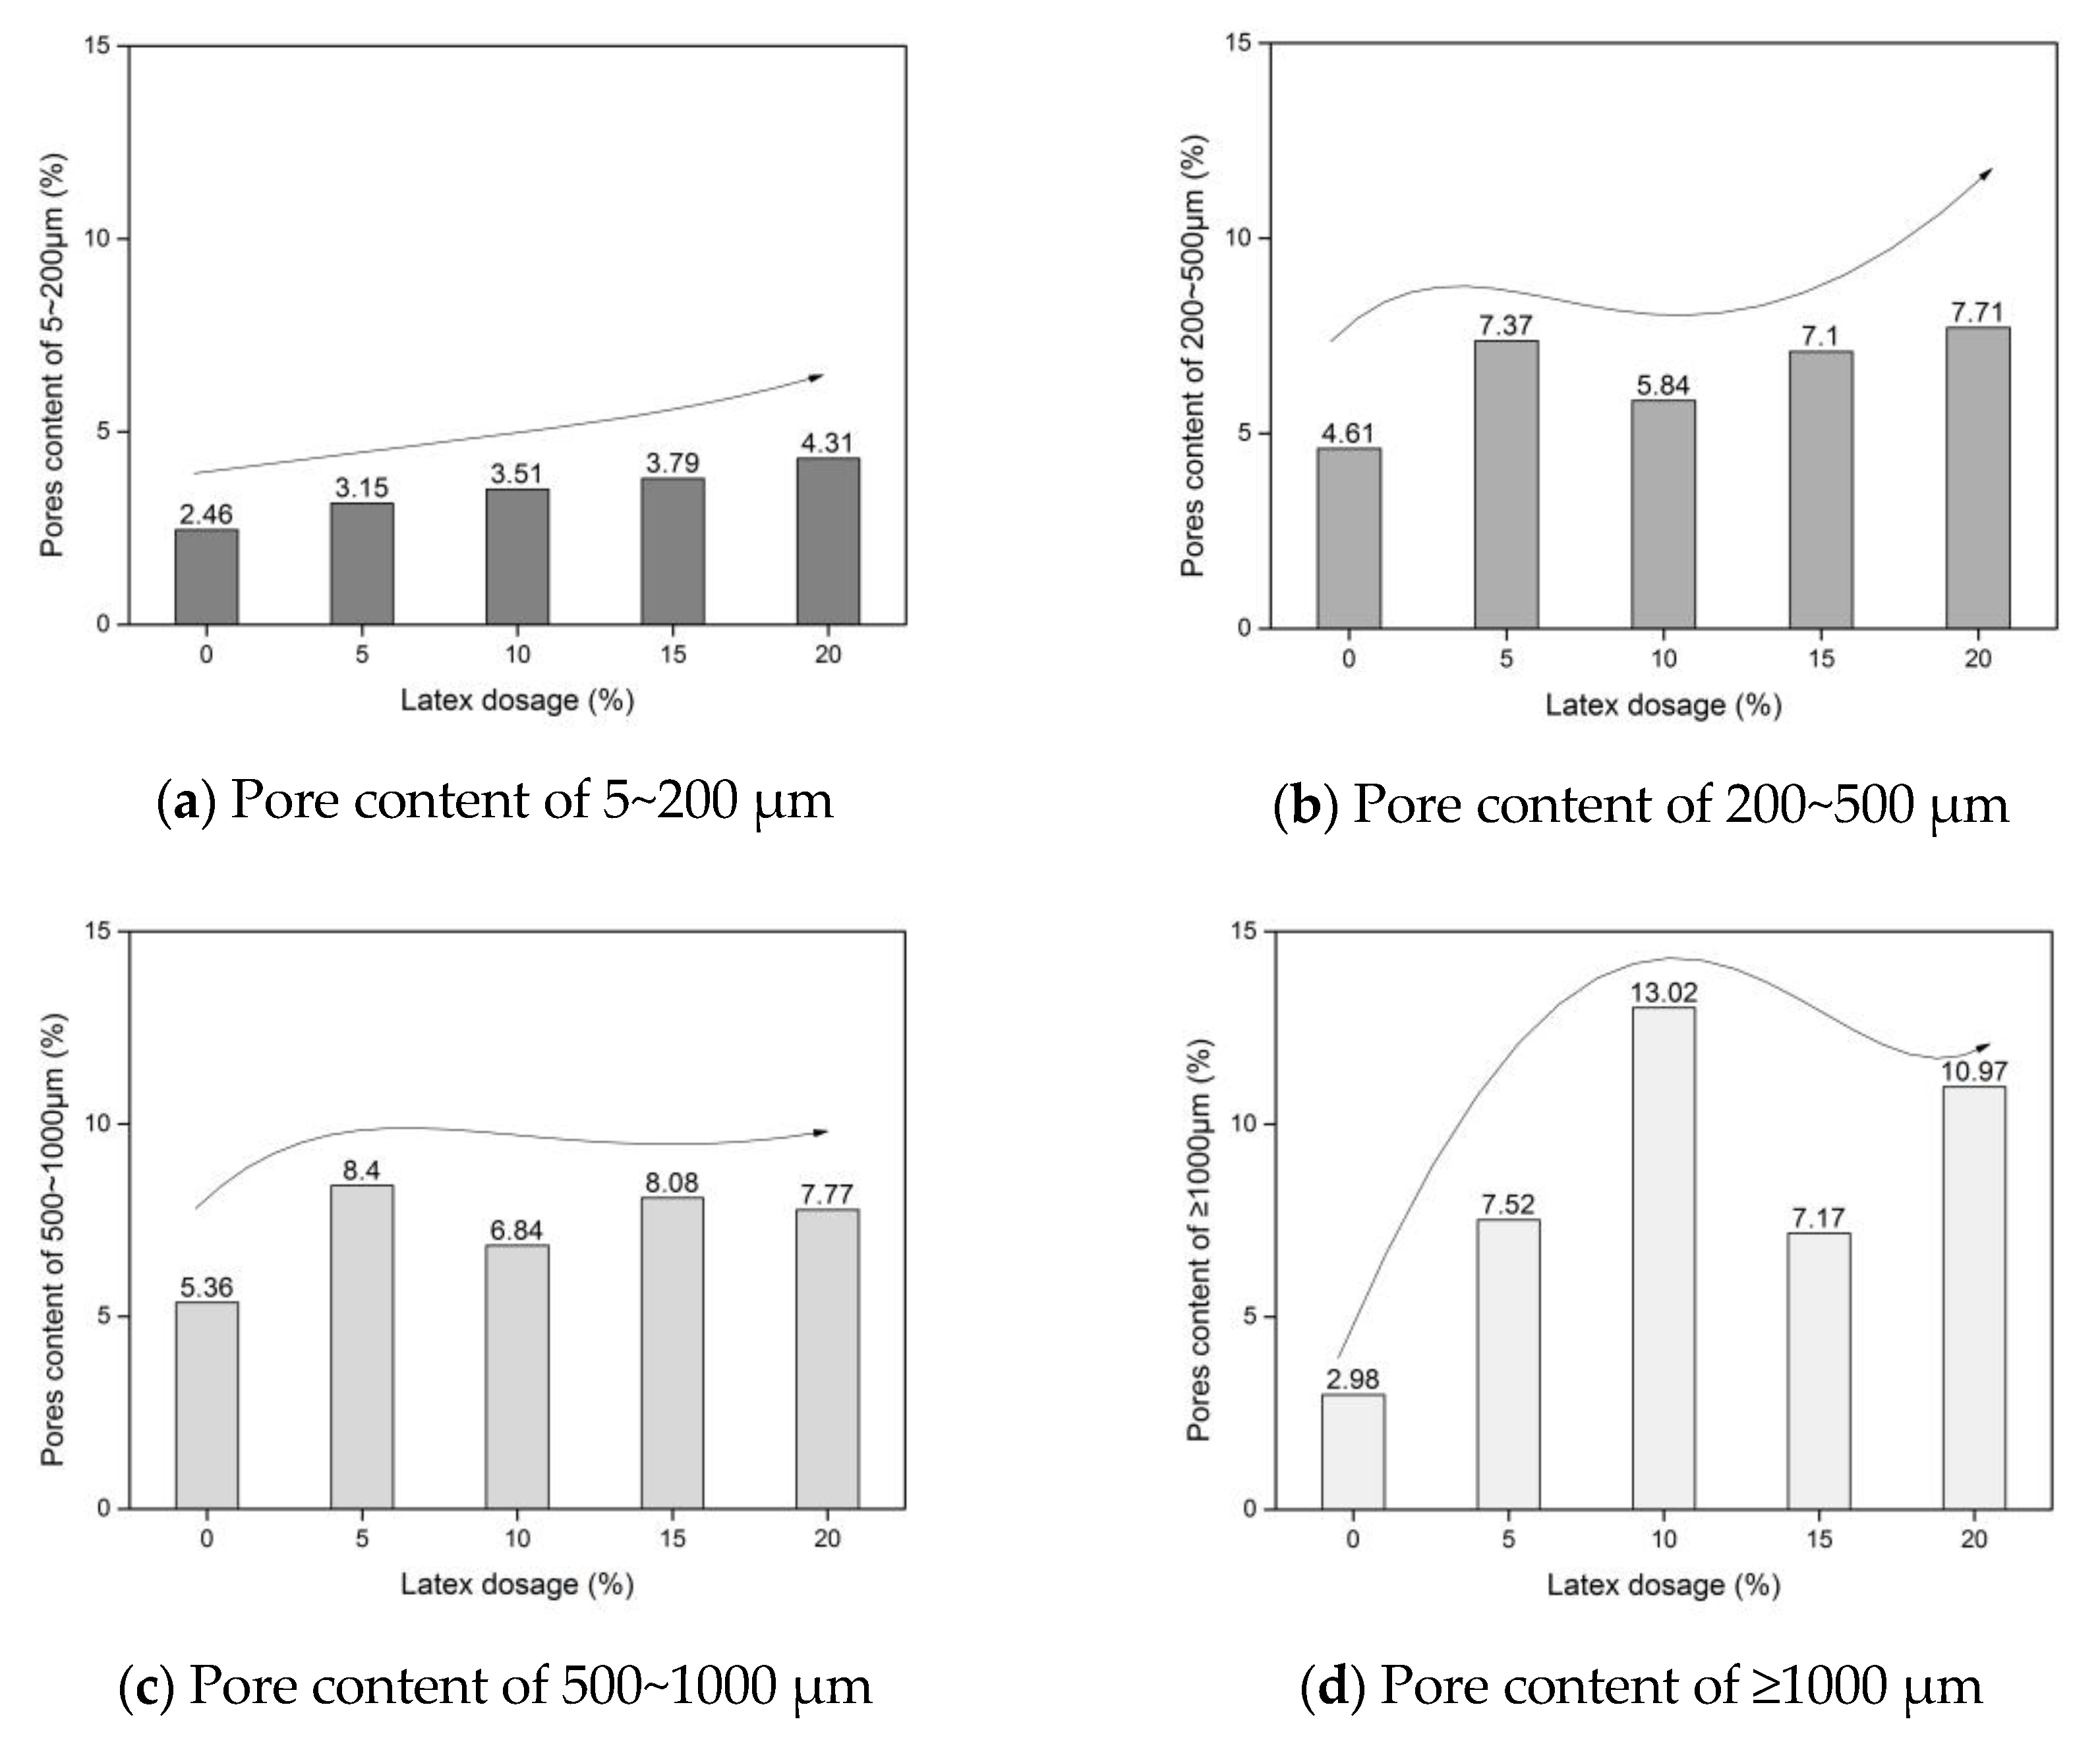
3.2. Analysis of Stomatal Evolution Patterns of Different Pore Sizes
3.3. Influence Law of Porosity on Mechanical Properties of Cementitious Materials
4. Conclusions
- (1)
- A characterization method was introduced for analyzing the pore distribution within this two-dimensional context, which involved enhancing image grayscale processing and binarization to achieve greater precision in distinguishing between pore-dense and pore-sparse regions. The distribution characteristics of pores of varying sizes in the two-dimensional structure of the materials were examined, and a pore distribution model was developed. Based on this model, the overall pore volume in the material, the distribution of pores across different size ranges, and the resulting impact on the material’s mechanical properties were investigated. The key conclusions from this study included the following:
- (2)
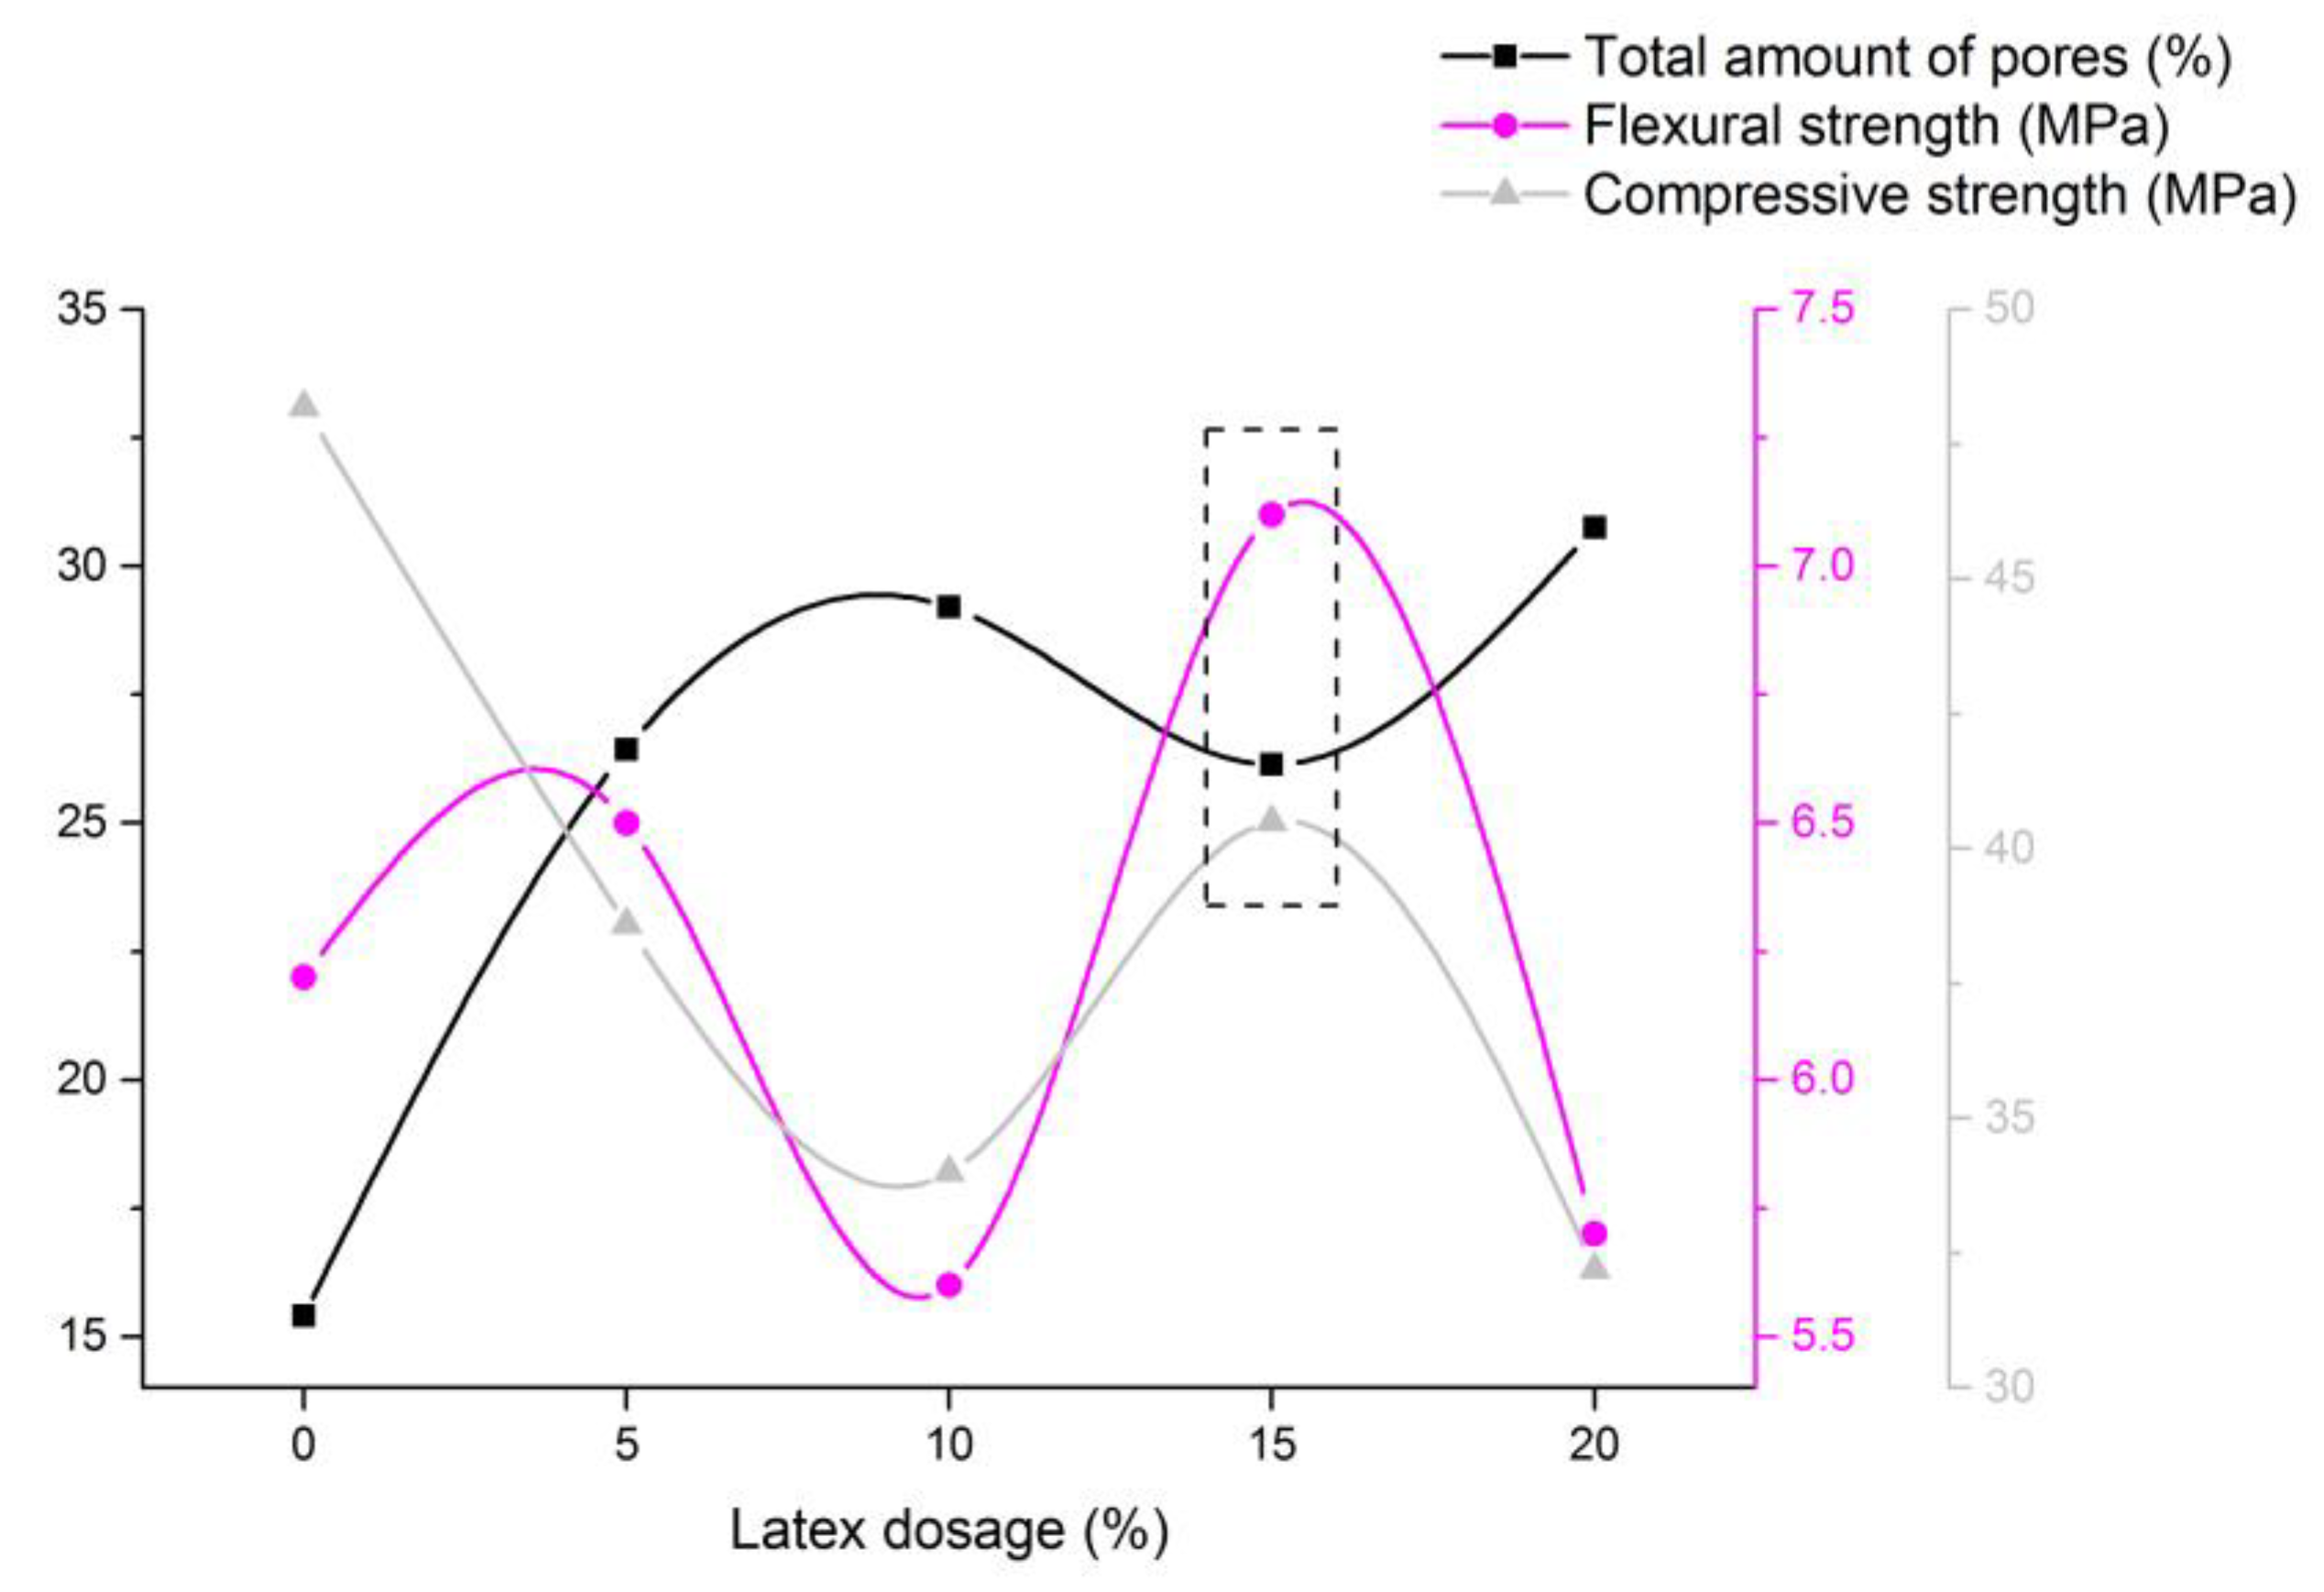
- Analysis of the total pore volume within the complex solid–liquid–gas system of cementitious materials revealed that the addition of latex increased the overall porosity. Remarkably, when the latex dosage reached 15%, there was an inflection point in the increase in the total pore volume, after which it showed a modest rebound.
- (3)
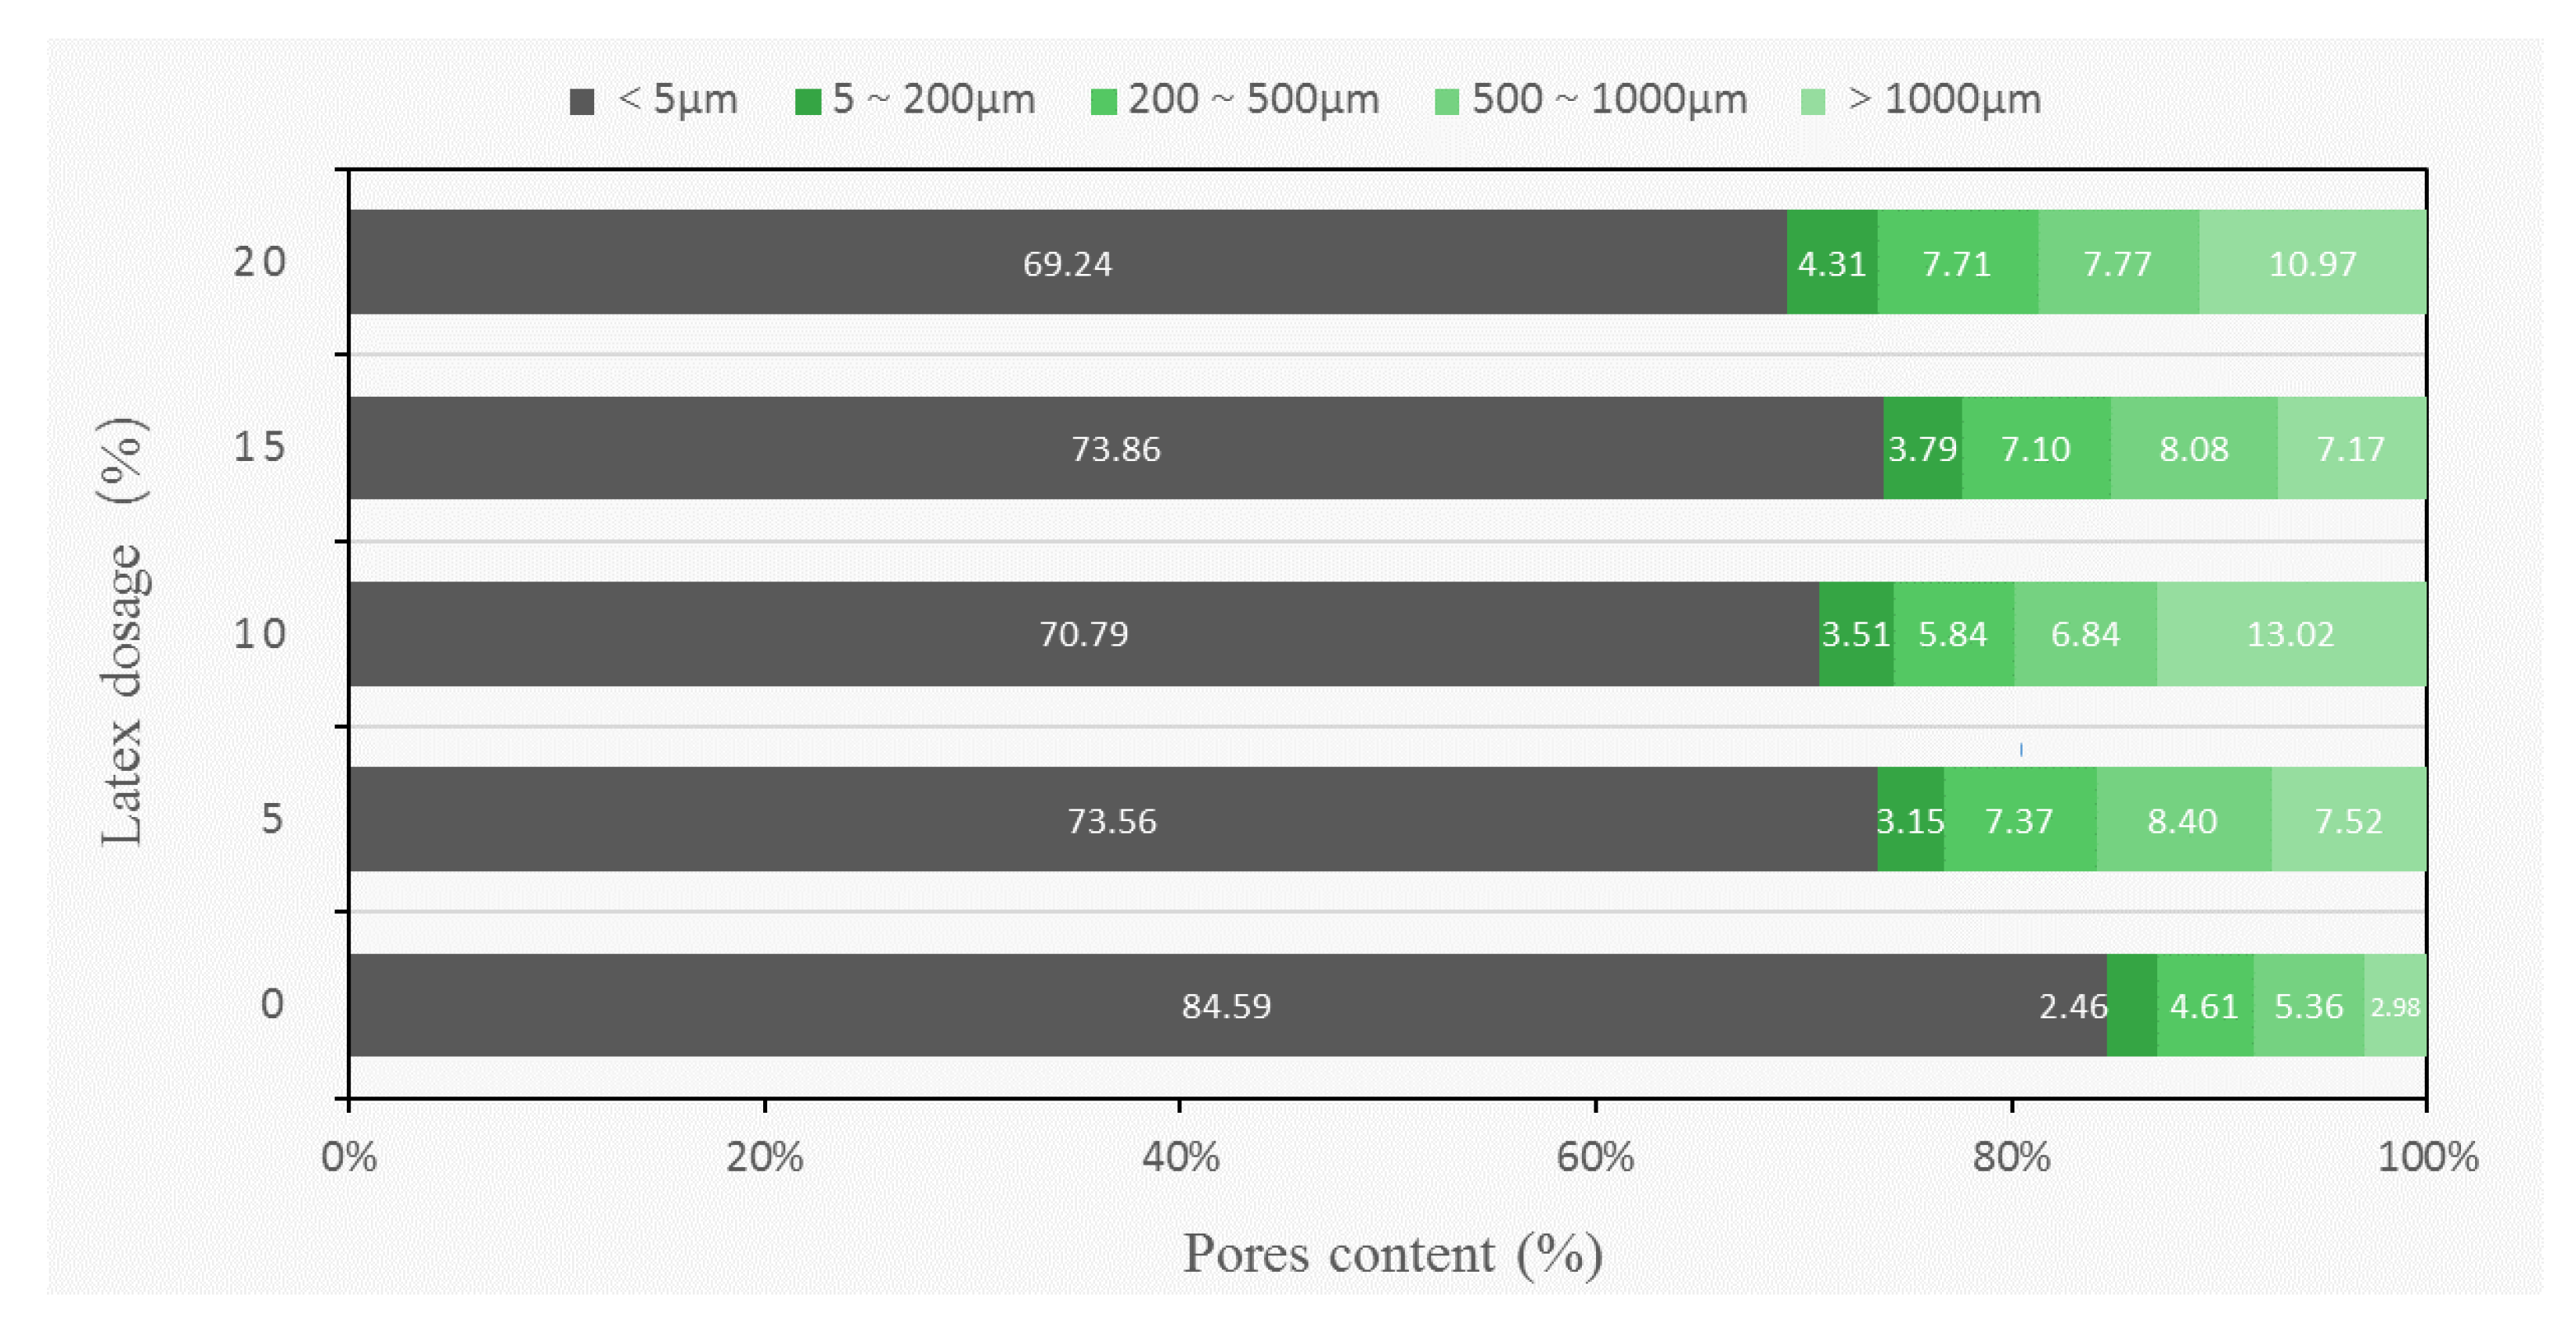
- The pore content in all four categories tended to increase with the addition of latex. However, it was crucial to note that increasing the latex dosage did not linearly result in more significant porosity. This suggested that pore formation was influenced not just by the admixture itself but also by the interaction between the latex and the cementitious material, among other factors.
- (4)
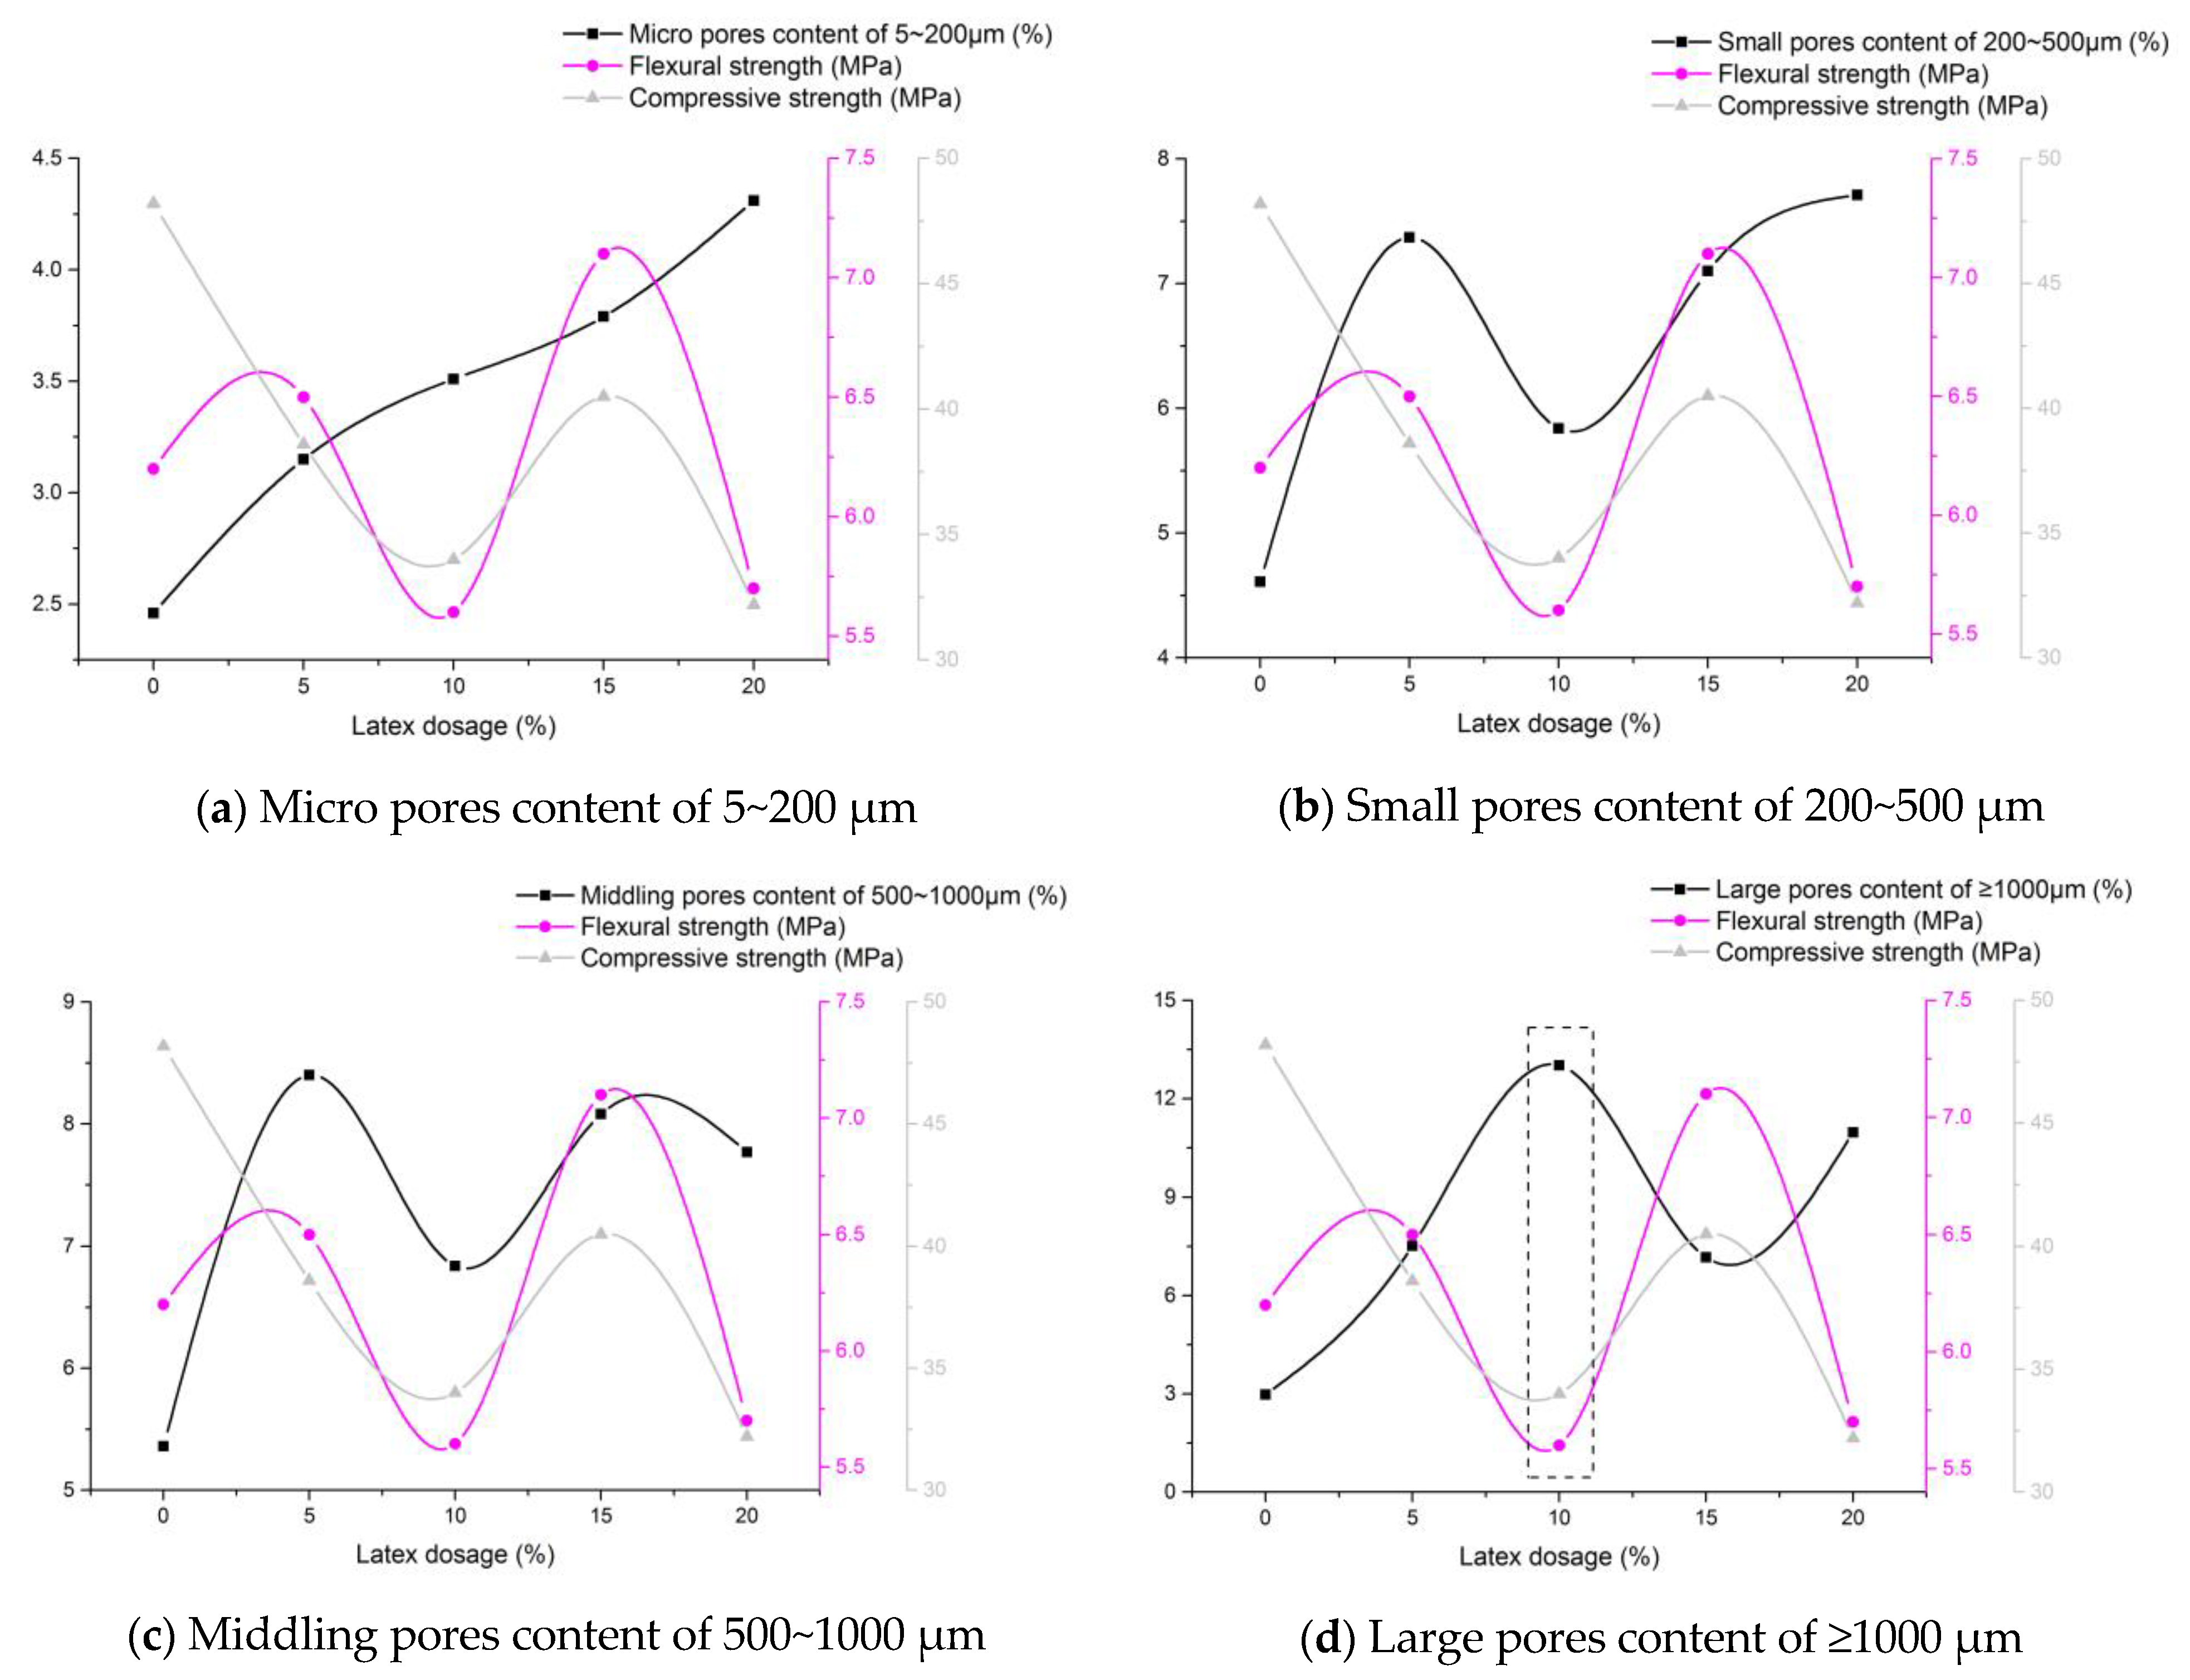
- The study revealed that tiny pores marginally increased with higher latex dosages. In contrast to other pore sizes, the absolute content of tiny pores remained low, suggesting that latex additives had a limited impact. Small and medium pores behaved similarly with latex addition; both types showed a general increase but experienced a decline at a latex dosage of 10%.
- (5)
- In the case of large pores, the highest content was observed at 10% latex dosage, reaffirming the trend of smaller pores evolving into larger ones. These findings confirmed that smaller pores tended to develop into larger pores over time.
- (6)
- Higher porosity and micropore content generally weakened mechanical performance. However, at a small latex dosage, there was an improvement in flexural strength. When the latex dosage reached 15%, the total pore and micropore content declined, resulting in a balanced increase in flexural strength and a mitigated decline in compressive strength.
- (7)
- In the binarization process of planar images of cementitious materials using digital imaging techniques, a combination of automated threshold determination and manual comparison was employed to maximize accuracy. Despite these efforts, the method still has room for improvement, as it is susceptible to human error. Further research is necessary to enhance the quantitative accuracy of binarization thresholds.
Author Contributions
Funding
Institutional Review Board Statement
Informed Consent Statement
Data Availability Statement
Conflicts of Interest
References
- Han, J. Research on the Performance of High-Performance Cement Concrete Pavement in Seasonal Frozen Areas; Chang’an University: Xi’an, China, 2009; pp. 124–125. (In Chinese) [Google Scholar]
- Czarnecki, L. Concrete-polymer composites: Trends shaping the future. Int. J. Soc. Mater. Eng. Resour. 2007, 15, 1–5. [Google Scholar] [CrossRef]
- Ollitrault-Fichet, R.; Gauthier, C.; Clamen, G.; Boch, P. Microstructural aspects in a polymer-modified cement. Cem. Concr. Res. 1998, 28, 1687–1693. [Google Scholar] [CrossRef]
- Li, Z.; Liang, N.; Wu, D.; Jing, W. Mechanism analysis of polymer cement-based materials. J. Highw. Trans. Res. Dev. 2005, 2, 63–66+86. (In Chinese) [Google Scholar]
- Zhang, G.; Wang, P. Effect of hydroxyethyl methylcellulose on the formation of cement hydration products. J. Build. Mat. 2010, 13, 573–577. (In Chinese) [Google Scholar]
- Yang, Z. Research on the Control and Durability of Concrete Pore Structure in High Altitude Low Pressure Environment; Chang’an University: Xi’an, China, 2023. (In Chinese) [Google Scholar]
- Sakai, E.; Kasuga, T.; Sugiyama, T.; Asaga, K.; Daimon, M. Influence of superplasticizers on the hydration of cement and the pore structure of hardened cement. Cem. Concr. Res. 2006, 36, 2049–2053. [Google Scholar] [CrossRef]
- Kondraivendhan, B.; Bhattacharjee, B. Effect of age and water-cement ratio on size and dispersion of pores in ordinary portland cement paste. J. ACI Mat. 2010, 107, 147–154. [Google Scholar]
- Zhang, L.; Wang, W. Research on the influence of polymer on the pore structure and performance of foam concrete. J. Concr Cem. Prod. 2011, 185, 9–12. (In Chinese) [Google Scholar] [CrossRef]
- Wu, Z. Reflection on concrete science and technology. J. Concr. Cem. Prod. 1988, 6, 4–5. (In Chinese) [Google Scholar]
- Wu, Z.; Lian, H. High Performance Cement Concrete; China Railway Press: Beijing, China, 1999. (In Chinese) [Google Scholar]
- Wang, T.; Dra, Y.A.S.S.; Cai, X.; Cheng, Z.; Zhang, D.; Lin, Y.; Yu, H. Advanced cold patching materials (CPMs) for asphalt pavement pothole rehabilitation: State of the art. J. Clean. Prod. 2022, 366, 133001. [Google Scholar] [CrossRef]
- Shen, A. Cement and Cement Concrete; Beijing Communications Press: Beijing, China, 2000; pp. 93–103. (In Chinese) [Google Scholar]
- CEB European Committee on Concrete. CEB Design Guidelines for Durable Concrete Structures, 2nd ed.; Zhou, Y.; Di, X.; Han, J.; Cai, L., Translators; China Academy of Building Sciences: Beijing, China, 1989. [Google Scholar]
- He, J. Research on the Microstructure and Properties of Road Cement Concrete; Chang’an University: Xi’an, China, 2009. (In Chinese) [Google Scholar]
- Wang, T.; Li, M.; Cai, X.; Cheng, Z.; Zhang, D.; Sun, G. Multi-objective design optimization of composite polymerized asphalt emulsions for cold patching of pavement potholes. Mater. Today Commun. 2023, 35, 105751. [Google Scholar] [CrossRef]
- Wang, T.; Weng, Y.; Cai, X.; Li, J.; Xiao, F.; Sun, G.; Zhang, F. Statistical modeling of low-temperature properties and FTIR spectra of crumb rubber modified asphalts considering SARA fractions. J. Clean. Prod. 2022, 374, 134016. [Google Scholar] [CrossRef]
- Yan, X. Study on the Influence of Pore Structure on the Salt Freezing Resistance of Cement-Based Materials; Southeast University: Nanjing, China, 2015. (In Chinese) [Google Scholar]
- Yang, W. Effect of Inorganic Salts on Pore Structure and Frost Resistance of Concrete; Harbin Institute of Technology: Harbin, China, 2009. (In Chinese) [Google Scholar]
- Jo, B.W.; Park, S.K.; Kim, D.K. Mechanical properties of nano-MMT reinforced polymer composite and polymer concrete. Constr. Build. Mater. 2008, 22, 14–20. [Google Scholar] [CrossRef]
- Pascal, S.; Alliche, A.; Pilvin, P. Mechanical behavior of polymer modified mortars. J. Mater. Sci. Eng. A 2004, 380, 1–8. [Google Scholar] [CrossRef]
- Beeldens, A.; Gemert, D.V.; Ohama, Y. Integrated model of structure formation in polymer modified concrete. In Proceedings of the 11th International Congress on the Chemistry of Cement 2003, Durban, South Africa, 11–16 May 2003; pp. 206–216. [Google Scholar]
- JTG 3420-2020; Test Regulations for Cement and Cement Concrete for Highway Engineering. People’s Communications Press: Beijing, China, 2020.
- Beeldens, A. Evolution in modeling microstructure formation in polymer-cement concrete: Restoration of buildings and monuments. J. Restor. Build Monum. 2013, 19, 97–108. [Google Scholar]
- Abdulateef, Y.M.; Fahad, B.M.; Eweed, K.M. Repairing of concrete by using polymer-mortar composites. Int. J. Mod. Eng. Res. 2014, 1, 63–72. [Google Scholar]
- Ukrainczyk, N.; Rogina, A. Styrene–butadiene latex modified calcium aluminate cement mortar. Cem. Concr. Compos. 2013, 41, 16–23. [Google Scholar] [CrossRef]
- Petit, J.Y.; Wirquin, E. Evaluation of various cellulose ethers performance in ceramic tile adhesive mortars. Int. J. Adhes. Adhes. 2013, 40, 202–209. [Google Scholar] [CrossRef]
- Bühler, T.; Zurbriggen, R.; Pieles, U.; Huwiler, L.; Raso, R. Dynamics of early skin formation of tiling mortars investigated by microscopy and diffuse reflectance infrared Fourier transformed spectroscopy. Cem. Concr. Compos. 2013, 37, 161–170. [Google Scholar] [CrossRef]
- Ohama, Y. Principle of latex modification and some typical properties of latex-modified mortars and concretes. J. ACI Mat. 1987, 84, 511–518. [Google Scholar]
- Pourchez, J.; Ruot, B.; Debayle, J.; Pourchez, E.; Grosseau, P. Some aspects of cellulose ethers influence on water transport and porous structure of cement-based materials. Cem. Concr. Compos. 2010, 40, 242–252. [Google Scholar] [CrossRef]
- Bülichen, D.; Kainz, J.; Plank, J. Working mechanism of methyl hydroxyethyl cellulose (MHEC) as water retention agent. Cem. Concr. Compos. 2012, 42, 953–959. [Google Scholar] [CrossRef]
- Ahmed, S.F.U. Mechanical and durability properties of mortars modified with combined polymer and supplementary cementitious materials. J. Mater. Civil. Eng. 2011, 23, 1311–1319. [Google Scholar] [CrossRef]
- Tabassi, A.A.; Ramli, M. Effects of different curing regimes on engineering properties of polymer-modified mortar: An experimental study. J. Mater. Civil. Eng. 2012, 24, 468–478. [Google Scholar]
- Linares-Unamunzaga, A.; Pérez-Acebo, H.; Rojo, M.; Gonzalo-Orden, H. Flexural strength prediction models for soil–cement from unconfined compressive strength at seven days. J. Mater. 2019, 12, 387. [Google Scholar] [CrossRef]
- Tran, V.Q. Hybrid gradient boosting with meta-heuristic algorithms prediction of unconfirmed compressive strength of stabilized soil based on initial soil properties, mix design and effective compaction. J. Clean. Prod. 2022, 355, 131683. [Google Scholar] [CrossRef]


| Serial Number | Water (g) | Cement (g) | Standard Sand (g) | Latex (g) | Defoamer (g) | Latex Dosage (%) |
|---|---|---|---|---|---|---|
| 1 | 225 | 450 | 1350 | 0 | 0 | 0 |
| 2 | 213.53 | 450 | 1350 | 22.5 | 4.12 | 5 |
| 3 | 202.05 | 450 | 1350 | 45.0 | 4.18 | 10 |
| 4 | 190.58 | 450 | 1350 | 67.5 | 4.25 | 15 |
| 5 | 179.10 | 450 | 1350 | 90.0 | 4.31 | 20 |
| Solid Content (%) | PH | Viscosity (20 ℃) (mPa.s) | Char Yield (450 °C) (%) | Glass Transition Temperature (°C) |
|---|---|---|---|---|
| 47.0 | 8.25 | 48.02 | 15.4 | 10.2 |
Disclaimer/Publisher’s Note: The statements, opinions and data contained in all publications are solely those of the individual author(s) and contributor(s) and not of MDPI and/or the editor(s). MDPI and/or the editor(s) disclaim responsibility for any injury to people or property resulting from any ideas, methods, instructions or products referred to in the content. |
© 2023 by the authors. Licensee MDPI, Basel, Switzerland. This article is an open access article distributed under the terms and conditions of the Creative Commons Attribution (CC BY) license (https://creativecommons.org/licenses/by/4.0/).
Share and Cite
Yuan, Y.; He, Z.; Niu, K.; Tian, B.; Chen, L.; Bai, W.; Zheng, S.; Yu, G. Analyzing Pore Evolution Characteristics in Cementitious Materials Using a Plane Distribution Model. Coatings 2023, 13, 2023. https://doi.org/10.3390/coatings13122023
Yuan Y, He Z, Niu K, Tian B, Chen L, Bai W, Zheng S, Yu G. Analyzing Pore Evolution Characteristics in Cementitious Materials Using a Plane Distribution Model. Coatings. 2023; 13(12):2023. https://doi.org/10.3390/coatings13122023
Chicago/Turabian StyleYuan, Yezhen, Zhe He, Kaimin Niu, Bo Tian, Liangliang Chen, Wei Bai, Shaopeng Zheng, and Guoman Yu. 2023. "Analyzing Pore Evolution Characteristics in Cementitious Materials Using a Plane Distribution Model" Coatings 13, no. 12: 2023. https://doi.org/10.3390/coatings13122023