Article

Numerical Simulation of the Residual Stress at the Interface between Thermal Barrier Coating and Nickel-Based Single-Crystal Superalloy Based on Crystal Plasticity Theory

Key Laboratory of Pressure System and Safety, Ministry of Education, School of Mechanical and Power Engineering, East China University of Science and Technology, No. 130 Meilong Road, Shanghai 200237, China
*
Author to whom correspondence should be addressed.
Coatings 2024, 14(1), 22; https://doi.org/10.3390/coatings14010022
Submission received: 30 October 2023 / Revised: 8 December 2023 / Accepted: 19 December 2023 / Published: 24 December 2023
(This article belongs to the Section Surface Characterization, Deposition and Modification)

Abstract

:
Residual stress plays an important role in the formation and growth of cracks in thermal barrier coatings and single-crystal superalloy substrates. In this study, a finite element model for a planar double-layer thermal barrier coating and a crystal plasticity finite element model based on dislocation slip-induced plastic deformation of single-crystal materials were established to analyze the residual stress in the coatings and the substrate, considering the creep and crystal plasticity of the substrate materials. The simulation results show that the thermal barrier coatings bear most of the stress generated by high temperatures, and the residual stress of the substrate is small. By comparing the two material properties to calculate the interface stress when the amplitude of the interface between the substrate and the coating is 30 μm and the thickness of the thermal grown oxide layer is 5 µm, the interfacial stress of the substrate at the macro scale was found to be similar to the interfacial stress at the micro slip system scale. Based on the cumulative shear strain, it was determined that the [001]-, [011]-, and [111]-oriented alloys activated the 12, 8, and 4 groups, respectively, under the combined action of thermal stress and centrifugal force of the coating. Comparing the activation of different initial orientation slip systems and the magnitude of the yield stress provides a theoretical foundation to study the structural integrity of single-crystal alloys.

1. Introduction

With continuous improvements in the thrust–weight ratios of aero-engines, turbine blades bear higher temperatures and greater loads. In order to adapt to this development trend, blade materials have been developed from traditional superalloys to single-crystal superalloys. Compared with other superalloys, nickel-based single-crystal superalloys always show better service temperature bearing capacity and service life. In recent years, the working temperature of high-temperature parts such as engine blades has reached 1250 °C, and it is expected that this temperature will continue to increase; meanwhile, the working temperature that the most advanced superalloy can withstand for a long time barely exceeds 1100 °C [1,2]. Currently, high-temperature protective coatings can be applied to improve the fatigue resistance and turbine efficiency of single-crystal blades [3]. Thermal barrier coating (TBC) systems typically consist of a ceramic top coating (TC) and a metal bonding coating (BC). Generally, Y2O3 partially stabilized ZrO2 (YSZ) is used as the ceramic top layer material. YSZ has a high melting point, low thermal conductivity, high hardness, abrasion resistance, and a similar thermal expansion coefficient to the nickel-based superalloy substrate material, which is beneficial to reducing the stress caused by thermal expansion mismatch between the metal alloy substrate and ceramic layer [4]. The metal bonding layer material is generally MCrAlY (M is Ni and/or Co), and the thermal expansion coefficient of the metal bonding layer is between the metal alloy substrate and the surface ceramic layer, which can reduce the interface stress and improve the thermal expansion compatibility between the ceramic layer and the substrate [5]. At high temperatures, the bonding coating oxidizes to form a layer of thermal growth oxide (TGO), and the thickness of the TGO increases with an increase in heating time [6,7].
The thermal barrier coating system may fail due to loading during service, so it is important to analyze the residual stress of the coating to ensure the structural integrity of the coating. Zhang et al. [8] adopted a four concentric circle model that assumed that the interface was composed of a series of concave and convex surfaces, including a ceramic layer, bonding layer, oxide layer, and substrate, and studied the influence of the interface’s morphology and roughness on the distribution of residual stress throughout the interface. The concentric circle model has the advantages of having a simple structure and clearly observable stress distribution; however, it can only reflect the structural characteristics and cannot fully reflect the interface characteristics. Furthermore, considering the complexity of the real structure of the coating system, many authors have chosen to use an ideal cosine model, where the TC layer is homogeneous and a cosine curve is used to approximate the TC/BC interface. The results of He et al. [9] show that the TGO causes interface instability with the lateral growth strain, resulting in tensile stress perpendicular to the interface, and the stress value increases with an increase in the number of cycles. In addition, Wei et al. [10] used an ideal cosine model to systematically investigate the effects of the number of thermal cycles and the interface roughness on the residual stress distribution during thermal cycling. Robert et al. [11] performed a contour analysis on a cohesive layer and obtained amplitude roughness parameters (e.g., Rq or Ra) to model TGO as cosine waves. In actual finite element simulation, real interface modeling is used relatively less often because of the high grid size requirements and the complexity of modeling and calculation; thus, the curve chord model is mostly used.
In recent years, the advancement of finite element technology has led to the emergence of numerous meso-scale constitutive models that aim to investigate the mechanical behavior of crystal materials. Crystal plasticity (CP) constitutive models are often used to examine the correlation between mesoscopic and macroscopic mechanical responses, with a focus on the dislocation and slip properties of metallic materials. Zhang et al. [12,13] developed a calculation method that combines crystal plasticity and an expansion finite element method for the purpose of predicting the growth of slip-controlled short cracks in single-crystal nickel-based superalloys. The occurrence of fracture is influenced by the cumulative shear strain of a single slip system, with the direction of crack propagation aligning with the slip surface. Based on classical crystal plasticity theory, the essence of plastic deformation is the slip of different slip systems. Some research has shown that when crystal plastic deformation occurs, only part of a slip system is activated, not all of it. According to the rate-dependent plastic constitutive model, the fundamental factor determining whether a slip system is activated is the degree of slip shear strain. Using a low-cycle fatigue test, Zhang et al. [14] studied the cyclic deformation of nickel-based single-crystal superalloy MD2 in different crystal directions and studied the slip initiation of short cracks under low-cycle fatigue using an in situ scanning electron microscopy (SEM) test. The crystal plastic model was calibrated using the stress–strain response of the [001] and [111] orientations, and the location and orientation of slip marks and short cracks captured from the finite element simulation were consistent with the in situ SEM observations. Sun et al. [15] analyzed the contact stress and activation of the sliding system using the crystal plastic finite element method. The results indicate that the fretting state is a local sliding state in all loading conditions, leading to significant wear damage in the sliding zone, accompanied by surface peeling and microcracks. Currently, our research focusing on the failure mechanism of thermal barrier coating and single-crystal superalloy is limited to the macroscopic level, with the crystal plasticity theory of single-crystal superalloy at the microscopic scale not yet incorporated into the numerical simulation of TBCs. Therefore, this study integrated the stress failure model of the macroscopic TBCs with the crystal plasticity model of the mesoscopic single-crystal superalloy. Finite element analysis was carried out on the macroscopic stress of the nickel-based single-crystal superalloy and the activation of the sliding system of different orientations at the mesoscopic level, aiming to establish the multi-scale stress and strain distribution system from the macroscopic level to the sliding level. The multi-scale system can be employed to investigate the processes of crack initiation and propagation in the substrate during the actual experiments. Additionally, it provides a theoretical foundation for the structural integrity of single-crystal superalloys.

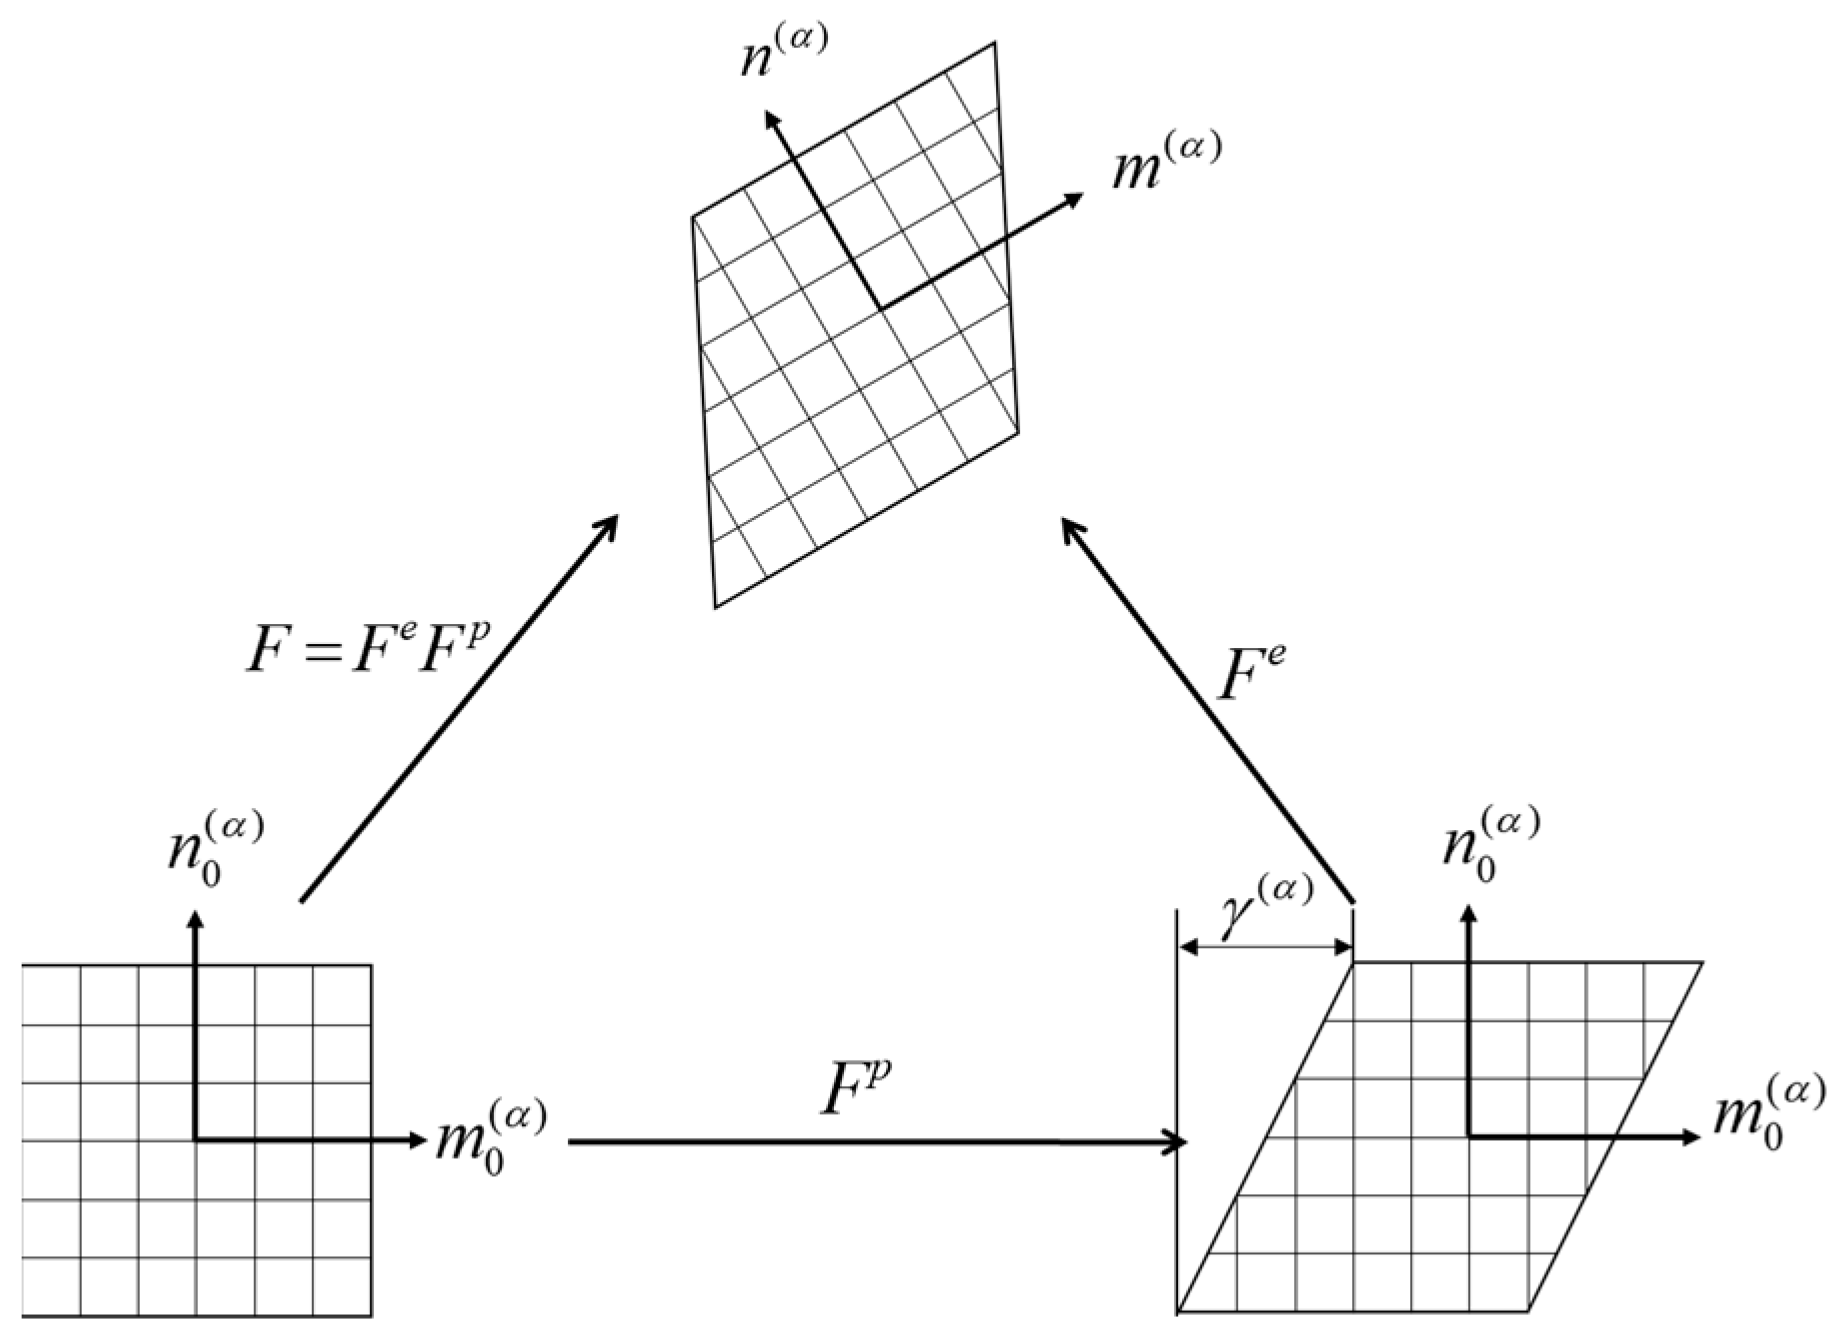
2. Finite Element Theory of Crystal Plasticity

2.1. Kinematic Equation

The crystal plasticity model was initially introduced by Taylor in 1938 [16]. Hill (1966) and Hill and Rice (1972) [17,18] provided a rigorous description of crystal slip deformation geometry and kinematics. Furthermore, Asaro and Rice (1977) and Pei et al. (1982) [19,20] engaged in a thorough and insightful exploration of crystal plastic constitutive models, providing a comprehensive analysis of the topic.
In accordance with classical theory, crystal deformation consists of two physical processes: elastic deformation associated with lattice stretching and plastic deformation resulting from lattice rearrangement (shown in Figure 1). For large deformation, the total deformation gradient tensor is decomposed into an elastic part F e  and plastic part F p by multiplication, and the total deformation gradient F of the crystal can be expressed as
F = F e F p
where F e is the elastic deformation gradient raised from lattice distortion and rigid body rotation. The plastic deformation gradient, denoted as F p , corresponds to the uniform shear of a crystal along the direction of sliding [21,22].
Given the velocity gradient denoted as L, which represents the decomposition resulting from the multiplication of the aforementioned deformation gradient, it is possible to further break down the velocity gradient into its constituent components. These components correspond to slip, lattice distortion, and rigid body rotation, respectively:
L = F ˙ F 1 = F e ( F e ) 1 + F e F ˙ p ( F p ) 1 ( F e ) 1 = L e + L p
Assuming the total number of slip systems is N, it can be proved that the plastic part of the velocity gradient caused by slip is L p :
L p = F e F ˙ p ( F p ) 1 ( F e ) 1 = α = 1 N γ ˙ ( α ) m ( α ) n ( α )
γ ˙ ^ ( α ) refers to the slip shear rate of the α slip system, and m ( α ) and n ( α ) are the slip direction and the normal unit vector of the slip surface, respectively. The velocity gradient can be decomposed into the sum of the symmetric part and antisymmetric parts:
L = 1 2 ( L + L T ) + 1 2 ( L L T ) = D + W
where D is the deformation rate tensor, and W is the rotational tensor.
D = 1 2 ( L + L T ) = D e + D p
D e = 1 2 [ F ˙ e ( F e ) 1 + ( ( F e ) T ) 1 ( F ˙ e ) T ]
D p = α = 1 N P ( α ) γ ˙ ( α )
where P ( α ) is the orientation factor, a second-order tensor, defined as
P ( α ) = 1 2 ( m ( α ) n ( α ) T + n ( α ) m ( α ) T )
W = 1 2 ( L L T ) = W e + W p
W e = 1 2 [ F ˙ e ( F e ) 1 + ( ( F e ) T ) 1 ( F ˙ e ) T ]
W p = α = 1 N W ( α ) γ ˙ ( α )
where W ( α ) is defined as
W ( α ) = 1 2 ( m ( α ) n ( α ) T + n ( α ) m ( α ) T )
The above Equations (1)–(12) [23,24,25] are the fundamental equations governing crystal deformation dynamics. These equations establish the correlation between the slip shear rate and the macroscopic deformation rate.

2.2. Hardening Criterion

To calculate the stress rate, it is necessary to first determine the shear strain rate of each slip system. In the rate-dependent crystal plasticity model, the slip system α of the slip shear strain rate γ ˙ ( α ) is determined by the power law and its corresponding critical shear stress τ ( α ) [26,27]:
γ ˙ ( α ) = γ ˙ 0 ( α ) sgn ( τ ( α ) \ g ( α ) ) τ ( α ) \ g ( α ) n
In Equation (13), γ ( α ) ˙ refers to the reference shear strain rate on the α slip system; g ( α ) is the current strength variable of the slip system; n is the rate sensitivity coefficient, and as n approaches infinity, the rule approaches the rate-independent material description. The shear strain rate on each slip system is uniquely determined by the above equation. Due to the work hardening, the strength g ( α ) of the slip system increases with deformation. In the process of plastic deformation of crystalline materials, multiple slip systems are generally activated, and it is commonly believed that the hardening of each slip system is related to all activated slip systems. The evolution of strength g ˙ ( α ) is determined by the following formula [28]:
g ˙ ( a ) = β = 1 N h α β γ ˙ β
where h α β is the slip hardening modulus. When α = β , h α β refers to the self-hardening modulus, indicating the hardening caused by the slip of slip system α on its own slip system. When α β , h α β refers to the latent hardening modulus, which represents the hardening of slip system α caused by slip shear strain in slip system β.
A power function is used to describe the self-hardening modulus [29]:
h α α = h 0 sech 2 h 0 γ / ( τ s τ 0 )
where h 0 is the initial hardening modulus; τ 0 is the initial critical shear stress; τ s is the saturated flow stress; and γ is the cumulative shear strain of the starting slip system, which can be defined as [30,31]:
γ = α 0 t γ ( α ) d t
For the latent hardening modulus, some simplified forms are often adopted in practical applications; for example, h α β can be expressed as
h α β = q h ( γ ) ( α β )
where q is the latent hardening coefficient.

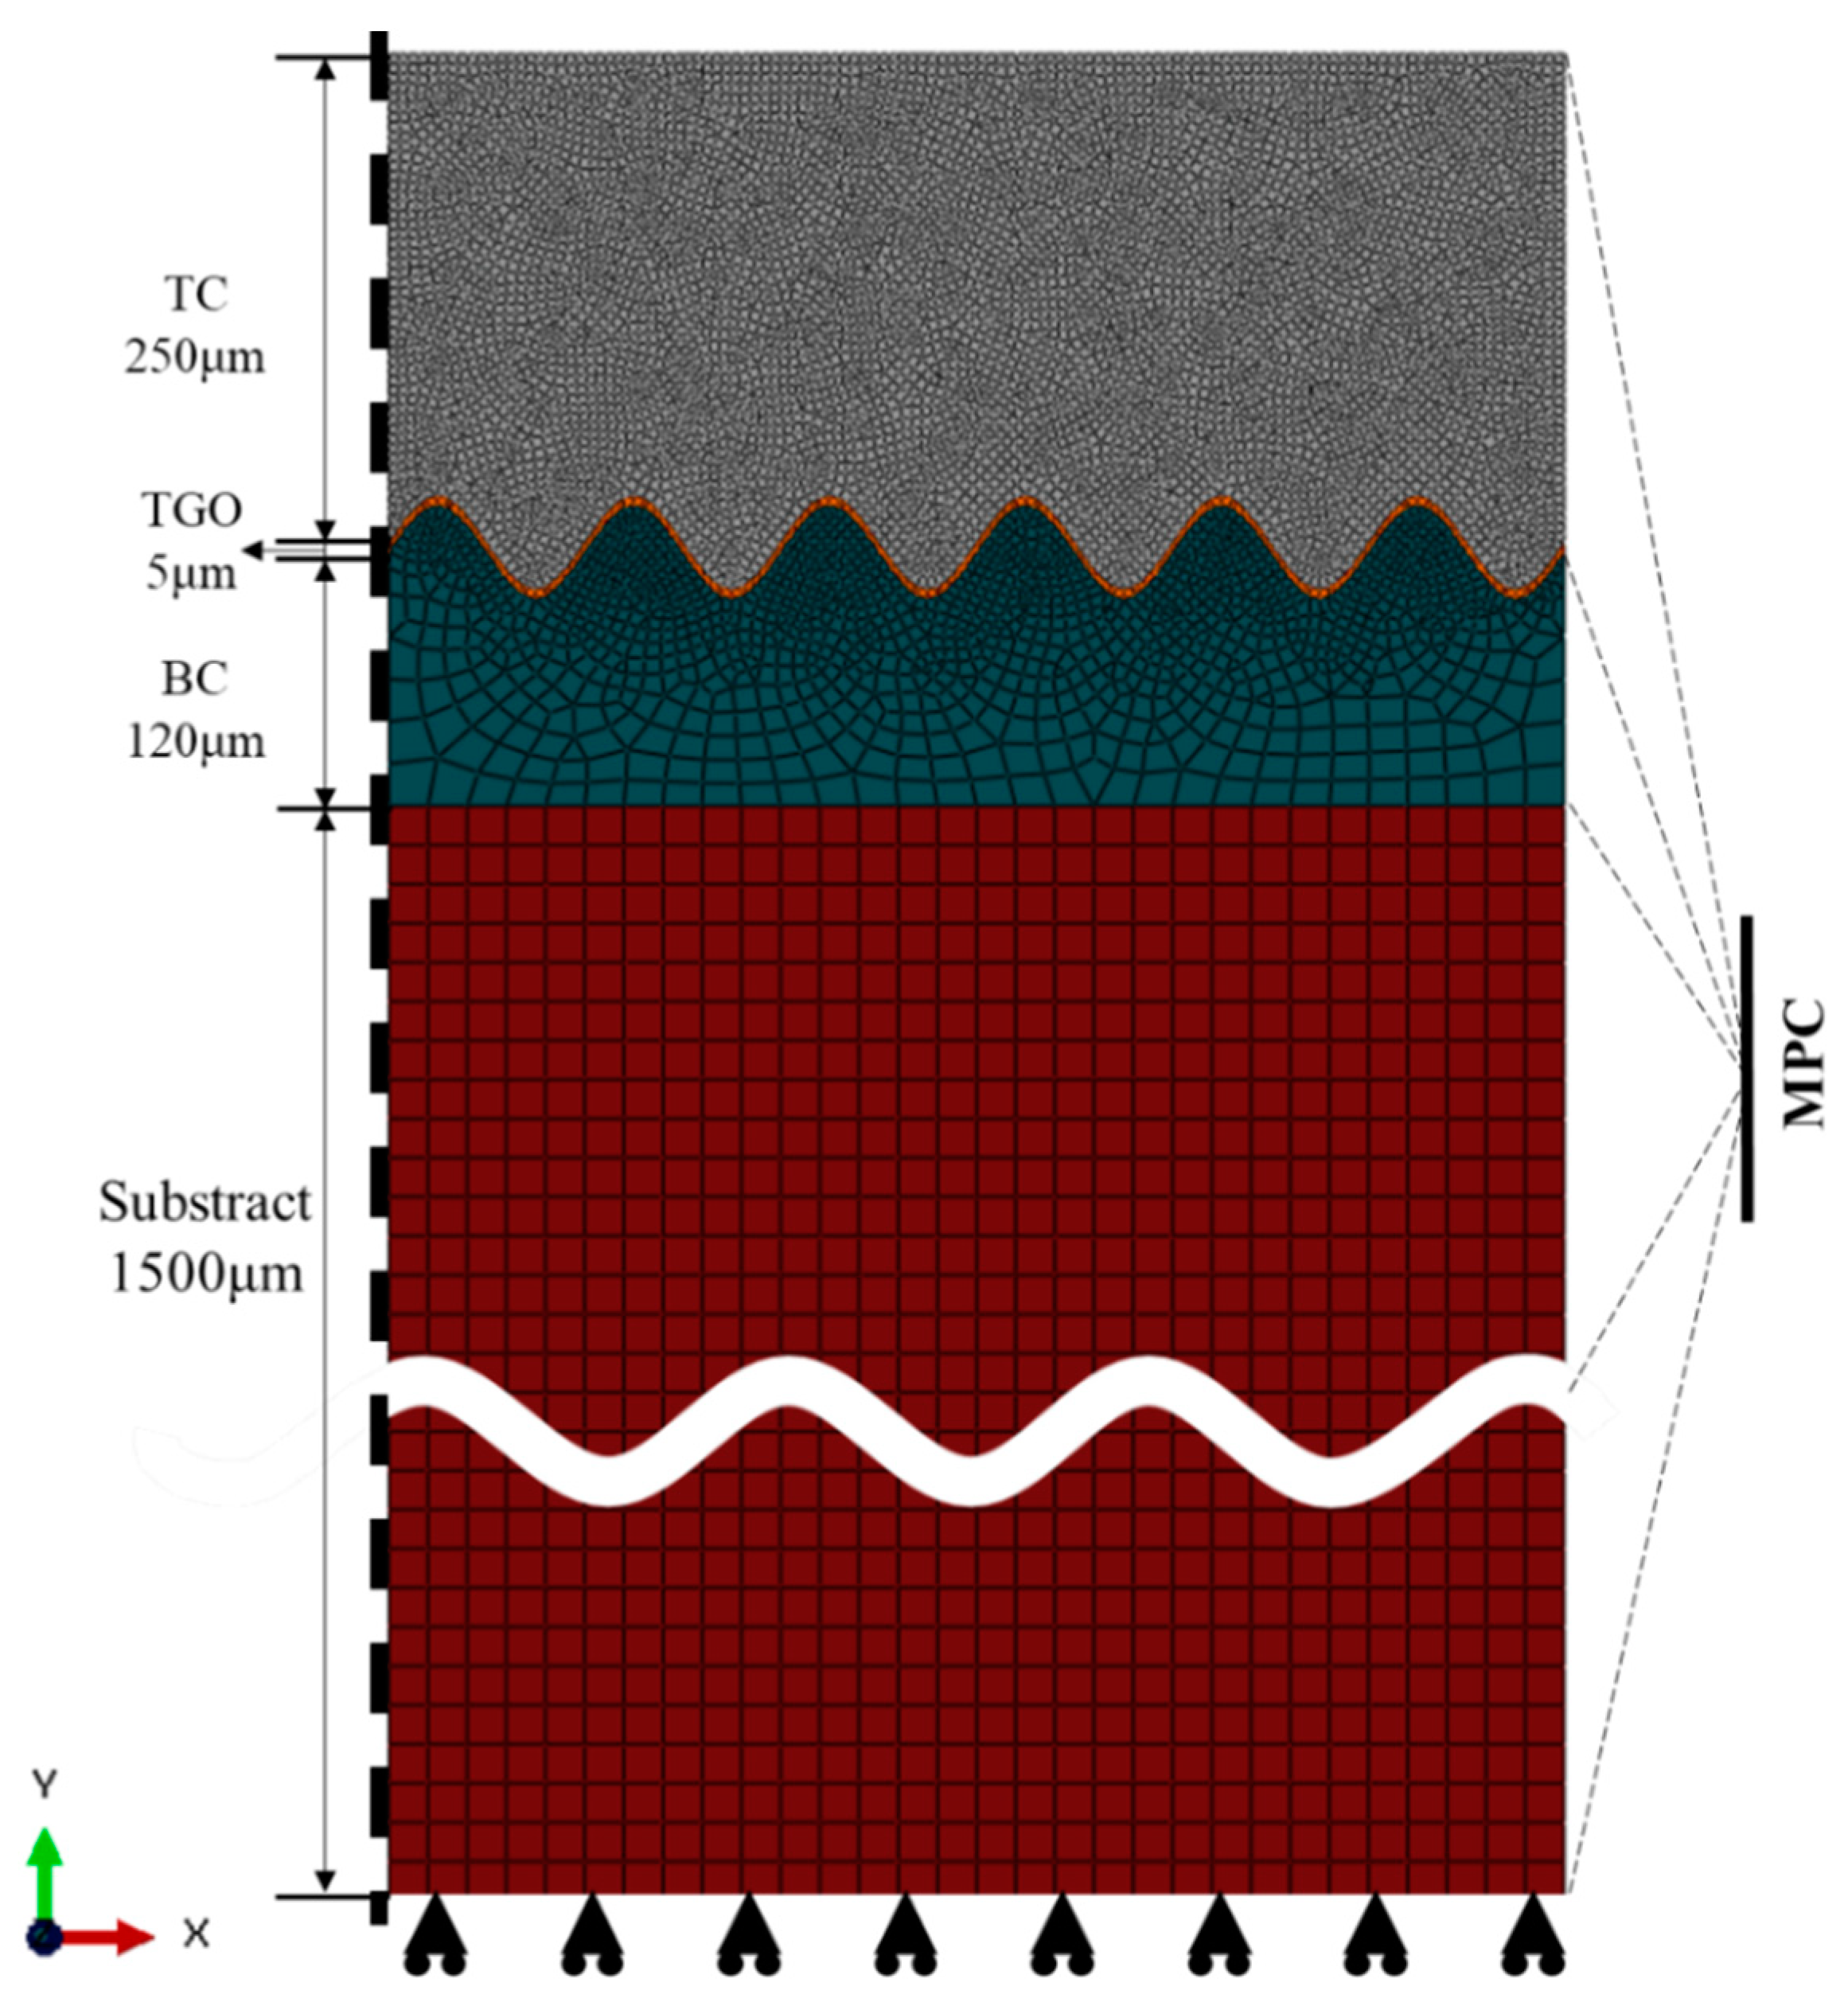
3. Finite Element Model

Two finite element models were established in this paper—one applied the planar thermodynamic coupling of the double-layer TBCs model, and the other applied the crystal plastic finite element model (CPFEM).

3.1. TBCs Model

3.1.1. Geometric Model

Two-dimensional planar and deformable shell structures were created using the Standard/Explicit module in the finite element software ABAQUS 2022. The following assumptions were made in order to simplify calculations: (1) the whole TBCs is assumed to be uniform and continuous, without pores, micro-cracks, or other defects; (2) the combination between each layer is reliable, and each layer will not experience horizontal dislocation or vertical separation; (3) the interface morphology of the thermal barrier coating is assumed to be symmetrically expanded from the two-dimensional model morphology, and the initial state is stress-free.
Reference [7] shows that the thickness of each layer has a significant impact on the service life of the TBC system. The thickness of the TC layer is generally 300 μm, and the coating in the industrial gas turbine can reach 600 μm [32]. The thickness of the BC layer of a typical APS TBC is 75~150 μm, and the thickness of the TGO layer is generally 1~10 μm. Therefore, this section takes TBCs with a double-layer structure widely used in the industry as the research object, and its structure is shown in Figure 2. The top TC of the ceramic is ZrO2 (YSZ) stable with ωt = 7% Y2O3, and the bottom substrate is DD6 nickel-based single-crystal superalloy. The bonding layer is NiCrAlY alloy, and TGO is α-Al2O3. The thicknesses of TC, BC, and substrate are 250 μm, 120 μm, and 1.5 mm, respectively. The thickness of TGO is 5 μm. In the model, the ceramic overlay interface and the TGO interface morphology are simplified to perfect sinusoids [33,34]. The sine curve is given by
y ( x ) = A   sin ( 2 π λ x )
where the interface morphology is determined by A and λ (A = 30 μm: interface amplitude, λ = 100 μm: interface wavelength) [7,32].

3.1.2. Material Parameters

In this section, it is considered that each layer is made of viscoelastic material, and the basic material parameters of each layer [35,36] are shown in Table 1. For a more accurate analysis of coating stress, NORTON’s implicit creep equation is applied to introduce the creep properties of the material:
ε ˙ = B σ n
where ε ˙ is the creep rate ( s 1 ), σ is the equivalent stress (MPa), B is the temperature-dependent creep coefficient, and n is the stress index. The creep parameters of each layer are shown in Table 2 [36,37].

3.1.3. Load and Boundary Conditions

It is assumed that the whole TBC system is in a uniform temperature field, and there is no heat conduction between the four layers. The temperature of the whole sample was heated from 20 °C to 1100 °C within 120 s, kept for 1800 s, and then dropped to 20 °C after 120 s to complete a cycle. It is assumed that the initial state is stress-free at 1100 °C [1,33,37,38], and the residual stress at 20 °C is calculated. The finite element model incorporates symmetric boundary conditions on its left side, constraining the Y-axis movement at the bottom boundary while leaving the upper boundary unrestricted as a free boundary. Considering the continuity of the material in the right boundary, the multipoint constrained boundary condition (MPC) is employed to ensure that the boundary exhibits identical displacement in the X-axis direction. The model uses a four-node bilinear plane decreasing integral strain element (CPE4R), as shown in Figure 2.

3.2. Crystal Plasticity Finite Element Model

The DD6 nickel-based single-crystal superalloy exhibits a surface-centered cubic (FCC) structure as its phase-transition structure, characterized by the presence of 12 possible slip systems [14]. The shear strains on different slip systems are calculated by the UMAT subroutine in ABAQUS 2022 software.

3.2.1. Geometric Model

As shown in Figure 3a, a cubic single-crystal model of 1.5 mm × 0.6 mm × 0.02 mm was established by ABAQUS/CAE. The finite element model consisted of 2250 three-dimensional hexahedral elements (C3D8), each representing a grain, and the element size was about 0.02 mm, which made it convenient to apply material parameters.

3.2.2. Crystal Plastic Material Parameters

Elastic parameters in crystal plastic models are [39]:
C 11 = E ( 1 ν ) ( 1 + ν ) ( 1 2 ν ) ,   C 12 = E ν ( 1 + ν ) ( 1 2 ν ) ,   C 44 = A 2 ( C 11 C 12 )
where A is the Zener coefficient, which is A = 2.5 [40] for nickel-based single crystal, and the elastic modulus [36] for each orientation of DD6 is shown in Table 3; and Poisson’s ratio is υ = 0.383. Slip parameters in the crystal plastic model [15] are n = 1 / m , γ ˙ 0 ( a ) = 0.03 , where m = 0.02. Hardening parameters [41] are h 0 / τ 0 = 1.2 , τ s / τ 0 = 1.17 , q = 1.3 .

3.2.3. Load and Boundary Conditions

As depicted in Figure 3b, the model undergoes simultaneous deformation in the x and z directions while experiencing unrestricted deformation in the y direction due to the implementation of symmetric boundary conditions on both sides of the model. In order to mitigate the occurrence of rigid body displacement, a displacement constraint is imposed in the y direction on the lower boundary of the model [42]. At the same time, in order to facilitate calculation, the vertical stress generated by the thermal barrier coating is uniformly applied to the upper surface of the single-crystal superalloy substrate.
Turbine blades work in an environment where multiple physical fields interact (high speed, high pressure, and high-temperature coupling) and mainly bear three kinds of loads: centrifugal load, temperature load, and aerodynamic load. In the actual work of blades, the blade stress generated by centrifugal force is much greater than that generated by vibration load and gas force, and the vibration load and gas force basically do not change the stress/strain distribution of blades [43]. Therefore, in order to more accurately analyze the stress and strain of turbine blades under actual working conditions and the operation of the slip system, a uniformly distributed centrifugal force load is applied to the right boundary of the finite element model. The formula for centrifugal force load is as follows:
F = m R ω 2
In Equation (21), F is the centrifugal force, m is the blade mass, R is the distance from the blade centroid to the wheel axis, and ω is the rotation speed of the blade.

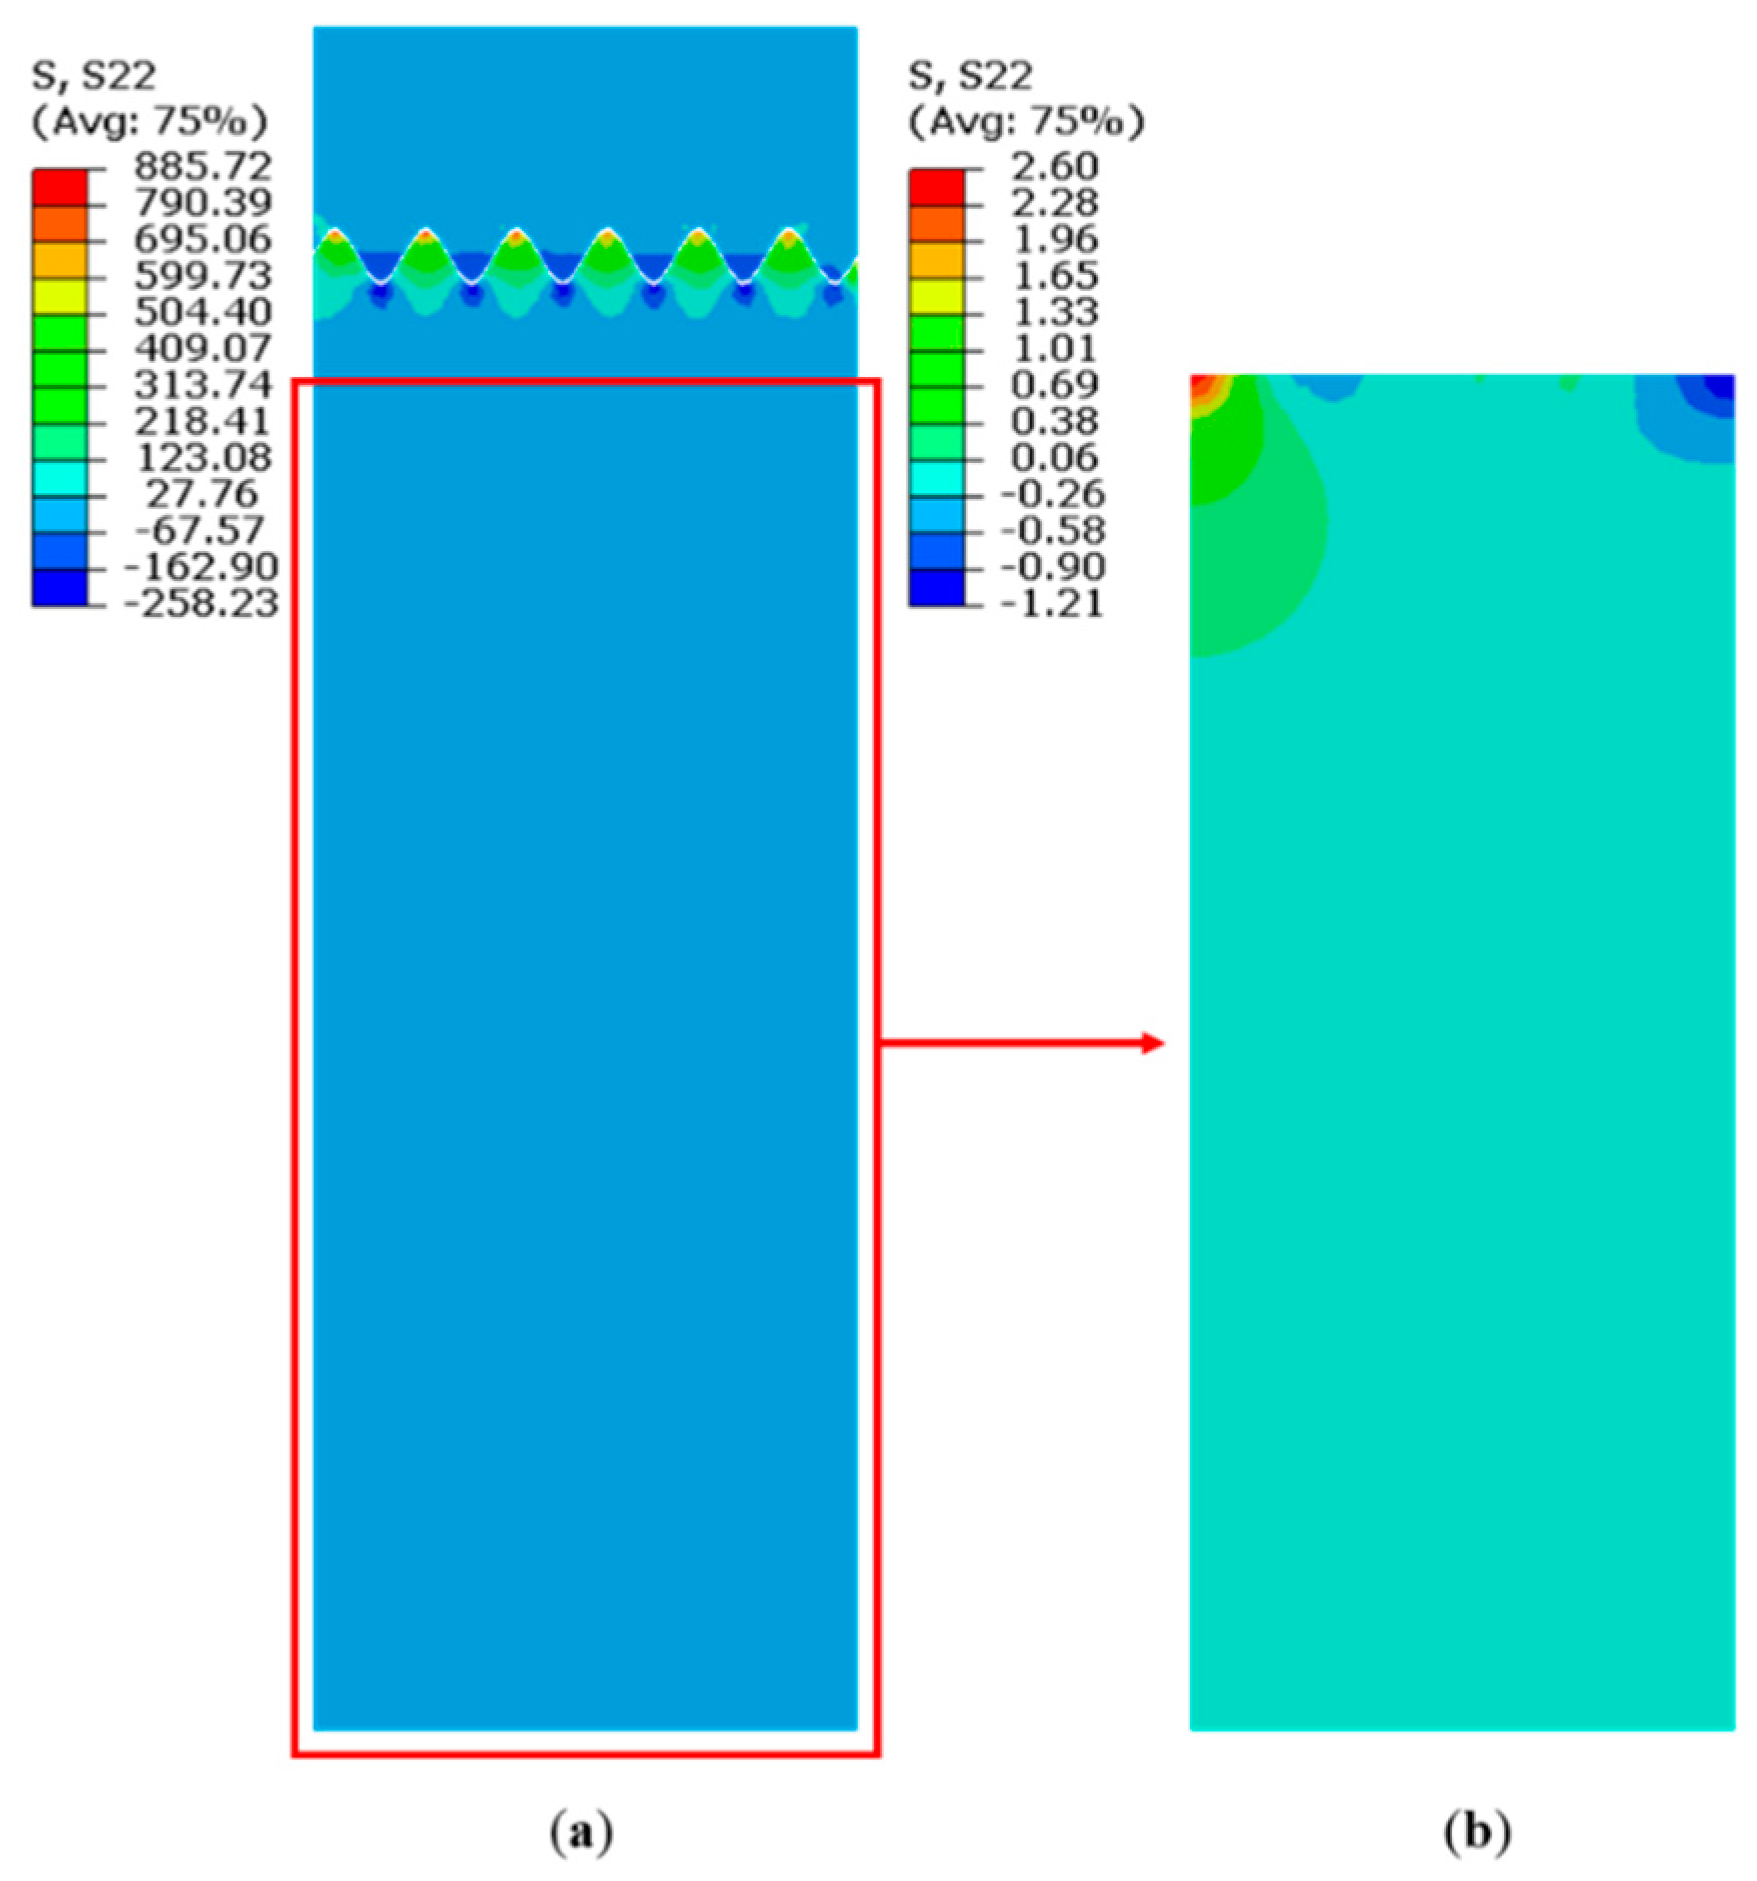
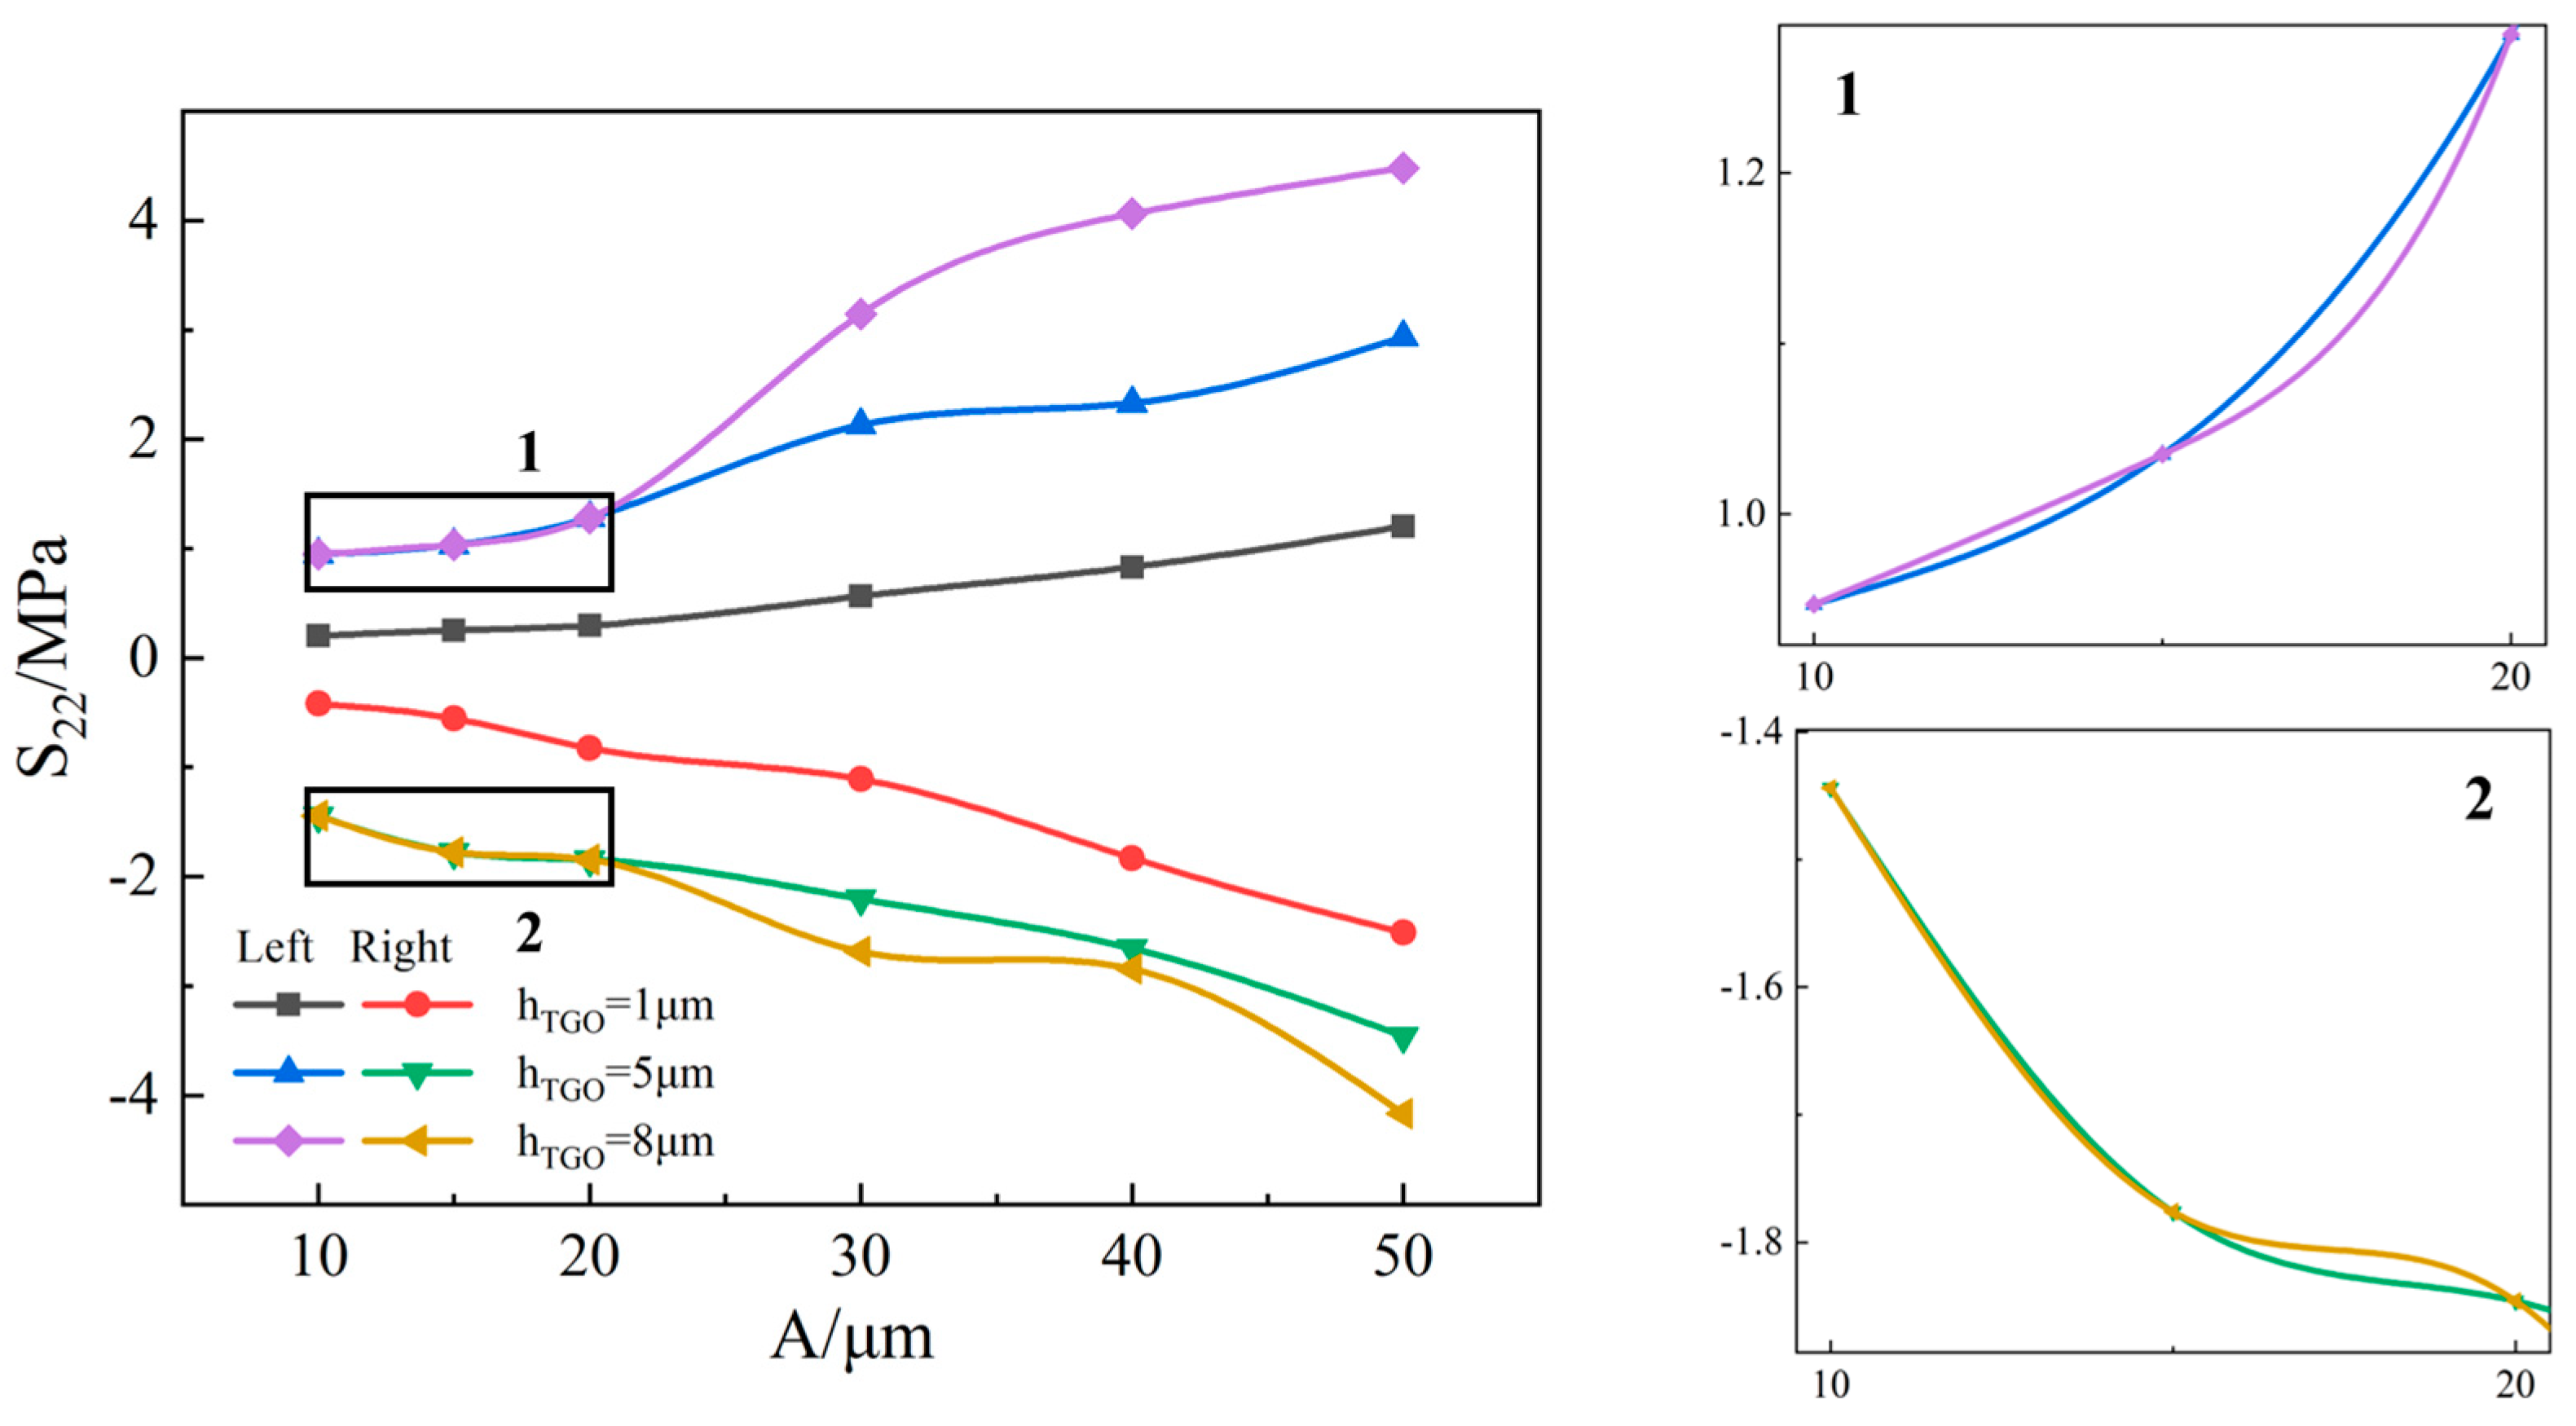
4. Results and Discussion

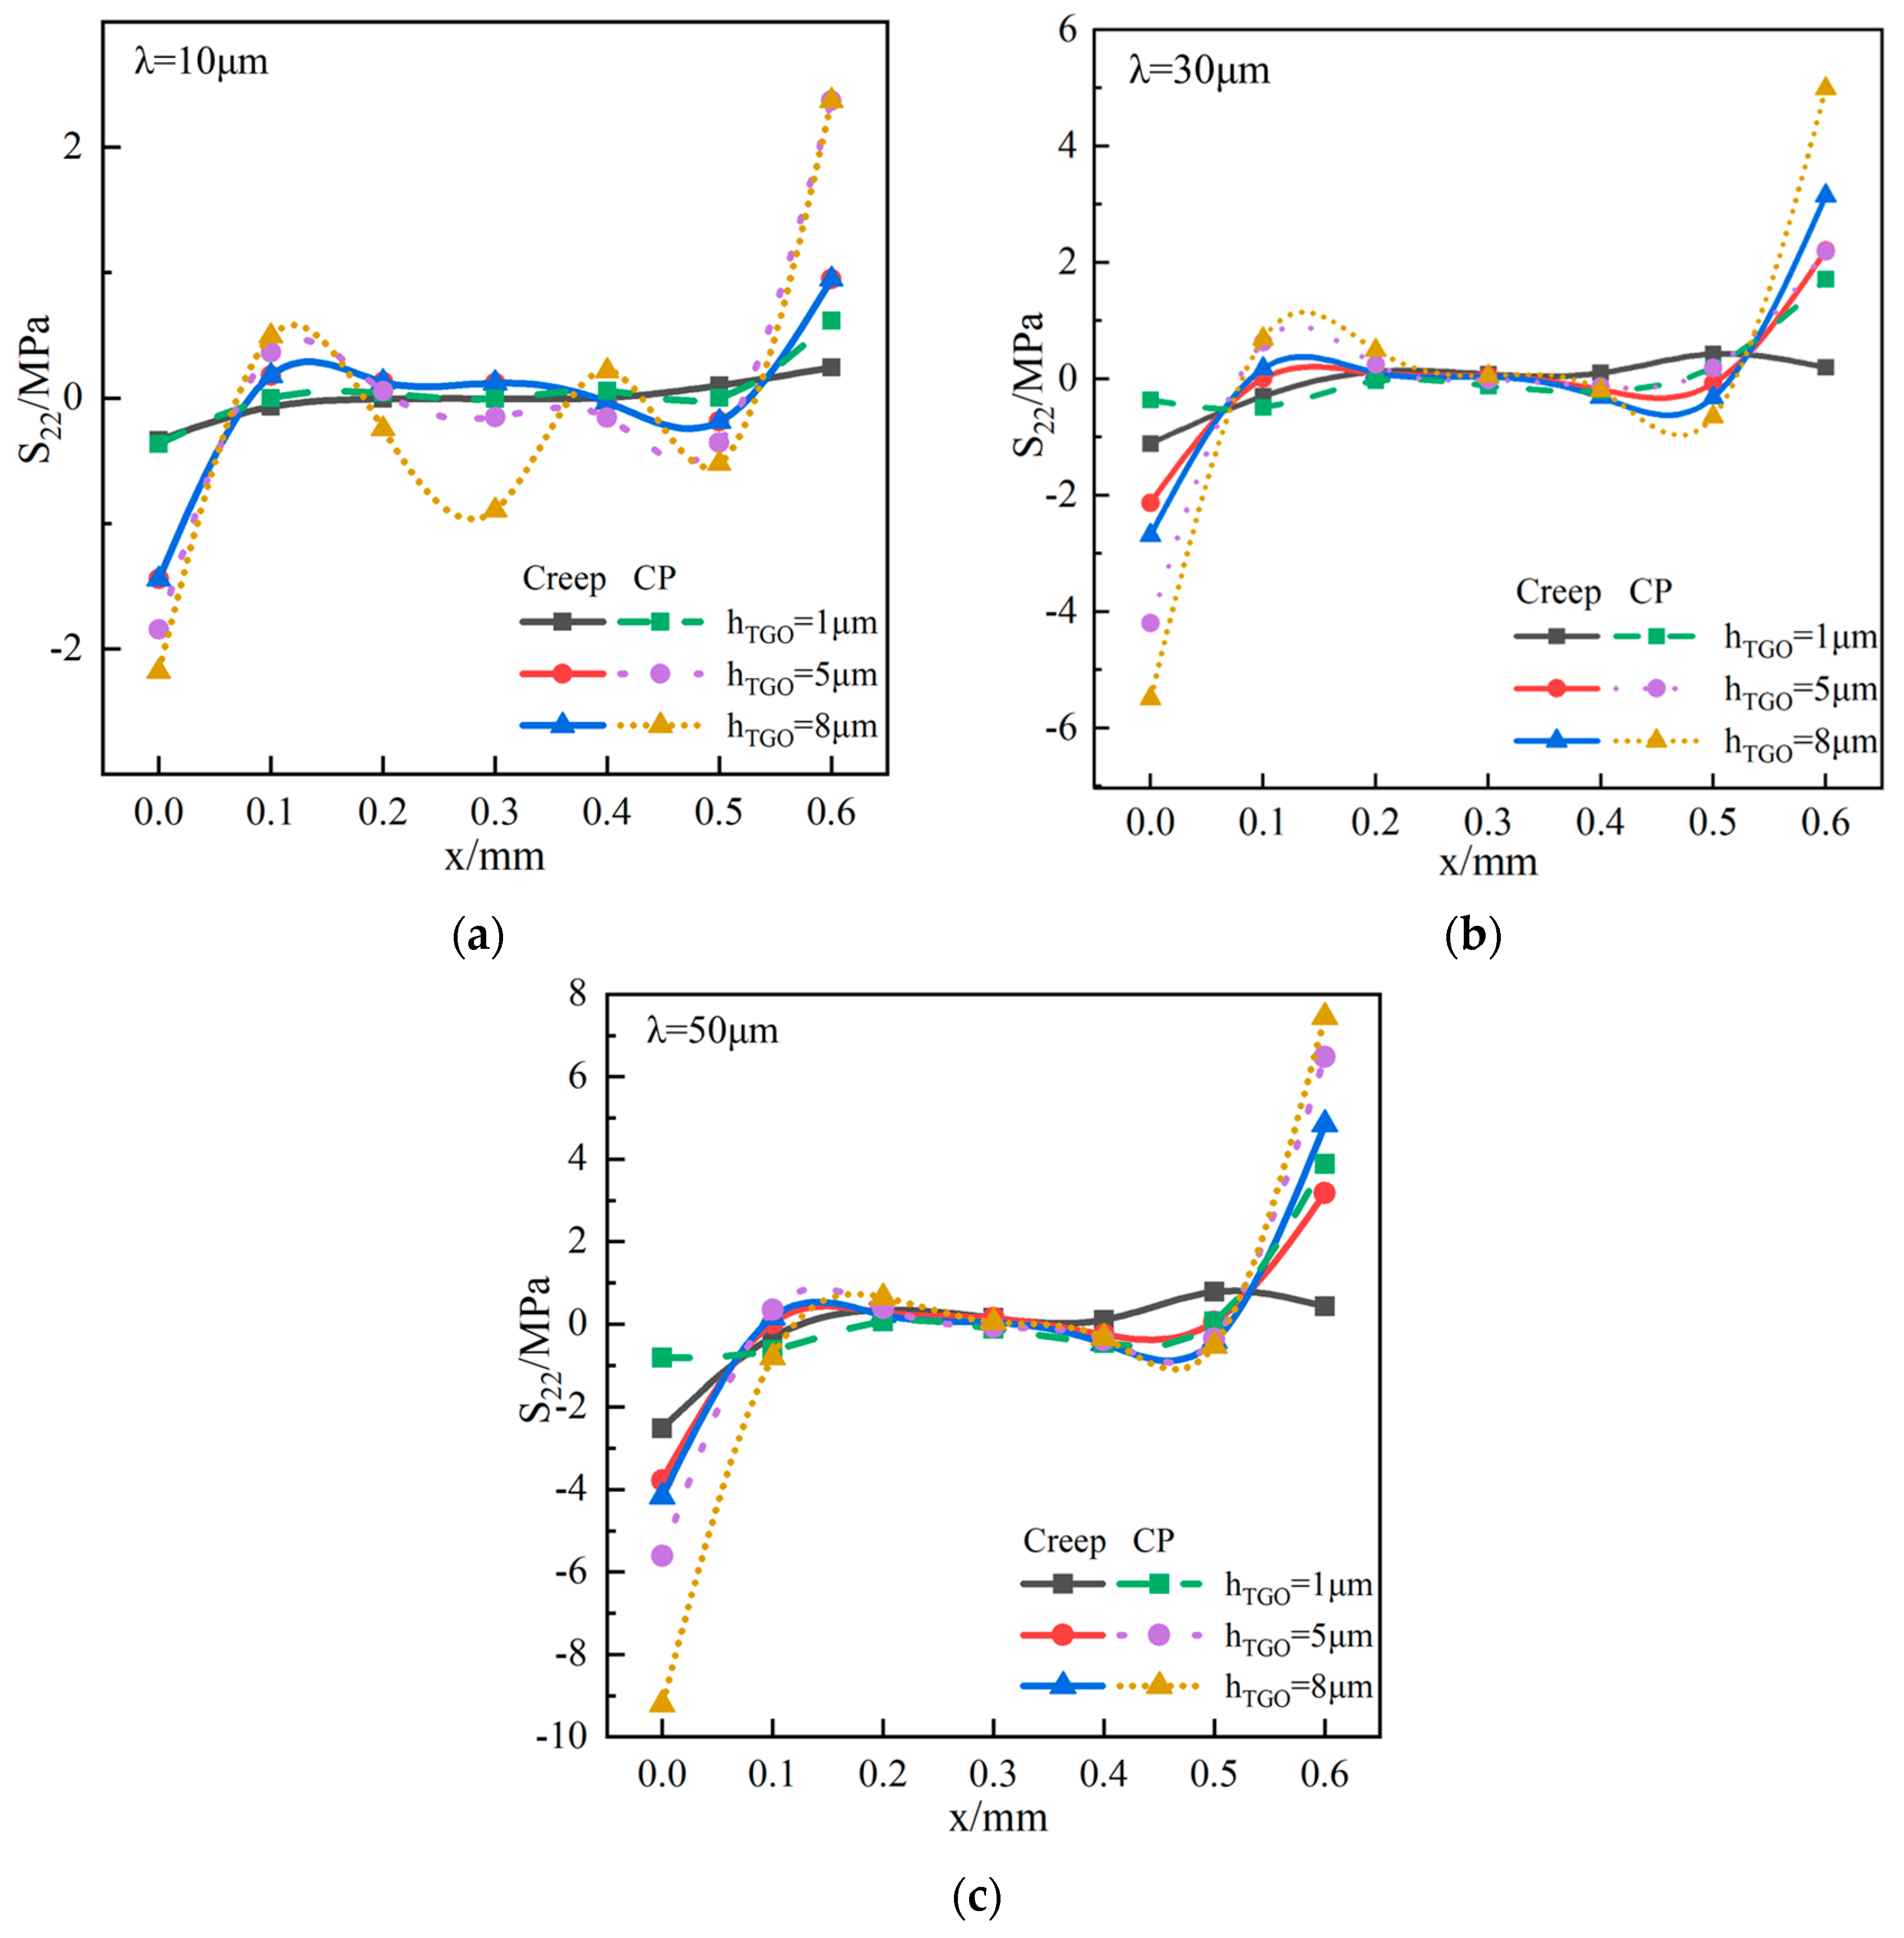
4.1. Influence of Interface Amplitude on Residual Stress of Substrate

In this study, the results of the temperature field are introduced into the stress model as a predefined field by means of sequential coupling. Under normal conditions, the development of interfacial cracks primarily relies on the interfacial tensile stress in the thickness direction (Y-axis). This stress steadily escalates and attains its peak value toward the conclusion of the cooling process. Therefore, this section only studies the distribution of normal residual stress S22. As shown in Figure 4a, the interface stress is mainly concentrated at the TGO/BC interface, where the tensile stress at the trough is about 885.71 MPa, and the compressive stress at the peak is about 258.23 MPa. Therefore, cracks easily form at the BC/TGO interface. The stress on the substrate interface is small and cannot be shown in the whole nephogram, so the stress nephogram of the substrate is extracted and analyzed. As shown in Figure 4b, both sides of the substrate are affected by tensile stress and compressive stress, which are 2.60 MPa and 1.21 MPa, respectively. From this, it can be concluded that the entire TBC system is mostly composed of thermal barrier coatings that withstand the thermal stress generated by high temperatures.
Figure 5 shows the variation of peak residual stress S22 on both sides of the BC–substrate interface with TGO thickness and interface amplitude; three TGO thicknesses of 1 μm, 5 μm, and 8 μm were considered. Under the three TGO thicknesses, the residual stress of the BC–substrate interface is tensile stress on the left and compressive stress on the right. A previous study [33] has shown that the residual stress of each interface increases with the increase in the interface amplitude. As can be seen in Figure 5, the amplitude has a significant effect on the residual stress of the BC-substrate interface, and the absolute value of the residual stress increases with the increase in the interface amplitude. When the thickness of the TGO layer is 1 μm or 5 μm, it is seen that the magnitude of compressive stress exceeds that of tensile stress. When the thickness of the TGO layer is 8 μm, it can be observed that the magnitude of compressive stress exceeds the magnitude of tensile stress for amplitudes below 20 μm. Conversely, for amplitudes over 30 μm, the magnitude of compressive stress is found to be lower than the magnitude of tensile stress. When the thickness of the TGO layer is 1 μm, 5 μm, and 8 μm; the tensile stress increases by 296%, 235%, and 411%; the compressive stress increases by 498%, 162%, and 189%, respectively; and the amplitude increases from 10 μm to 50 μm. Therefore, when the thickness of TGO is 1 μm, the influence of the interface amplitude on the tensile stress is greater than that of the compressive stress. The results were reversed when the TGO thicknesses were 5 μm and 8 μm.

4.2. Influence of Material Properties of Substrate

In order to more accurately describe the mechanical behavior of single-crystal alloys and the accuracy of the TBCs model, previous studies [7,26] have shown that the influence of the substrate cannot be ignored because the substrate will affect the value of S22 and the stress distribution along the interface. It can be seen from Figure 6 that the plasticity of the single-crystal material also has an impact on the distribution and value of residual stress at the interface. Therefore, the study in this section compares the thermal barrier coating and the vertical residual stress S22 along the interface of the substrate, which, respectively, consider two different material properties of the substrate material at different TGO amplitudes and thicknesses, including creep and crystal plasticity, which can provide a better basis for the TBCs plane model and crystal plastic model described above.
Figure 6 shows that when the interface amplitudes are 10 µm, 30 µm, and 50 µm, and the TGO thickness is 1 µm, 5 µm, and 8 µm, respectively, the influence of different material properties of the substrate on the S22 of the BC-substrate interface is considered. It is obvious from the figure that the peak stress is concentrated on both sides of the substrate; the left side is subjected to compressive stress, and the right side is subjected to tensile stress. When the thickness of TGO increases, the stress on both sides of the substrate also increases. When considering the plasticity of the single-crystal material, the tensile stress will increase at the peak, and this increase will become more obvious with the increase in TGO thickness. As shown in Figure 6a, when the amplitude is 10 μm and the TGO thickness is 5 µm, the stress trends of plasticity and creep of a single crystal are roughly the same, and the peak tensile stress of the substrate increases by 2.5 times when crystal plasticity is considered. As shown in Figure 6b, when the amplitude is 30 μm and the TGO thickness is 5 µm and 8 μm, the performance stress trend with the two materials’ properties is roughly the same and the peak tensile stress is approximately equal, while the peak compressive stress of the substrate increases by 2 times when considering the crystal plasticity. As shown in Figure 6c, the amplitude is 50 μm, and when the TGO thickness is 5 µm, the peak tensile stress of the substrate increases by 2 times, and the compressive stress increases by about 1.5 times considering the crystal plasticity. When the TGO thickness is 8 µm, the peak tensile stress and compressive stress of the substrate increase by 1.5 times and about 2 times, respectively, considering the crystal plasticity. Therefore, based on the above comparison, when the amplitude is 30 μm and the TGO thickness is 5 µm, the interfacial stress of the substrate at the macro scale is similar to the interfacial stress at the micro slip system scale, which corresponds to the finite element model in the previous section and provides a basis for the subsequent calculation results.

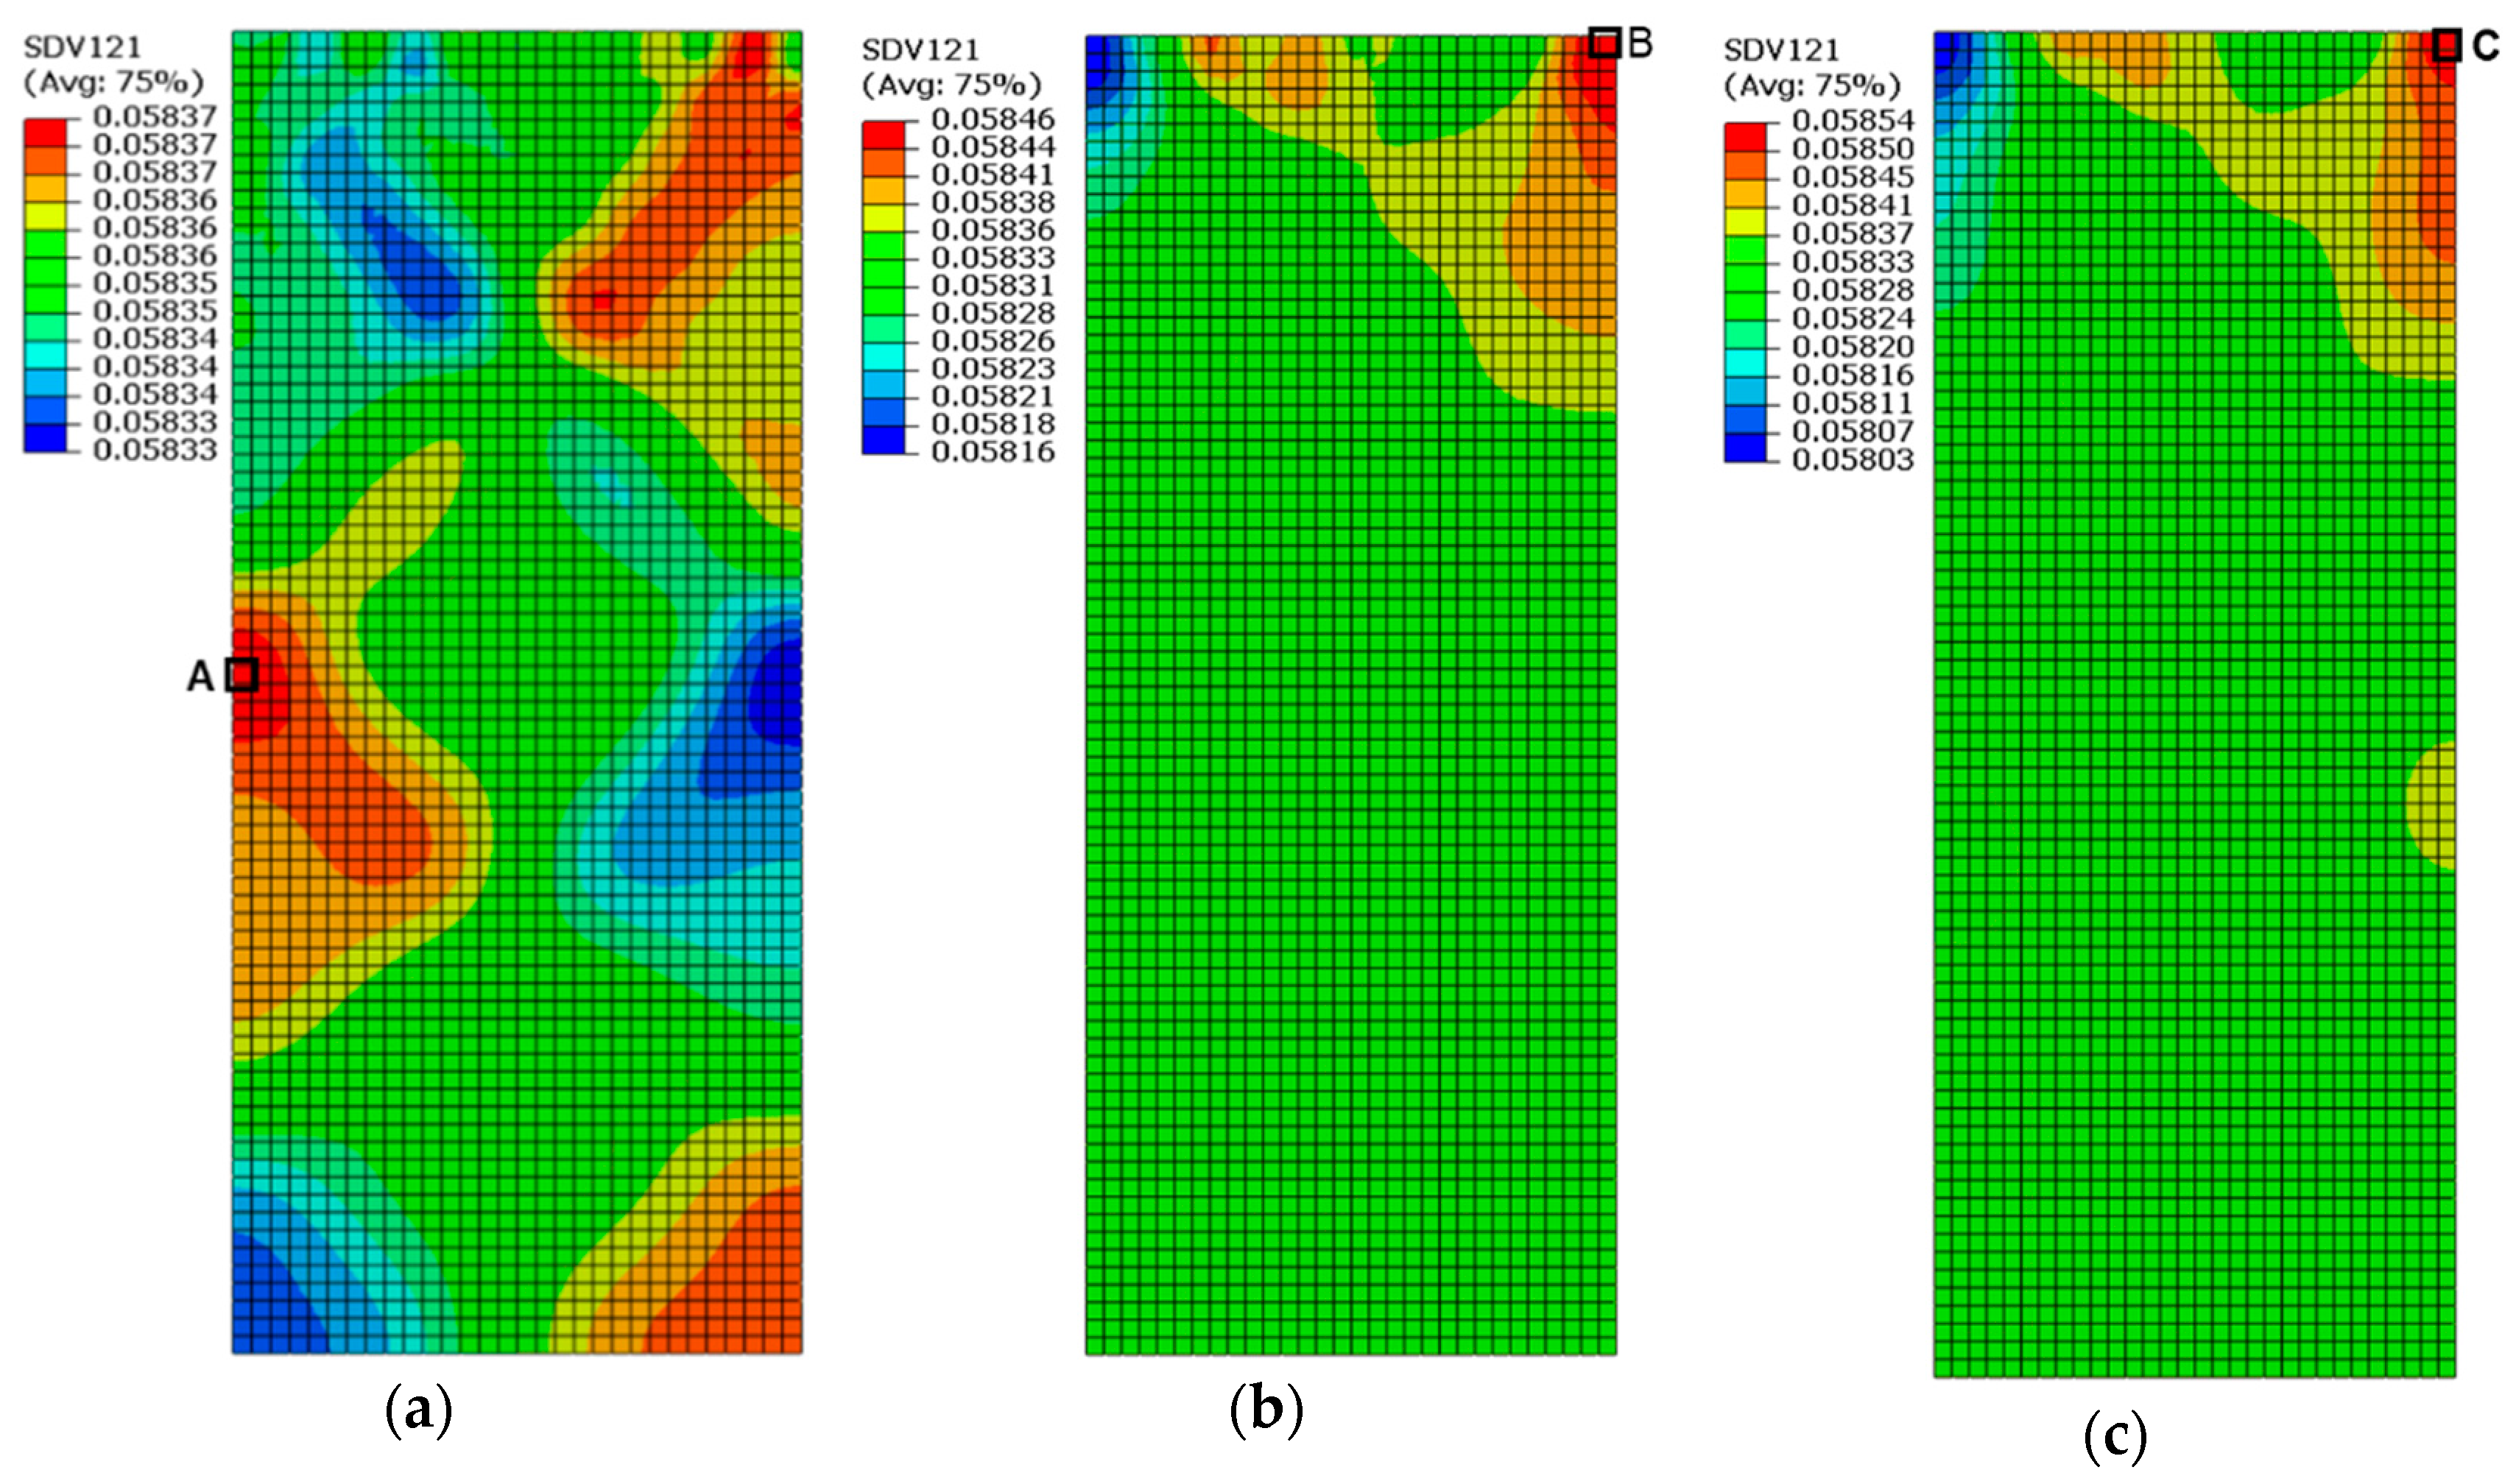
4.3. Influence of Different Orientations on Residual Stress of Substrate

In the context of nickel-based single-crystal superalloys, it is expected that the activation of all 12 octahedral slip systems will occur whenever the decomposition shear stress on the appropriate slip plane surpasses a critical threshold [14]. Determining the most active slip system is of significance, as it is more probable for slip cracks to form on the surface of the specimen as a result of these particular slip systems.

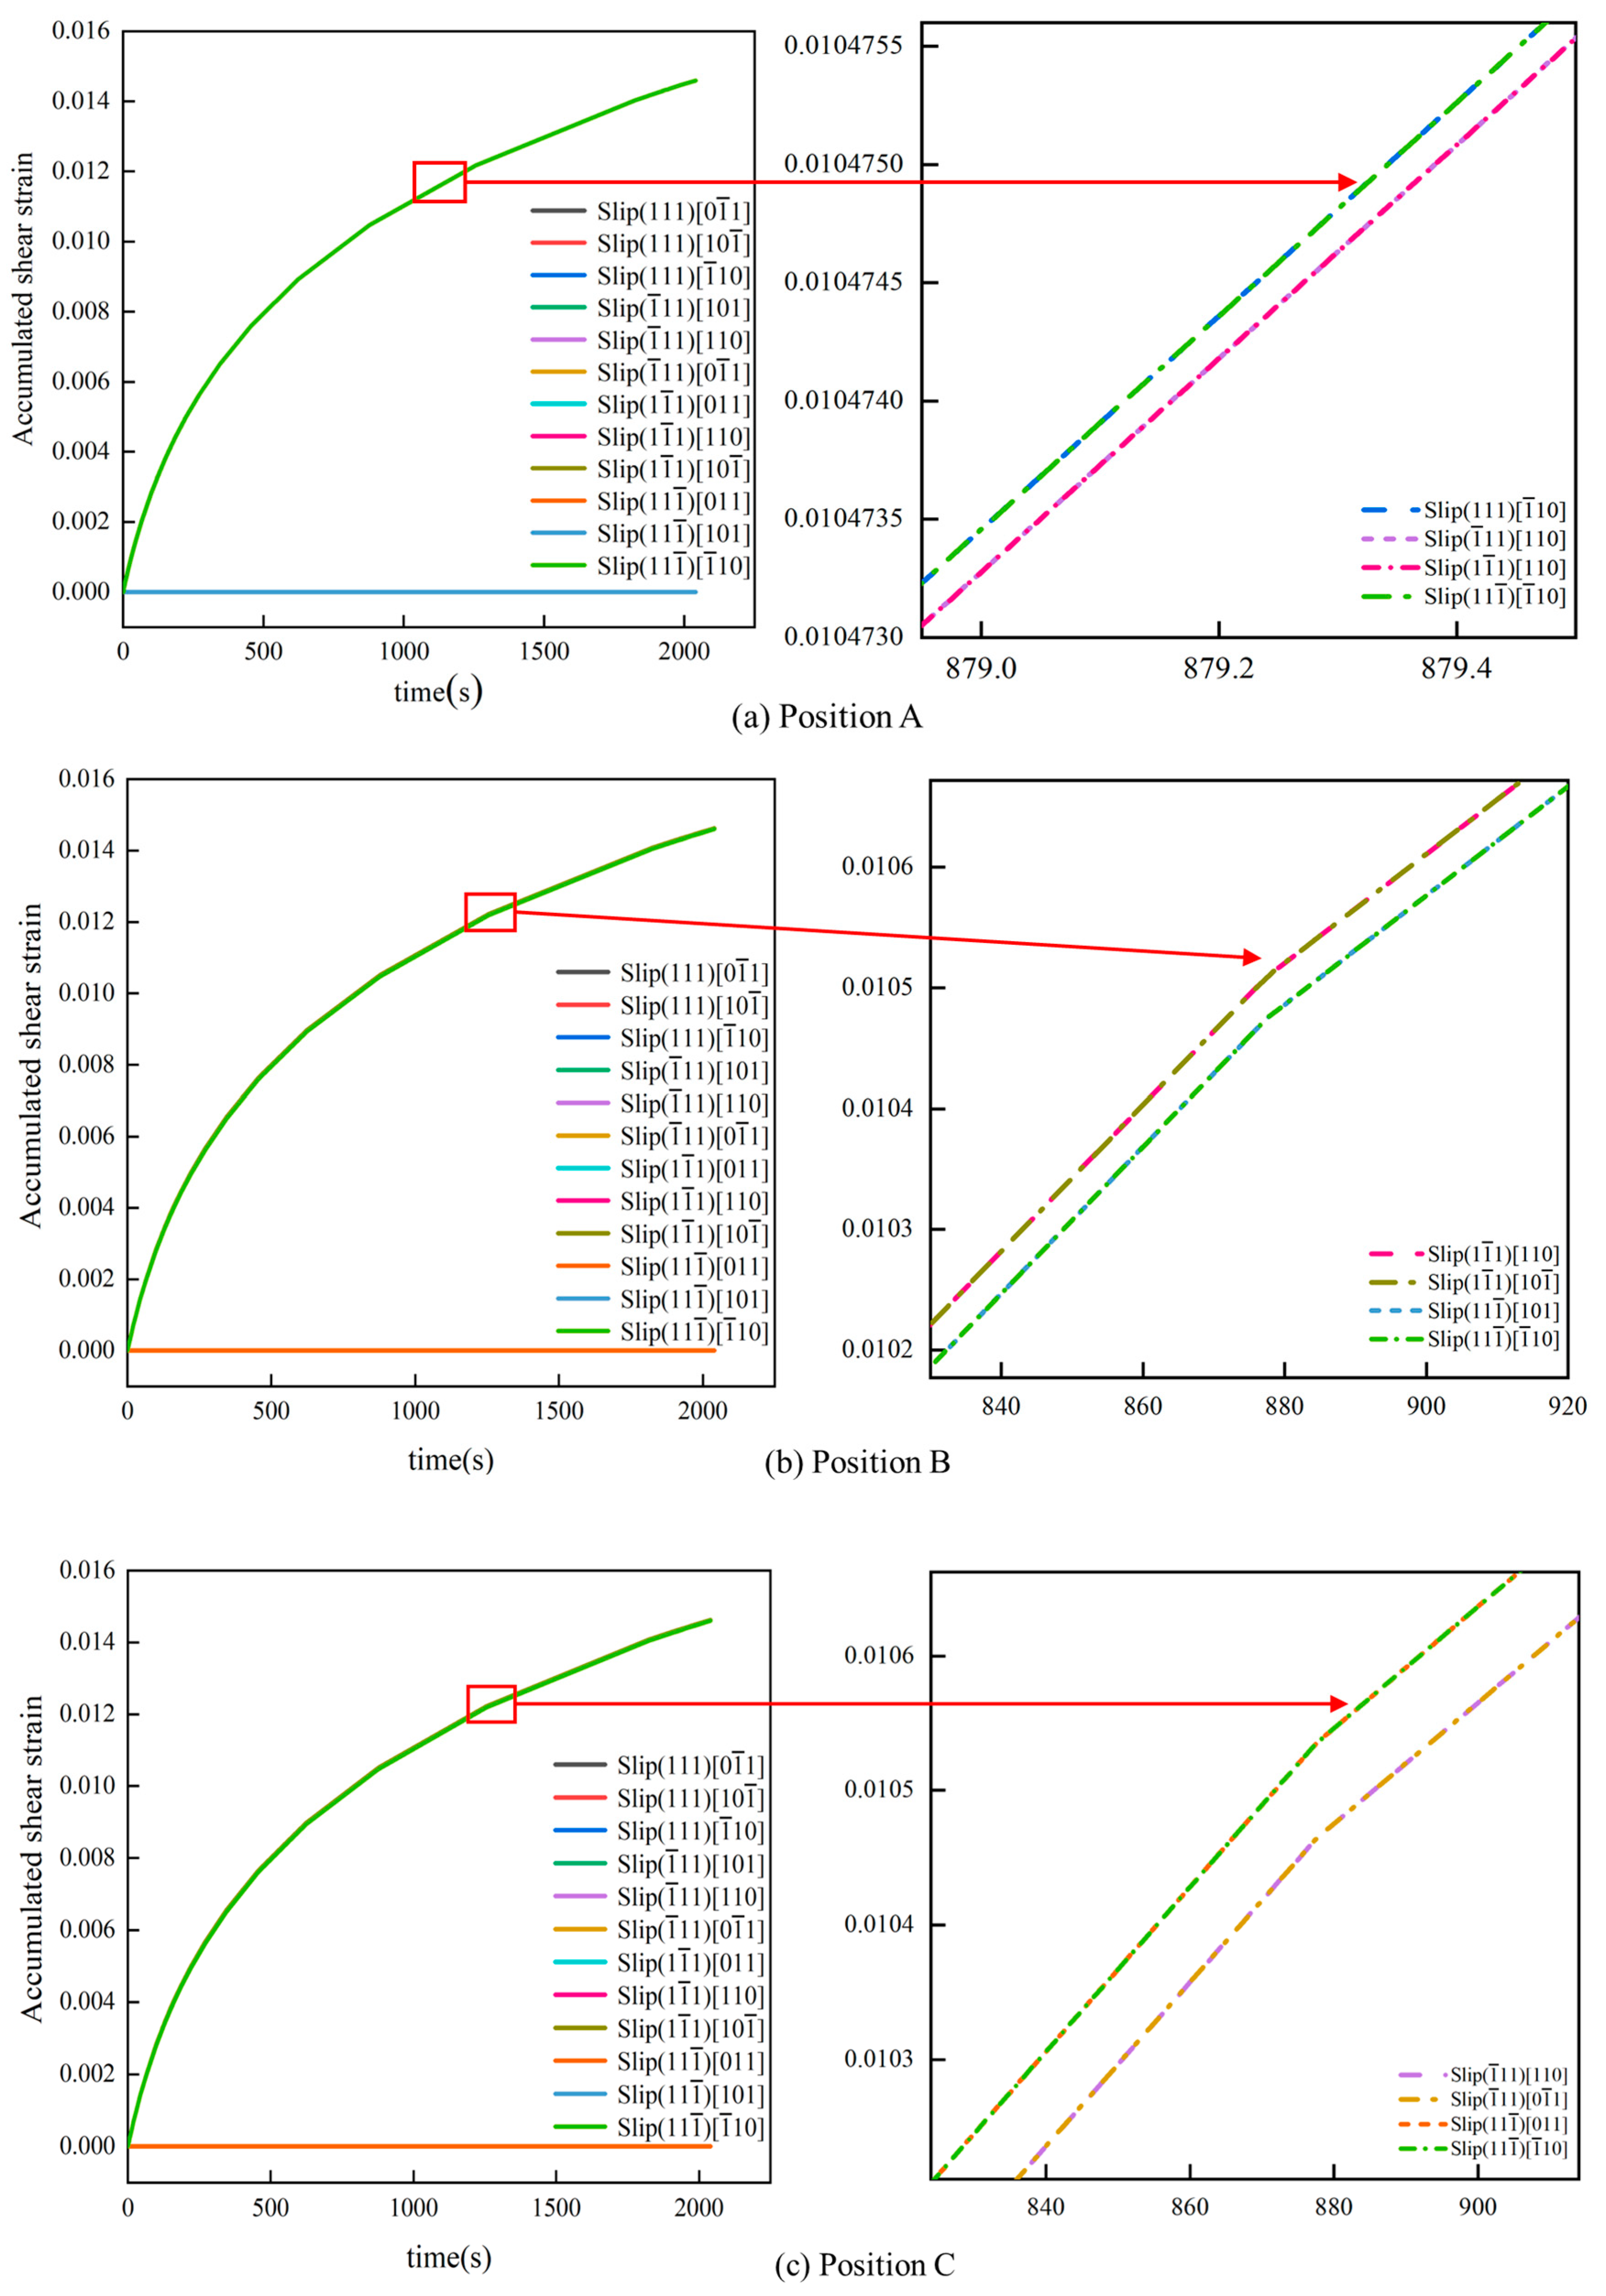
4.3.1. Activation of Slip Systems with Different Orientations

The development of the slip zone can be shown in the finite element simulation. According to the rate-dependent plastic constitutive model, the fundamental determinant of whether the slip system is activated is the degree of slip shear strain. Therefore, the cumulative shear strain values of 12 octahedral slip systems with different orientations are shown in Table 4. In [001], 12 sliding systems were activated; in [011], 8 sliding systems were activated; and in [111], 4 sliding systems were activated.
The total cumulative shear strain distributions of the three orientations determined by finite element simulation are shown in Figure 7. In order to better evaluate the operation of the slip system, positions A, B, and C of the maximum total cumulative shear strain sum of octahedral sliding systems with different orientations were selected, respectively, and the cumulative shear strain values of each sliding system were plotted as time functions in Figure 8. The cumulative shear strain of each slip system gradually increases with the passage of time [14], and the cumulative shear strain value is the largest when the initial orientation is [111], so the operation of the slip system will be more obvious. As shown in Figure 9, the cumulative shear strain in [001] is mainly concentrated in 111 1 ¯ 10 , 1 ¯ 11 110 , 1 1 ¯ 1 110 , 11 1 ¯ [ 1 ¯ 10 ] , the four groups of slip systems; [011] is mainly concentrated in 1 1 ¯ 1 110 , 1 1 ¯ 1 10 1 ¯ , 11 1 ¯ 101 , 11 1 ¯ 1 ¯ 10 ; and [111] is mainly concentrated in 1 ¯ 11 110 , 1 ¯ 11 0 1 ¯ 1 , 11 1 ¯ 011 , 11 1 ¯ 1 ¯ 10 .
According to the above results, when the initial orientation of DD6 is [001], the slip system is mainly activated along the a and b slip planes. At present, many authors have studied the slip and plastic deformation of nickel-based single-crystal superalloys at [001] orientation. For example, Li et al. [15] determined that the critical shear stress of DD6 was 349.8 MPa and used the crystal plasticity finite element method to determine that the slip systems 1 1 ¯ 1 011 , 11 1 ¯ 011 , 1 ¯ 11 0 1 ¯ 1 , ( 111 ) [ 0 1 ¯ 1 ] exceeded the critical shear stress value. Therefore, the cooling hole cracks in nickel-based single-crystal alloy thin films mainly follow the above slip bands. Zhang et al. [28] investigated the distribution of slip bands and activation of slip systems on the free surface of nickel-based single-crystal thin plates with dense film-like cooling holes. By determining the critical shear stress of each slip system exceeding DD6, the slip bands extended along the 011 and [ 0 1 1 ¯ ] directions activated by 1 1 ¯ 1 , 11 1 ¯ , 1 ¯ 11 , ( 111 ) slip planes, and cracks extended on the slip planes to form fracture planes. Therefore, according to the above study, when the initial orientation is [001], the slip system is activated mainly along the 1 1 ¯ 1 , 11 1 ¯ , 1 ¯ 11 , ( 111 ) slip planes, which is consistent with this study. The slip direction is slightly different, which is caused by the application of loads in different directions and different boundary conditions. In this study, the thermal barrier coating was sprayed on the surface of the single-crystal superalloy, and it was found that the thermal barrier coating had no effect on the operation of the sliding system of the single-crystal superalloy.

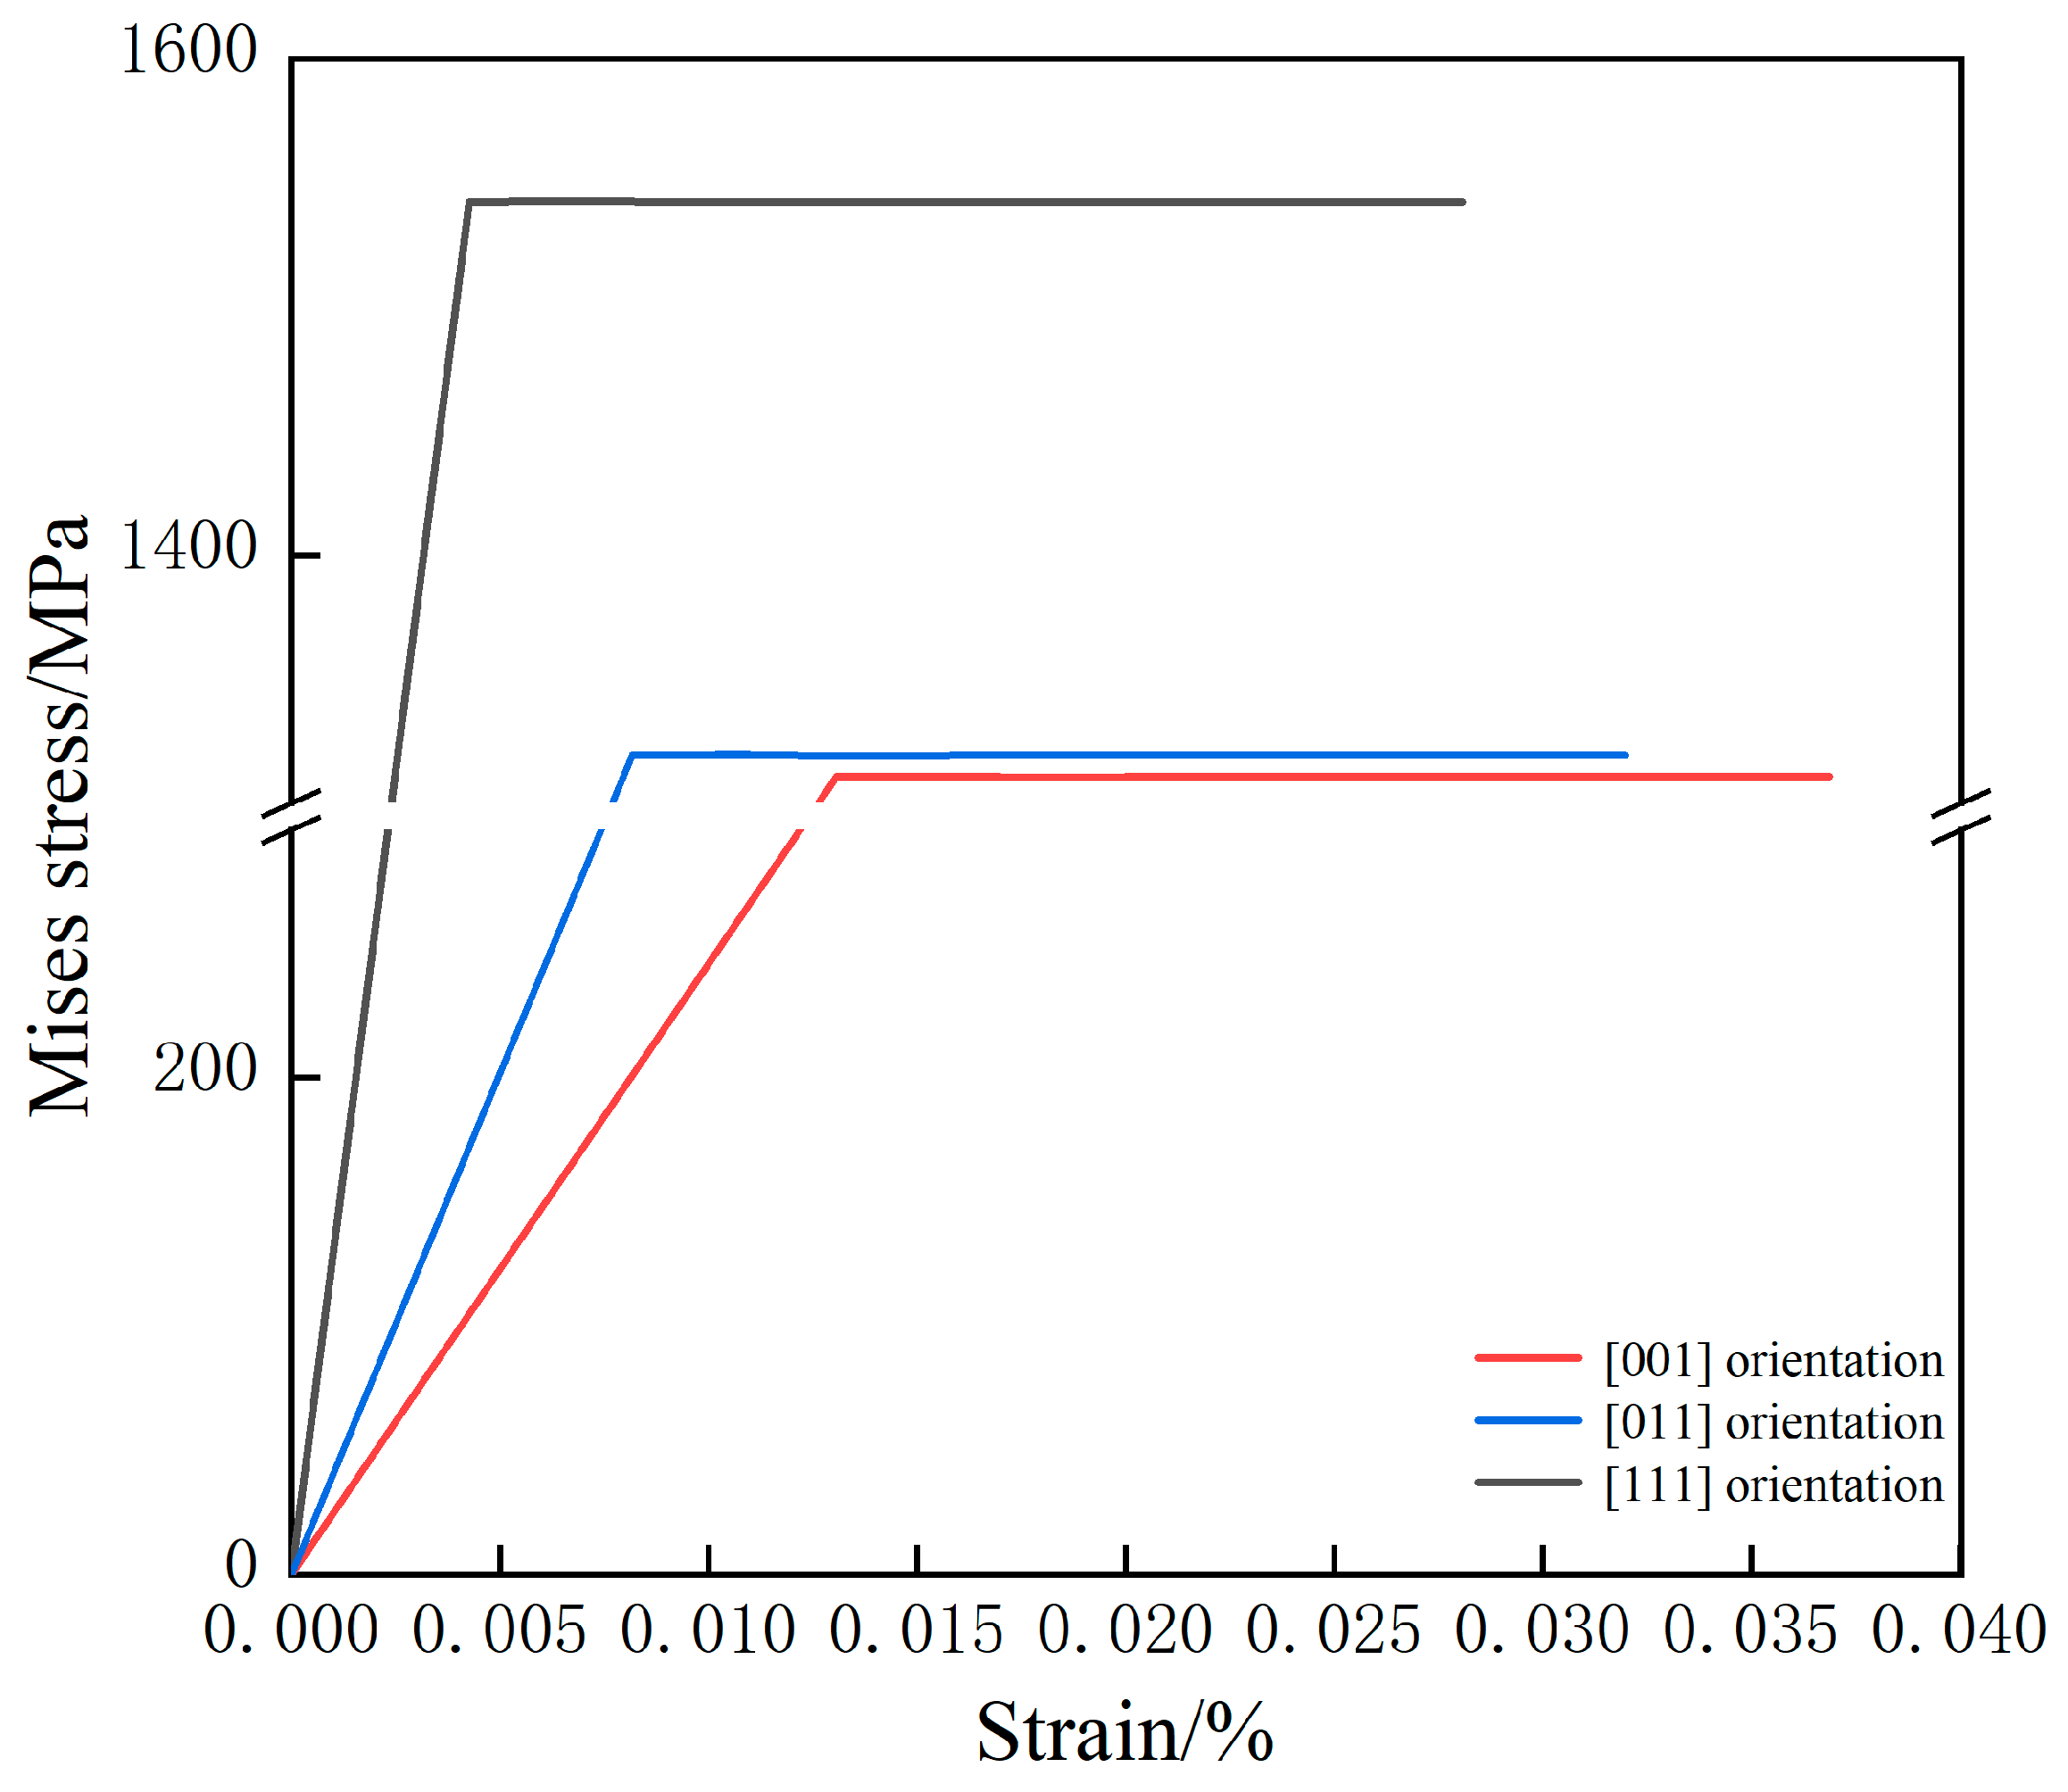
4.3.2. Yield Stress of Different Orientations

As shown in Figure 9, the yield stress of the [001] orientation is 1310.83 MPa, and that of the [011] orientation is 1319.57 MPa. The yield stress of the [001] orientation is close to that of the [011] orientation, while that of the [111] orientation is significantly higher than that of the [001] orientation and [011] orientation, about 1542.52 MPa, which is caused by the different number of activated slip systems under the action of centrifugal force. The more active slip systems are in the material, the more easily plastic deformation occurs. When multiple sliding systems are active, the stress required to cause plastic deformation is low, which means that materials with more active sliding systems tend to have lower yield stresses. As can be seen from the above section, the number of slip systems activated by the [001] orientation is the largest, and the number of slip systems activated by the [111] orientation is the smallest, so the yield stress of the [111] orientation is the largest.

5. Summary and Conclusions

In this study, the finite element model of the two material properties of the substrate was compared. When the amplitude was 30 μm and the TGO thickness was 5 µm, the calculated results would be more accurate when the substrate material considered the crystalline plastic material properties. When the TGO thickness is 5 μm, the residual stress is mainly concentrated at the TGO/BC interface; the tensile stress at the trough is about 885.71 MPa; and the compressive stress at the peak is about 258.23 MPa. However, the BC-substrate interface is less stressed, and the two sides of the substrate are affected by tensile stress and compressive stress, which are 2.60 MPa and 1.21 MPa, respectively. The stress on the substrate is small, mostly due to the thermal stress generated by the coating at high temperatures. When the interface amplitude is changed, we find that the influence of the interface amplitude on compressive stress is greater than that on tensile stress.
In this study, a crystal plastic finite element model based on micro dislocation slip was established, and the thermal stress of the thermal barrier coating and centrifugal force loading conditions were added to more accurately simulate the real stress conditions of nickel-based single-crystal superalloy under actual working conditions. The activation of three initial orientation slip systems is calculated by finite element simulation. In [001], 12 groups of oriented slip systems were activated, and the cumulative shear strain was mainly concentrated in four groups: 111 1 ¯ 10 , 1 ¯ 11 110 , 1 1 ¯ 1 110 , 11 1 ¯ 1 ¯ 10 ; the [011] orientation has 8 groups of slip systems activated, and shear strain was mainly concentrated in 1 1 ¯ 1 110 , 1 1 ¯ 1 10 1 ¯ , 11 1 ¯ 101 , 11 1 ¯ 1 ¯ 10 ; the [111] orientation has 4 groups of slip systems activated, and shear strain was mainly concentrated in 1 ¯ 11 110 , 1 ¯ 11 0 1 ¯ 1 ,   11 1 ¯ 011 , 11 1 ¯ 1 ¯ 10 . In the process of calculating the yield stress of the substrate, it is found that the yield stress of [001] and [011] orientations is less than that of the [111] orientation. This is due to the fact that the number of directional activated slip systems [111] orientation is minimal and only small plastic deformation is generated, so the substrate exhibits a high yield stress of about 1542.52 MPa.

Author Contributions

Conceived and designed the finite element simulation: S.L. and W.W.; performed the finite element simulation: S.L., T.Y., Y.L., C.L., X.Y. and X.Z.; analyzed the data and wrote the paper: S.L. All authors have read and agreed to the published version of the manuscript.

Funding

This research is sponsored by the National Natural Science Foundation of China (52175136, 52130511), the Science Center for Gas Turbine Project (P2021-A-IV-002), the Shanghai Joint Innovation Program in the Field of Commercial Aviation Engines, the National High Technology Research and Development Program of China (2021YFB3702202), the Shanghai Gaofeng Project for University Academic Program Development, and the Key Research and Development Projects in Anhui Province (2022a05020004).

Institutional Review Board Statement

Not applicable.

Informed Consent Statement

Not applicable.

Data Availability Statement

Data are contained within the article.

Conflicts of Interest

The authors declare no conflicts of interest.

References

  1. Nowotnik, A.; Kubiak, K.; Sieniawski, J.; Rokicki, P.; Pędrak, P.; Mrówka-Nowotnik, G. Development of Nickel Based Superalloys for Advanced Turbine Engines. Mater. Sci. Forum 2014, 783–786, 2491–2496. [Google Scholar] [CrossRef]
  2. Białas, M. Finite element analysis of stress distribution in thermal barrier coatings. Surf. Coat. Technol. 2008, 202, 6002–6010. [Google Scholar] [CrossRef]
  3. Khan, Z.; Fida, S.; Nisar, F.; Alam, N. Investigation of Intergranular Corrosion in 2nd stage gas turbine blades of an aircraft engine. Eng. Fail. Anal. 2016, 68, 197–209. [Google Scholar] [CrossRef]
  4. Yang, T.; Wang, W.Z.; Tang, Z.X.; Liu, Y.G.; Li, K.B.; Liu, W.; Zhang, W.K.; Ye, D.D. CMAS infiltration behavior of atmospheric plasma-sprayed thermal barrier coating with tailored pore structures. Ceram. Int. 2023; in press. [Google Scholar] [CrossRef]
  5. Najafizadeh, N.; Ghasempour-Mouziraji, M.; Hosseinzadeh, M.; Shirkharkolaei, E.M.; Bozorg, M.; Cavaliere, P. Thermal barrier ceramic coatings. In Advanced Ceramic Coatings; Gupta, R.K., Motallebzadeh, A., Kakooei, S., Nguyen, T.A., Behera, A., Eds.; Elsevier: Amsterdam, The Netherlands, 2023; pp. 335–356. ISBN 9780323996594. [Google Scholar]
  6. Vaßen, R.; Jarligo, M.O.; Steinke, T.; Mack, D.E.; Stöver, D. Overview on advanced thermal barrier coatings. Surf. Coat. Technol. 2010, 205, 938–942. [Google Scholar] [CrossRef]
  7. Padture, N.P. Thermal Barrier Coatings for Gas-Turbine Engine Applications. Science 2002, 296, 280–284. [Google Scholar] [CrossRef] [PubMed]
  8. Zhang, X.C.; Xu, B.S.; Wang, H.D.; Wu, Y.X. Effects of oxide thickness, Al2O3 interlayer and interface asperity on residual stresses in thermal barrier coatings. Mater. Des. 2006, 27, 989–996. [Google Scholar] [CrossRef]
  9. He, M.Y.; Hutchinson, J.W.; Evans, A.G. Simulation of stresses and delamination in a plasma-sprayed thermal barrier system upon thermal cycling. Mater. Sci. Eng. A 2003, 345, 172–178. [Google Scholar] [CrossRef]
  10. Wei, Z.Y.; Cai, H.N. Stress states and crack behavior in plasma sprayed TBCs based on a novel lamellar structure model with real interface morphology. Ceram. Int. 2019, 45, 16948–16962. [Google Scholar] [CrossRef]
  11. Eriksson, R.; Sjöström, S.; Brodin, H.; Johansson, S.; Östergren, L.; Li, X.-H. TBC bond coat–top coat interface roughness: Influence on fatigue life and modelling aspects. Surf. Coat. Technol. 2013, 236, 230–238. [Google Scholar] [CrossRef]
  12. Zhang, P.; Zhang, L.; Baxevanakis, K.P.; Lu, S.; Zhao, L.G.; Bullough, C. Discrete crystal plasticity modelling of slip-controlled cyclic deformation and short crack growth under low cycle fatigue. Int. J. Fatigue 2021, 145, 106095. [Google Scholar] [CrossRef]
  13. Zhang, P.; Zhang, L.; Baxevanakis, K.P.; Zhao, L.G.; Bullough, C. Modelling short crack propagation in a single crystal nickel-based superalloy using crystal plasticity and XFEM. Int. J. Fatigue 2020, 136, 105594. [Google Scholar] [CrossRef]
  14. Zhang, L.; Zhao, L.; Jiang, R.; Bullough, C. Crystal plasticity finite-element modelling of cyclic deformation and crack initiation in a nickel-based single-crystal superalloy under low-cycle fatigue. Fatigue Fract. Eng. Mater. Struct. 2020, 43, 1769–1783. [Google Scholar] [CrossRef]
  15. Sun, S.; Li, L.; Yue, Z.; Yang, W.; Zhao, Z.; Cao, R.; Li, S. Experimental and numerical investigation on fretting fatigue behavior of Nickel-based single crystal superalloy at high temperature. Mech. Mater. 2020, 150, 103595. [Google Scholar] [CrossRef]
  16. Taylor, G.I. The mechanism of plastic deformation of crystals. Part I.—Theoretical. Proc. R. Soc. Lond. Ser. A Contain. Pap. A Math. Phys. Character 1934, 145, 362–387. [Google Scholar] [CrossRef]
  17. Hill, R. Generalized constitutive relations for incremental deformation of metal crystals by multislip. J. Mech. Phys. Solids 1966, 14, 95–102. [Google Scholar] [CrossRef]
  18. Hill, R.; Rice, J. Constitutive analysis of elastic-plastic crystals at arbitrary strain. J. Mech. Phys. Solids 1972, 20, 401–413. [Google Scholar] [CrossRef]
  19. Asaro, R.J.; Rice, J. Strain localization in ductile single crystals. J. Mech. Phys. Solids 1977, 25, 309–338. [Google Scholar] [CrossRef]
  20. Peirce, D.; Asaro, R.; Needleman, A. An analysis of nonuniform and localized deformation in ductile single crystals. Acta Metall. 1982, 30, 1087–1119. [Google Scholar] [CrossRef]
  21. Huang, Y. A User-Material Subroutine Incroporating Single Crystal Plasticity in the ABAQUS Finite Element Program; Harvard University: Cambridge, UK, 1991. [Google Scholar]
  22. Pei, H.Q.; Yao, X.H.; Zhang, Y.M.; Yang, Y.Q.; Li, Z.; Wen, Z.X. The plastic strengthening effect after long-term endurance and fatigue verification of aero-engine turbine blade single crystal superalloy. Mech. Time-Depend. Mater. 2022, 26, 815–827. [Google Scholar] [CrossRef]
  23. Wang, J.; Liang, J.; Zhang, D.; Peng, Y.; Wen, Z. The effect of small orientation deviation from [001] to [011] on high-temperature creep properties of nickel-based single crystal. Int. J. Plast. 2023, 166, 103648. [Google Scholar] [CrossRef]
  24. Long, X.; Chong, K.; Su, Y.; Chang, C.; Zhao, L. Meso-scale low-cycle fatigue damage of polycrystalline nickel-based alloy by crystal plasticity finite element method. Int. J. Fatigue 2023, 175, 107778. [Google Scholar] [CrossRef]
  25. Gu, S.N.; Gao, H.S.; Wen, Z.X.; Li, Z.W.; Zhang, C.Z.; Yue, Z.F. Creep properties and life model of anisotropic Ni-based single crystal superalloys over a wide temperature range. Int. J. Mech. Sci. 2024, 261, 108674. [Google Scholar] [CrossRef]
  26. Hutchinson, J.W. Bounds and self-consistent estimates for creep of polycrystalline materials. Proc. R. Soc. Lond. A Math. Phys. Sci. 1976, 348, 101–127. [Google Scholar]
  27. Li, Z.W.; Gao, H.S.; Wen, Z.X.; Yang, Y.Q.; Zhang, Y.M.; Ai, X.; Yue, Z.F. Microcrack initiation behavior around film cooling holes in a Ni-based single crystal: In situ observation and crystal plastic analysis. Mater. Sci. Eng. A 2020, 771, 138609. [Google Scholar] [CrossRef]
  28. Zhang, D.X.; He, J.Y.; Liang, J.W.; He, Z. Surface slip deformation characteristics of nickel-base single crystal thin plates with film cooling holes. IEEE Access 2020, 8, 75145–75153. [Google Scholar] [CrossRef]
  29. Han, X.N.; Li, K.D.; Deng, Y.; Zhang, M.Q.; Li, J.S. Research on the effect of micro-voids on the deformation behavior and crack initiation lifetime of titanium alloy under cyclic loading by crystal plasticity finite element method. J. Mater. Res. Technol. 2022, 22, 3218–3229. [Google Scholar] [CrossRef]
  30. Peirce, D.; Asaro, R.J.; Needleman, A. Material rate dependence and localized deformation in crystalline solids. Acta Metall. 1983, 31, 1951–1976. [Google Scholar] [CrossRef]
  31. Karanam, M.K.; Chinthapenta, V.R. Void growth and morphology evolution during ductile failure in an FCC single crystal. Contin. Mech. Thermodyn. 2021, 33, 497–513. [Google Scholar] [CrossRef]
  32. Liu, Y.G.; Wang, W.Z.; Wang, Y.H.; Fang, H.J.; Yang, T.; Li, K.B.; Zhang, C.C. Effect of CMAS attack behaviour on stress distribution in double-ceramic-layer thermal barrier coatings. Ceram. Int. 2022, 49, 13271–13288. [Google Scholar] [CrossRef]
  33. Yu, Q.M.; Zhou, H.L.; Wang, L.B. Influences of interface morphology and thermally grown oxide thickness on residual stress distribution in thermal barrier coating system. Ceram. Int. 2016, 42, 8338–8350. [Google Scholar] [CrossRef]
  34. Yuan, K.; Yu, Y.; Wen, J.-F. A study on the thermal cyclic behavior of thermal barrier coatings with different MCrAlY roughness. Vacuum 2017, 137, 72–80. [Google Scholar] [CrossRef]
  35. Zhou, C.; Wang, N.; Xu, H. Comparison of thermal cycling behavior of plasma-sprayed nanostructured and traditional thermal barrier coatings. Mater. Sci. Eng. A 2007, 452–453, 569–574. [Google Scholar] [CrossRef]
  36. Standards Press of China. High Temperature Materials Branch of Chinese Society of Metals. In China Superalloys Handbook; Standards Press of China: Beijing, China, 2012; Volume 2, pp. 549–564. ISBN 978-7-5066-6237-6. [Google Scholar]
  37. Yu, Q.M.; He, Q. Effect of material properties on residual stress distribution in thermal barrier coatings. Ceram. Int. 2018, 44, 3371–3380. [Google Scholar] [CrossRef]
  38. Burov, A.; Fedorova, E. Modeling of interface failure in a thermal barrier coating system on Ni-based superalloys. Eng. Fail. Anal. 2021, 123, 105320. [Google Scholar] [CrossRef]
  39. Maniatty, A.; Dawson, P.; Lee, Y.S. A time integration algorithm for elasto-viscoplastic cubic crystals applied to modelling polycrystalline deformation. Int. J. Numer. Methods Eng. 1992, 35, 1565–1588. [Google Scholar] [CrossRef]
  40. Sauzay, M. Cubic elasticity and stress distribution at the free surface of polycrystals. Acta Mater. 2007, 55, 1193–1202. [Google Scholar] [CrossRef]
  41. Sun, S.; Li, L.; Yue, Z.; Yang, W.; He, K.; Li, S. Fretting fatigue failure behavior of Nickel-based single crystal superalloy dovetail specimen in contact with powder metallurgy pads at high temperature. Tribol. Int. 2020, 142, 105986. [Google Scholar] [CrossRef]
  42. Du, J.; Yu, G.; Jia, Y.; Liu, C.; Sui, Z.; Gao, X.; Wang, F.; Song, Y. Numerical study of residual stresses in environmental barrier coatings with random rough geometry interfaces. Ceram. Int. 2023, 49, 5748–5759. [Google Scholar] [CrossRef]
  43. Zhang, X.; Huang, H.Z.; Zhang, X.; Zhang, K. A multiaxial probabilistic fatigue life prediction method for nickel-based single crystal turbine blade considering mean stress correction. Qual. Reliab. Eng. Int. 2023, 39, 1735–1755. [Google Scholar] [CrossRef]
Figure 1. Gradient decomposition of crystal plastic deformation.
Coatings 14 00022 g001
Figure 2. TBCs finite element model.
Coatings 14 00022 g002
Figure 3. Finite element model: (a) Geometric model and mesh; (b) Loads and boundary conditions.
Coatings 14 00022 g003
Figure 4. Stress nephogram of the plane thermodynamic coupling result: (a) The distribution of normal residual stress S22; (b) The S22 stress of substrate.
Coatings 14 00022 g004
Figure 5. Influence of different TGO thickness and interface amplitude on peak residual stress at BC-substrate interface.
Coatings 14 00022 g005
Figure 6. Influence of substrate plasticity and TGO thickness on BC-substrate interface S22 under different interface amplitudes (a) λ = 10 μm; (b) λ = 30 μm; (c) λ = 50 μm.
Coatings 14 00022 g006
Figure 7. Total cumulative shear strain of all sliding systems at each orientation, A, B, and C correspond to the positions of the maximum values in (a), (b), and (c), respectively. (a) [001] orientation; (b) [011] orientation; (c) [111] orientation.
Coatings 14 00022 g007
Figure 8. Evolution of cumulative shear strain of each octahedral slip system at positions A, B, and C in Figure 7: (a) position A, (b) position B, (c) position C.
Coatings 14 00022 g008
Figure 9. Stress–strain diagram of different orientations.
Coatings 14 00022 g009
Table 1. The material property parameters of each layer in the finite element model [36,37].
MaterialsTemperature (°C)E (GPa)α (10−5 °C−1)ρ (103 kg/m3)k (W/m °C)c (J/kg °C)υ
DD625132-8.86.70-0.30
70010713.58.820.205660.32
11006815.88.828.957040.34
NiCrAlY2020013.68.15.804000.30
20019014.28.17.504000.30
40017514.68.19.504000.31
60016015.28.112.04000.31
80014516.18.114.54000.32
100012017.28.116.24000.33
110011017.68.117.04000.33
YSZ20489.05.61.204500.10
200479.25.61.194500.10
400449.65.61.184500.10
6004010.15.61.154500.11
8003410.85.61.164500.11
10002611.75.61.144500.12
11002212.25.61.124500.12
Al2O3204008.03.510.0010000.23
2003908.23.57.7910000.23
4003808.43.56.0310000.24
6003708.73.55.0710000.24
8003559.03.54.4110000.25
10003259.33.54.4110000.25
11003209.63.54.0010000.25
Table 2. Creep parameters of each layer.
B   ( s 1 M P a n ) nt (°C)
TC [37]1.80 × 10−71.001000
TGO [37]7.30 × 10−101.001000
BC [37]6.54 × 10−194.75≤600
2.20 × 10−122.99700
1.84 × 10−71.55800
2.15 × 10−82.45≥850
DD6 [36]3.95 × 10−185.53760
4.77 × 10−227.23850
1.31 × 10−195.53950
Table 3. Elastic modulus of DD6 with different orientations corresponding to different temperatures [36].
t/°C2565070076085098010701100
E/GPa[001]131.5107.5107105.59880.569.567.5
[011]231.5184.5187.5137.5145130121
[111]327212184.5205217.5189176.5
Table 4. Cumulative shear strain values of 12 groups of sliding systems.
Cumulative Shear Strain[001][011][111]
SDV1092.025 × 10−2300
SDV1104.440 × 10−131.150 × 10−250
SDV1111.459 × 10−21.157 × 10−250
SDV1124.558 × 10−131.157 × 10−250
SDV1131.460 × 10−21.150 × 10−251.464 × 10⁻²
SDV1141.968 × 10−2301.464 × 10−2
SDV1151.968 × 10−2300
SDV1161.460 × 10−21.465 × 10⁻²⁰
SDV1174.558 × 10−131.465 × 10⁻²⁰
SDV1182.205 × 10−2301.475 × 10−2
SDV1194.440 × 10−131.462 × 10⁻²⁰
SDV1201.459 × 10−21.462 × 10−21.475 × 10−2
Disclaimer/Publisher’s Note: The statements, opinions and data contained in all publications are solely those of the individual author(s) and contributor(s) and not of MDPI and/or the editor(s). MDPI and/or the editor(s) disclaim responsibility for any injury to people or property resulting from any ideas, methods, instructions or products referred to in the content.

