Article

Effect of ZrO2 Particles on the Microstructure and Ultrasonic Cavitation Properties of CoCrFeMnNi High-Entropy Alloy Composite Coatings

1
School of Materials Science and Engineering, Henan University of Science and Technology, Luoyang 471023, China
2
Longmen Laboratory, Luoyang 471000, China
*
Author to whom correspondence should be addressed.
These authors contributed equally to this work.
Coatings 2024, 14(10), 1235; https://doi.org/10.3390/coatings14101235
Submission received: 5 September 2024 / Revised: 21 September 2024 / Accepted: 23 September 2024 / Published: 25 September 2024

Abstract

:
CoCrFeMnNi-XZrO2 (X is a mass percentage, X = 1, 3, 5, and 10) high-entropy alloy composite coatings were successfully prepared on 0Cr13Ni5Mo martensitic stainless steel substrates using laser cladding technology. The phase composition, microstructure, mechanical properties, and cavitation erosion behavior of the composite coatings under different contents of ZrO2 were studied. The mechanism of ZrO2 particle-reinforced cavitation corrosion resistance was studied using ABAQUS2023 finite element software. The results show that the phase structure of the composite coating organization is composed of FCC phase reinforced by ZrO2 phase. The addition of ZrO2 causes lattice distortion. The coatings have typical branch crystals and an equiaxed crystal microstructure. With the increase in ZrO2 content, the microhardness of the composite coatings gradually increases. When X = 10%, the coating’s microhardness reached 348 HV, which was 95.53% higher than the high-entropy alloys without ZrO2 added. Adding ZrO2 can prolong the incubation period of high-entropy alloys; the high-entropy alloy composite coating with 5 wt.% ZrO2 exhibited the best cavitation resistance, with a cumulative volume loss rate of only 15.74% of the substrate after 10 h of ultrasonic cavitation erosion. The simulation results indicate that ZrO2 can withstand higher stress and deformation in cavitation erosion, reduce the degree of substrate damage, and generate higher compressive stress on the coating surface to cope with cavitation erosion.

1. Introduction

Low-carbon martensitic stainless steel has been widely used in water turbine blades, ship propellers, and other hydraulic machinery components due to its high strength, toughness, and good welding performance. However, due to their insufficient resistance to cavitation, the service life of these devices may be greatly shortened due to wear caused by cavitation [1]. Cavitation refers to the phenomenon in which bubbles are generated in a liquid due to a decrease in local pressure below the vapor pressure of the liquid. When the pressure is restored, these bubbles will quickly collapse, producing strong shock waves [2,3]. A shock wave generated during this process will cause a huge hammering force on the surface of the material, with an impact load usually between 0.2 and 2 GPa. When shock waves propagate and diffuse along the target material’s surface, ductile metals undergo plastic flow, resulting in plastic deformation [4]. During repeated hammering, fatigue and cracks may appear in the affected area [5]. The direct manifestation of shock wave damage to material surfaces is called cavitation erosion. In the field of hydraulic machinery, cavitation erosion causes huge economic losses every year. To extend the equipment’s service life, the surface must be modified.
High-entropy alloys (HEAs) are a type of alloy composed of five or more elements in almost equal molar ratios. Unlike traditional alloys, which are composed of one main element and a small amount of other elements, the unique composition of high-entropy alloys endows them with a variety of excellent properties. The high entropy effect, lattice distortion effect, hysteresis diffusion effect, and “cocktail” impact collectively endow high-entropy alloys with unique microstructures and properties, making them a new type of material with enormous potential [6]. Among them, the pure FCC CoCrFeMnNi high-entropy alloy composed of transition group elements, also known as Cantor alloy [7,8], is considered a suitable surface modification material due to its excellent plasticity, tough-ness, work hardening ability, and corrosion resistance. In recent years, it has been widely studied in the field of cavitation [9].
Cavitation is a surface phenomenon, so the preparation of cavitation-resistant coatings is considered an excellent solution to address cavitation problems [10]. To combat cavitation, researchers have conducted extensive preliminary exploration of conventional surface modification techniques. The advantages of laser cladding include high energy focusing, a small heat-affected zone, and the ability to prepare metal parts with complex microstructures and geometric shapes. In the process of laser cladding, due to its fast solidification speed, it can refine the grains and achieve a uniform distribution of elements. Therefore, laser cladding is a suitable method for preparing CoCrFeMnNi high-entropy alloys [11].
The low hardness of CoCrFeMnNi is the main difficulty limiting its application. Selective addition of second-phase particles (such as carbides, oxides, etc.) in high-entropy alloys can improve their mechanical properties. For example, Wu. H et al. [12] added 10 wt.% TiC ceramic to iron nickel cobalt chromium alloy. The addition of TiC causes lattice distortion and grain refinement in the composite coating, resulting in an increase in microhardness from 220 HV to 420 HV. After 8 h of cavitation testing, the composite coating with TiC added only 1/6 of the FeNiCoCr high-entropy alloy’s cumulative volume loss. X. R et al. [13] added WC and nano CeO2 to FeCoNiCrMo0.2, which delayed grain growth and refined the microstructure of the coating. Therefore, the hardness of the HEA coating was increased from 470 HV to 560 HV, significantly improving the surface strength of the coating and prolonging the service life of the workpiece. Li et al. [14] added NbC to the AlCoCrFeNi high-entropy alloy. After adding 20 wt.% NbC particles, the proportion of FCC phase decreased from 15.71% to 1.19%, and the proportion of grains below 0.5 μm increased from 60.04% to 73.01%. Because of the fine-grain structure and solid solution strengthening, the alloy’s hardness increased to 525 HV. Adding carbide particles to high-entropy alloys can improve wear resistance and hardness, but as carbides are usually brittle phases, the excessive addition of carbides may lead to a decrease in the toughness of high-entropy alloys, increase material brittleness, and hinder the enhancement of material’s resistance to cavitation. Compared with steel alloy particles, ZrO2 has higher toughness and fracture toughness, which makes zirconia perform better under impact loads and dynamic stresses. Zong. l et al. [15] added nanosized ZrO2 particles to WMoNbTaV, and the results showed that the nanosized ZrO2 particles could form a semi-coherent interface structure with the matrix. Compared with the cast state, ZrO2 increased the hardness of high-entropy alloys by 90.1%. The excellent mechanical properties are mainly attributed to the dispersion of nano-sized ZrO2 particles and the ultrafine-grain structure. Lepule. M et al. [16] studied the corrosion and wear behavior of composite coatings after adding ZrO2 to nickel–titanium alloys. The results showed that the conformal coating’s hardness increased from 270.5 HV to 471.5 HV after adding ZrO2, and the dry wear rate increased with the increase in ZrO2 content. Stambolova I et al. [17] deposited ZrO2 coating on the surface of stainless steel by the sol–gel method. ZrO2 is monoclinic crystal structure, has high chemical stability and mechanical strength, and can effectively resist the corrosion of corrosive media. Therefore, the coating exhibits good corrosion resistance. Vattikuti S V P et al. [18] investigated the performance of C3N4/ZrO2 heterojunction nanostructures, and the results showed that the introduction of ZrO2 can form heterostructures with C3N4, improving catalytic efficiency. ZrO2 also improves the stability of the material, allowing it to maintain good catalytic performance even after multiple cycles of use. Li J et al. [19] prepared ZrO2/MgO composite coating on the surface of magnesium alloy by the sol–gel method, and blocked the penetration of corrosive media by adding ZrO2 to form a dense ZrO2/MgO layer. The ZrO2 deposited around the pores caused a change in the pore structure from interconnected to isolated, which resulted in a reduction of the overall porosity to 8.06%. Isolated pores effectively prevent the penetration of corrosive media, resulting in the corrosion current density (icorr) being nearly 46 times lower than the coating with pH = 3. The study by Zhu. H et al. [20] showed that the surface of ZrO2-Al2O3 composite coating with m–ZrO2 added has better resistance to cavitation and erosion. The outer layer of the coating was dense, and the hardness and corrosion resistance were improved. The corrosion rate is only 1/56 of that of the matrix material, TiB2/2024Al.
At present, most studies on the enhancement of cavitation in high-entropy alloys by second-phase particles are explained from the perspective of various strengthening mechanisms (fine-grain strengthening, solid solution strengthening, and second-phase strengthening). There is relatively little research on using the finite element method to explain the role of second-phase particles in cavitation failure from the perspectives of stress and deformation.
This study used laser cladding technology to prepare a CoCrFeMnNi-xZrO2 composite coating on 0Cr13Ni5Mo martensitic stainless steel and investigated its phase composition distribution, microstructure, and mechanical properties. This article uses the ASTM G32-10 standard [21] to study the ultrasonic cavitation corrosion of samples and draws and analyzes the cumulative volume loss and the mean depth of the erosion rate of the samples to explain the response and damage mechanism of the samples to cavitation. The failure mode of shock waves generated during the cavitation collapse process was simulated using ABAQUS2023 software, and the stress distribution of zirconia ceramics with different addition ratios was simulated, revealing the failure mechanism of cavitation shock waves at depth.

2. Materials and Methods

2.1. Materials and Specimen Preparation

The substrate is made of commercial 0Cr13Ni5Mo low-carbon martensitic stainless steel plate (HAIYANG, TaiZhou, China), with dimensions of 300 mm × 300 mm × 15 mm. Its nominal chemical composition (weight percentage) is 0.02C, 13.4Cr, 5.03Ni, 0.77Mo, 0.61Mn, 0.46Si, 0.035P, and Fe balance. Before the laser cladding process, the substrate needs to undergo surface treatment, including grinding and sandblasting techniques, to thoroughly remove surface oxides and impurities. Then, the substrate should be cleaned with anhydrous ethanol and thoroughly dried. In this study, a novel alloy powder containing ZrO2 was designed using commercially available spherical cobalt chromium iron nickel powder (purity greater than 99.9%). The particle size of CoCrFeMnNi (Beijing Research Institute of high-tech materials, BeiJing, China) is 45–105 μm, with an average particle size (D50) of 71.029 μm. The source of ZrO2 (Yuan Te Xin Cai, HuZhou, China) is commercial powder (purity greater than 99.9%, particle size of 20 nanometers, monoclinic crystal structure). HEA-xZrO2 composites labelled as S1, S2, S3, S4, and S5 were prepared by adding 0%, 1%, 3%, 5%, and 10% by mass of ZrO2 powder to CoCrFeMnNi alloy powders. Subsequently, the composite powders were ball-milled for 5 h using a planetary ball mill. To prevent oxidation, high-purity argon gas was introduced into the ball milling tank. The ball-to-material ratio was 5:1. To prevent contamination, the grinding balls were ZrO2 balls with diameters of 5 mm and 10 mm, respectively. Scanning electron microscope (SEM) (Crossbeam 350, Zeiss, Oberkochen, Germany) images of the hybrid powders processed by the ball-milling method and the EDS images are shown in Figure 1. The observed results show that the powder samples still maintain a high sphericity after 5 h of ball-milling treatment, and the distribution of their constituent elements also shows a high degree of homogeneity. The CoCrFeMnNi chemical composition (weight percentage) is 20.51Co, 18.24Cr, 19.17Fe, 20.12Mn, 21.03Ni and 0.93ZrO2. Especially, the zirconium element is uniformly distributed on the spherical powder particles, so it can be considered that the powder has been sufficiently mixed during the ball milling process.
A ZKZM-12000 laser (ZKZM, Xi’an, China) with a maximum power of 12 KW was used as the laser cladding equipment for the laser cladding experiments. The schematic diagram of the laser device is shown in Figure 2. The process parameters of laser cladding have a decisive influence on the macroscopic morphology, microstructure, and mechanical properties of the coating, so setting the process parameters is especially critical. In this study, based on the preliminary experimental exploration, the optimal process parameters in Table 1 were finally selected through a series of optimization operations.

2.2. Characterization

To investigate the microstructure of the coatings and characterize their characteristics, HEACs were cut into 20 mm × 20 mm × 20 mm samples along the cross-section using an electric discharge wire-cutting machine. The samples were polished with 180 #–2000 # sandpaper and thoroughly polished with 4000 # polishing paste to ensure that the samples had the same surface roughness.
Using an X-ray diffractometer (XRD, Bruker, Karlsruhe, Germany) with Cu K alpha as the radiation source, the composition phases of powder and block samples were determined at a rate of 4°/min within the voltage of 40 KV, current of 40 mA, and a range of 20°–100°. Cross-sectional samples were selected for metallographic analysis and the metallographic samples were etched with aqua regia (VHCL:VHNO3 = 3:1) for 10–15 s. We used a scanning electron microscope (SEM, Crossbeam 350, Zeiss, Oberkochen, Germany) equipped with an energy dispersive spectrometer (EDS) to analyze the macroscopic morphology, microstructure, and elemental distribution of the sample. The microhardness of the coating was tested using a micro Vickers hardness tester (HV, HV-1000TPTA, Weihai, China) with a loading time of 10 s, a load of 0.2 KN, and an indentation spacing of 0.5 mm.

2.3. Performance Testing

Ensure that the sample before cavitation erosion testing has the same surface roughness. Perform ultrasonic cleaning on the sample and dry it thoroughly for subsequent testing. According to the ASTM G32-10 standard [21], the cavitation erosion behavior of the coating was studied using an ultrasonic surface processing device. Figure 3 is a schematic diagram of an ultrasonic device used for cavitation erosion testing.
The experimental medium was high-purity deionized water. The temperature was maintained at 25 ± 2 °C, with a peak-to-peak displacement amplitude of 50 μm. The sample was placed at a distance of 0.5 mm from the end face of the vibration head, and the vibration head was immersed in the test medium for 10 mm. The mass loss was measured every hour using an electronic balance with an accuracy of 0.01 milligrams, the mass loss was converted to volume loss, and the measurement data was plotted as a cumulative volume loss curve (CVL) and cumulative erosion rate (CER) to study the anti-cavitation performance of the tested sample. We used a JSM-IT100 scanning electron microscope (SEM) to analyze the microstructure of the sample after the cavitation test to analyze the mechanism of cavitation damage.
In the ASTM G32-10 standard [21], the cavitation resistance of coatings can be characterized by the mean depth of erosion rate (MDER), which is as follows:
M D E = Δ W 10 ρ S
M D E R = M D E Δ t
where ∆W is the cumulative mass loss during the cavitation process, measured in milligrams and ρ is the material density, measured in g × cm−3 using Archimedes’ displacement method. The densities of the 0Cr13Ni5Mo and four HEACs cladding layers were 7.79 ± 0.03, 7.50 ± 0.02, 7.47 ± 0.03, 7.42 ± 0.02, 7.45 ± 0.05, and 7.38 ± 0.05, respectively. S is the cavitation area of the sample (the area of the standard cavitation sample used for testing was 198.4 mm2), and ∆t is the cavitation time, measured in hours; the units of MDE and MDER are μm and μm/h, respectively.

2.4. Finite Element Model

Finite element simulation was conducted using ABAQUS2023 software, and the model was generated using Digimat2017 software, which can generate composite grids. Representative volume elements (RVE) were used in the finite element analysis. RVE is used to establish an intrinsic model of materials to study their response under different loading conditions [18]. Choosing the appropriate model size is particularly important in finite element simulation; if the model size is too small, it may not fully capture the mechanism of the second stage particle reinforcement effect; if the model size is too large, it will greatly increase the demand for computing resources, and in the case of limited resources, it will lead to long simulation running times. The schematic illustration of the finite element model is shown in Figure 4. The size of the finite element model was set to 800 nm, and the size of the ZrO2 particles was set to 20 nm.
In the properties module of ABAQUS, the material properties of HEA and ZrO2 were set up, respectively. The densities of HEA and ZrO2 were 7.89 × 10⁻⁹ and 6 × 10⁻⁹ g/mm3, respectively. The Young’s moduli were 83 and 200 GPa with a Poisson’s ratio of 0.25. Since shock wave damage due to the cavitation mode is also a dynamic response of the material at a high strain rate, the Johnson–Cook (JC) model, is a model of the stress–strain relationship under shock, explosion, and high-speed collision. The modified version of the JC model of Park et al. was used here [22]:
σ = 590 + 2075 ε 0.78 1 + 0.39 ln ε ˙ ε ˙ 0 T T r 0.6
where ε is the equivalent plastic strain. ε ˙ is the equivalent plastic strain rate, and ε ˙ 0 is a reference strain rate. T is the current temperature. Tr is the ambient temperature.
The simulated loading conditions are based on bubble collapse, which generates shock waves on the surface of the material. This type of impact is a purely mechanical process, similar to impact loading or high-amplitude, low-perimeter fatigue, which leads to plastic deformation of the material surface, the propagation of microcracks, material removal, and ultimately failure. The numerical simulation results of Luo et al. [23] show that when the bubble collapses at a certain distance from the wall, the maximum pressure is about 700 MPa and the action time is only a few microseconds. The size of the shock wave generated when a bubble collapses on the surface of a material is related to multiple factors such as bubble size, distance between the bubble and the wall, temperature, pressure, etc. To simplify the model and reduce computational resources, this study selected 500 MPa as the peak size of the shock wave after referring to references [24,25], and applied it to the material surface for 10 microseconds to simulate the rapid action of the shock wave on the material surface. Because the shock wave range (in micrometers) is much larger than the finite element model, the upper surface of the model was selected as the working area for the shock wave in the ABAQUS2023 software.

3. Results

3.1. Phase Composition and Microstructure

Figure 5 shows the XRD spectra of the CoCrFeMnNi-XZrO2 (X = 0, 1, 3, 5, and 10) high-entropy alloy coatings. Without the addition of ZrO2 particles, the phase composition of the CoCrFeMnNi fused cladding is a single FCC phase (PDF#47-1405 standard [21]). After adding ZrO2 and increasing ZrO2 content, the phase composition of the cladding is FCC plus a small amount of ZrO2. It can be seen from the observation of (111)FCC that 2θ is about 44.579° in the CoCrFeMnNi HEACs, but about 44.383°, 44.179°, 44.039°, and 43.627° in the S2, S3, S4, and S5 HEACs. The position of the diffraction peak of the FCC phase is shifted to the left and the amount of the shift to the left increases with the increase of the ZrO2 content. This is due to the dissolution of ZrO2 in the matrix causing lattice distortion and increasing the lattice constant of the solid solution. As ZrO2 increases, the lattice distortion becomes more severe. The diffraction peaks of ZrO2 were not detected in the XRD patterns when the amount of ZrO2 added was low. ZrO2 is considered to be a relatively stable oxide, and no phase transformation occurred during the fusion curing process. This phenomenon is similar to the results in the literature [15].
The macroscopic morphology of the five alloy coatings after laser melting is shown in Figure 6a; S1 has the best macroscopic morphology, and as the zirconium oxide addition ratio increases, the flatness of the coating surface shows a decreasing trend. It can be observed that S5 coating shows obvious defects, such as cracks. The large physical difference between CoCrFeMnNi and ZrO2 may explain this. At a given laser energy density, when the high-entropy alloy powder melts to form molten droplets, some of the zirconia undergoes particle agglomeration, which affects the flow and stability of the molten pool. Differences in thermal conductivity lead to a non-uniform temperature distribution, resulting in overheating or insufficient melting in localized areas, increasing the surface roughness of the cladding layer, and further affecting the surface topography. When the ZrO2 content further increases to 10 wt.%, obvious cracks can be observed on the surface of the coatings.
The elemental composition of each sample was determined using an energy dispersive X-ray spectrometer, as shown in Table 2. The results show that the measured elemental content is close to the theoretical value and the content of each element is close to the iso-atomic ratio, but the content of iron is higher. This phenomenon can be explained by the diffusion of iron into the coating under the action of the high-energy laser due to the high dilution rate of the substrate. The actual content of zirconium oxide is slightly lower than the nominal content, which is because some of the zirconium oxide nanoparticles went into the air with the protective gas during the cladding process, and the amount of zirconium oxide entering the molten pool was reduced accordingly. As a result, the elemental composition of the final coating surface inevitably deviated somewhat from expectations, but the overall ZrO2 content was as expected.
A typical BSE image of the S2 coating is shown in Figure 7, where Figure 7a shows that the coatings produced a good bond with the substrate. As shown in Figure 7b, a large number of tiny pores were observed in the coatings at higher magnification. This is due to the fact that the boiling points of the elements Co, Cr, Fe, and Ni in the high-entropy alloy are all greater than 2700 °C, whereas the boiling point of the element Mn is only 1962 °C. During the laser melting process, the element Mn is more likely to vaporize and form bubbles and voids, and the laser melting is a typical rapid solidification process so that the bubbles generated cannot escape sufficiently and the coatings solidify to form circular pores. This phenomenon shows a high degree of agreement with the literature [26].
To further investigate the microstructure of the laser-cladding composites, SEM analyses of the corroded HEACs composites were carried out. The SEM images of HEACs in the cross-section direction are shown in Figure 8. The grains inside the HEACs are a mixture of dendrites and isometric crystals. The presence of different grain morphologies in the coatings is a result of thermodynamic and dynamic effects during sample preparation. The changes in grain morphology are related to the changes in temperature gradient (G) and cooling rate (R). During the fusion coating process, the temperature is highest in the center of the melt pool, and the heat continues to diffuse in the direction of the thermal gradient. As the temperature gradient G is large relative to the cooling rate, a large G/R ratio occurs and epitaxial needle-like deformed grains are formed. As heat loss from the substrate increases, the solid–liquid interface increases, and the G/R ratio decreases. As a result, equiaxial subcrystals are formed along the direction of heat flow [27]. Columnar crystals are formed mainly along the direction of the melt coating, and their formation is affected by changes in the thermal temperature gradient [28]. With the addition of ZrO2, the proportion of equiaxial crystals in the coating increases gradually, and the proportion of dendrites decreases accordingly. This is because zirconia particles can act as heterogeneous nucleation centers during solidification in the melt pool. This contributes to the formation of equiaxial crystals. In S5 with 10 wt.% ZrO2 added, significant thermal cracking was observed. The formation of cracks can be attributed to the fact that as the ZrO2 content increases, stress concentration is more likely to occur in local areas during the laser cladding cooling process, which leads to the susceptibility of the coating to cracking [29]. Cracks appeared in both the macroscopic and microstructures of the S5 coatings, a phenomenon that suggests that the content of ZrO2 should be controlled to avoid the appearance of cracks.
Figure 9 shows the SEM images and EDS results of the S2 LC sample. Some bright round particles in the matrix can be observed in Figure 9a. From Figure 9b–e, it can be seen that the individual elements of the high-entropy alloy are uniformly distributed in the matrix without elemental segregation. As shown in Figure 9f, a small amount of Zr element is uniformly distributed in the high-entropy alloy matrix.
To clarify the elemental composition of the round particles, region A in Figure 9a has been enlarged. Figure 10a is a magnified view of the A zone in Figure 9a. The energy spectrum analysis reveals that the A zone is rich in Zr and O elements, as well as a small amount of Cr elements, and that the atomic ratio of Zr and O elements is close to 1:2. Considering that the introduction of Zr elements is due to the incorporation of ZrO2 particles, it can be assumed that the A zone is composed of ZrO2.

3.2. Microhardness

The results of measuring the Vickers microhardness of the five high-entropy alloys and the 0Cr13Ni5Mo substrate from the surface of the fused cladding at intervals of 0.2 mm are shown in Figure 11. The hardness of the coatings increased with increases in the ZrO2 content in the coatings. The average microhardness of the CoCrFeMnNi high-entropy alloy coating without added ZrO2 was 178.17 ± 6 HV, which is close to the performance of high-speed laser melting in the literature [21]. The average microhardness values with added zirconia were 208.29 ± 6 HV, 230.54 ± 5 HV, 257.99 ± 4 HV, and 348.37 ± 7 HV, respectively. These values are comparable to those of the HEA without added ZrO2 and were enhanced by 16.9%, 23.23%, 44.8%, and 95.53%, respectively, compared to the HEA without ZrO2. The increase in microhardness of the alloys after the addition of ZrO2 may be related to the fine-grain strengthening and second-phase strengthening effects of ZrO2. As the second phase, ZrO2 itself has high hardness. In the composite coating, ZrO2 induces lattice distortion, refines the grains, increases the grain boundary area per unit volume, and hinders the dislocation movement, thus improving the hardness of CoCrFeMnNi alloys.

3.3. Cavitation Erosion Behavior

The CVL curves and MDER calculations from the cavitation tests are illustrated in Figure 12. Cr13Ni5Mo martensitic stainless steel showed the worst resistance to cavitation attack, and the ZrO2-added composite coating outperformed the substrate in this respect. Both HEACs and 0Cr13Ni5Mo exhibited different a incubation period (IP), as shown in Figure 12a. The IP of 0Cr13Ni5Mo lasts for about 2 h, and the volume loss is very small during the IP, which is about 0.012 mm3. After the end of the IP, the CVL of the substrate starts to increase rapidly. The five HEACs showed a gentler change in the rate of the rising process compared to the substrate, and a significant increase in the cavitation IP was observed. The IP of S4 with 5% wt.% ZrO2 reached 5 h. After 10 h of CE, the cumulative volume loss of the substrate reached 5.78 mm3, and the cumulative volume losses of the five HEACs were 2.28 mm3, 1.95 mm3, 1.45 mm3, 0.91 mm3, and 1.43 mm3. The cumulative volume loss of S4 was only 15.74% of the substrate. Figure 12b shows the MDER results for the matrix and the five HEACs, with lower values representing higher cavitation resistance. Compared to 0Cr13Ni5Mo martensitic stainless steel, the HEACs all exhibited lower MDER, and the MDER of the composite coating increased with the increase of ZrO2. The MDER of S4 was 0.045 μm/h, which was only 16% of 0.29 μm/h for 0Cr13Ni5Mo martensitic stainless steel, and showed the best cavitation resistance. The MDER of S5 showed an increase compared to S4.
The morphology after cavitation erosion was observed using a scanning electron microscope, and the cavitation morphology of the matrix and the five HEACs are shown in Figure 13. After 1 h of CE, the 0Cr13Ni5Mo martensitic stainless steel matrix showed obvious slip lines, severe plastic deformation, and a large number of microcracks. The CoCrFeMnNi HEACs fusion cladding layer showed relatively small plastic deformation relative to the matrix and micro-area plastic deformations along the inter-dendritic crystals and grain boundaries after 1 h CE. The CE damages of S1–S4 were all deformation-dominated. At this stage, microcracks extend and converge along these plastic deformation regions, while the surface of the fused cladding remains largely preserved, and the surface is in the IP of CE at this stage. After 10 h of CE, the surface loss of the base 0Cr13Ni5Mo was so severe that the original surface of the alloy could hardly be found. Cavitation damage of the substrate is dominated by large areas of material spalling. The surface of the martensitic stainless steel is distributed with small patches of segmented damage and is rougher compared to the high-entropy alloy. Compared to the bulk spalling of the substrate, the high-entropy alloy coating shows laminar tearing after cavitation erosion, which is due to the high-entropy alloy being flatter and having fewer macro-area cavitation pits compared to the 0Cr13Ni5Mo martensitic stainless steel. With the increase in ZrO2 content, the degree of destruction of the coating surface becomes weaker. On the S4 coating, there is no longer any large spalling. It is worth noting the presence of extended spalling centered on cracks in the S5 sample. In connection with the cracks appearing in Figure 13(f1,f2), it can be surmised that it is the process of CE in which the cracks generated during the laser melting cladding process become weak areas. The presence of cracks accelerates the CE rate and reduces the cavitation resistance.
Figure 14 shows the three-dimensional morphology of the sample after 10 h of cavitation erosion. A 3D laser microscope (OLS5100, Olympus, Tokyo, Japan) was used to observe the 3D morphology of the substrate and the coating after 10 h of cavitation, and their roughness was measured. Using Surface Roughness Average (Sa) to evaluate the surface smoothness of HEACs, the surface of the 0Cr13Ni5Mo martensitic stainless steel substrate was the roughest, with a Sa of 13.835 μm. Similar to the morphology observed by the SEM, the substrate showed a large area of flaking and pores, which indicates that the cavitation attack is highly destructive to the material surface. For the five high-entropy alloy coatings, the roughness of the coatings decreases as the ZrO2 content increases, and S5 had a roughness of 2.571 μm, which was the flattest of all the coatings, but cracks were observed on S5.
Several attempts have been made by researchers to relate cavitation resistance to single or combined mechanical properties (e.g., hardness) of metallic materials; however, these relationships are essentially empirical and can only provide predictions to a small extent. Due to the repetitive, dynamic, stochastic, and localized nature of the shock waves generated by cavitation, the cavitation resistance of material should be considered as an independent material property [30]. S5, which is the hardest, is less resistant to cavitation than S4, which has a lower hardness. This can be attributed to the fact that the S5 coating is cracked. The presence of cracks during cavitation erosion reduces the material’s mechanical properties and accelerates the CE rate [31].

3.4. Finite Element Simulation Results

Three-dimensional and two-dimensional finite element simulations were carried out to investigate the mechanism of ZrO2 to improve cavitation resistance. The model was post-processed after undergoing impact loading and the infinite element part of the model was hidden to facilitate the observation of the results.
The 3D cloud diagrams of the model with different percentages of zirconia particles added are shown in Figure 15a after subjecting it to pressure loading. The simulation results show that with the addition of ZrO2, the deformation of the composite system model after pressure loading decreases. This shows a consistent trend with the results of the 3D cloud diagrams. Figure 15b shows the average deformation versus the maximum deformation for the S1–S5 models. It can be seen that the average deformation of the model shows a decreasing trend with the increase of zirconia percentage. The maximum deformation appears to increase at S5, which is due to the interaction between the particles when the proportion of the second-phase particles is too high, increasing the maximum deformation instead.
To better understand the mechanism of ZrO2’s resistance to deformation during loading, a two-dimensional finite element model was developed to simulate the S22 stresses after pressure loading.
Figure 16 shows the stress distribution of S22 after the addition of ZrO2 particles in different proportions. Observation of the stress distribution in the (Y-Y) direction of S22 after impact shows that the introduction of the second-phase particles subjected it to higher compressive stresses, which improved the surface compression state of the material and further enhanced its fatigue resistance.
Mechanical properties such as residual compressive stress, hardness distribution, and surface morphology of metallic materials are closely related to their cavitation resistance [22]. Surface compressive stress can form a compressive stress layer on the surface, which can effectively alleviate the destructive effect of external factors on the material, thus improving the strength of the material. In addition, the increase of surface compressive stress helps to reduce the formation and expansion of cracks during repeated loading and unloading of the material, because the crack expansion process needs to serve the surface compressive stress layer, which effectively improves the fatigue resistance of the material. Notably, the presence of the second-phase particles allows higher compressive stresses to be concentrated on them, and such high compressive stresses are effective in hindering the movement of dislocations, thereby improving the overall properties of the materials.
The phenomenon of interphase preferential wear is usually attributed to the significant difference in elastic modulus between the phases. The difference in elastic modulus provides a plausible explanatory framework for the higher stiffness of the second phase compared to the matrix, and in fact, the incorporation of the second phase is expected to adjust the stress and strain distribution pattern between the phases. Typically, the “soft” phase with lower yield strength enters the plastic state before the “hard” phase and is subjected to higher strain levels. Given that the distribution of stress and strain can directly affect the damage mechanism of each phase, the understanding of the damage behavior of multiphase materials can be deepened by studying in detail the stress and strain distribution of each phase at the microstructural level under specific loading conditions [32].
It should also be noted that the stress concentrated on ZrO2 particles increases substantially with the increase of ZrO2 content. When the stress concentrated on the particles is too high, it is the origin of cracks, so when designing the CoCrFeMnNi-XZrO2 composite coating system, too high a ZrO2 content will, on the contrary, cause the cavitation resistance of the coating to decrease.

4. Conclusions

CoCrFeMnNi-XZrO2 (X: mass fraction, X = 1, 3, 5, and 10) high-entropy alloy composite coatings were prepared by laser melting technology, and the phase composition, microstructure, microhardness, and cavitation erosion resistance were investigated. In addition, to reveal the mechanism of ZrO2 in improving the cavitation erosion resistance of high-entropy alloys, finite element simulations of the composite coatings were carried out. The research conclusions are as follows:
(1)
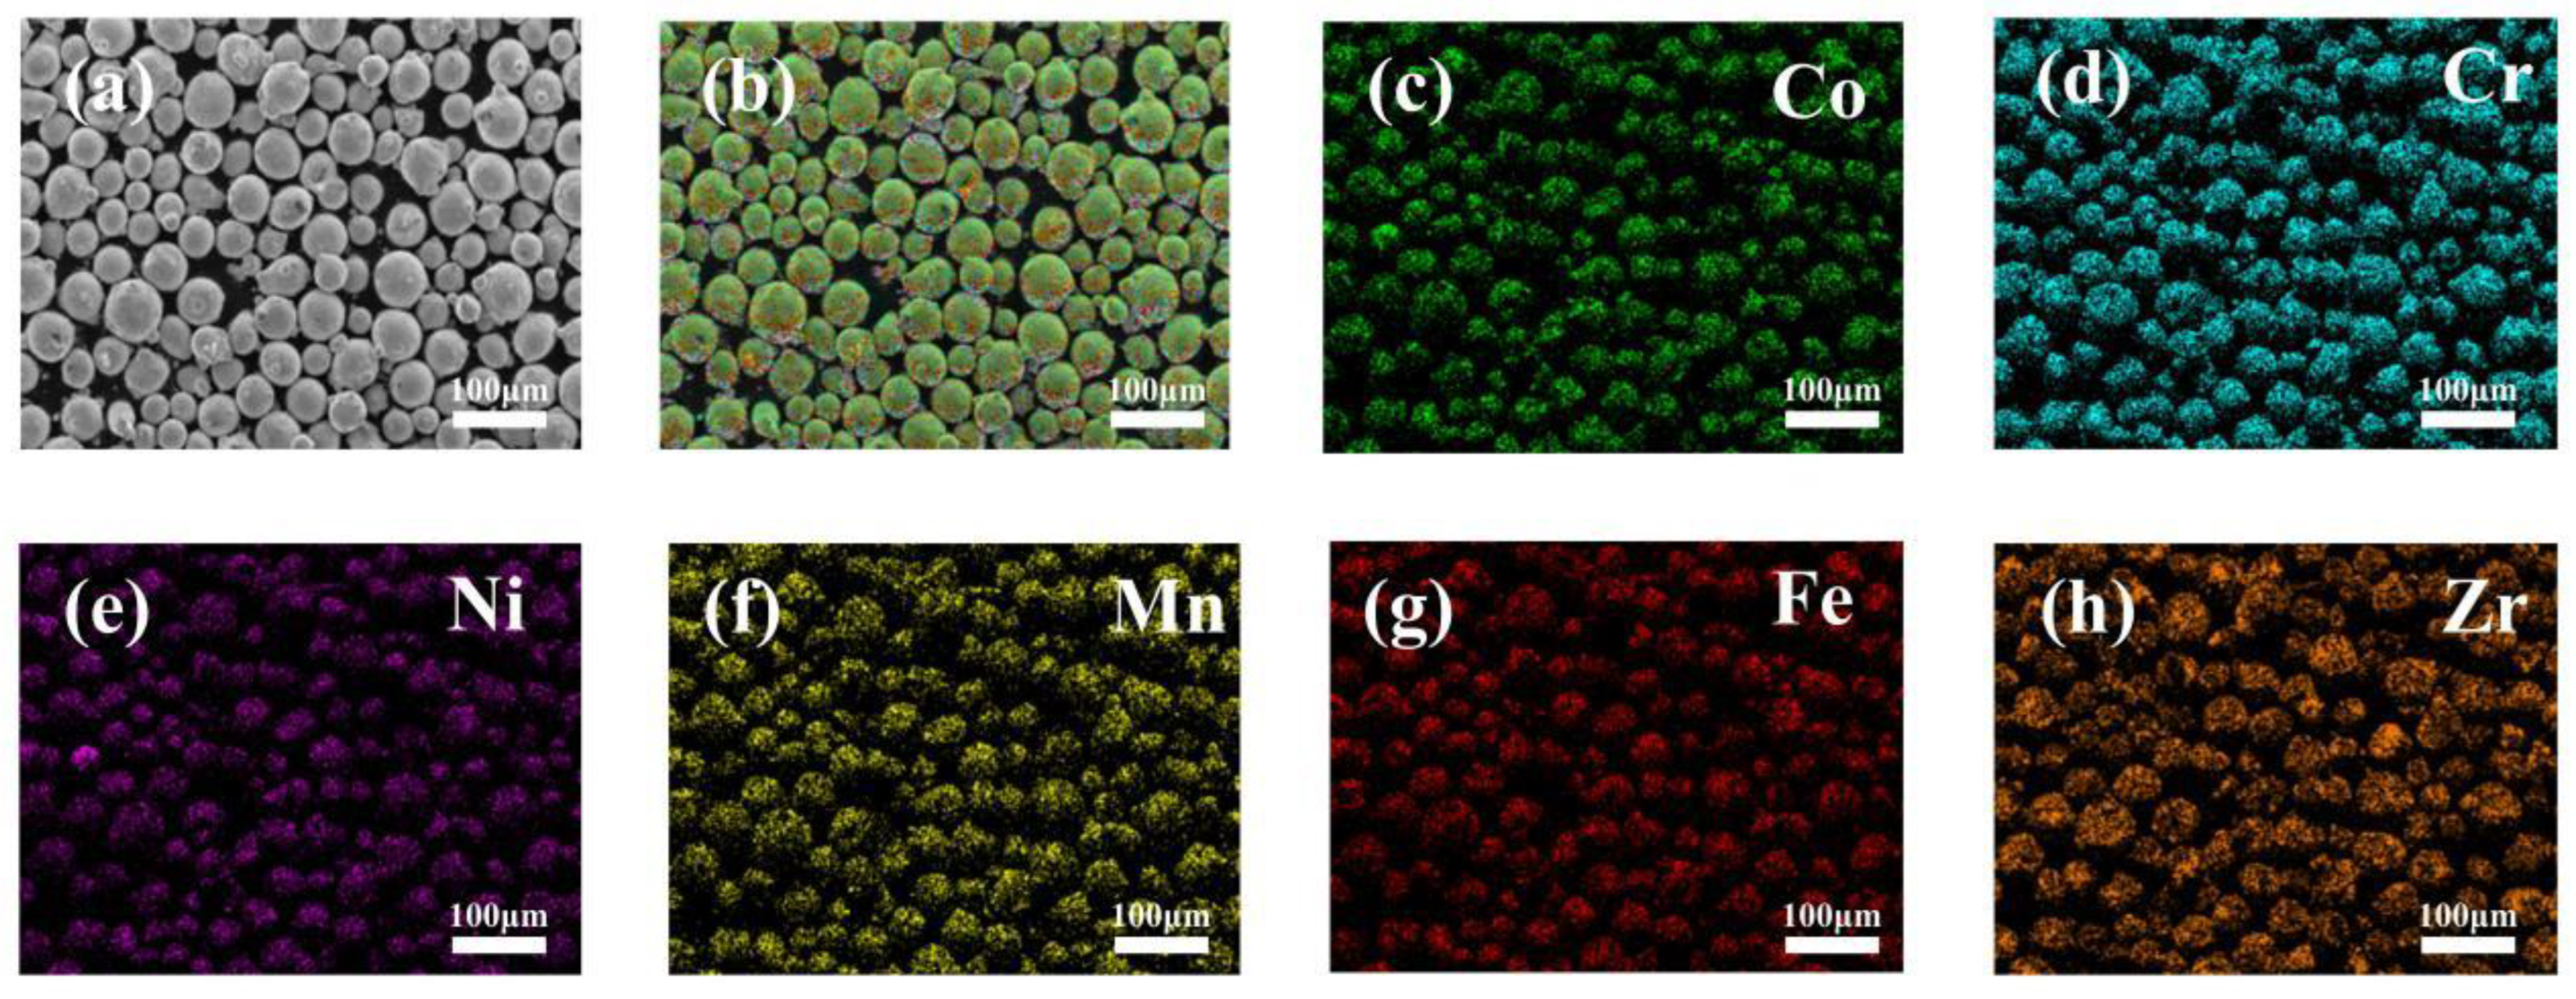
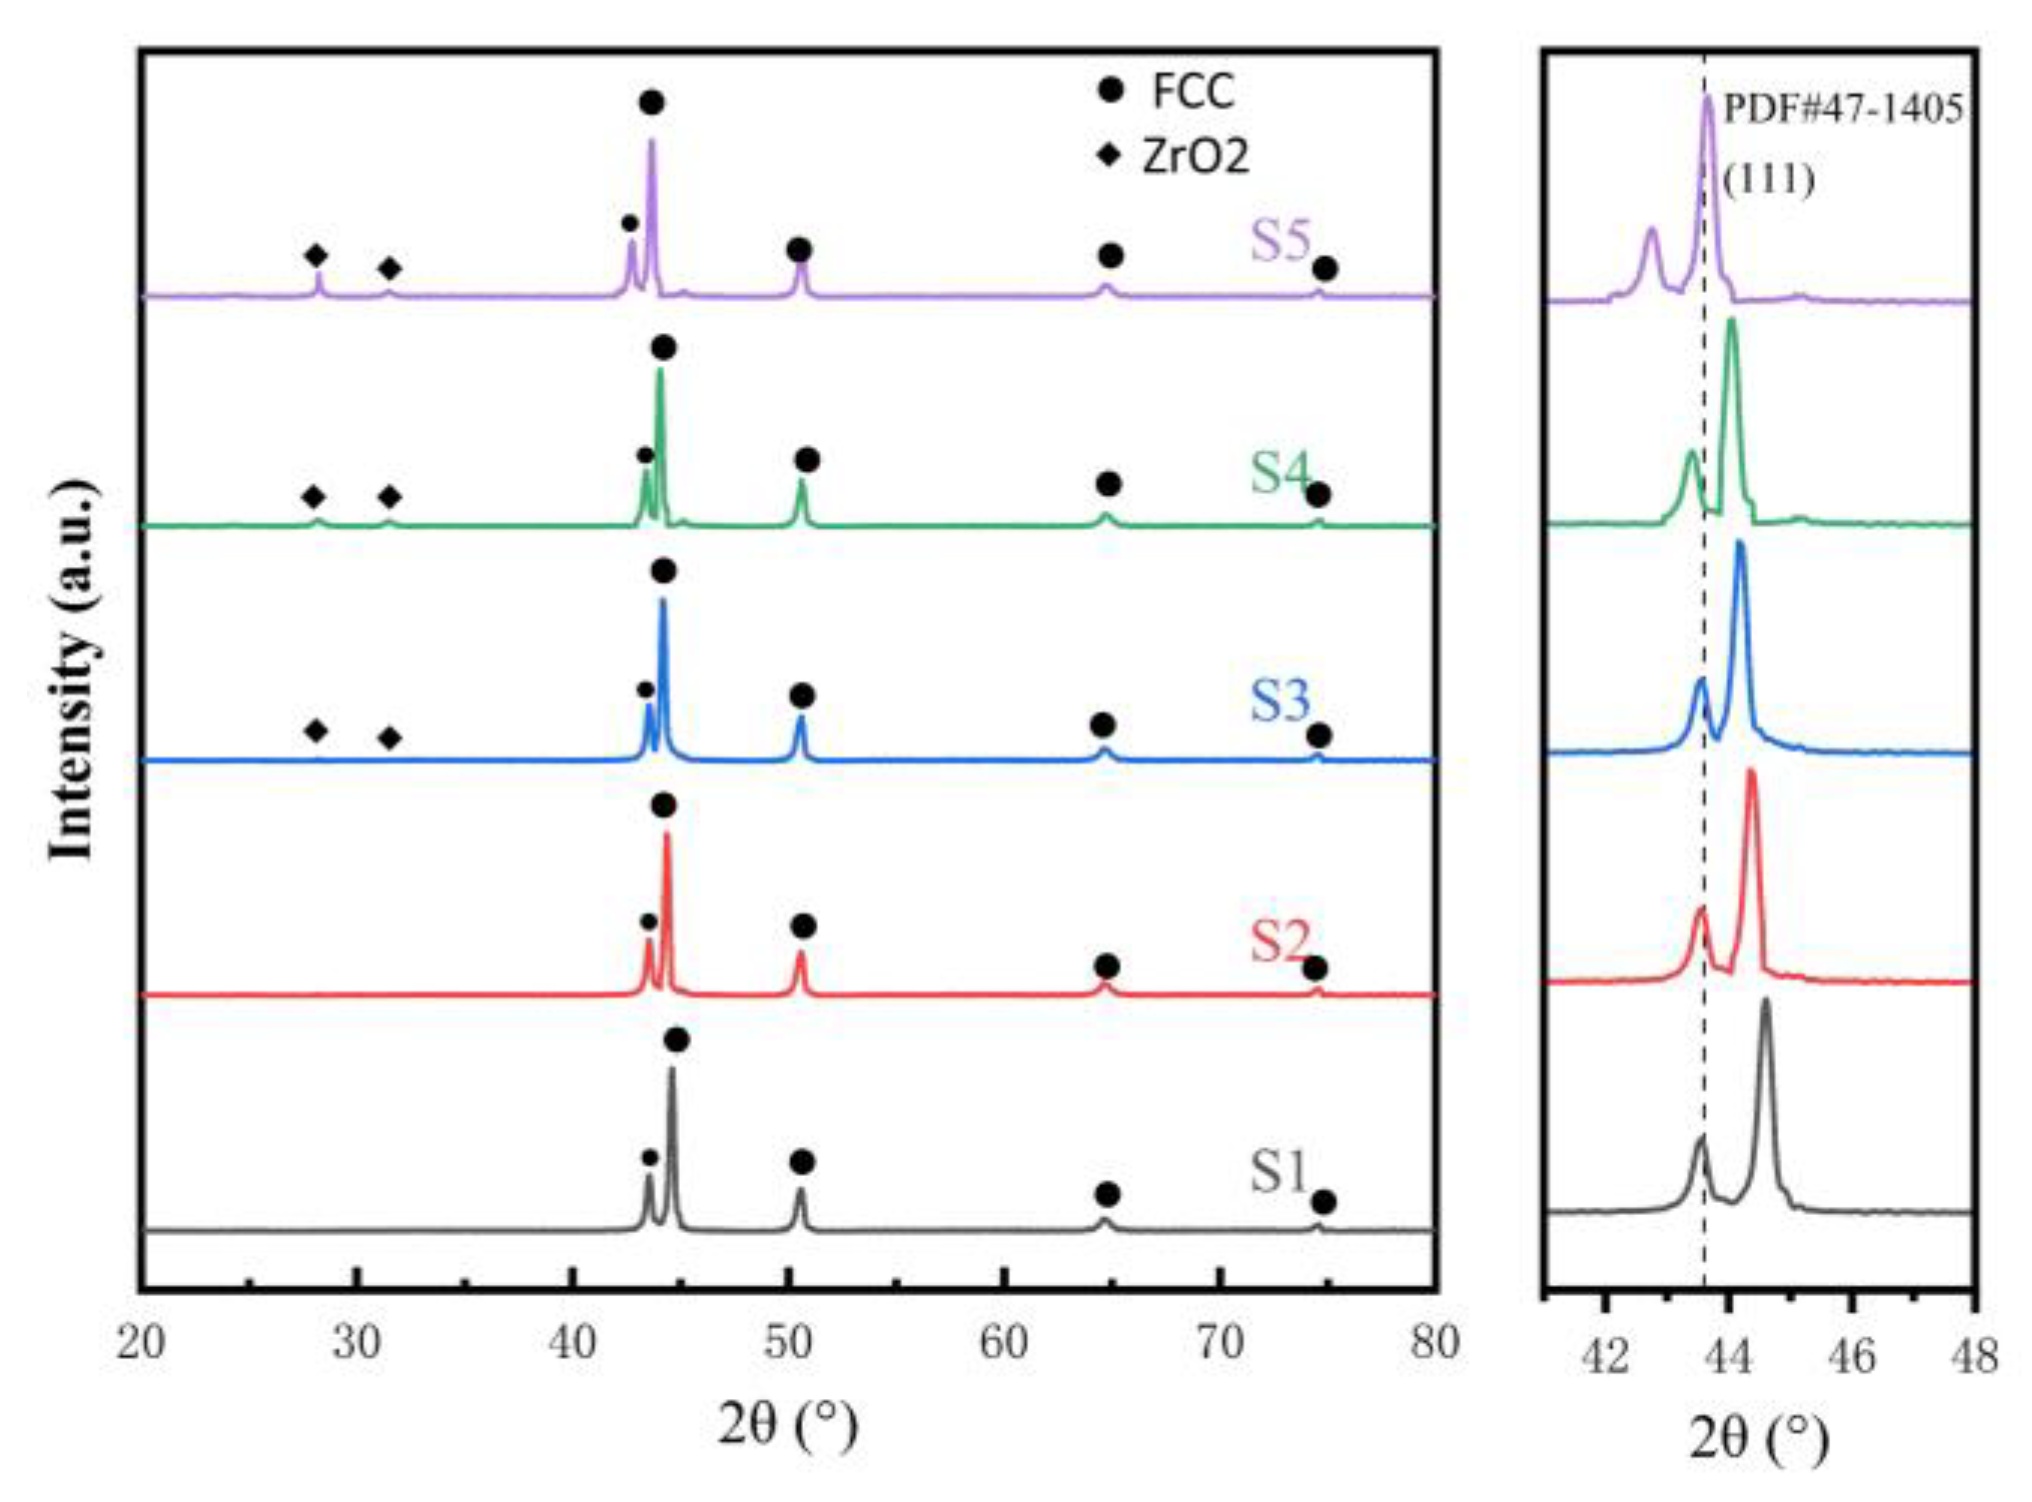
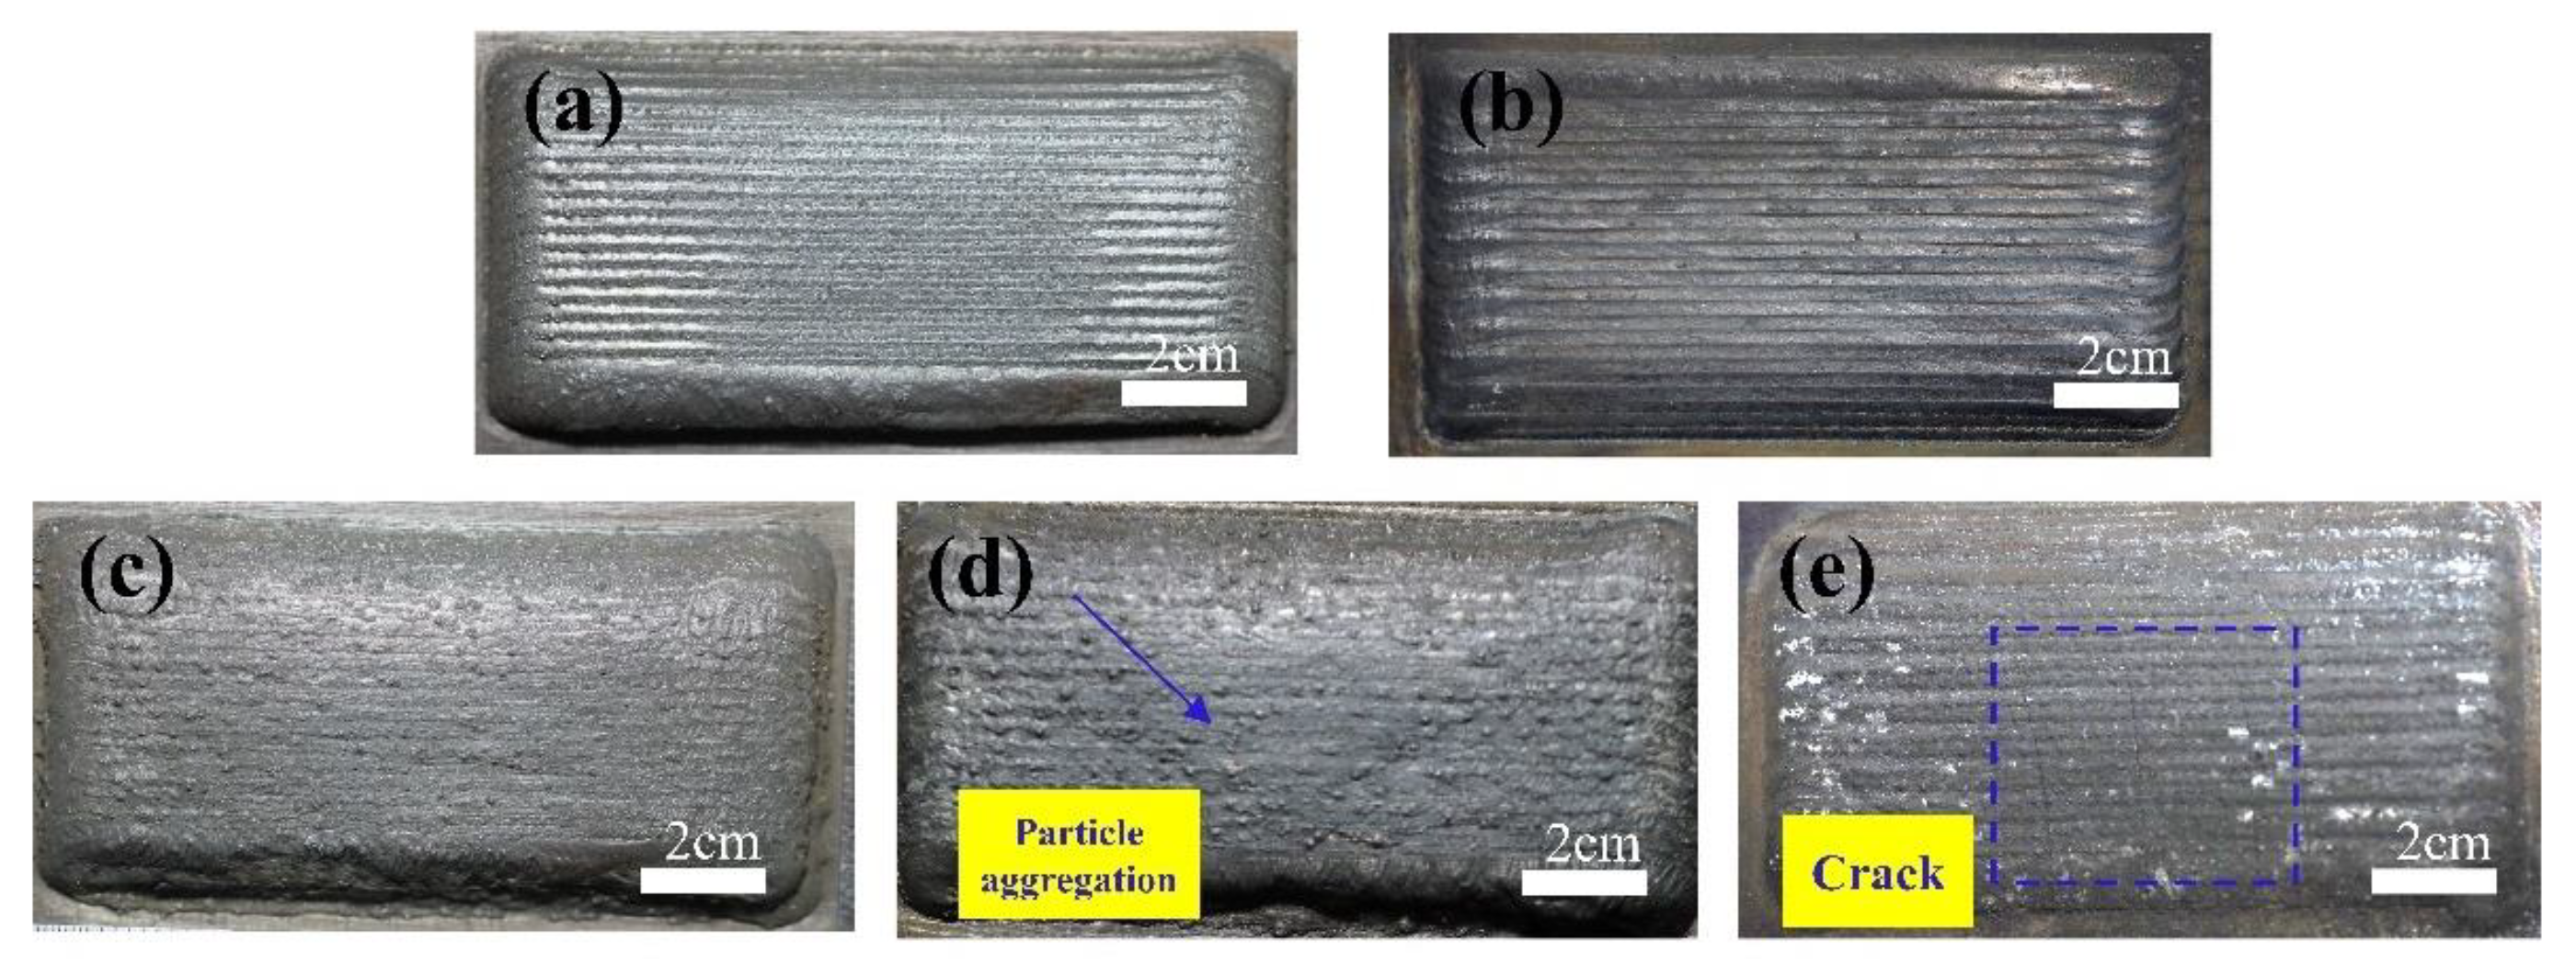
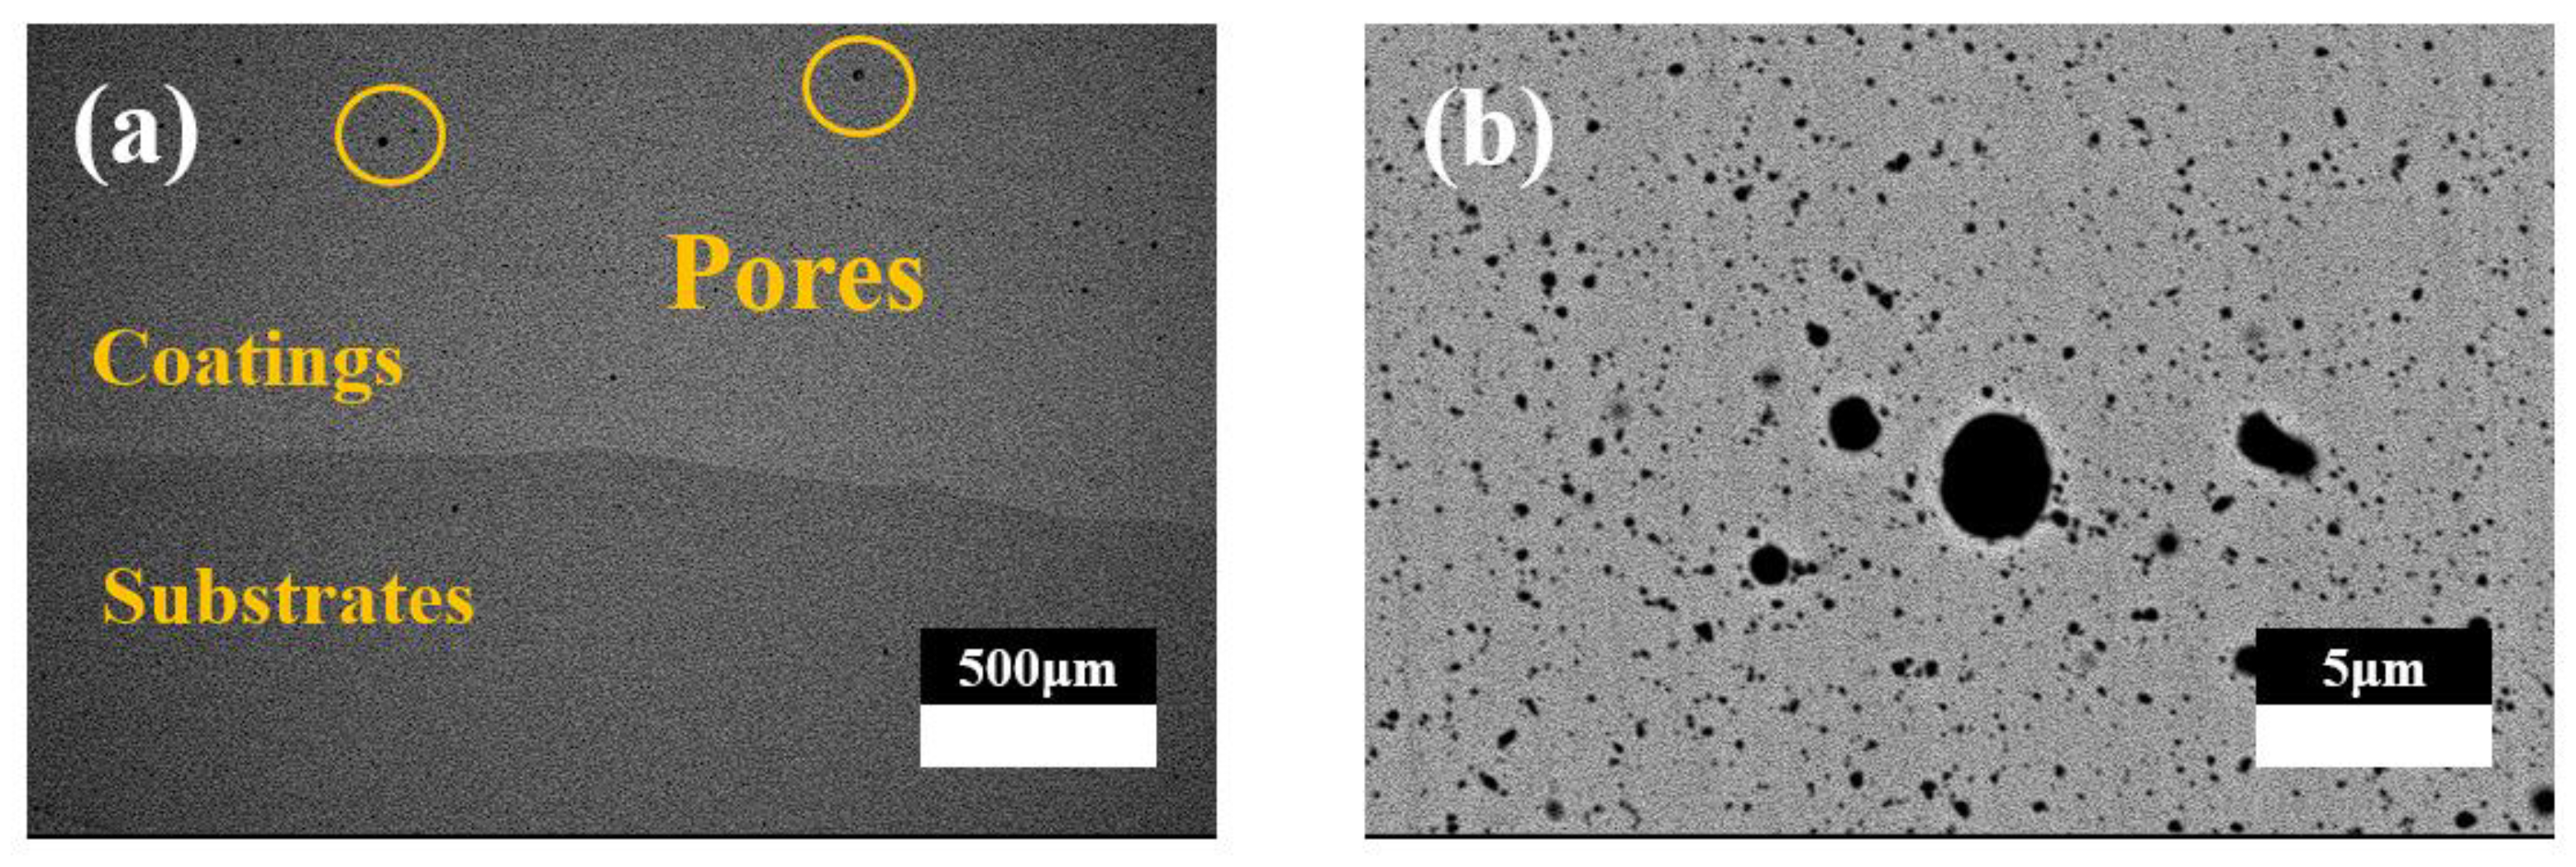
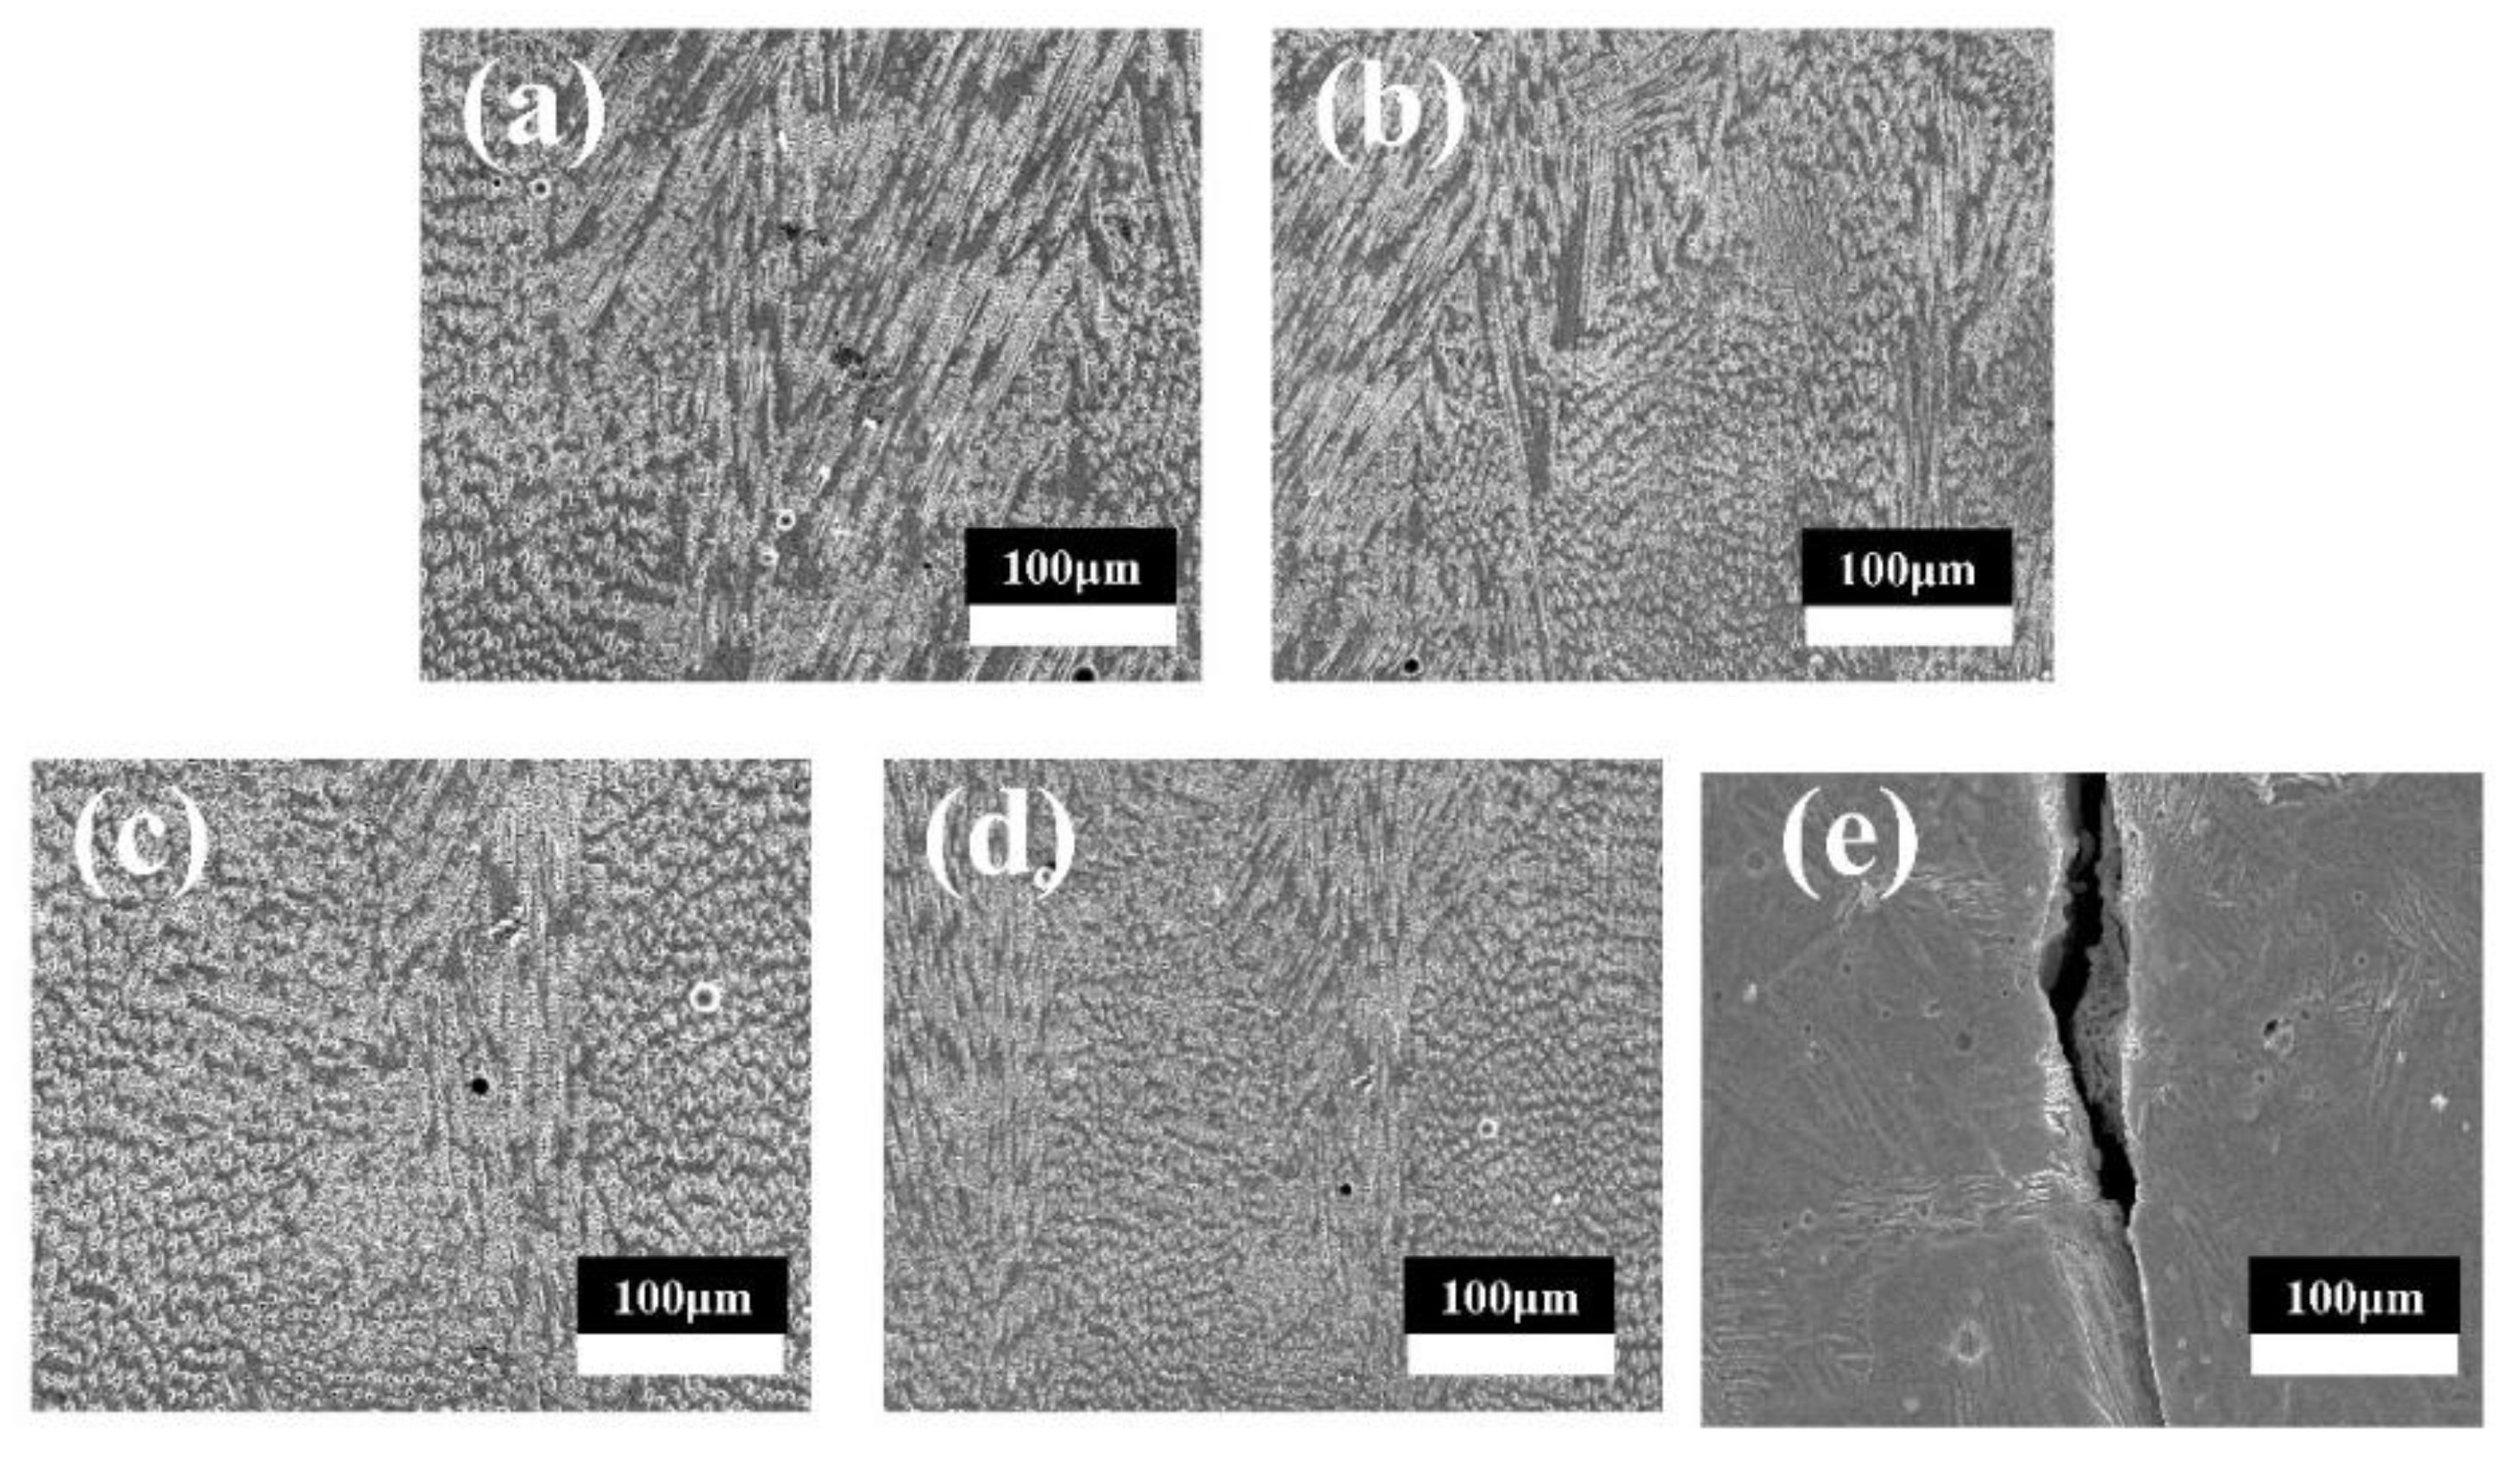
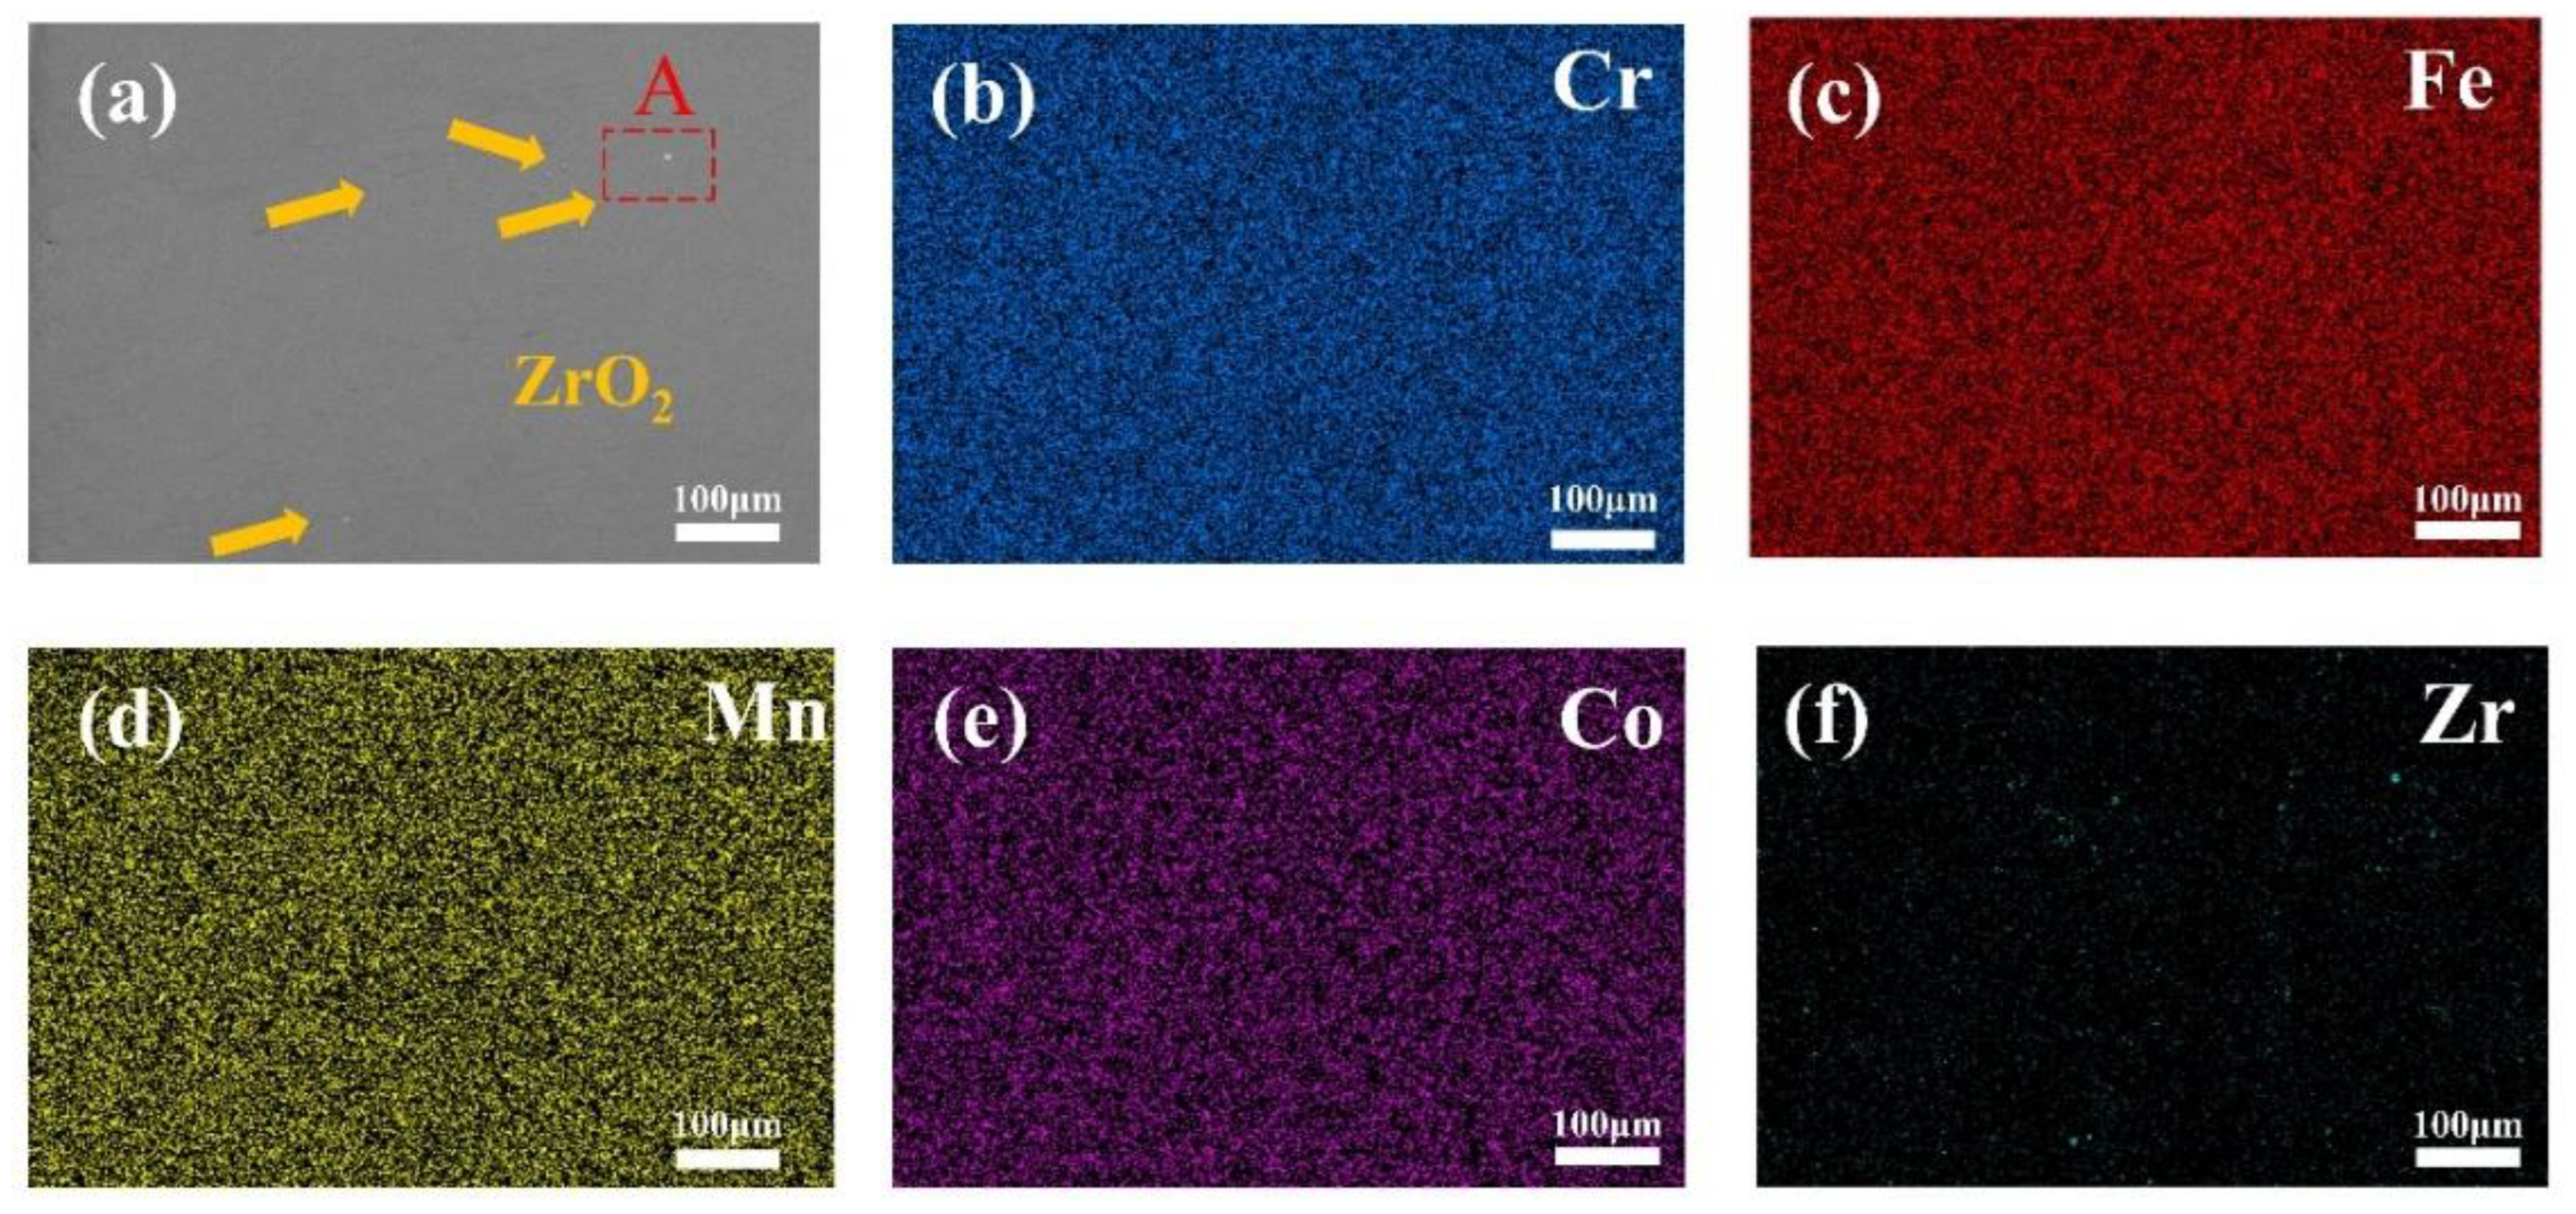
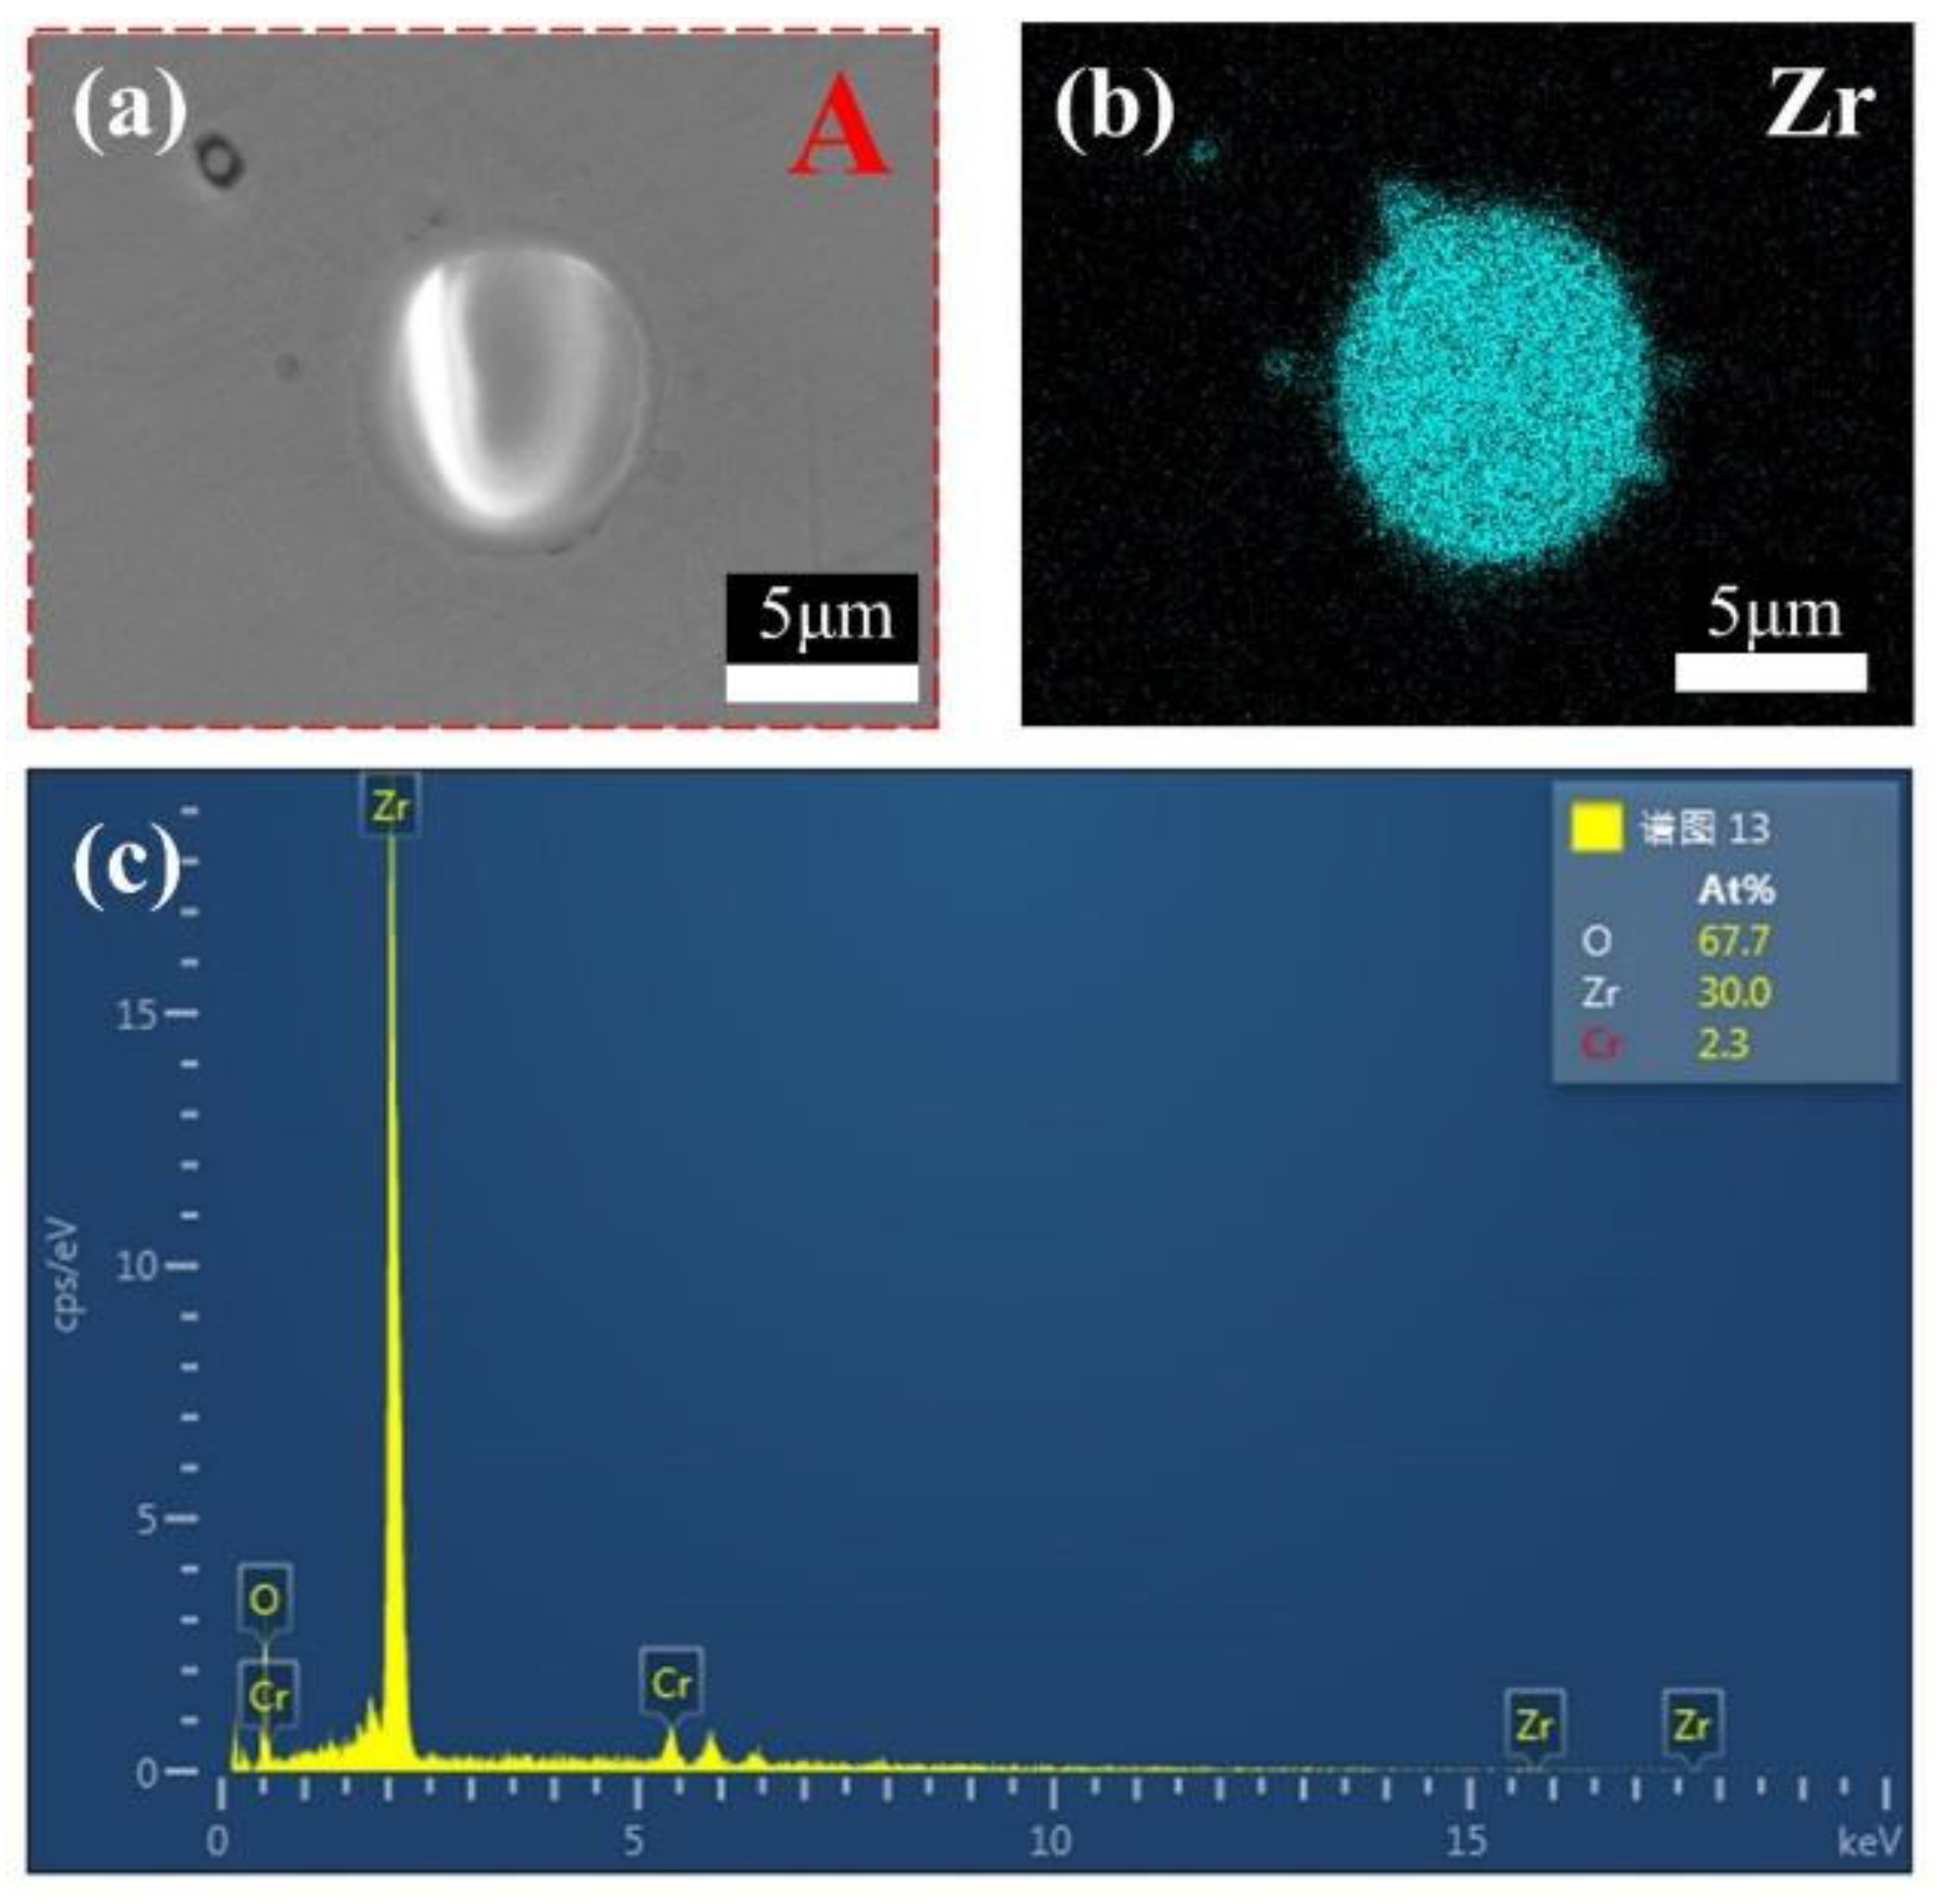
CoCrFeMnNi-xZrO2 high-entropy alloy composite coatings with different ZrO2 contents were prepared on the surface of 0Cr13Ni5Mo martensitic stainless steel by a laser melting method. The phase structure of the composite coating consists of a simple FCC structure and a small amount of ZrO2 phase. The introduction of ZrO2 caused lattice distortion in the coating, and the 2θ of (111)FCC shifted towards lower angles. The five high-entropy alloy composite coatings were metallurgically bonded to the substrate, the elements were uniformly distributed without segregation, and the ZrO2 particles were uniformly distributed in the substrate.
(2)
The microhardness of the composite coatings increased significantly with the increase in the content of added ZrO2. When X = 10%, the coating’s microhardness reached 348 HV, which was 95.53% higher than the HEA without ZrO2 added. This increase in microhardness was mainly due to fine grain strengthening and diffusion strengthening.
(3)
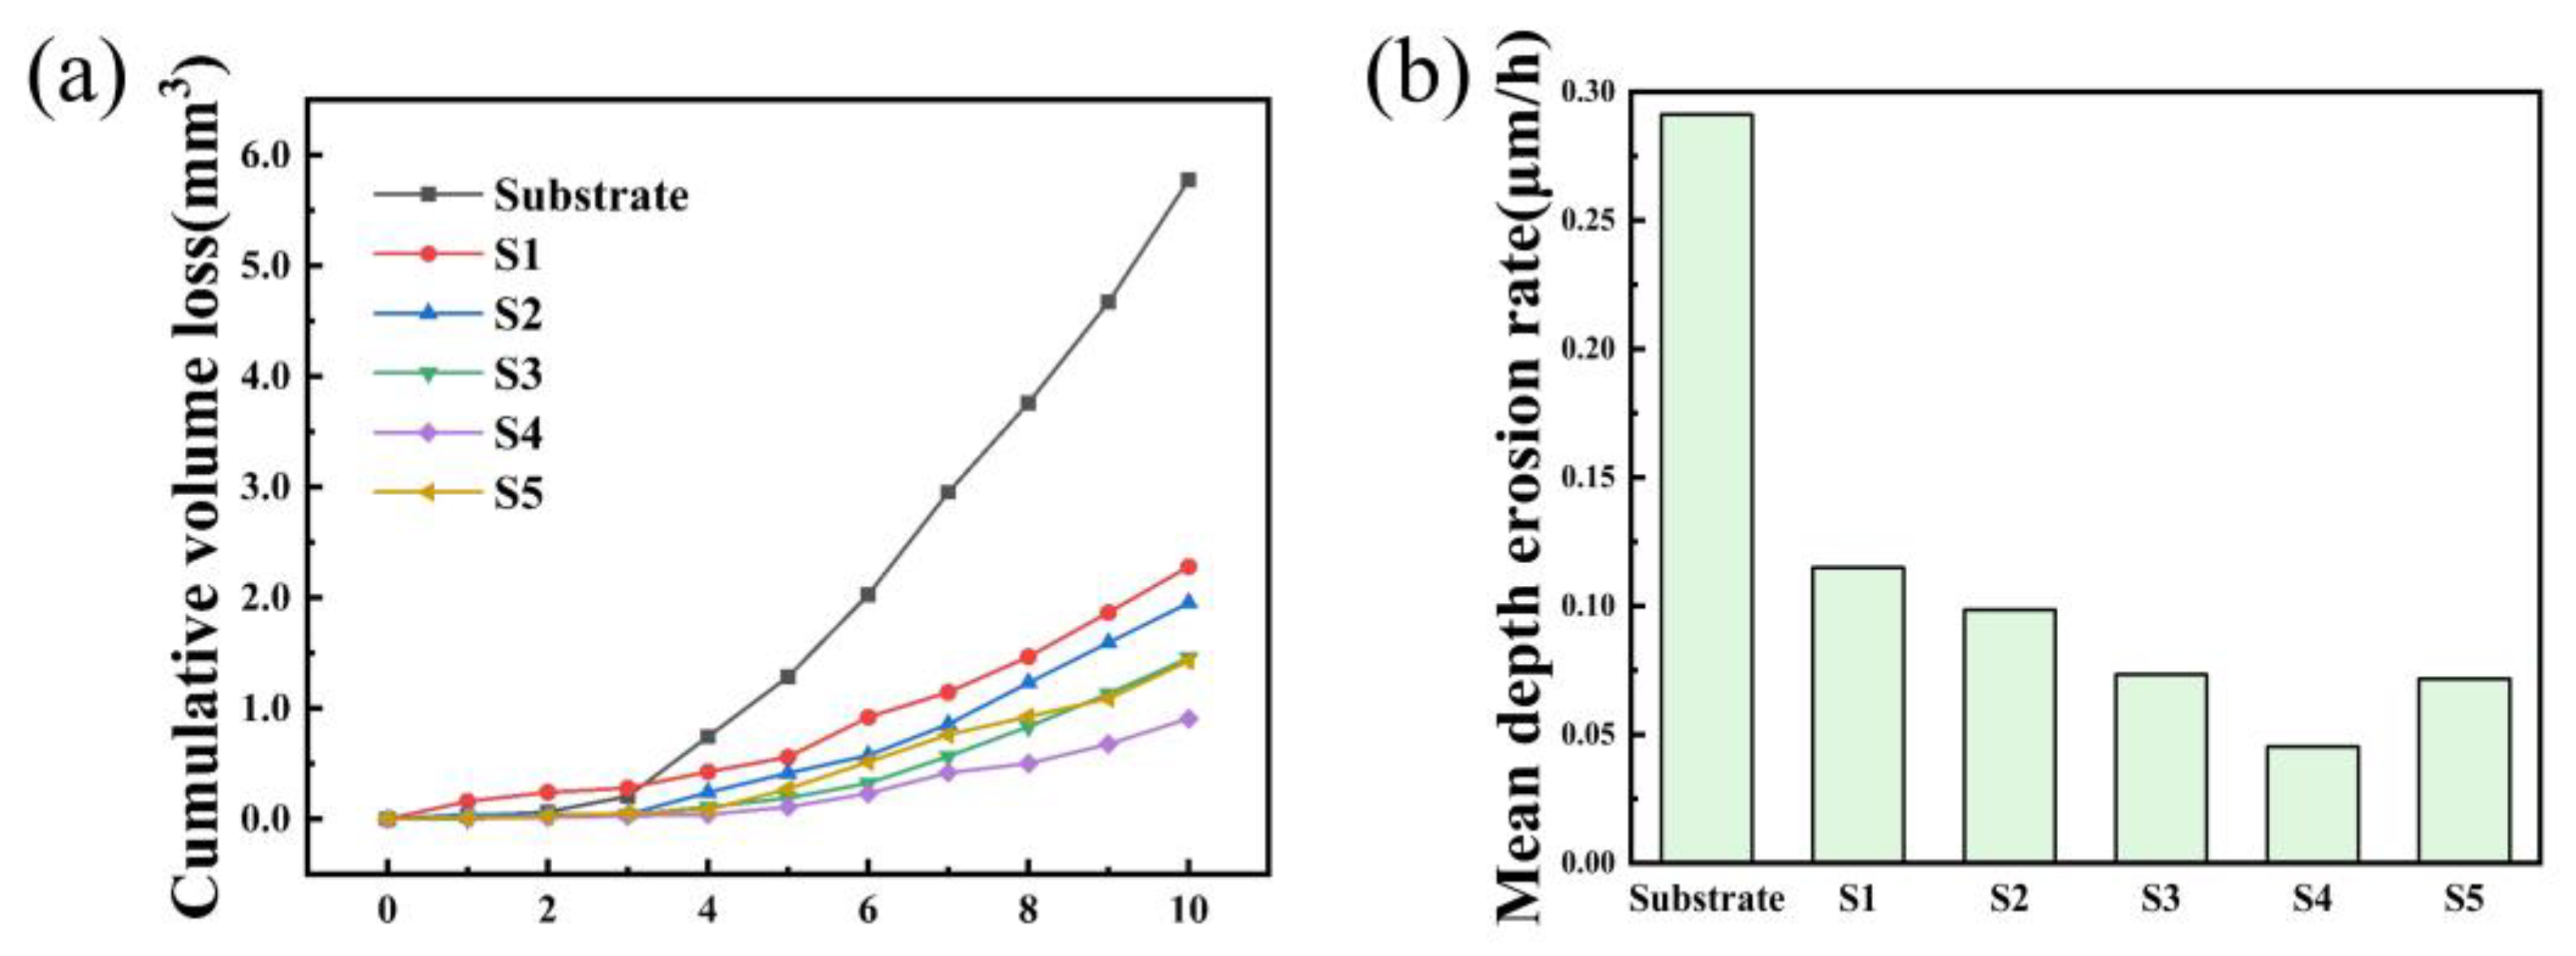
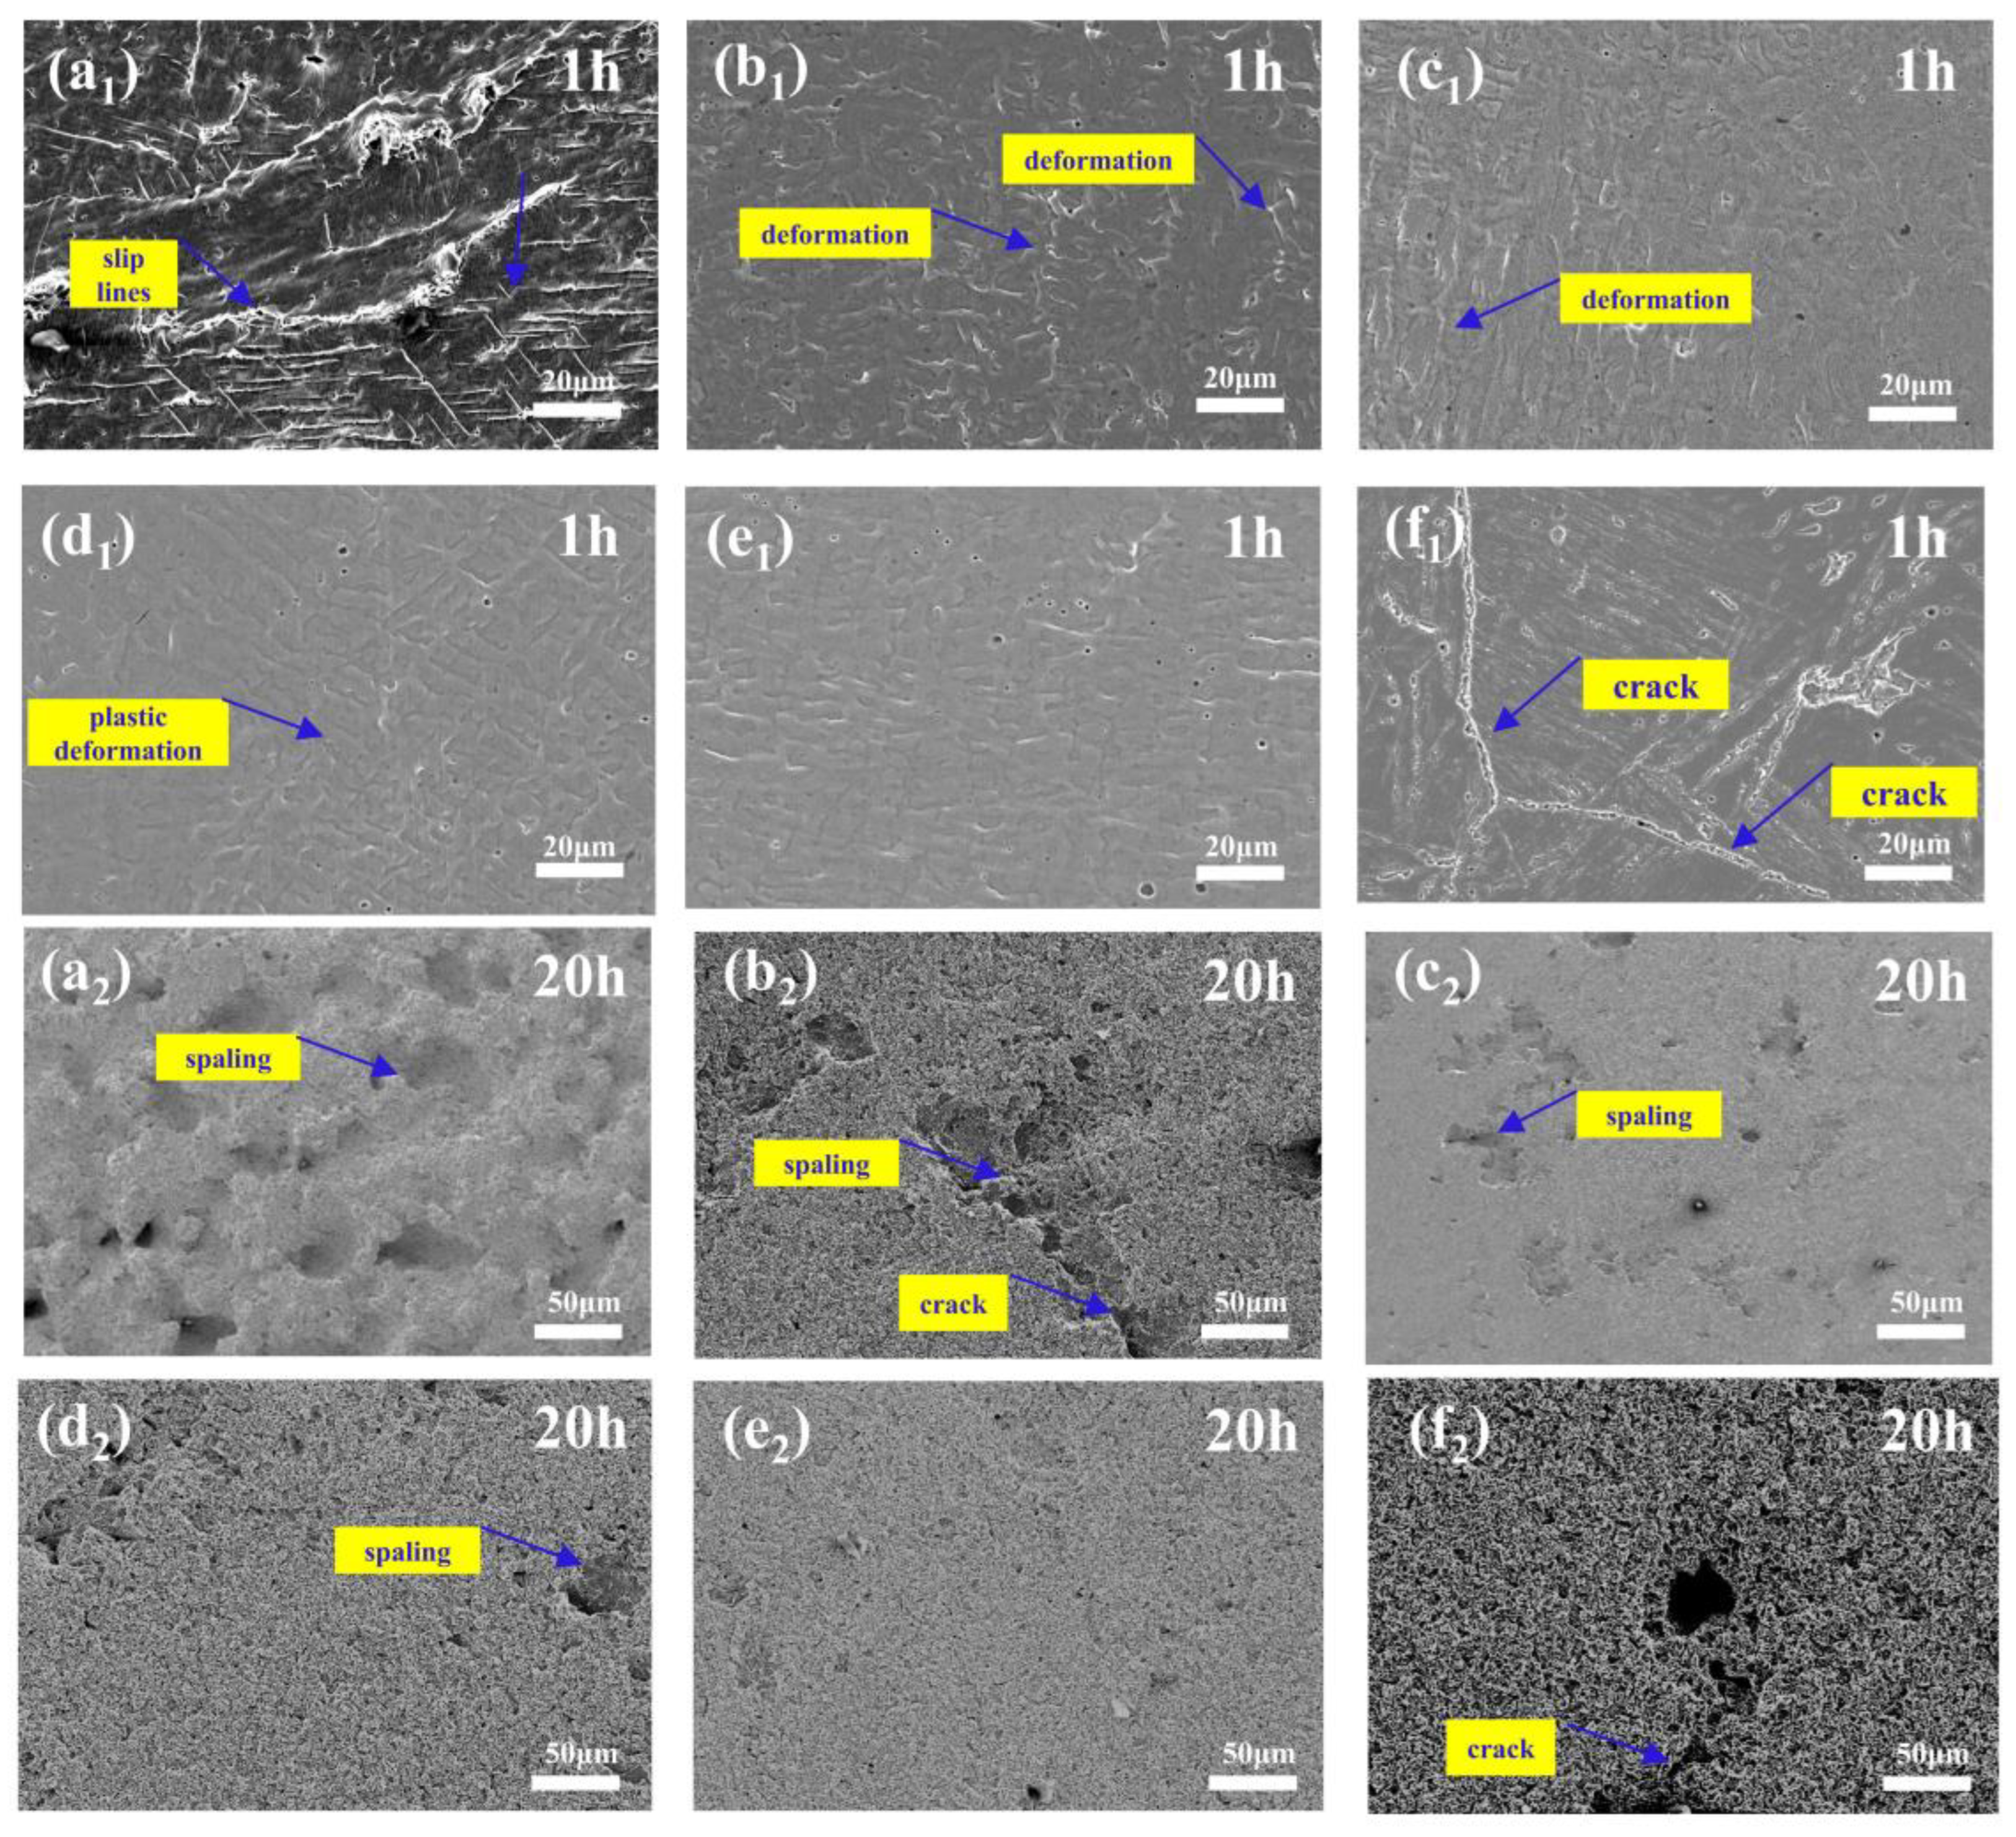
The composite coatings have better cavitation resistance than the substrate. Large areas of spalling and cracks appeared on the surface of 0Cr13Ni5Mo after 10 h cavitation. HEACs maintained a relatively flat surface. The addition of ZrO2 prolonged the incubation period of the high-entropy alloys. With the addition of 5% wt.% ZrO2, the composite coatings of high-entropy alloys showed the best cavitation resistance, with a cumulative volume loss rate of only 15.74% of that of the substrate at 10 h.
(4)
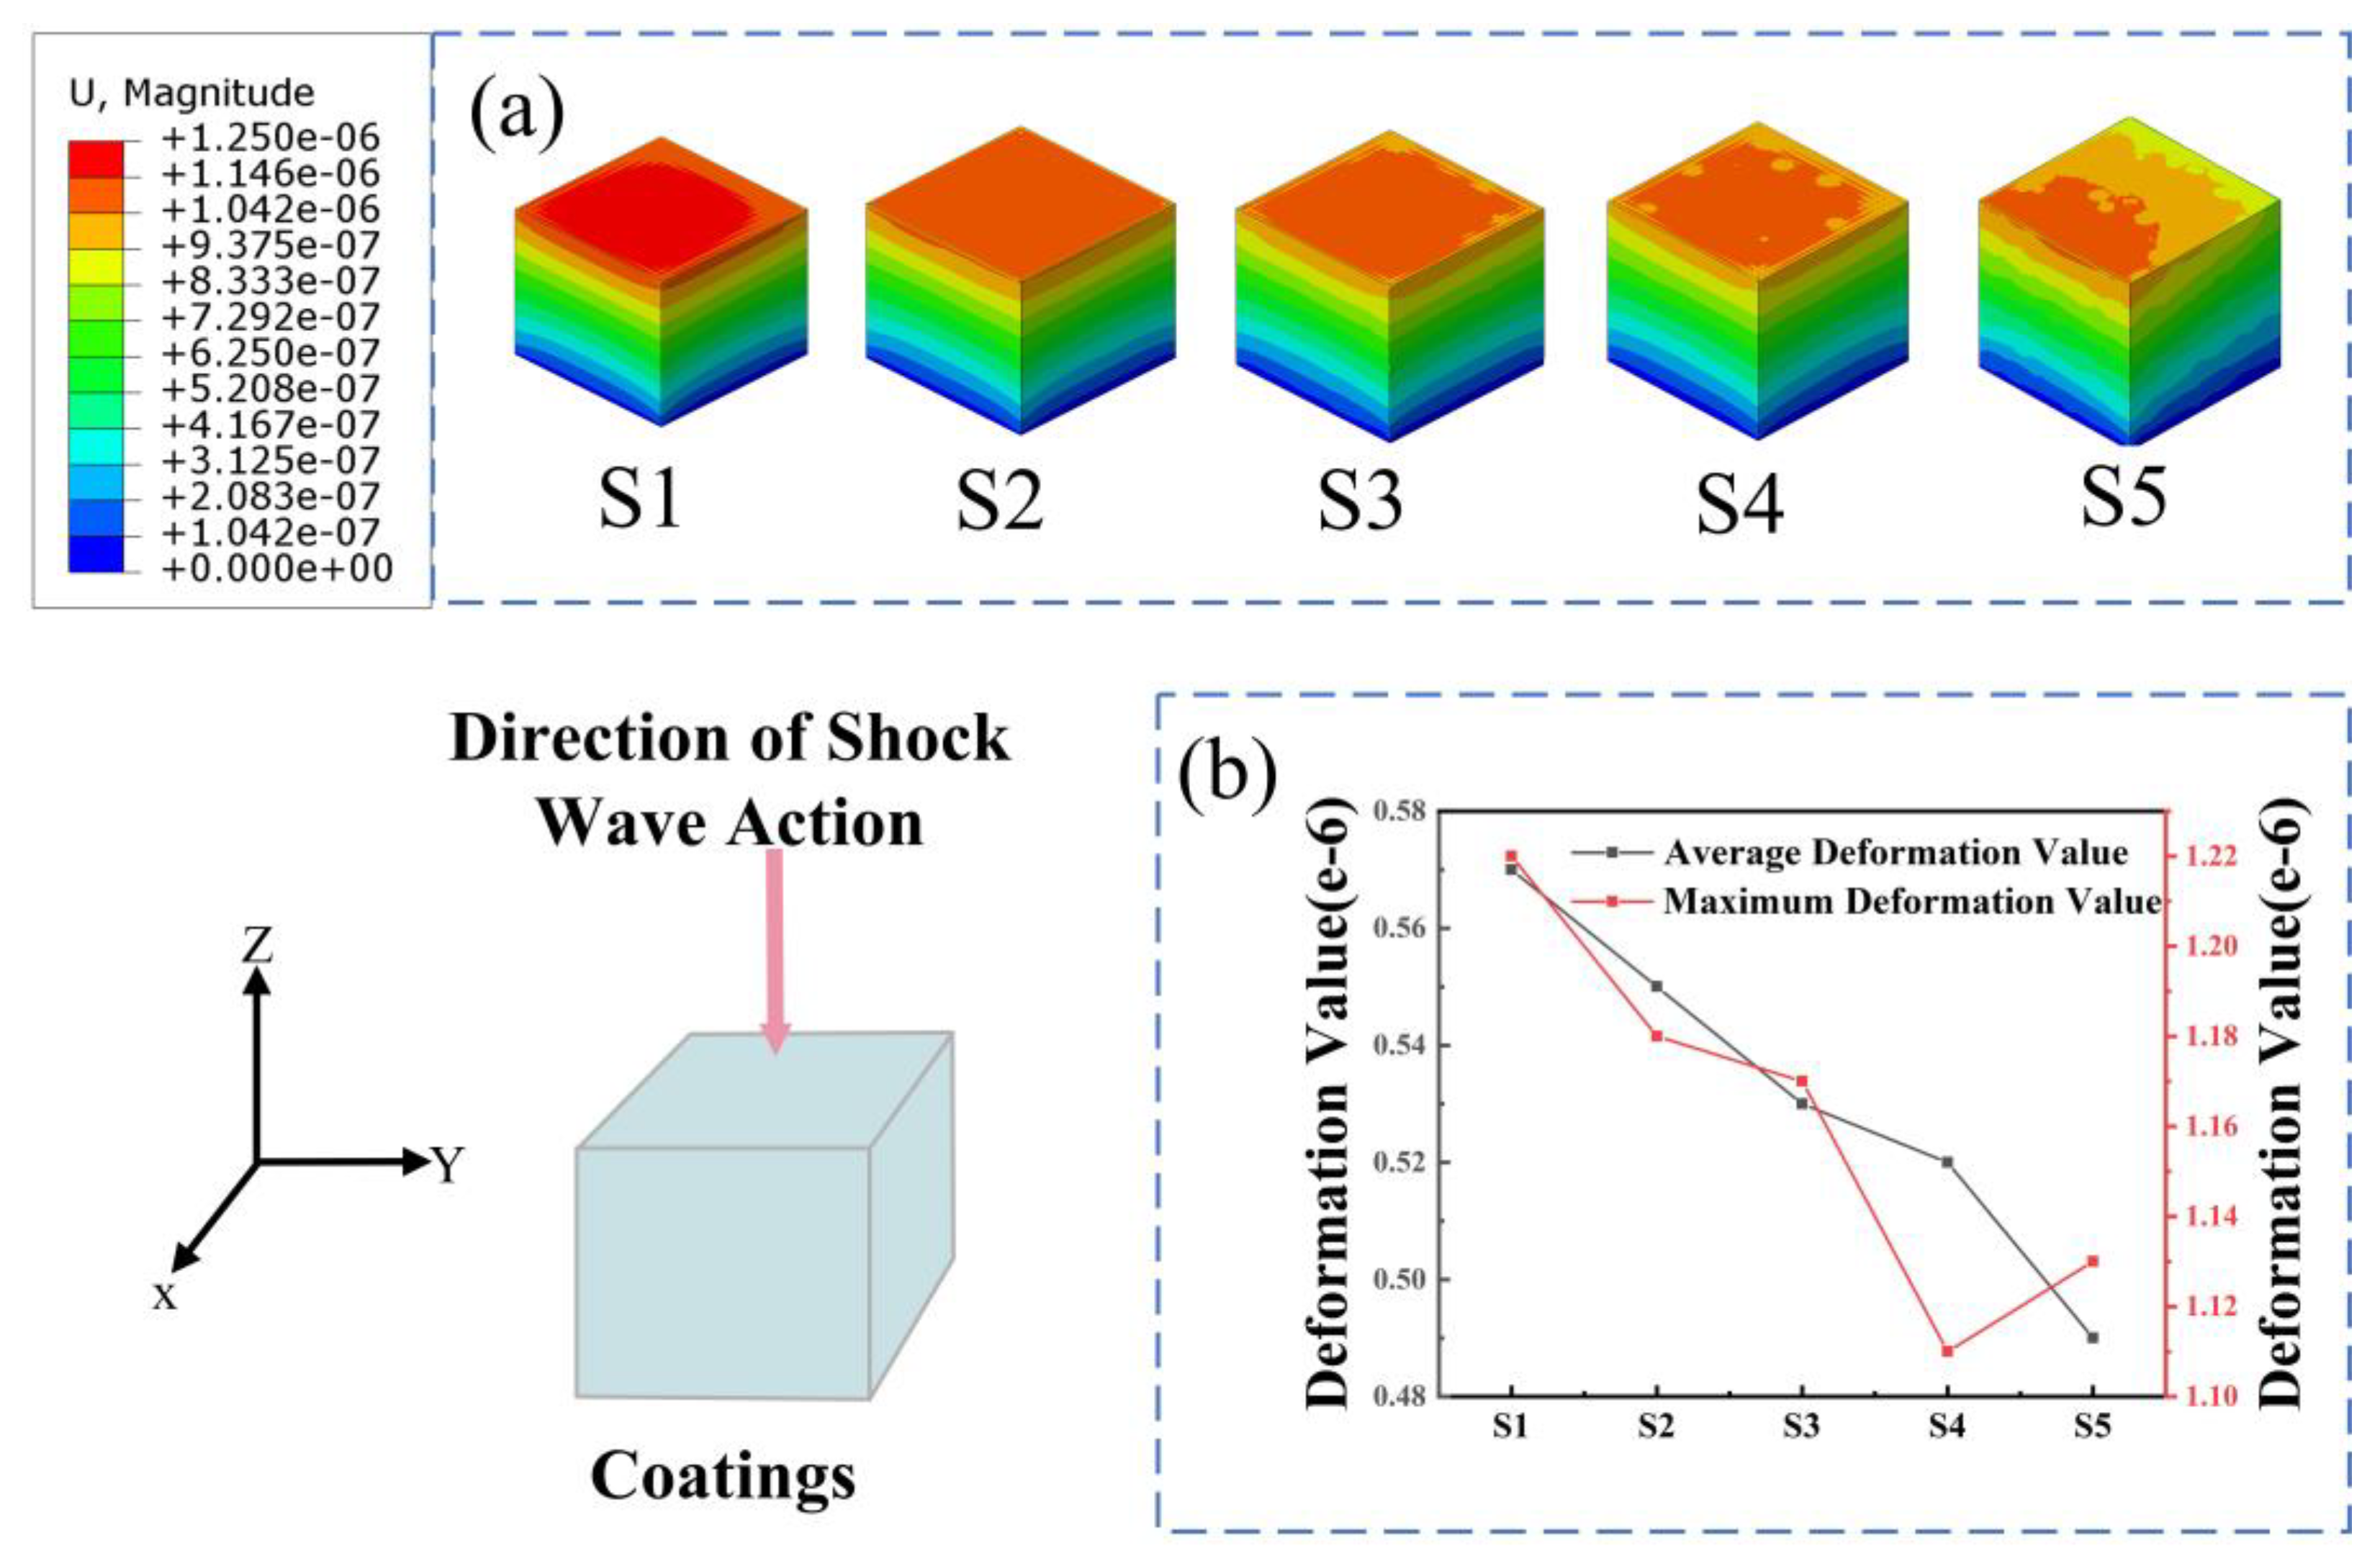
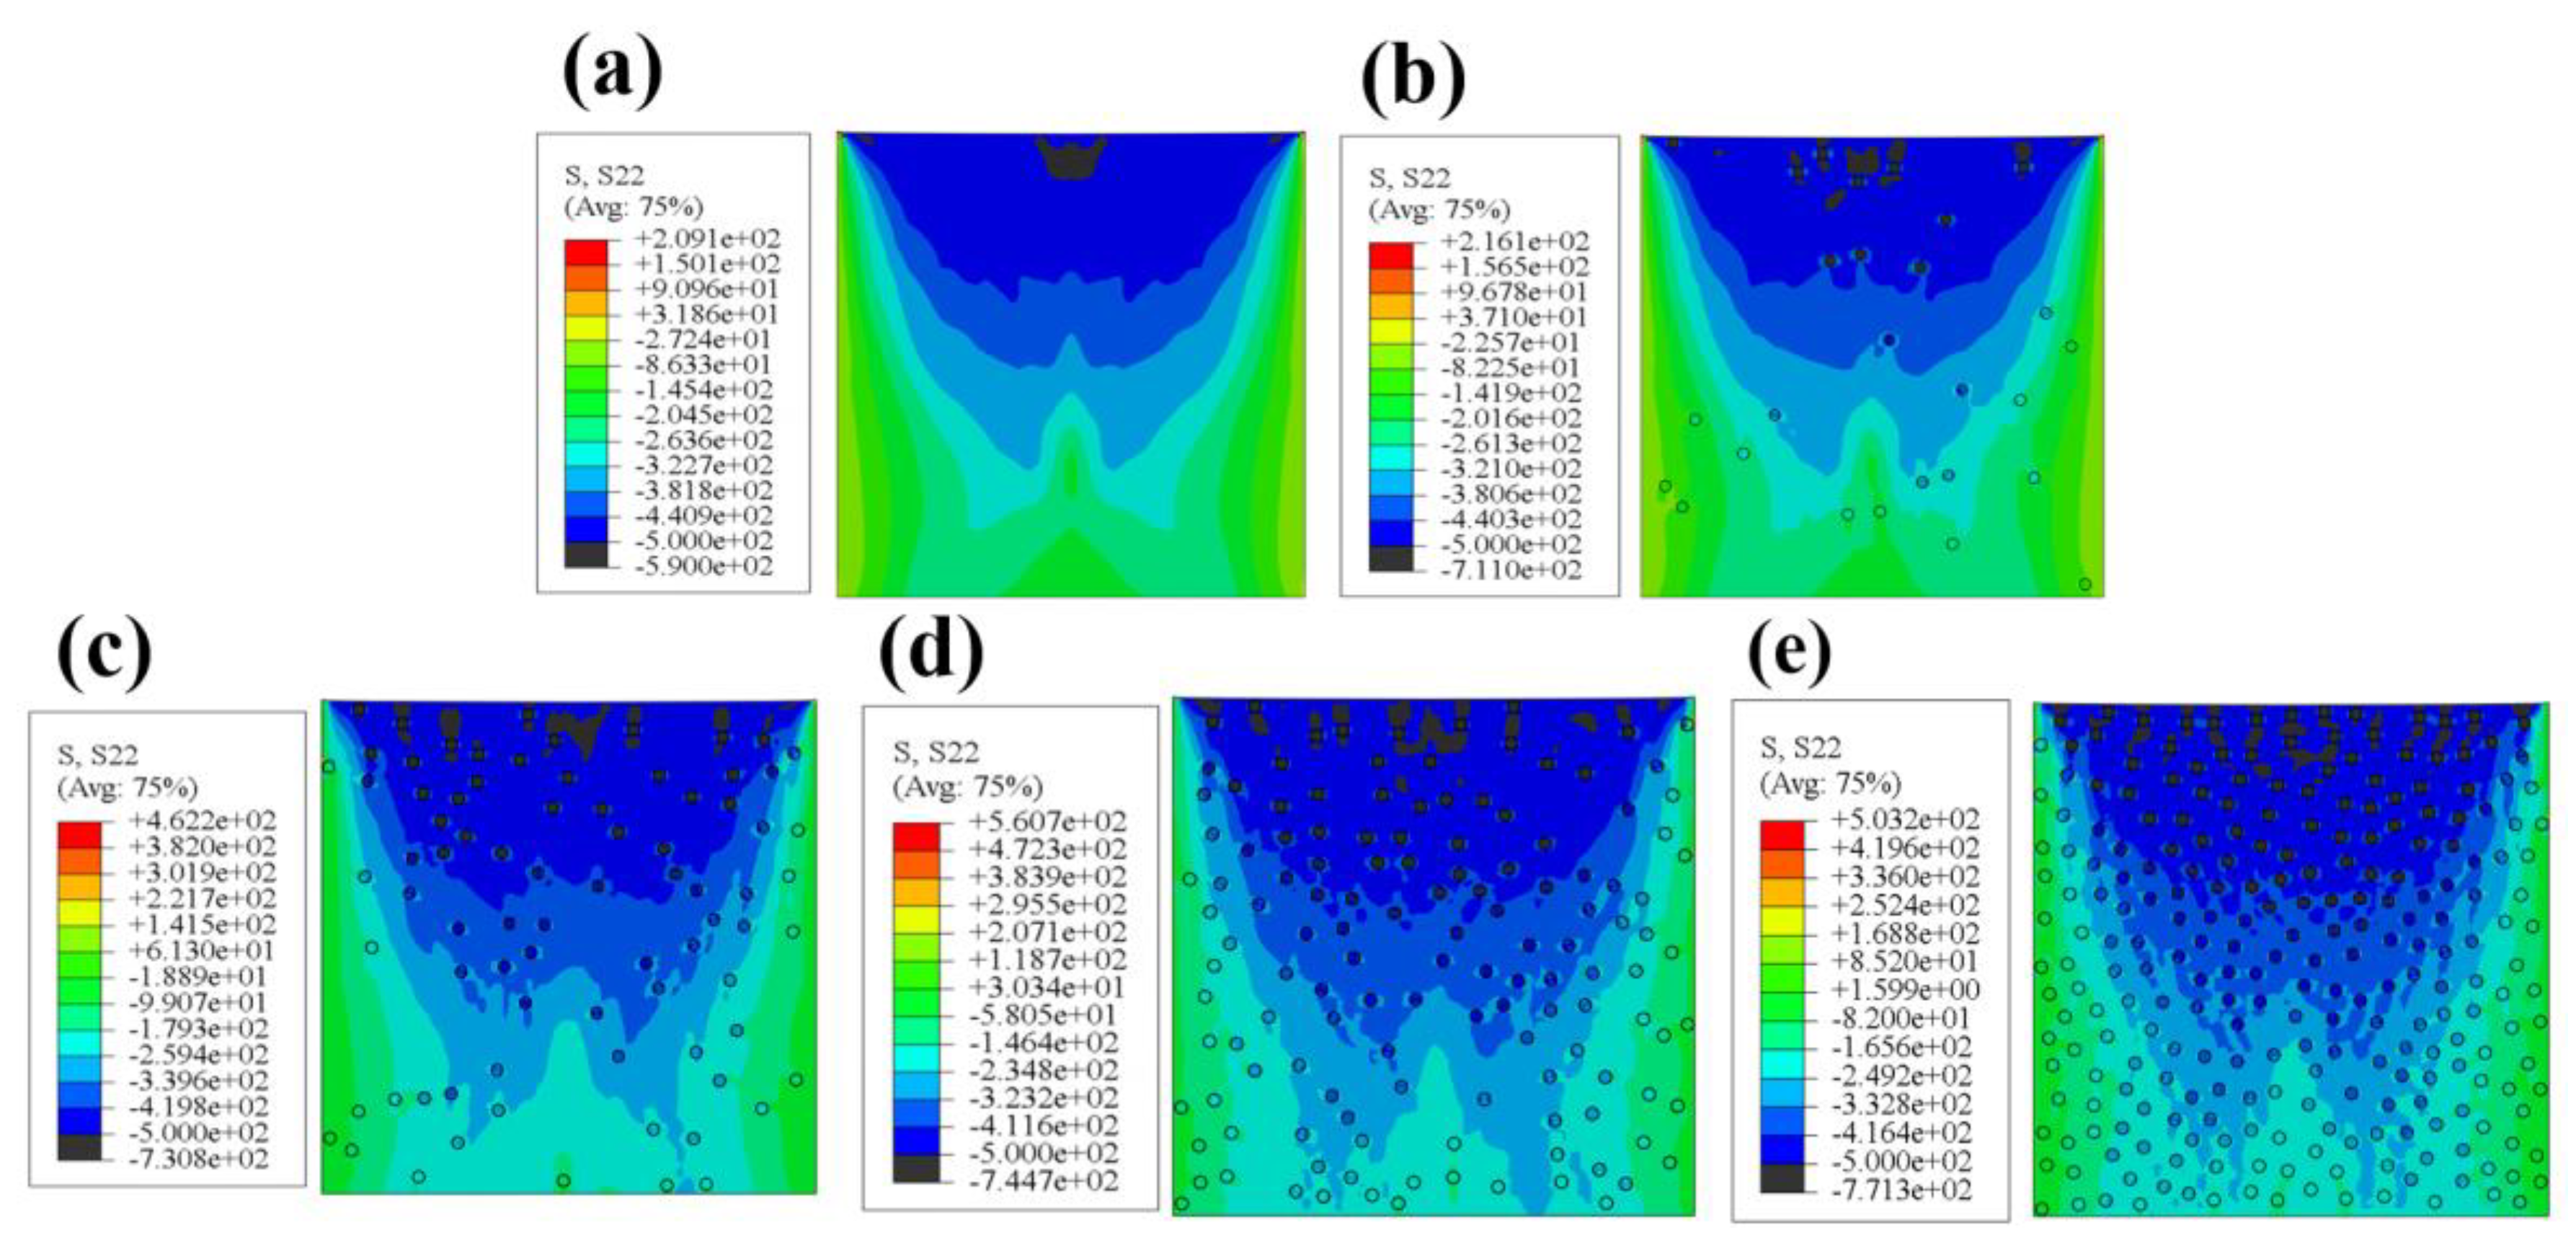
The finite element simulation results show that after the addition of ZrO2, the average and maximum deformations produced by the composite coatings undergoing cavitation erosion were reduced, the stresses were more concentrated on ZrO2 particles, and the stresses on the matrix underwent a decrease. The introduction of the second-phase particles subjected them to higher compressive stresses, which further improved the cavitation erosion resistance of the material. When the proportion of ZrO2 reached 10 percent, the higher concentration of stress on the particles had a deleterious effect.

Author Contributions

Conceptualization, D.Y. and Y.W.; methodology, D.Y.; software, J.C. and H.Z.; validation, J.C., H.Z. and M.W.; formal analysis, J.C.; investigation, J.Z.; resources, N.M. and H.Z.; data curation, J.C.; writing—original draft preparation, J.C.; writing—review and editing, D.Y. All authors have read and agreed to the published version of the manuscript.

Funding

This research was funded by the National Natural Science Foundation of China, grant U1904185 and Longmen Laboratory Frontier Exploration Projects (LMQYTSKT007) for financial support.

Data Availability Statement

The data that support the findings of this study are available from the corresponding author upon reasonable request.

Acknowledgments

Thank you to the Ministry of Science and Technology and Longmen Laboratory for their support of this article.

Conflicts of Interest

The authors declare no conflicts of interest.

References

  1. Zheng, Y.G.; Luo, S.Z.; Ke, W. Cavitation erosion–corrosion behaviour of CrMnB stainless overlay and 0Cr13Ni5Mo stainless steel in 0.5M NaCl and 0.5M HCL solutions. Tribol. Int. 2008, 41, 1181–1189. [Google Scholar] [CrossRef]
  2. Wei, Z.; Wu, Y.; Hong, S.; Cheng, J.; Qiao, L.; Cheng, J.; Zhu, S.J.S.; Technology, C. Ultrasonic cavitation erosion behaviors of high-velocity oxygen-fuel (HVOF) sprayed AlCoCrFeNi high-entropy alloy coating in different solutions. Surf. Coat. Technol. 2021, 409, 126899. [Google Scholar] [CrossRef]
  3. Jiang, Y.; Li, J.; Juan, Y.; Lu, Z.; Jia, W. Evolution in microstructure and corrosion behavior of AlCoCrxFeNi high-entropy alloy coatings fabricated by laser cladding. J. Alloys Compd. 2019, 775, 1–14. [Google Scholar] [CrossRef]
  4. Haosheng, C.; Shihan, L. Inelastic damages by stress wave on steel surface at the incubation stage of vibration cavitation erosion. Wear 2009, 266, 69–75. [Google Scholar] [CrossRef]
  5. Sreedhar, B.; Albert, S.; Pandit, A. Cavitation damage: Theory and measurements—A review. Wear 2017, 372, 177–196. [Google Scholar] [CrossRef]
  6. George, E.P.; Raabe, D.; Ritchie, R.O. High-entropy alloys. Nat. Rev. Mater. 2019, 4, 515–534. [Google Scholar] [CrossRef]
  7. Cantor, B.; Chang, I.; Knight, P.; Vincent, A.J.B. Microstructural development in equiatomic multicomponent alloys. Mater. Sci. Eng. A 2004, 375, 213–218. [Google Scholar] [CrossRef]
  8. Yeh, J.W.; Chen, S.K.; Lin, S.J.; Gan, J.Y.; Chin, T.S.; Shun, T.T.; Tsau, C.H.; Chang, S.Y. Nanostructured high-entropy alloys with multiple principal elements: Novel alloy design concepts and outcomes. Adv. Eng. Mater. 2004, 6, 299–303. [Google Scholar] [CrossRef]
  9. Nair, R.B.; Arora, H.S.; Mukherjee, S.; Singh, S.; Singh, H.; Grewal, H.S. Exceptionally high cavitation erosion and corrosion resistance of a high entropy alloy. Ultrason. Sonochem 2018, 41, 252–260. [Google Scholar] [CrossRef]
  10. Yin, D.; Liang, G.; Fan, S.; Li, S. Ultrasonic Cavitation Erosion Behavior of AlCoCr(x)CuFe High Entropy Alloy Coatings Synthesized by Laser Cladding. Materials 2020, 13, 4067. [Google Scholar] [CrossRef]
  11. Ren, J.; Zhang, Y.; Zhao, D.; Chen, Y.; Guan, S.; Liu, Y.; Liu, L.; Peng, S.; Kong, F.; Poplawsky, J.D.; et al. Strong yet ductile nanolamellar high-entropy alloys by additive manufacturing. Nature 2022, 608, 62–68. [Google Scholar] [CrossRef] [PubMed]
  12. Wu, H.; Wang, L.; Zhang, S.; Wu, C.L.; Zhang, C.H.; Sun, X.Y. Corrosion and cavitation erosion behaviors of laser clad FeNiCoCr high-entropy alloy coatings with different types of TiC reinforcement. Surf. Coat. Technol. 2023, 471, 129910. [Google Scholar] [CrossRef]
  13. Ren, X.; Sun, W.; Sheng, Z.; Liu, M.; Hui, H.; Xiao, Y. Effects of Nano-CeO2 on Microstructure and Properties of WC/FeCoNiCrMo0.2 Composite High Entropy Alloy Coatings by Laser Cladding. Nanomaterials 2023, 13, 1104. [Google Scholar] [CrossRef]
  14. Li, X.; Feng, Y.; Liu, B.; Yi, D.; Yang, X.; Zhang, W.; Chen, G.; Liu, Y.; Bai, P. Influence of NbC particles on microstructure and mechanical properties of AlCoCrFeNi high-entropy alloy coatings prepared by laser cladding. J. Alloys Compd. 2019, 788, 485–494. [Google Scholar] [CrossRef]
  15. Zong, L.; Xu, L.; Luo, C.; Li, Z.; Zhao, Y.; Xu, Z.; Zhu, C.; Wei, S. Fabrication of nano-ZrO2 strengthened WMoNbTaV refractory high-entropy alloy by spark plasma sintering. Mater. Sci. Eng. A 2022, 843, 143113. [Google Scholar] [CrossRef]
  16. Lepule, M.L.; Obadele, B.A.; Andrews, A.; Olubambi, P.A. Corrosion and wear behaviour of ZrO2 modified NiTi coatings on AISI 316 stainless steel. Surf. Coat. Technol. 2015, 261, 21–27. [Google Scholar] [CrossRef]
  17. Stambolova, I.; Dimitrov, O.; Shipochka, M.; Yordanov, S.; Blaskov, V.; Vassilev, S.; Jivov, B.; Simeonova, S.; Balashev, K.; Grozev, N.; et al. Corrosion resistance of sol-gel ZrO2 coatings deposited on stainless steel. J. Phys. Conf. Ser. 2020, 1492, 012025. [Google Scholar] [CrossRef]
  18. Vattikuti, S.P.; Prasad, P.R.; Aljuwayid, A.M.; Rosaiah, P.; Sudhani, H.P.; Shim, J. Enhanced solar light-induced performance of a step-scheme heterojunction nanostructure (C3N4/ZrO2) for mixed dye degradation and methanol oxidation. Mater. Sci. Semicond. Process. 2024, 177, 108342. [Google Scholar] [CrossRef]
  19. Li, J.; Zhang, Z.; Guo, Z.; Yang, Z.; Qian, W.; Chen, Y.; Li, H.; Zhao, Q.; Xing, Y.; Zhao, Y. Improved corrosion resistance of ZrO2/MgO coating for magnesium alloys by manipulating the pore structure. J. Mater. Res. Technol. 2023, 24, 2403–2415. [Google Scholar] [CrossRef]
  20. Zhu, H.; Huang, J.; Gong, Y.; Zhao, D.; Zhang, H.; Chen, D.; Wang, M.; Wang, H. Insight into continuous growth mechanisms of ZrO2-Al2O3 composite PEO coatings with superior cavitation erosion resistance. Surf. Coat. Technol. 2024, 477, 130355. [Google Scholar] [CrossRef]
  21. Zhao, T.; Wang, L.; Zhang, S.; Zhang, C.H.; Sun, X.Y.; Chen, H.T.; Bai, X.L.; Wu, C.L. Effect of synergistic cavitation erosion-corrosion on cavitation damage of CoCrFeNiMn high entropy alloy layer by laser cladding. Surf. Coat. Technol. 2023, 472, 129940. [Google Scholar] [CrossRef]
  22. Park, J.M.; Moon, J.; Bae, J.W.; Jang, M.J.; Park, J.; Lee, S.; Kim, H.S. Strain rate effects of dynamic compressive deformation on mechanical properties and microstructure of CoCrFeMnNi high-entropy alloy. Mater. Sci. Eng. A 2018, 719, 155–163. [Google Scholar] [CrossRef]
  23. Luo, C.; Gu, J. Surface Properties and Cavitation Erosion Resistance of Cast Iron Subjected to Laser Cavitation Treatment. Metals 2023, 13, 1793. [Google Scholar] [CrossRef]
  24. Peshkovsky, S.L.; Peshkovsky, A.S. Shock-wave model of acoustic cavitation. Ultrason. Sonochem 2008, 15, 618–628. [Google Scholar] [CrossRef]
  25. Garen, W.; Hegedűs, F.; Kai, Y.; Koch, S.; Meyerer, B.; Neu, W.; Teubner, U. Shock wave emission during the collapse of cavitation bubbles. Shock. Waves 2016, 26, 385–394. [Google Scholar] [CrossRef]
  26. Zhang, Q.; Wang, Q.; Han, B.; Li, M.; Hu, C.; Wang, J. Comparative studies on microstructure and properties of CoCrFeMnNi high entropy alloy coatings fabricated by high-speed laser cladding and normal laser cladding. J. Alloys Compd. 2023, 947, 169517. [Google Scholar] [CrossRef]
  27. Li, H.; Huang, Y.; Sun, J.; Lu, Y. The relationship between thermo-mechanical history, microstructure and mechanical properties in additively manufactured CoCrFeMnNi high entropy alloy. J. Mater. Sci. Technol. 2021, 77, 187–195. [Google Scholar] [CrossRef]
  28. Nguyen, T.; Huang, M.; Li, H.; Tran, V.; Yang, S. Microstructure and tensile properties of duplex phase Al0.25FeMnNiCrCu0.5 high entropy alloy fabricated by laser melting deposition. J. Alloys Compd. 2021, 871, 159521. [Google Scholar] [CrossRef]
  29. Zhang, K.; Wang, W.; Liu, W.; Liu, C.; Geng, J.; Wang, H.; Bian, H. Effect of Sm2O3 particles on microstructure and properties of FeCoNiCrMn composite coating by laser cladding. Mater. Chem. Phys. 2024, 317, 129168. [Google Scholar] [CrossRef]
  30. Kwok, C.T.; Man, H.C.; Cheng, F.T.; Lo, K.H. Developments in laser-based surface engineering processes: With particular reference to protection against cavitation erosion. Surf. Coat. Technol. 2016, 291, 189–204. [Google Scholar] [CrossRef]
  31. Yu, D.T.; Zhao, T.; Wu, C.L.; Zhang, S.; Zhang, C.H.; Chen, H.T.; Wang, R. Effects of W element on the microstructure, wear and cavitation erosion behavior of CoCrFeNiMnW high entropy alloy coatings by laser cladding. Mater. Chem. Phys. 2024, 323, 129630. [Google Scholar] [CrossRef]
  32. Heathcock, C.J.; Ball, A.; Protheroe, B.E. Cavitation erosion of cobalt-based Stellite® alloys, cemented carbides and surface-treated low alloy steels. Wear 1981, 74, 11–26. [Google Scholar] [CrossRef]
Figure 1. SEM images of the hybrid powders and their corresponding energy spectral surface distribution:(a) SEM image of the hybrid powders, (b) distribution of six elements (c) distribution of Co element, (d) distribution of Cr element, (e) distribution of Ni element, (f) distribution of Mn element, (g) distribution of Fe element, (h) distribution of Zr element.
Coatings 14 01235 g001
Figure 2. Schematic diagram of laser cladding system.
Coatings 14 01235 g002
Figure 3. Schematic illustration of ultrasonication set-up used for cavitation erosion.
Coatings 14 01235 g003
Figure 4. Schematic illustration of finite element model; (a) 3D model; (b) 2D model.
Coatings 14 01235 g004
Figure 5. XRD pattern and local magnification of S1–S5.
Coatings 14 01235 g005
Figure 6. Macroscopic morphology after laser cladding: (a) S1; (b) S2; (c) S3; (d) S4; and (e) S5.
Coatings 14 01235 g006
Figure 7. (a) BSE image of coatings and substrate, (b) Local magnification of pores.
Coatings 14 01235 g007
Figure 8. SEM image of HEAs: (a) S1; (b) S2; (c) S3; (d) S4; (e) and S5.
Coatings 14 01235 g008
Figure 9. Maps of elements distribution and EDS analysis of S2 by SEM area scan: (a) SEM image of CoCrFeMnNi-1%ZrO2; (b) distribution of Cr element; (c) distribution of Fe element; (d) distribution of Mn element; (e) distribution of Co element; and (f) distribution of Zr element.
Coatings 14 01235 g009
Figure 10. (a) SEM of area A in Figure 9a; (b) distribution of Zr element; and (c) EDS of area A.
Coatings 14 01235 g010
Figure 11. (a) Average microhardness of the substrate and coatings. (b) Microhardness distribution of the coatings.
Coatings 14 01235 g011
Figure 12. (a) CE cumulative volume loss as and (b) MDER results for substrates S1, S2, S3, S4, and S5 after 10 h CE in the deionized water.
Coatings 14 01235 g012
Figure 13. Cavitation erosion morphologies of substrate and HEACs after 1 h and 10 h: (a1,a2) 0Cr13Ni5Mo; (b1,b2) S1; (c1,c2) S2; (d1,d2) S3; (e1,e2) S4; and (f1,f2) S5. (a1f1) 1 h cavitation erosion; (a2f2) 10 h cavitation erosion.
Coatings 14 01235 g013
Figure 14. Three-dimensional images of cavitation erosion morphologies of HEACs: (a) 0Cr13Ni5Mo; (b) S1; (c) S2; (d) S3; (e) S4; and (f) S5.
Coatings 14 01235 g014
Figure 15. (a) Displacement variation of S1–S5 3D model and (b) S1–S5 maximum deformation and average deformation.
Coatings 14 01235 g015
Figure 16. S22 stress distribution of 2D model: (a) S1; (b) S2; (c) S3; (d) S4; and (e) S5.
Coatings 14 01235 g016
Table 1. Laser cladding process parameters.
ParameterValues
SampleCoCrFeMnNi-xZrO2
Laser power (W)4200
Scanning velocity (mm/s)25
Spot diameter (mm)5
Power feed rate (g/min)36
Protective gas flow rate (L/min)10
Overlap rate (%)71.4%
Focal length (mm)18
Table 2. Chemical composition (wt.% and at.%) of HEA-xZrO2 coatings.
Coating SamplesFeCrNiMnCoZr
wt.%at.%wt.%at.%wt.%at.%wt.%at.%wt.%at.%wt.%at.%
S123.7923.8818.2219.6119.9519.0518.5318.8819.5118.55\
S222.6522.6118.1919.6820.0619.2318.7819.2319.9219.070.400.18
S322.9922.3717.8119.6218.8418.3918.7319.5319.8019.241.830.85
S423.4722.9617.4719.3518.5018.1518.5319.4219.2718.832.761.29
S524.8524.8517.6719.8917.2217.1816.6817.7717.8317.715.752.73
Disclaimer/Publisher’s Note: The statements, opinions and data contained in all publications are solely those of the individual author(s) and contributor(s) and not of MDPI and/or the editor(s). MDPI and/or the editor(s) disclaim responsibility for any injury to people or property resulting from any ideas, methods, instructions or products referred to in the content.

