Article

Experimental Investigation of Corrosion Behavior of Zinc–Aluminum Alloy-Coated High-Strength Steel Wires under Stress Condition

1
Luoyang Ship Material Research Institute, Luoyang 471023, China
2
State Key Laboratory for Marine Corrosion and Protection, Luoyang 471023, China
3
School of Safety Engineering and Emergency Management, Shijiazhuang Tiedao University, Shijiazhuang 050043, China
*
Author to whom correspondence should be addressed.
Coatings 2024, 14(7), 890; https://doi.org/10.3390/coatings14070890
Submission received: 22 May 2024 / Revised: 21 June 2024 / Accepted: 28 June 2024 / Published: 17 July 2024
(This article belongs to the Special Issue Micro- and Nano- Mechanical Testing of Coatings and Surfaces)

Abstract

:
To cope with harsh working conditions, new corrosion-resistant coated steel wires with higher tensile strength have been developed. This study investigates the corrosion characteristics of a new zinc–aluminum alloy-coated steel wire under stress conditions. The particulate corrosion products generated by the oxidation of the coating in the initial stage of corrosion are converted into layer-structured corrosion products at the early stage of corrosion. Moreover, high-stress conditions have a significant influence on the critical conversion time from the coating corrosion stage to the iron matrix corrosion stage. Thus, the uniform corrosion depth (i.e., the mass loss rate) could be fitted with a continuous power function model rather than the previously used two-stage model owing to an ambiguous moment of conversion under stress conditions. The pitting corrosion depth could be fitted with a lognormal distribution in this study. The probability distributions for the aspect ratios of corrosion pits under different stress conditions tended to be consistent. Finally, the block’s maximum pitting factor followed a Gumbel distribution with a scale parameter that changed linearly with the stress level and a location parameter related to the square of the stress level.

1. Introduction

High-strength steel wires are the most widely used materials for the cables of long-span cable-supported bridges owing to their excellent mechanical properties and corrosion protection behavior [1,2]. With recently increasing requirements for longer spans in bridges, particularly for suspension bridges and cable-stayed bridges, high-performance bridge wires have been developed and manufactured to provide cables with better corrosion resistance and higher capacity [3,4]. The improvement in the anti-corrosion performance of high-strength steel wire mainly relies on new type of zinc–aluminum alloy coating because aluminum has a higher activity than zinc, which forms a denser passivation film on the coating surface to slow down the corrosion rate of the base metal [5]. The aluminum content is generally between 5% and 10%, and a small amount of rare earth elements (such as Ce, La, etc.) are added, which is called Galfan material. Its corrosion resistance is better than that of galvanic coating [6]. Technical procedures including cold drawing, zinc–aluminum alloy hot-dip plating, and stabilization treatment for high-strength steel wire have also been developed [7]. In particular, the hot-dip plating technique employs an innovative double plating method, which controls the hot-plating temperature between 430 and 460 °C and ensures the adhesion and uniformity of the coating [8,9].
In addition to the improved performance of the anti-corrosion coating, high-strength steel wires with ultra-high yield and tensile properties have also been developed. Currently, the tensile strength of high-strength steel wires used in newly-built large-span bridges exceeds 2000 MPa [10]. These ultra-high-strength steel wires are used to produce cables for long-span bridges, such as the Nizhou Waterway Bridge, with a main span of 1688 m, and the Hutong Railway Yangtze River Bridge, with a main span of 1092 m [11,12].
The performance improvement is mainly achieved through the cold drawing of hypereutectoid steel, which improves the microstructure of pearlite and increases the number of grain interfaces (ferrite cementite phase interfaces), making it necessary to overcome greater resistance when dislocation motion occurs and reflecting in the improvement in tensile strength at the macro level [13,14]. Alloy elements play a significant role in high-strength impedance. The increased carbon (C) element can contribute to the percentage content of high-strength cementite. The addition of chromium (Cr) element and silicon (Si) can effectively improve the spacing between flakes and solid solution hardening, respectively [15]. Increasing the Si content can reduce the strength loss of high-strength steel wires during cold drawing, and the addition of Cr can further prevent strength loss. The Si element is concentrated at the interface between ferrite and cementite, while the Cr element is concentrated in the cementite. Due to the fact that the spheroidization of cementite requires the diffusion of Si at the interface, an increase in Si content is believed to reduce the spheroidization rate of cementite and suppress strength loss. In the case of high-strength steel wire, the addition of Si and Cr is believed to maintain a layered structure in the microstructure even during the hot-dip coating periods, which means that the steel wire will not experience strength loss [16]. The presence of vanadium (V) element can accelerate precipitation hardening and is beneficial for improving the strength of ferrite [17].
Studies on metal corrosion have been widely conducted for reinforced concrete structures [18,19], pipeline systems [20,21], offshore structures [22], aircraft structures [23,24], and long-span bridges [25]. The corrosion behaviors of various materials such as carbon steel, stainless steel, aluminum and aluminum alloys, and high-strength steel may vary widely for a specific environment [26]. High-strength steel wires are naturally subjected to an environment with high humidity and corrosive solutions containing chloride ions [27]. In addition, steel wires maintain a static working stress under tension, which can easily lead to stress corrosion cracking (SCC), corrosion fatigue, and eventual cable failure [28]. For the purpose of corrosion protection and monitoring, electrochemical methods are used to investigate the factors affecting the pitting corrosion nucleation, corrosion pit evolution, and pit-to-fatigue-crack transformation of high-strength steel wires [29,30,31]. For practical applications, time-dependent corrosion behavior indicators such as the mass loss rate, uniform corrosion depth, block maximum pitting factor, aspect ratio, and pit volume and density are modeled and statistically analyzed [32,33,34] to predict the effect of corrosion on the mechanical properties and fatigue failure of high-strength steel wires and cables [35,36]. Several studies [37,38,39] have investigated the corrosion characteristics of steel bars in prestressed reinforced concrete components and structures. However, a limited number of studies have addressed the corrosion characteristics of bridge wires under stress conditions. Betti et al. [40] studied the effect of corrosion on the mechanical properties of 1700 MPa galvanized and ungalvanized steel wires under different sustained loads using artificial accelerated corrosion experiments. Yang et al. [41] reported the corrosion behavior of 1570 MPa zinc-coated high-strength steel wire under four different tensile stress conditions in simulated acid rain. The relationship between the mechanical properties of the steel and corrosion was investigated and validated with finite element simulations and microscopic observations. At present, research on the corrosion behavior of 1960 MPa high-strength steel wire with a zinc–aluminum alloy coating under stress conditions has rarely been reported.
The contents of this paper are organized as follows. Section 2 presents the artificial accelerated corrosion experiments. In Section 3, the microscopic observation results for the coating of steel wire specimens are presented. The corrosion evolution kinetics of high-strength steel wires are also explored based on the uniform corrosion depth, and the effect of the preloading stress on the dimensional parameters of corrosion pits is studied using statistical analysis. Finally, some conclusions are drawn in Section 4.

2. Materials and Methods

2.1. Materials

A new type of 1960 MPa high-strength steel wire specimen manufactured by the Jiangyin Walsin Steel Cable Co., Ltd. (Jiangyin, China) with a zinc–aluminum alloy coating with diameter of 5 mm and length of 150 mm is employed for the artificial accelerated corrosion experiments. The mechanical properties of the steel wire specimens are listed in Table 1.
The application of novel chemical element contents and advanced processing methods has greatly improved the corrosion resistance and mechanical properties of steel wires. By increasing the carbon and manganese content, mechanical properties such as the ultimate strength of the steel wire can be improved [42]. The chemical composition of the 1960 MPa high-strength steel wire is presented in Table 2.

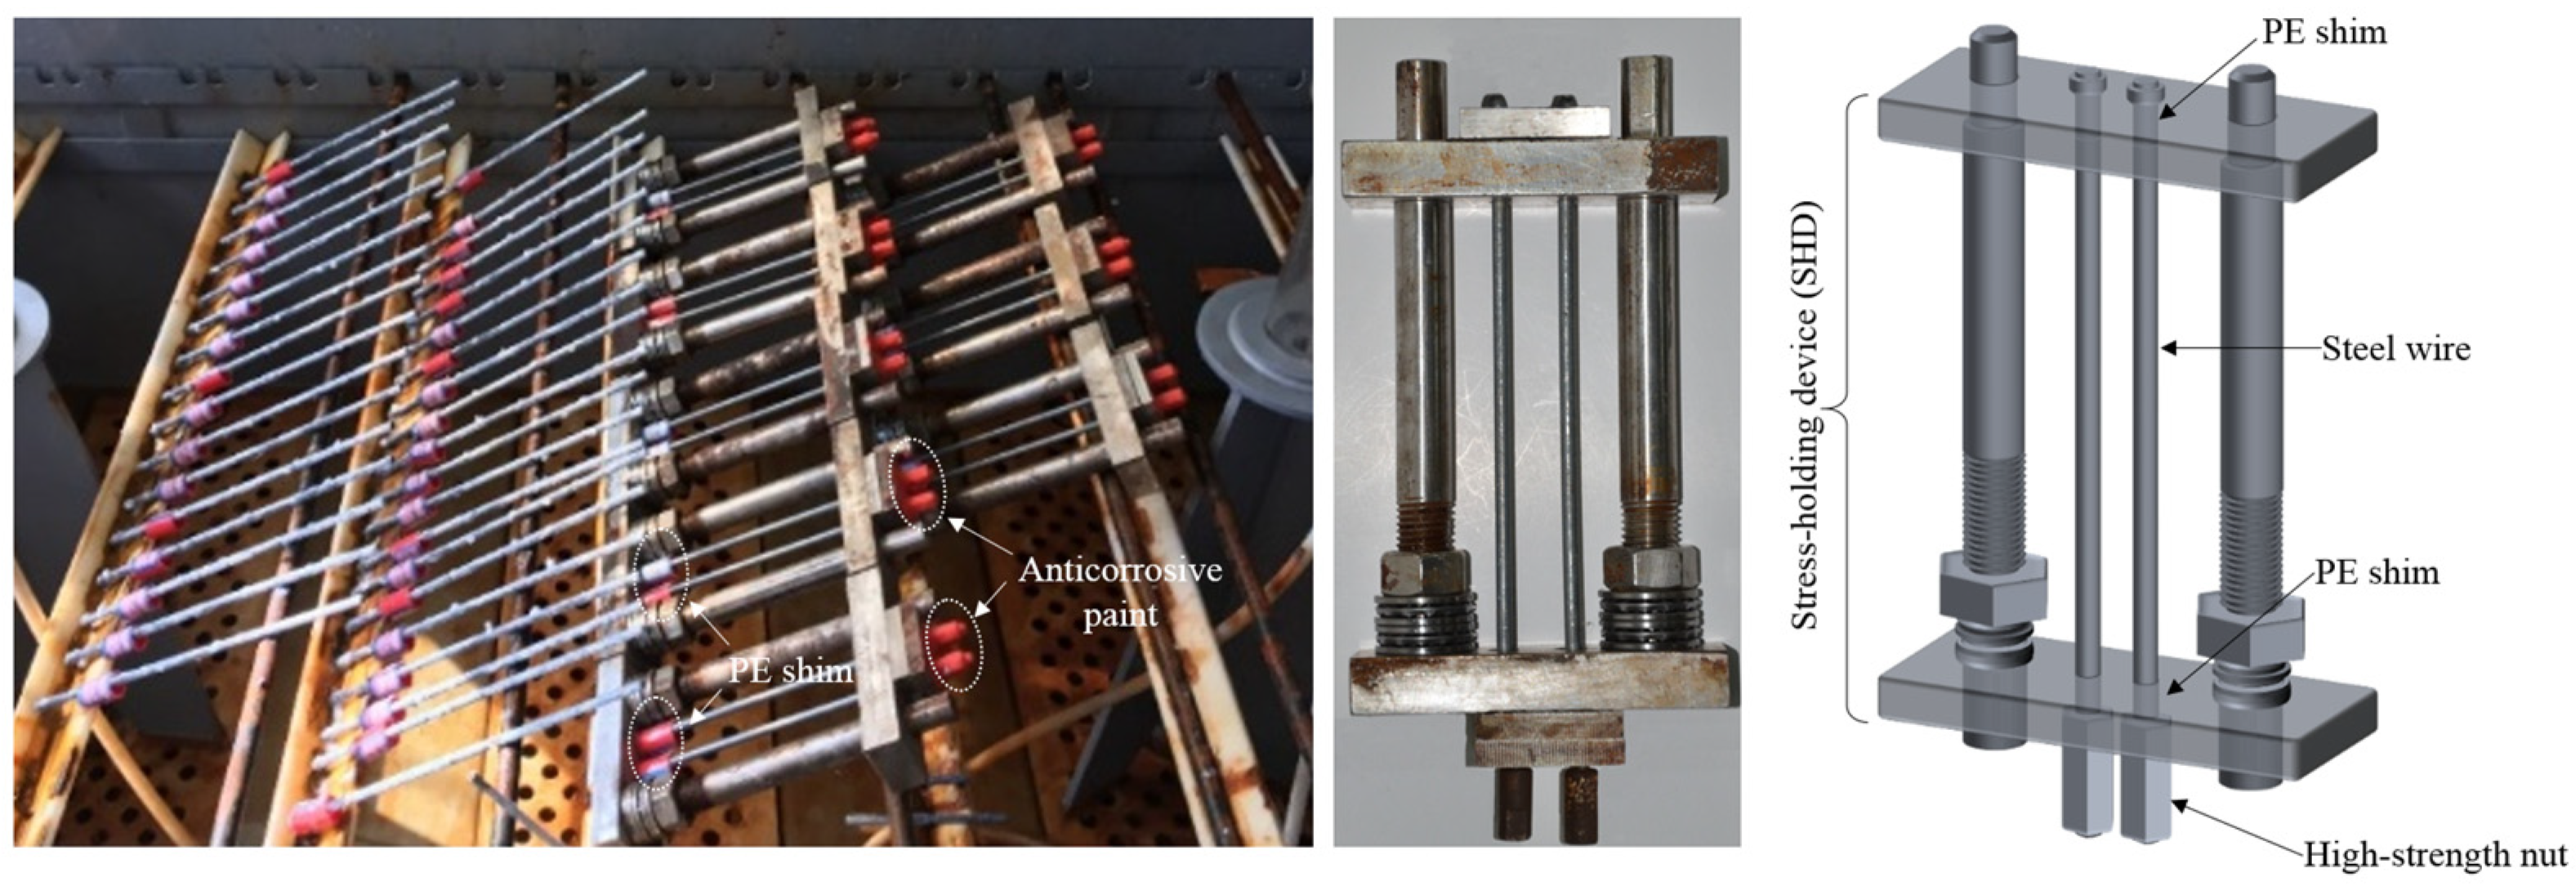
2.2. Artificial Accelerated Corrosion Test Setup

Artificial accelerated corrosion tests were conducted using a salt spray test chamber (Model YWX/Q-016B, Jiangsu AMS Test Instrument Technology Co., Ltd., Changzhou, China) with an internal size of 1600 mm × 850 mm × 600 mm, as shown in Figure 1. The experiments were carried out in accordance with the ISO 9227 standard [43], which is widely used to simulate corrosive marine environments. The specific experimental parameters were as follows: a temperature of 35 °C ± 2 °C, 95% humidity, and pH values of 3.1–3.2 adjusted by glacial acetic acid of analytical grade. The corrosive solution was prepared using a 0.025 wt.% copper chloride and 5.00 wt.% sodium chloride solution. The salt spray settlement was set to 1–2 mL/(80 cm2·h).
Six different exposure days (2, 3, 7, 15, 20, and 40 d) and four tensile stress conditions (0, 500, 750, and 1000 MPa) were used in the experiments, resulting in a total of 24 different exposure time and stress condition combinations. For each case, 4 steel wire specimens with a length of 250 mm were tested for a total of 96 experimental specimens.

2.3. Preloading Procedure for High-Strength Steel Wire Specimens

In order to apply tensile stress to the specimen effectively, pre-processing of the specimen is required. One end of the specimen is machined into a thread that is partnered with high-strength nuts. Thus, the stress can be maintained with the high-strength nuts. The other end of the specimen is squeezed into a pier head. The pier head should satisfy the following requirements: (1) the pier head is drumstick shaped, and the maximum outer diameter is 1.5 ± 0.1 times the diameter of the specimen, i.e., 8.25 ± 0.55 mm in the experiment; (2) there should be no transverse cracks on the surface or inside of the pier head; and (3) the capacity force of the pier head should be no less than 95% of the ultimate strength of the steel wire specimen.
The preloading stress of the steel wire specimen is maintained with a stress-holding device (SHD) throughout the experiment, as shown in Figure 1. A tensile force is applied by the counterforce frame. The SHD with a steel wire specimen is installed on the counterforce frame and stretched with the lifting jack. The real-time strain is monitored throughout the preloading procedure with electronic extensometers and an acquisition device; the system can measure a strain range of 105 με with a precision of 20 με. The electronic extensometers are fixed on the specimen.
The preloading procedure is as follows: (1) the steel wire specimens are assembled on the SHD; (2) electronic extensometers are fixed to the specimens; (3) a stress of 1.05 times the target tensile stress is applied to the SHD through the counterforce frame by the lifting jacks; (4) the high-strength nuts of the SHD are tightened, and the lifting jacks are unloaded; and (5) owing to stress loss during the unloading process, steps (3) and (4) are repeated until the target value is achieved.

2.4. Measurement of Pitting Corrosion

Owing to the cylindrical surface of the high-strength steel wire specimens, it is difficult to measure the surface pitting corrosion depth directly. Therefore, a high-precision line-scan mechanical probe contact surface roughness profiler (Model JB-5C, manufactured by Shanghai Tai Ming Optical Instrument, Shanghai, China) was used to measure the surface pitting corrosion on the specimens, as shown in Figure 2.
The instrument measures the pitting corrosion depth at intervals of 1 μm along the longitudinal direction of the specimens, and the measurements are accurate to 1 μm. The instrument can only measure a length of 100 mm along a straight line at one time. Therefore, an artificial rotation of the specimens is required to measure all of the pitting corrosion on the specimen surface. In this study, the specimen is rotated at intervals of 6°, and measurements are recorded for every rotation. Thus, the specimen surface is measured 60 times in the circumferential direction, resulting in a total of 6,000,000 measurement points for each specimen.

3. Results and Discussion

Corrosion products attached to the surface of the high-strength steel wire specimens have different colors owing to the different corrosion behaviors of the zinc–aluminum alloy coating and the iron matrix, as shown in Figure 3; the oxidation products of the zinc–aluminum coating and the iron matrix appear as a white powder and as dark red, respectively. In addition, the color of the corrosion products deepens with increasing exposure time. After the steel wire specimens are removed from the chamber, a cleaning procedure can be performed on the surface corrosion products in accordance with the ASTM G1-03 standard [44]. A comparison of steel wire specimens with different stress conditions before and after the removal of corrosion products is shown in Figure 3. It can be clearly seen in Figure 3 that pitting corrosion is much more severe under high-stress conditions.

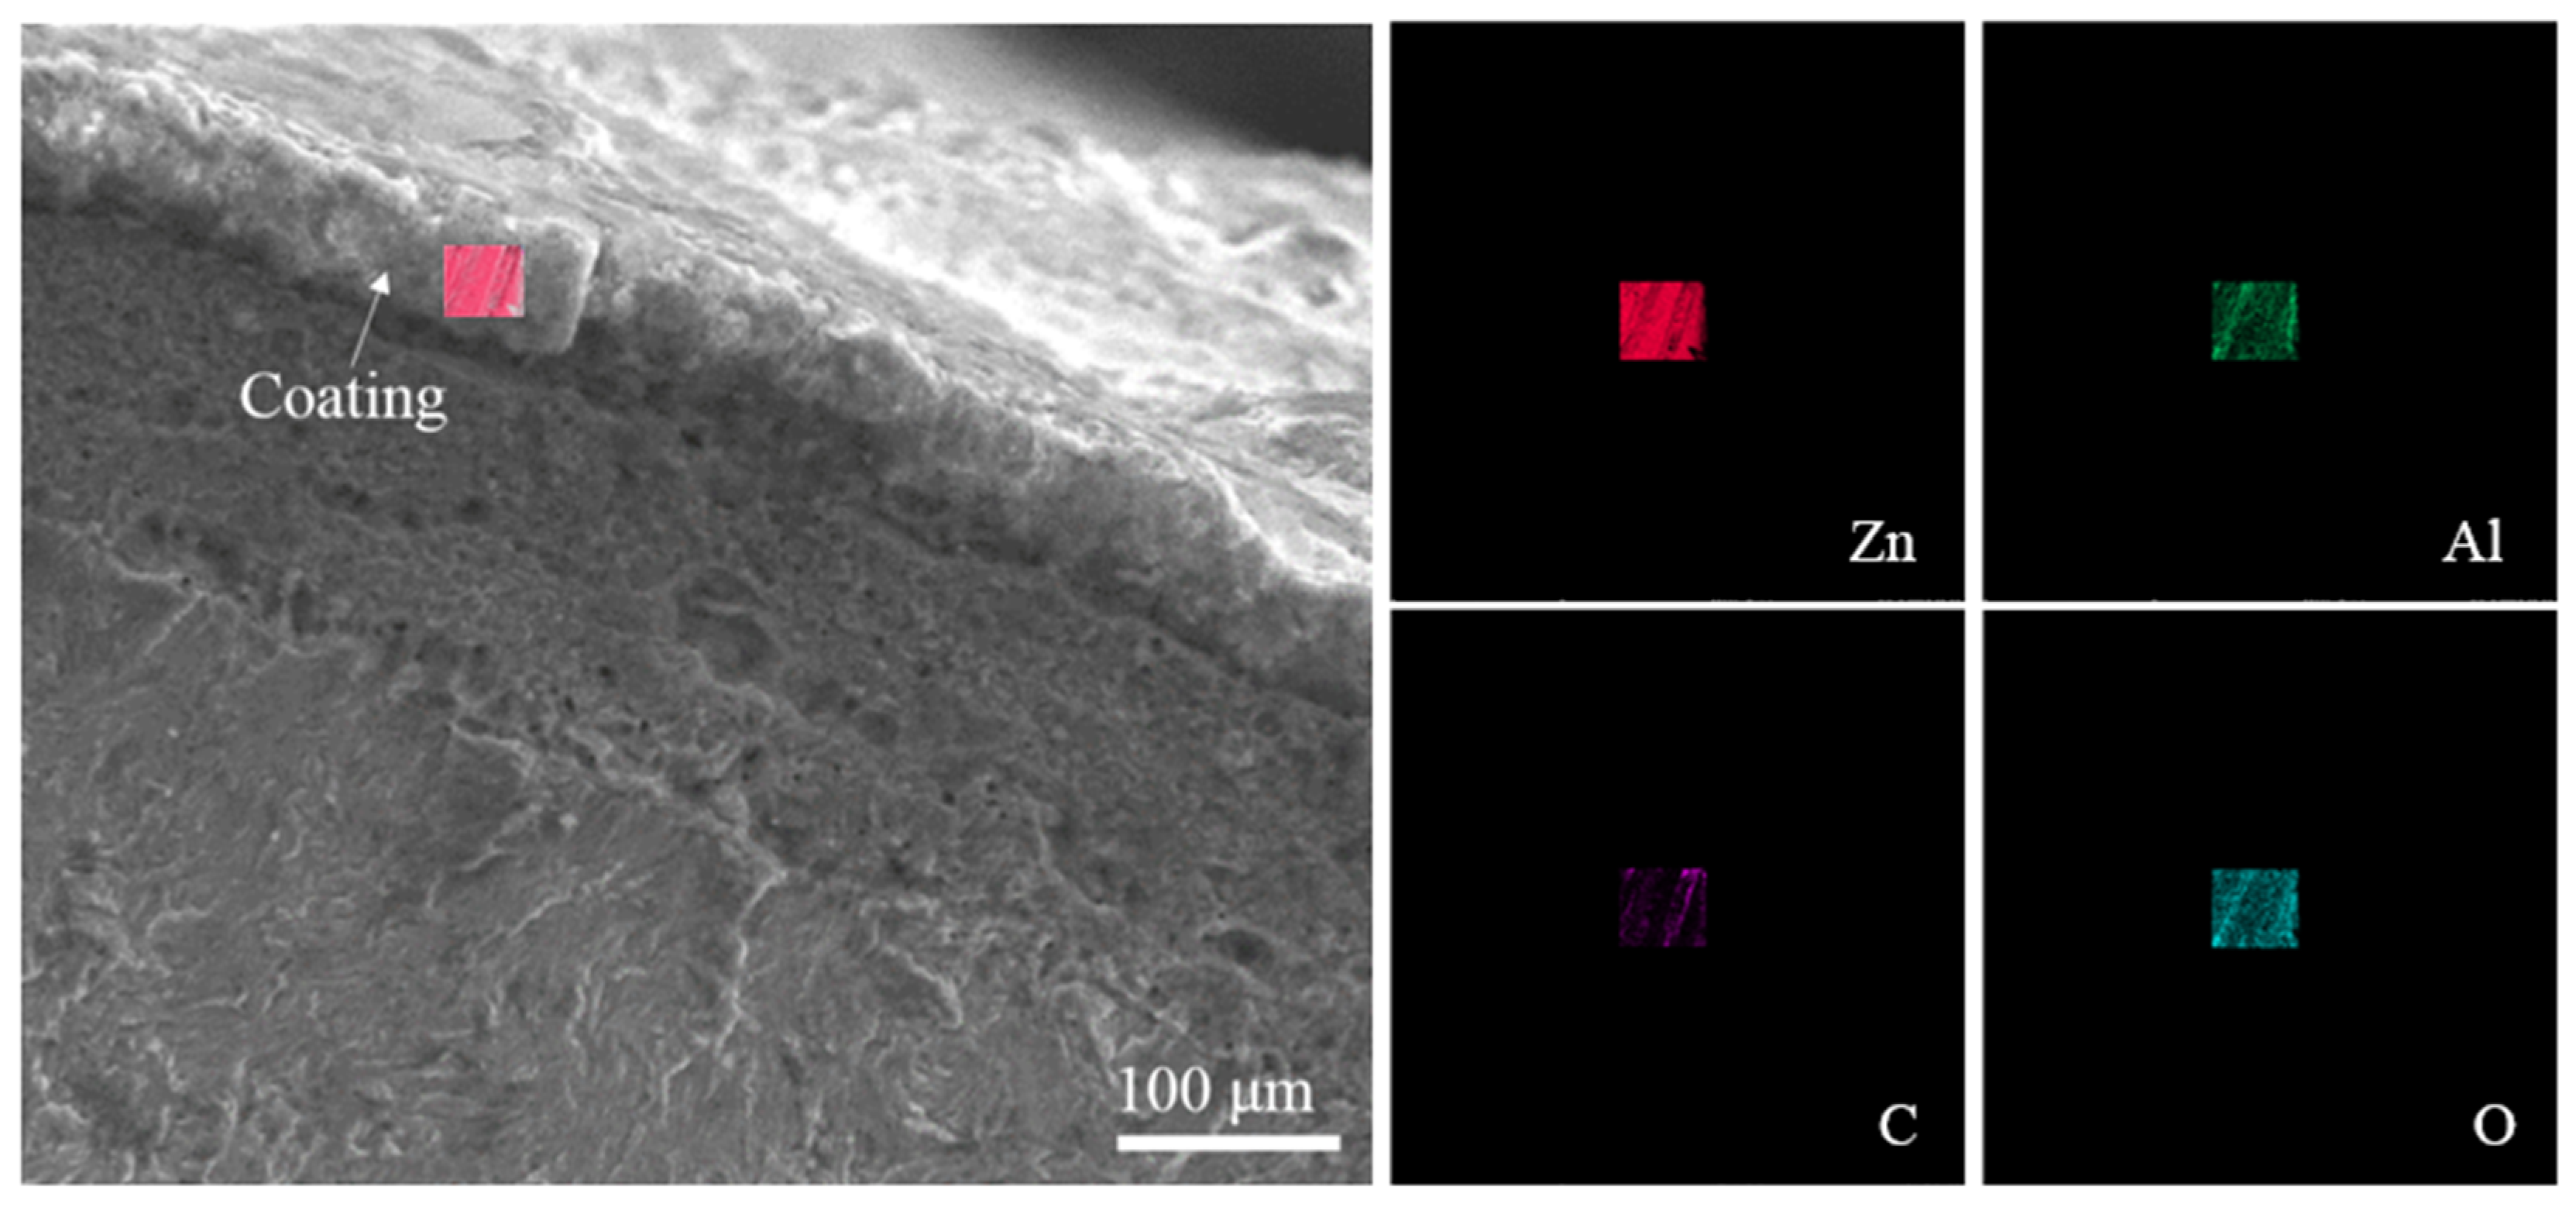
3.1. Microscopic Observation

It can be seen from Figure 4 that the thickness of the coating is approximately 75 μm. According to the region scanning results using an energy-dispersive spectrometer (EDS), shown in Figure 4, the proportion of zinc and aluminum in the zinc–aluminum alloy coating is approximately 95% and 5%, respectively.

3.2. Corrosion Evolution Kinetics

The uniform corrosion depth is widely used to describe corrosion evolution kinetics [45,46], as it describes the overall average corrosion condition of the specimen, rather than focusing on localized corrosion phenomena such as pitting. In calculating the uniform corrosion depth of the steel wire specimens, the error caused by the corrosion product removal process should be considered. The corrosion products on the surface of the steel wire specimens are removed immediately at the end of the experiment. In addition, new specimens are prepared and tested under the same conditions as the control group to eliminate the aforementioned error. The uniform corrosion depth can be calculated as follows:
d u ( t ) = m 0 m Δ m R ρ π L D = D 4 w
where the subscript “u” represents the uniform corrosion; m0 is the original mass of the specimen; m is the mass of the specimen after removal of the corrosion products; ΔmR is the mass loss due to pickling, where Δ m R = 1 n i = 1 n m R 0 i m R i , in which n is the number of new specimens, m R 0 i denotes the original mass of the i-th specimen in the control group, and m R i represents the mass after pickling of the i-th specimen in the control group; ρ is the mass density of the specimen; L is the length of specimen; D is the diameter of the specimen; and w means the mass loss rate.

3.2.1. Non-Stressed Condition

The corrosion behavior of high-strength steel wire specimens is a complex electrochemical process. Moreover, there is a significant difference between the coating corrosion and the corrosion of the iron matrix due to the differences in their material properties. Thus, a two-stage model [47] is suitable to describe the corrosion process, as described by the following equation and shown in Figure 5.
d u t = d u , coat t = ψ 1 t γ 1 0 t t c d u , coat t c + d u , Fe t t c = ψ 1 t c γ 1 + ψ 2 t t c γ 2 t > t c
where du(t) is the uniform corrosion depth of the specimen at exposure time t, tc is the critical time at which the coating is completely consumed, du,coat(t) refers to the time-dependent uniform corrosion depth of the coating, du,Fe(t) is the time-dependent uniform corrosion depth of the iron matrix, ψ1 and γ1 are model parameters for the coating corrosion, and ψ2 and γ2 are model parameters for the iron matrix corrosion.
Figure 6 shows the uniform corrosion depth of zinc-coated [47,48] and zinc–aluminum alloy-coated steel wires under non-stressed conditions. It can be seen from Figure 6 that the thickness of the zinc–aluminum alloy coating (~50 μm) is greater than that of the zinc coating (~33 μm). However, the corrosion rate exhibits the opposite situation, i.e., 2.55 μm/d, with 4.90 μm/d1.024 and 3.32 μm/d0.996 for the zinc coating and zinc–aluminum alloy coating, respectively, owing to the excellent corrosion-resistance performance of the zinc–aluminum alloy coating. Once the coatings are completely consumed, the corrosion rates for the iron matrices of the two types of specimens are ~0.5 μm/d, which is far smaller than that of the coating.

3.2.2. Stress Condition

The uniform corrosion depth (i.e., the mass loss rate) is used to describe the average corrosion rate in the steel wire specimens, as shown in Figure 7 for bridge steel wires and mild steel with different exposure times. The corrosion rate of mild steel is relatively low in low-concentration hydrochloric acid (HCl) solutions (i.e., 0.00001 M and 0.003 M), while the corrosion rate under 1 M HCl solution conditions [49] is comparable to that under stressed conditions in this paper. Furthermore, Hong et al. [50] lists the time-varying corrosion rate of high-strength steel wires for suspension bridge cables under four pre-strain conditions in a 3.5% NaCl solution and 1A current. The corrosion rate obtained under corrosive solutions and current conditions is much higher than that under artificial salt spray conditions. And the corrosion rates under stress conditions are always higher than those under non-stressed conditions, which is consistent with the experimental results in this paper.
It can also be observed from Figure 7 that the critical time indicating the conversion from coating corrosion to corrosion of the iron matrix is invisible. In this case, the two-stage model has difficulty accurately describing the pitting corrosion behavior of specimens under stress conditions. Thus, a continuous power model is introduced to describe the time-dependent uniform corrosion depth, which can be expressed as follows:
d u t = ψ t t γ t t > 0 , σ s > 0
where ψt and γt are power model parameters, and σs is the preloading stress of the steel wires, defined as 500 MPa, 750 MPa, and 1000 MPa in this study.
Figure 8 shows the change in uniform corrosion depth with different stress conditions.
It can be seen from Figure 8 that the preloading stress affects the uniform corrosion depth linearly. Because the stress imposed on the specimens is smaller than the yield strength, the material properties of the high-strength steel wire are in the linear elastic stage. For a certain corrosion time, the effect of the preloading stress on the uniform corrosion depth is in accordance with the linear model. Thus, the uniform corrosion depth considering the corrosion time and stress condition can be generated from the experimental results as follows:
d u t , η = ψ η t γ t > 0 , η > 0
where du is the uniform corrosion depth; η is the normalized stress, where η = σsy; σy is the yield strength, which is σy = 1750 MPa in this study; and ψ and γ are parameters, where ψ = 38.55 and γ = 0.498 for the 1960 MPa zinc–aluminum alloy-coated high-strength steel wire in this study.
The measured data and fitting results for the uniform corrosion depth are shown in Figure 9.

3.3. Statistical Characteristics of Pitting Corrosion

For a specimen with an exposure time of 40 d and stress condition of 750 MPa at 0°, the measurement data and contour plot are shown in Figure 10.
The corrosion pits are modeled as semi-ellipsoids in this study, as shown in Figure 11, based on their actual geometric characteristics. In Figure 11, parameters a and b refer to the axis lengths of the ellipse projected on the surface of the steel wire specimen. The corrosion pit depth, hmax, is defined as the maximum value within the corrosion pit region.
The contour plot and fitted ellipse results for pitting corrosion are shown in Figure 12.

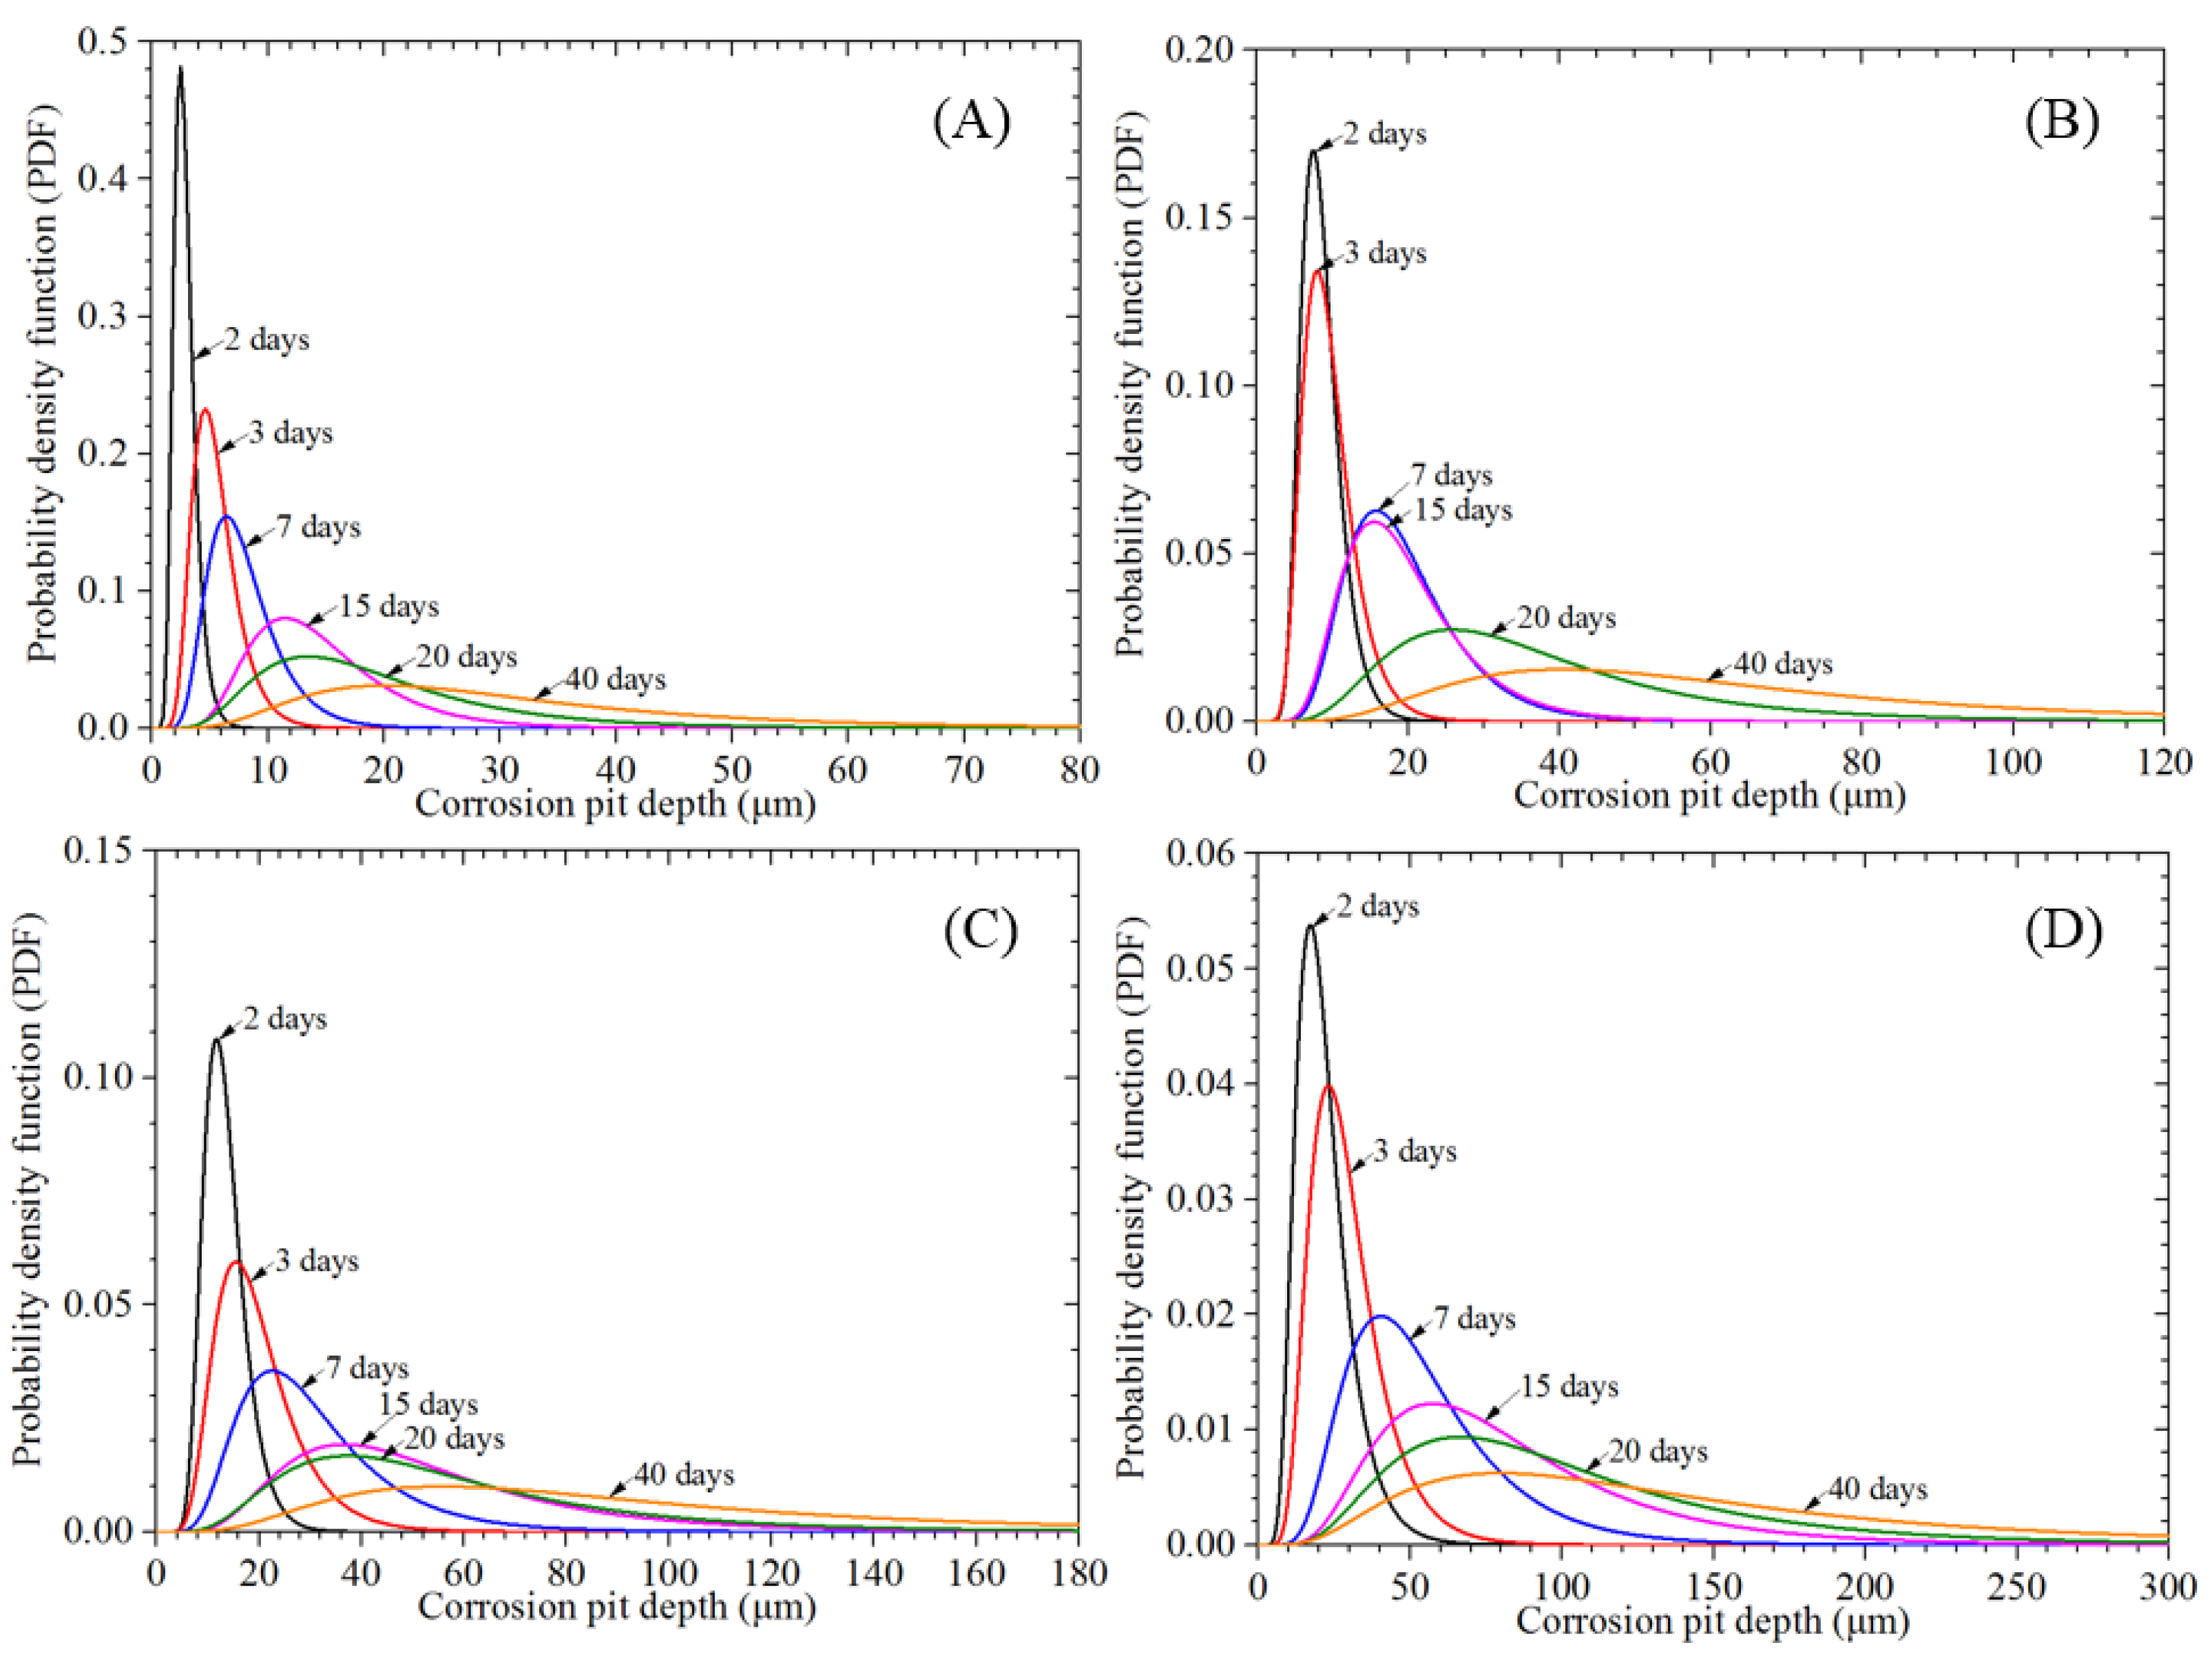
3.3.1. Corrosion Pit Depth

The pitting corrosion depth can significantly affect the stress distribution along the steel wires, resulting in stress concentration and SCC. Thus, the corrosion pit depth has been statistically investigated in pipeline systems, reinforced concrete structures, and stayed cables in numerous studies, which have employed totally different probabilistic models for fitting [22,33]. A lognormal distribution is usually employed to fit the corrosion pit depth for specimens produced in artificial accelerated spray corrosion experiments, which can be formulated as follows:
f x μ , σ = 1 2 σ exp ln x μ 2 2 σ 2 x > 0
where μ is the time-dependent location parameter, and σ is the scale parameter.
The Anderson–Darling test does not reject the lognormal distribution for the corrosion pit depth based on the statistical results, which are plotted in Figure 13.
It can be seen from Figure 13 that the corrosion pits in specimens with longer exposure times are much deeper than those in specimens that experienced a shorter corrosion time under the same stress condition. In addition, the variability in the corrosion pit depth increases with corrosion time. The corrosion pit depth also increases at the same corrosion time with increasing preloading stress, which has a smaller effect on the variability in the pitting corrosion depth than the corrosion time.

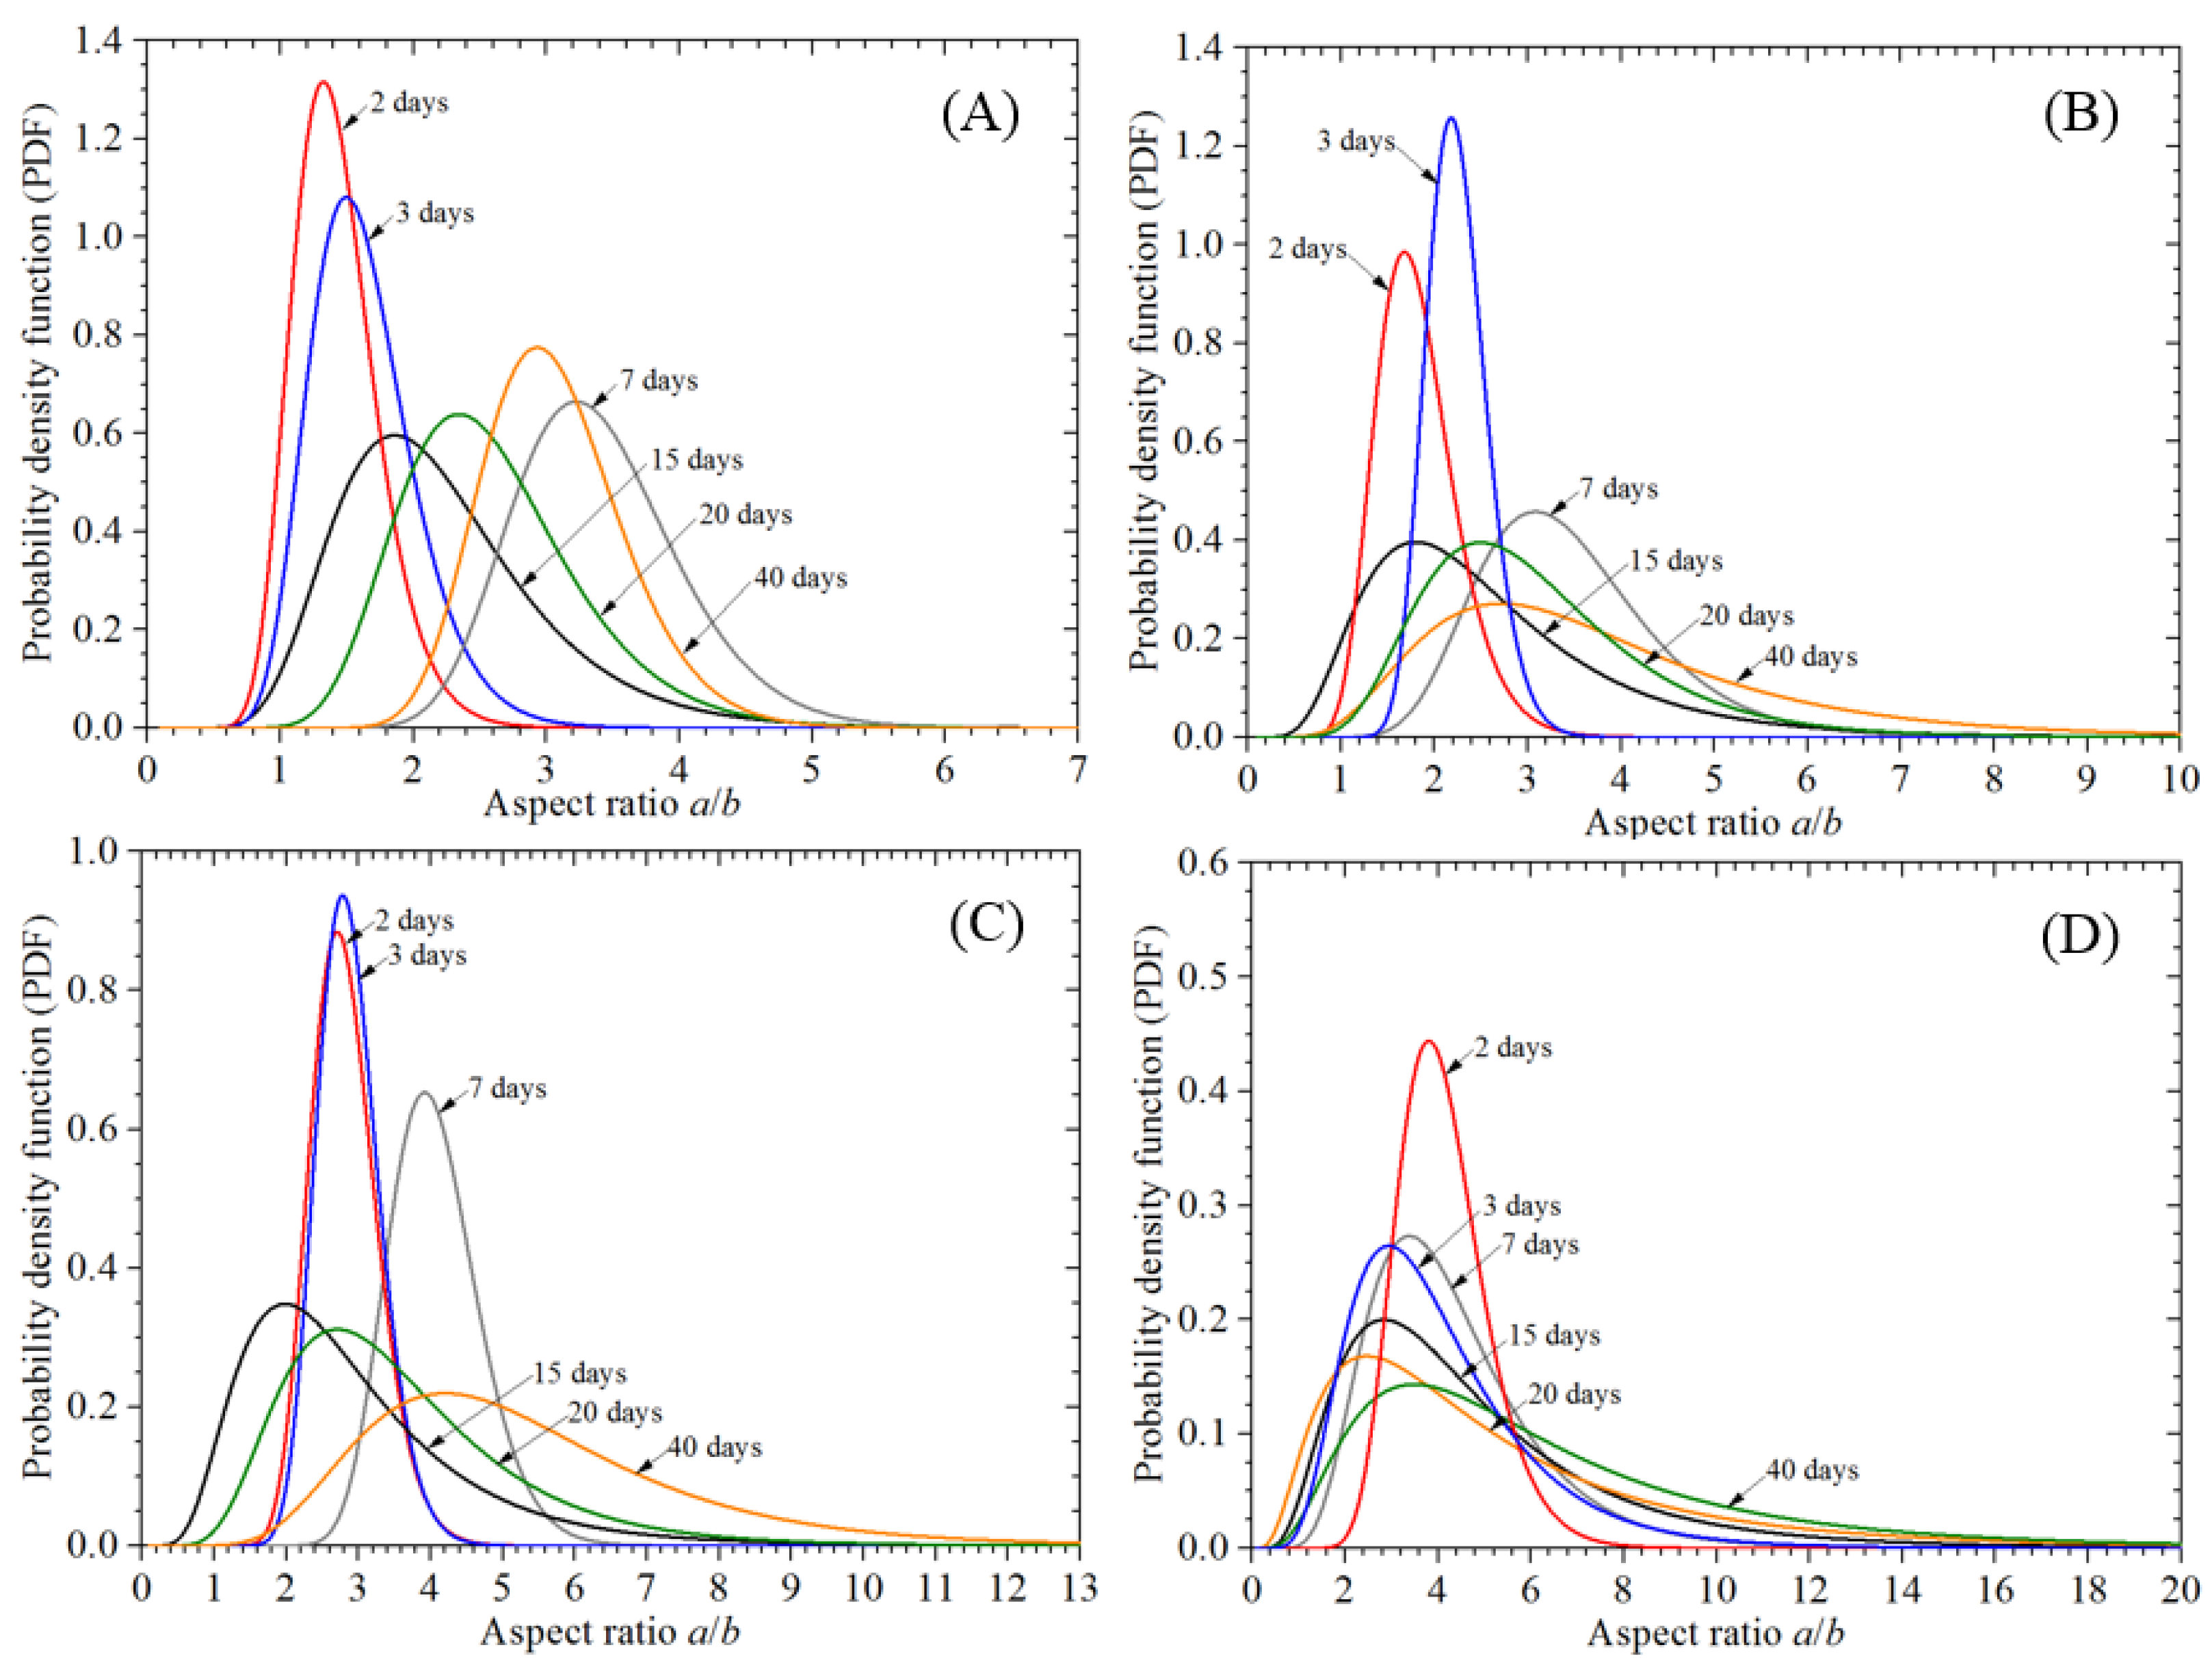
3.3.2. Corrosion Morphology

The aspect ratio a/b can be used to intuitively characterize the planar shape of corrosion pits. The major axis of the ellipse is along the circumferential direction for a/b < 1, whereas the corrosion pit develops along the longitudinal direction for a/b > 1, which becomes very large with increasing exposure time under the stress condition. The planar shape of the corrosion pit is circular when a = b, and this case will not be discussed separately herein. The time-dependent statistical results for the aspect ratio of the corrosion pits on steel wire specimens under different stress conditions are fitted with lognormal distributions, as shown in Figure 14.
As can be seen from Figure 14, both the exposure time and the stress condition affect the corrosion pit aspect ratio. Under the non-stressed condition, the corrosion pit morphology is metastable in the early corrosion stage, and the corrosion pit morphology has little variability with the exposure time, as shown in Figure 14A. The corrosion pit morphology becomes stable at exposure times greater than 7 d. As the exposure time increases, the aspect ratio of the corrosion pits grows, which means that parameter a along the longitudinal direction of the specimen surface increases. This is mainly caused by the convergence of small corrosion pits. Under the stress condition, as shown in Figure 14B–D, the corrosion pits become stable at exposure times greater than 3 d, indicating that the preloading stress contributes to the stability of the corrosion pit state. Thus, the aspect ratio of the corrosion pits exhibits greater variability under the stress condition. The statistical distribution results for the aspect ratio reach unity with increasing preloading stress, mainly because corrosion pits are more likely to occur on the specimen surface under the stress condition.

3.3.3. Block’s Maximum Pitting Factor

The statistical analysis of the maximum pitting corrosion depth is often the focus of studies, while the maximum pitting factor has been introduced to describe the pitting corrosion characteristics in the literature [51,52]. The maximum pitting factor can be expressed as follows:
λ = d p d u
where λ is the maximum pitting factor, dp is the maximum pitting corrosion depth on the steel wire specimen surface with length L, and du is the uniform corrosion depth of the steel wire specimen.
It has been confirmed that the maximum pitting factor has a spatial scale effect with increasing length of the high-strength steel wire. Thus, the block’s maximum pitting factor is introduced to consider the spatial scale effect, which obeys a Gumbel extreme value distribution. The probability density function for the block’s maximum pitting factor with a block length of L0 is as follows [51]:
F 0 x = exp exp x β 0 α 0
where α0 and β0 are the scale parameter and location parameter of the Gumbel distribution, respectively.
When the block length becomes Ln (= n × L0), the maximum pitting factor is subject to the following distribution:
F n x = F 0 x n = exp exp x β n α n
where αn is the scale parameter, αn = α0, and βn is the location parameter, βn = β0 + 1/α0 ln n.
The area of the block, Aκ, which is used to evaluate the variation in the maximum pitting factor, can be expressed as follows [51,52]:
A κ = C × L κ = π D × κ D
where C is the perimeter of the specimen, L is the length of the specimen, D is the diameter of the specimen, and κ is the spatial effect scale factor.
To avoid statistical differences caused by the parameter κ, a proper initial value should be determined, i.e., κ = 3 in this study. The subsequent values of κ can be determined according to the principle of proportionality; κ = 3, 6, 9, and 12 are used in this study, and the fitted results are shown in Figure 15.
Figure 15 depicts the fitted Gumbel distribution results for different blocks and stress conditions. Figure 15 shows that the Gumbel distribution functions present a group of parallel lines under the same stress conditions, indicating that the scale parameters are only related to the stress conditions. The scale parameter increases with increasing preloading stress, which indicates that the presence of stress causes the variability in the maximum pitting factor to increase.
The location parameters are generally considered to have a linear relationship with ln κ. Therefore, the scale parameter and location parameter considering the spatial effect scale factor and stress condition can be defined as follows:
α κ κ , η = c 1 κ + c 2 η + c 0 β κ κ , η = p 10 ln κ + p 11 η ln κ + p 02 η 2 + p 01 η + p 00
where c0, c1, and c2 are coefficients for modeling the scale parameter, and p00, p01, p02, p11, and p10 are coefficients for modeling the location parameter.
Figure 16 compares the proposed theoretical model with the observed data, which are in good agreement.

4. Conclusions

In this study, the corrosion behavior of a new type of zinc–aluminum alloy-coated 1960 MPa high-strength steel wire for long-span bridge cables under stress conditions is studied. Steel wire specimens with different corrosion conditions are produced in artificial accelerated corrosion experiments. The results show that the stress conditions led to the conversion of the corrosion characteristics. By exploring corrosion indicators, including the uniform corrosion depth, pitting corrosion depth, aspect ratio of corrosion pits, and block’s maximum pitting factor, the following conclusions can be drawn:
1)
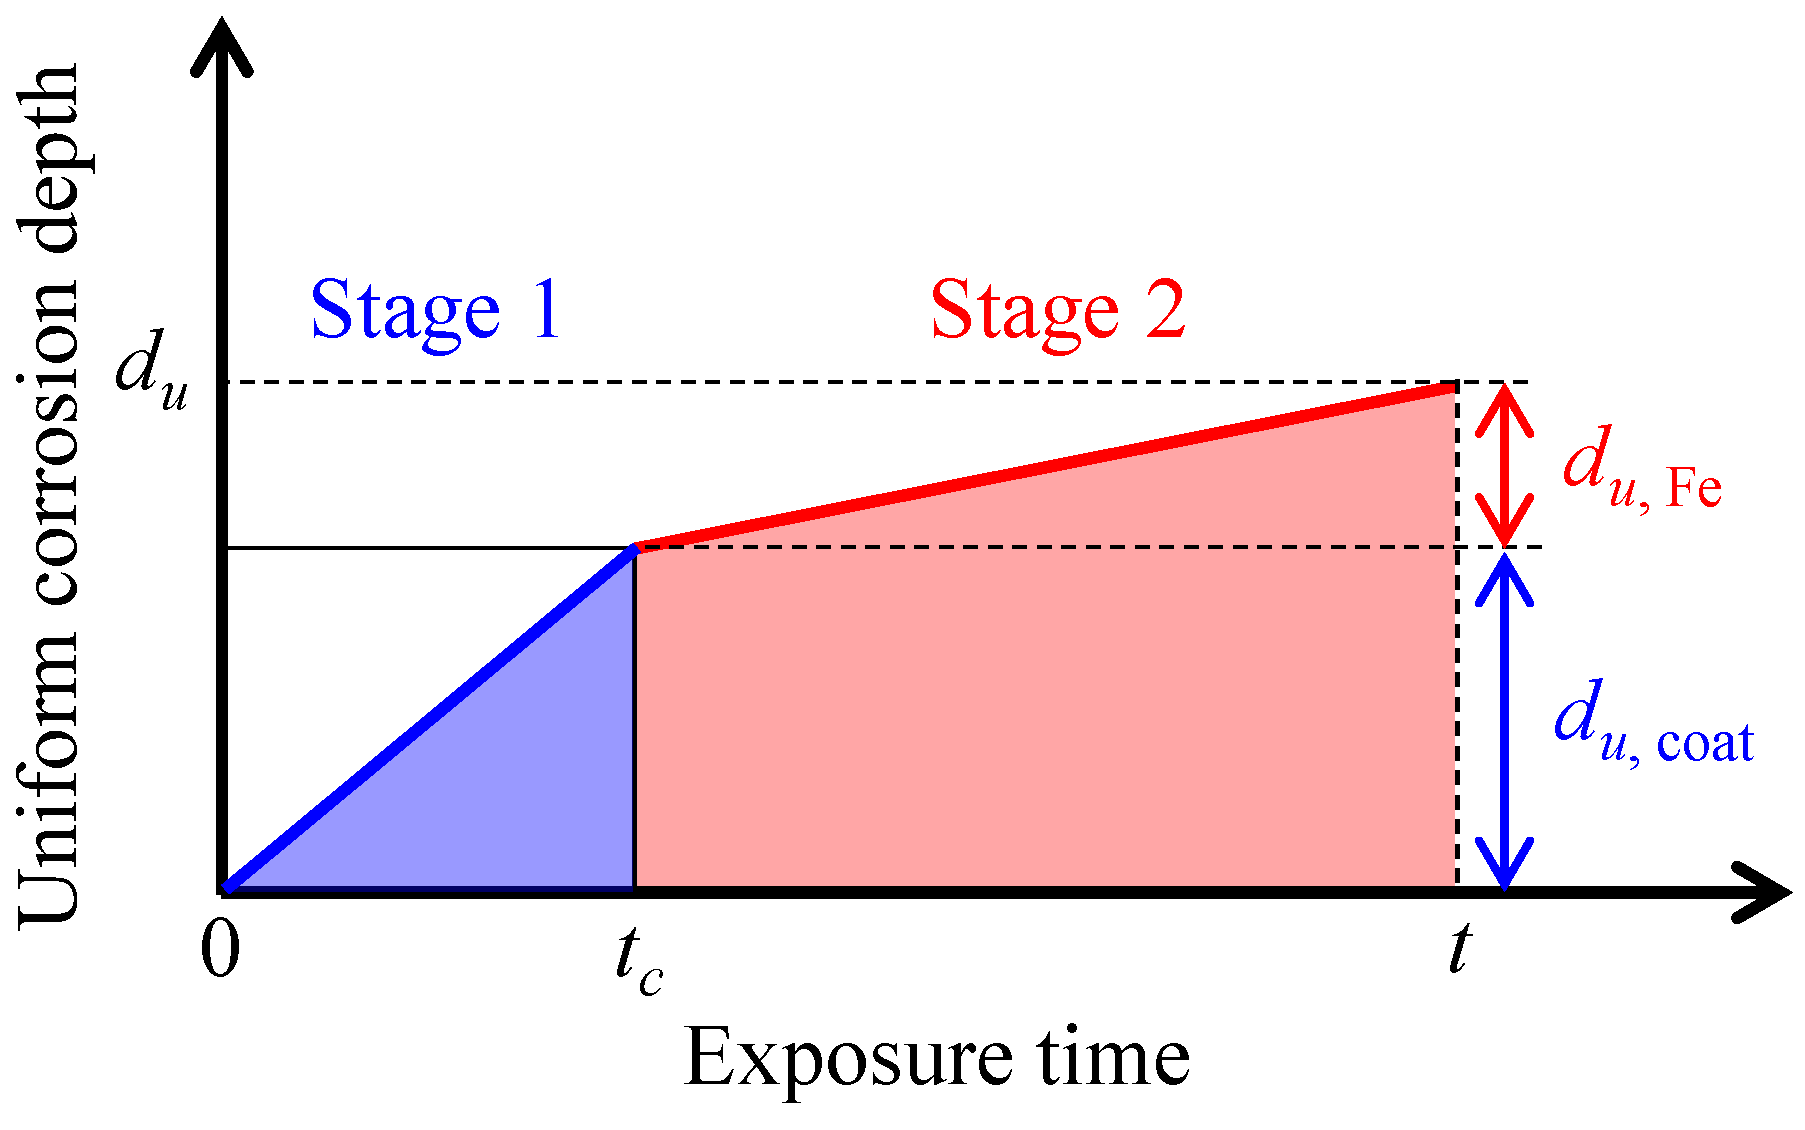
The corrosion processes of steel wire specimens can be divided into two stages under the non-stressed condition according to the time-dependent uniform corrosion depth. A two-stage model can effectively describe the conversion from coating corrosion to iron matrix corrosion, which is represented by a critical time, tc. The corrosion rate of the coating (3.32 μm/d0.996 for the zinc–aluminum alloy coating) is much higher than that of the iron matrix (~0.5 μm/d). When the exposure time reaches the critical time (tc = 15 d for the zinc–aluminum alloy-coated steel wire), the corrosion rate undergoes a sudden transition to a certain value of ~0.5 μm/d and remains stable.
2)
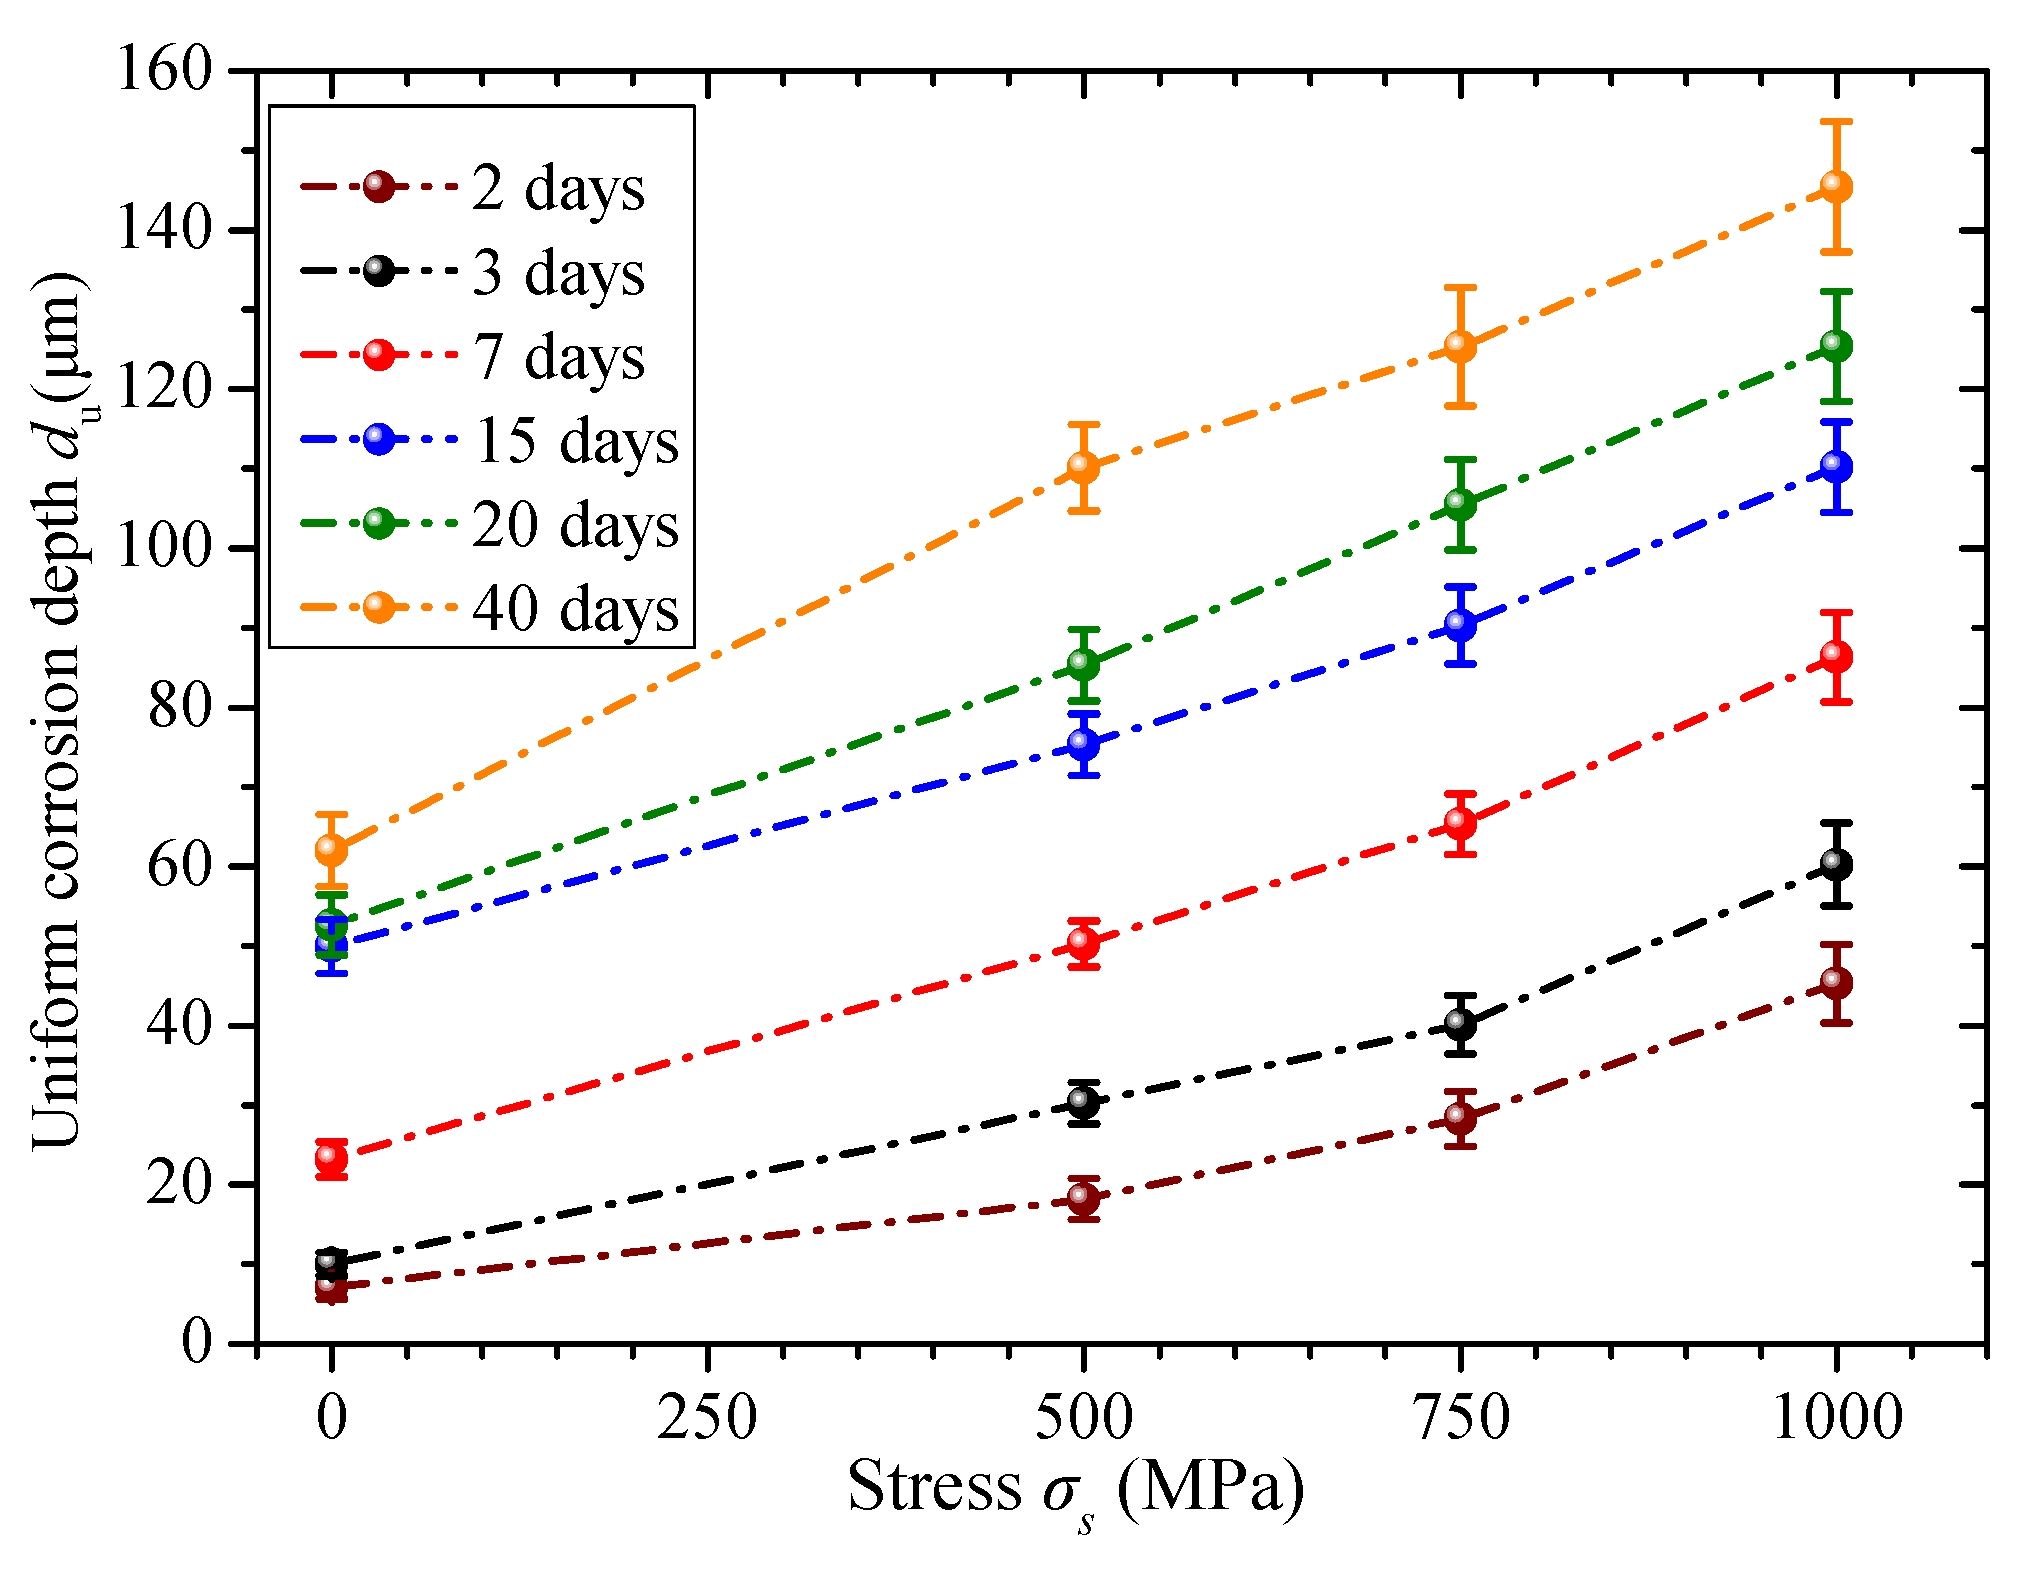
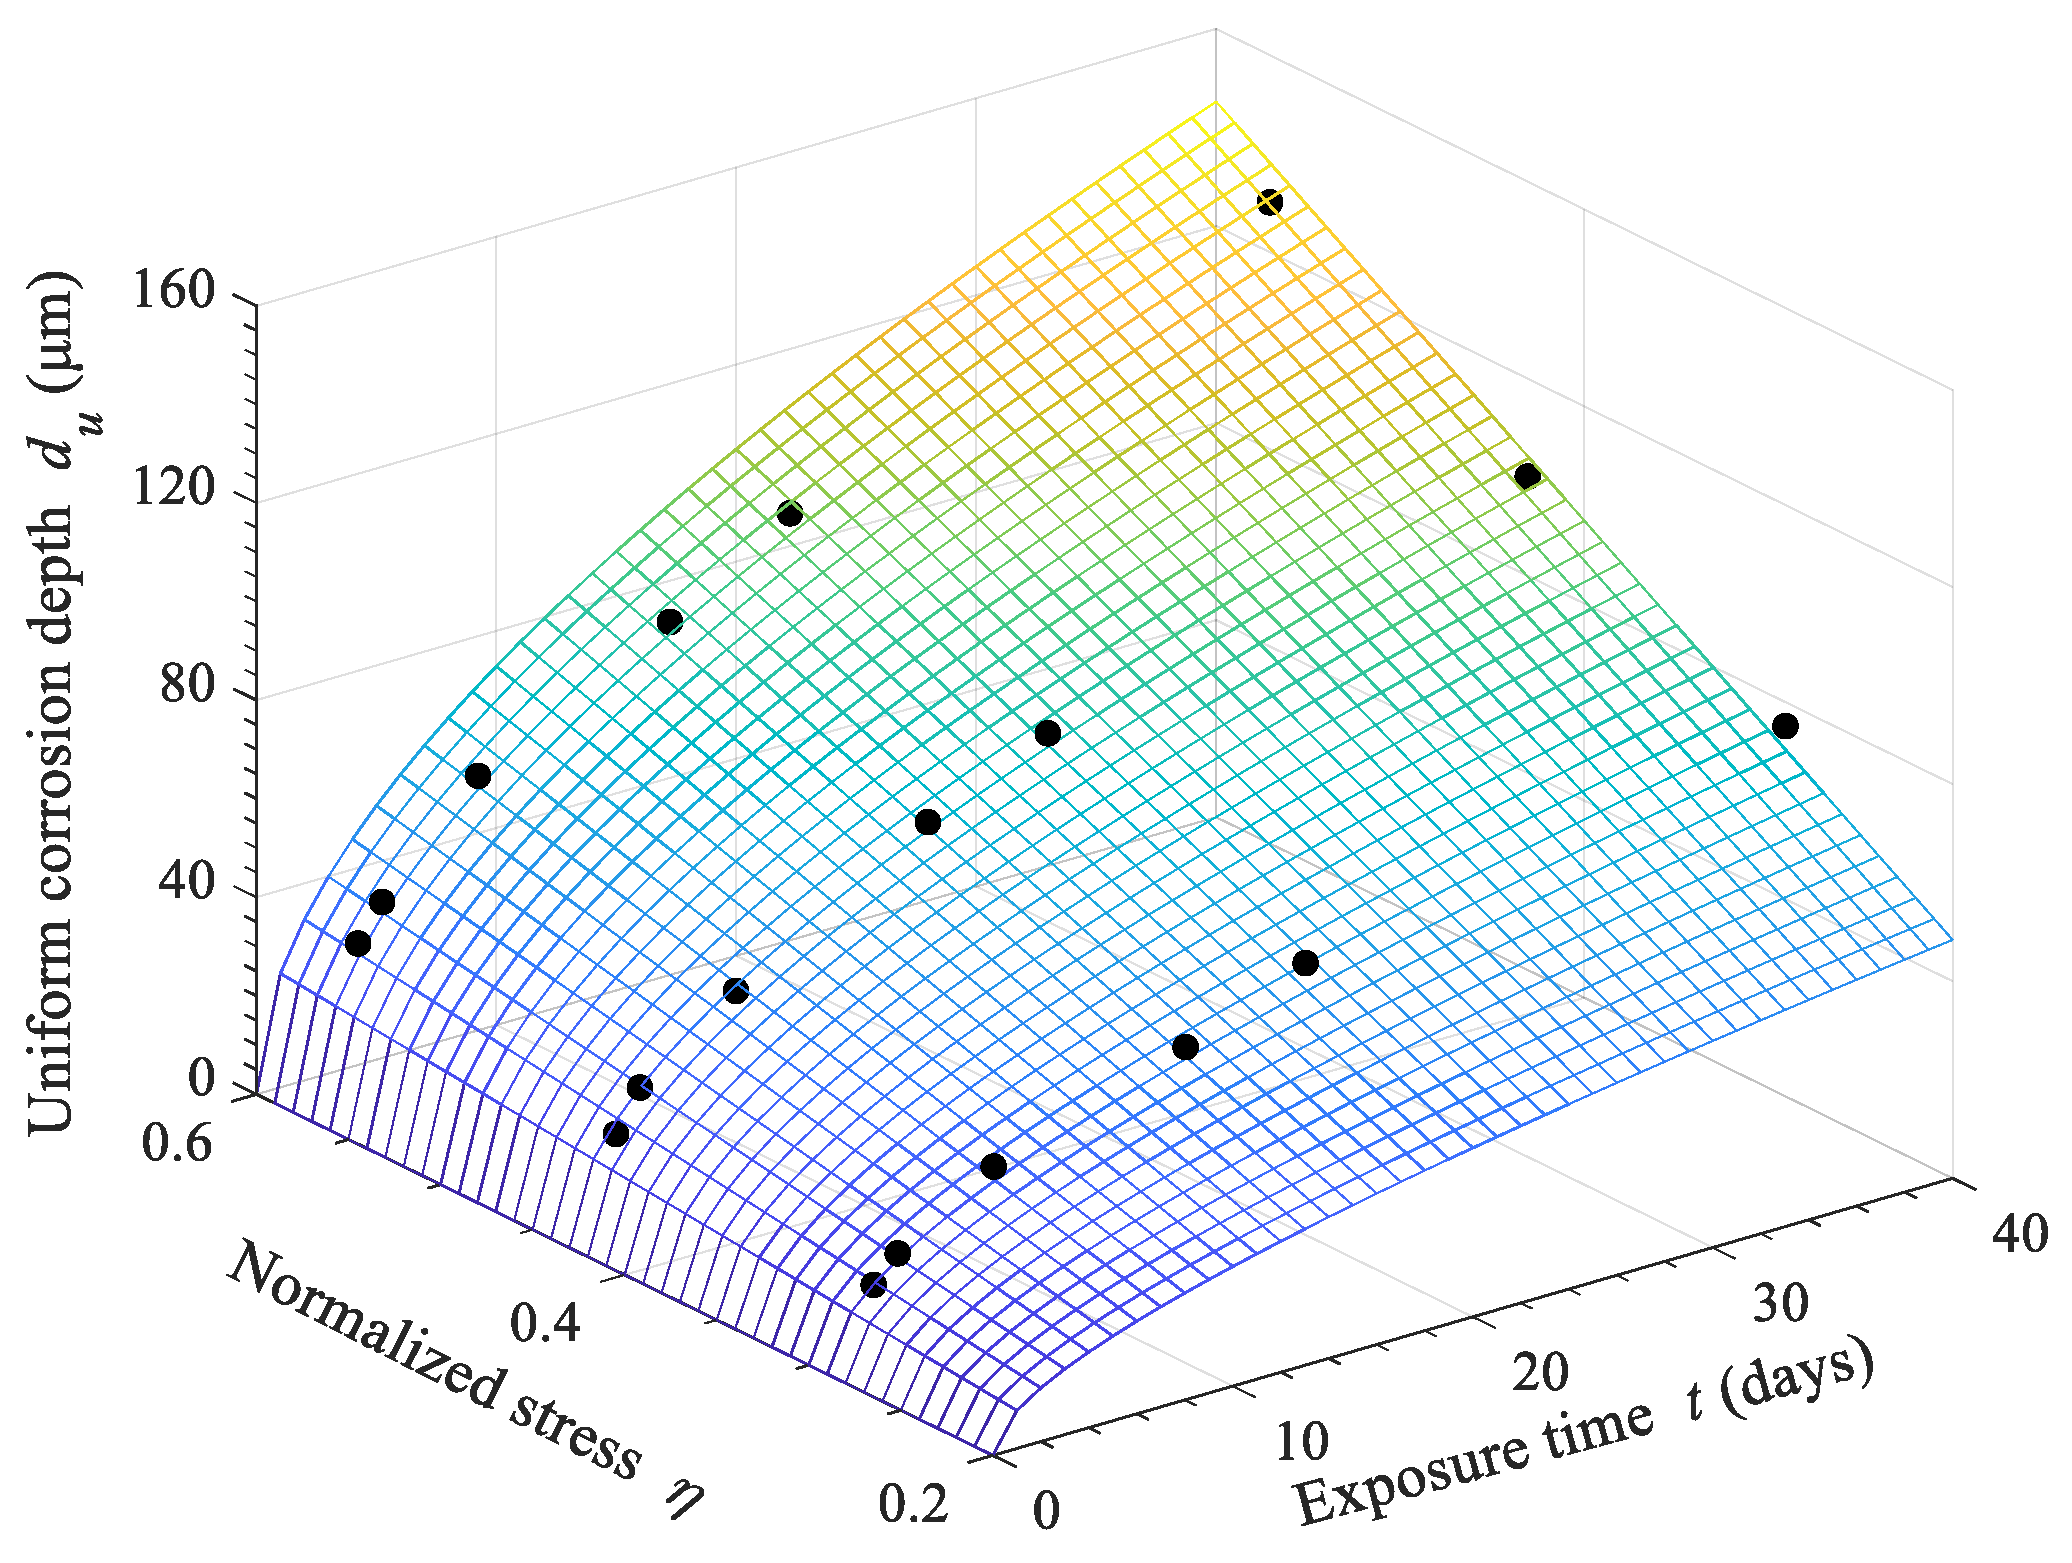
When considering the stress condition, the critical time is almost indistinguishable. The corrosion rates under stress conditions are always higher than those under non-stressed conditions. It can be concluded that the corrosion behavior changes from uniform corrosion to pitting corrosion under stress conditions. Thus, a continuous power model can be used to describe the corrosion phenomena. In addition, the uniform corrosion depth considering the exposure time and stress condition is formulated using an improved power model.
3)
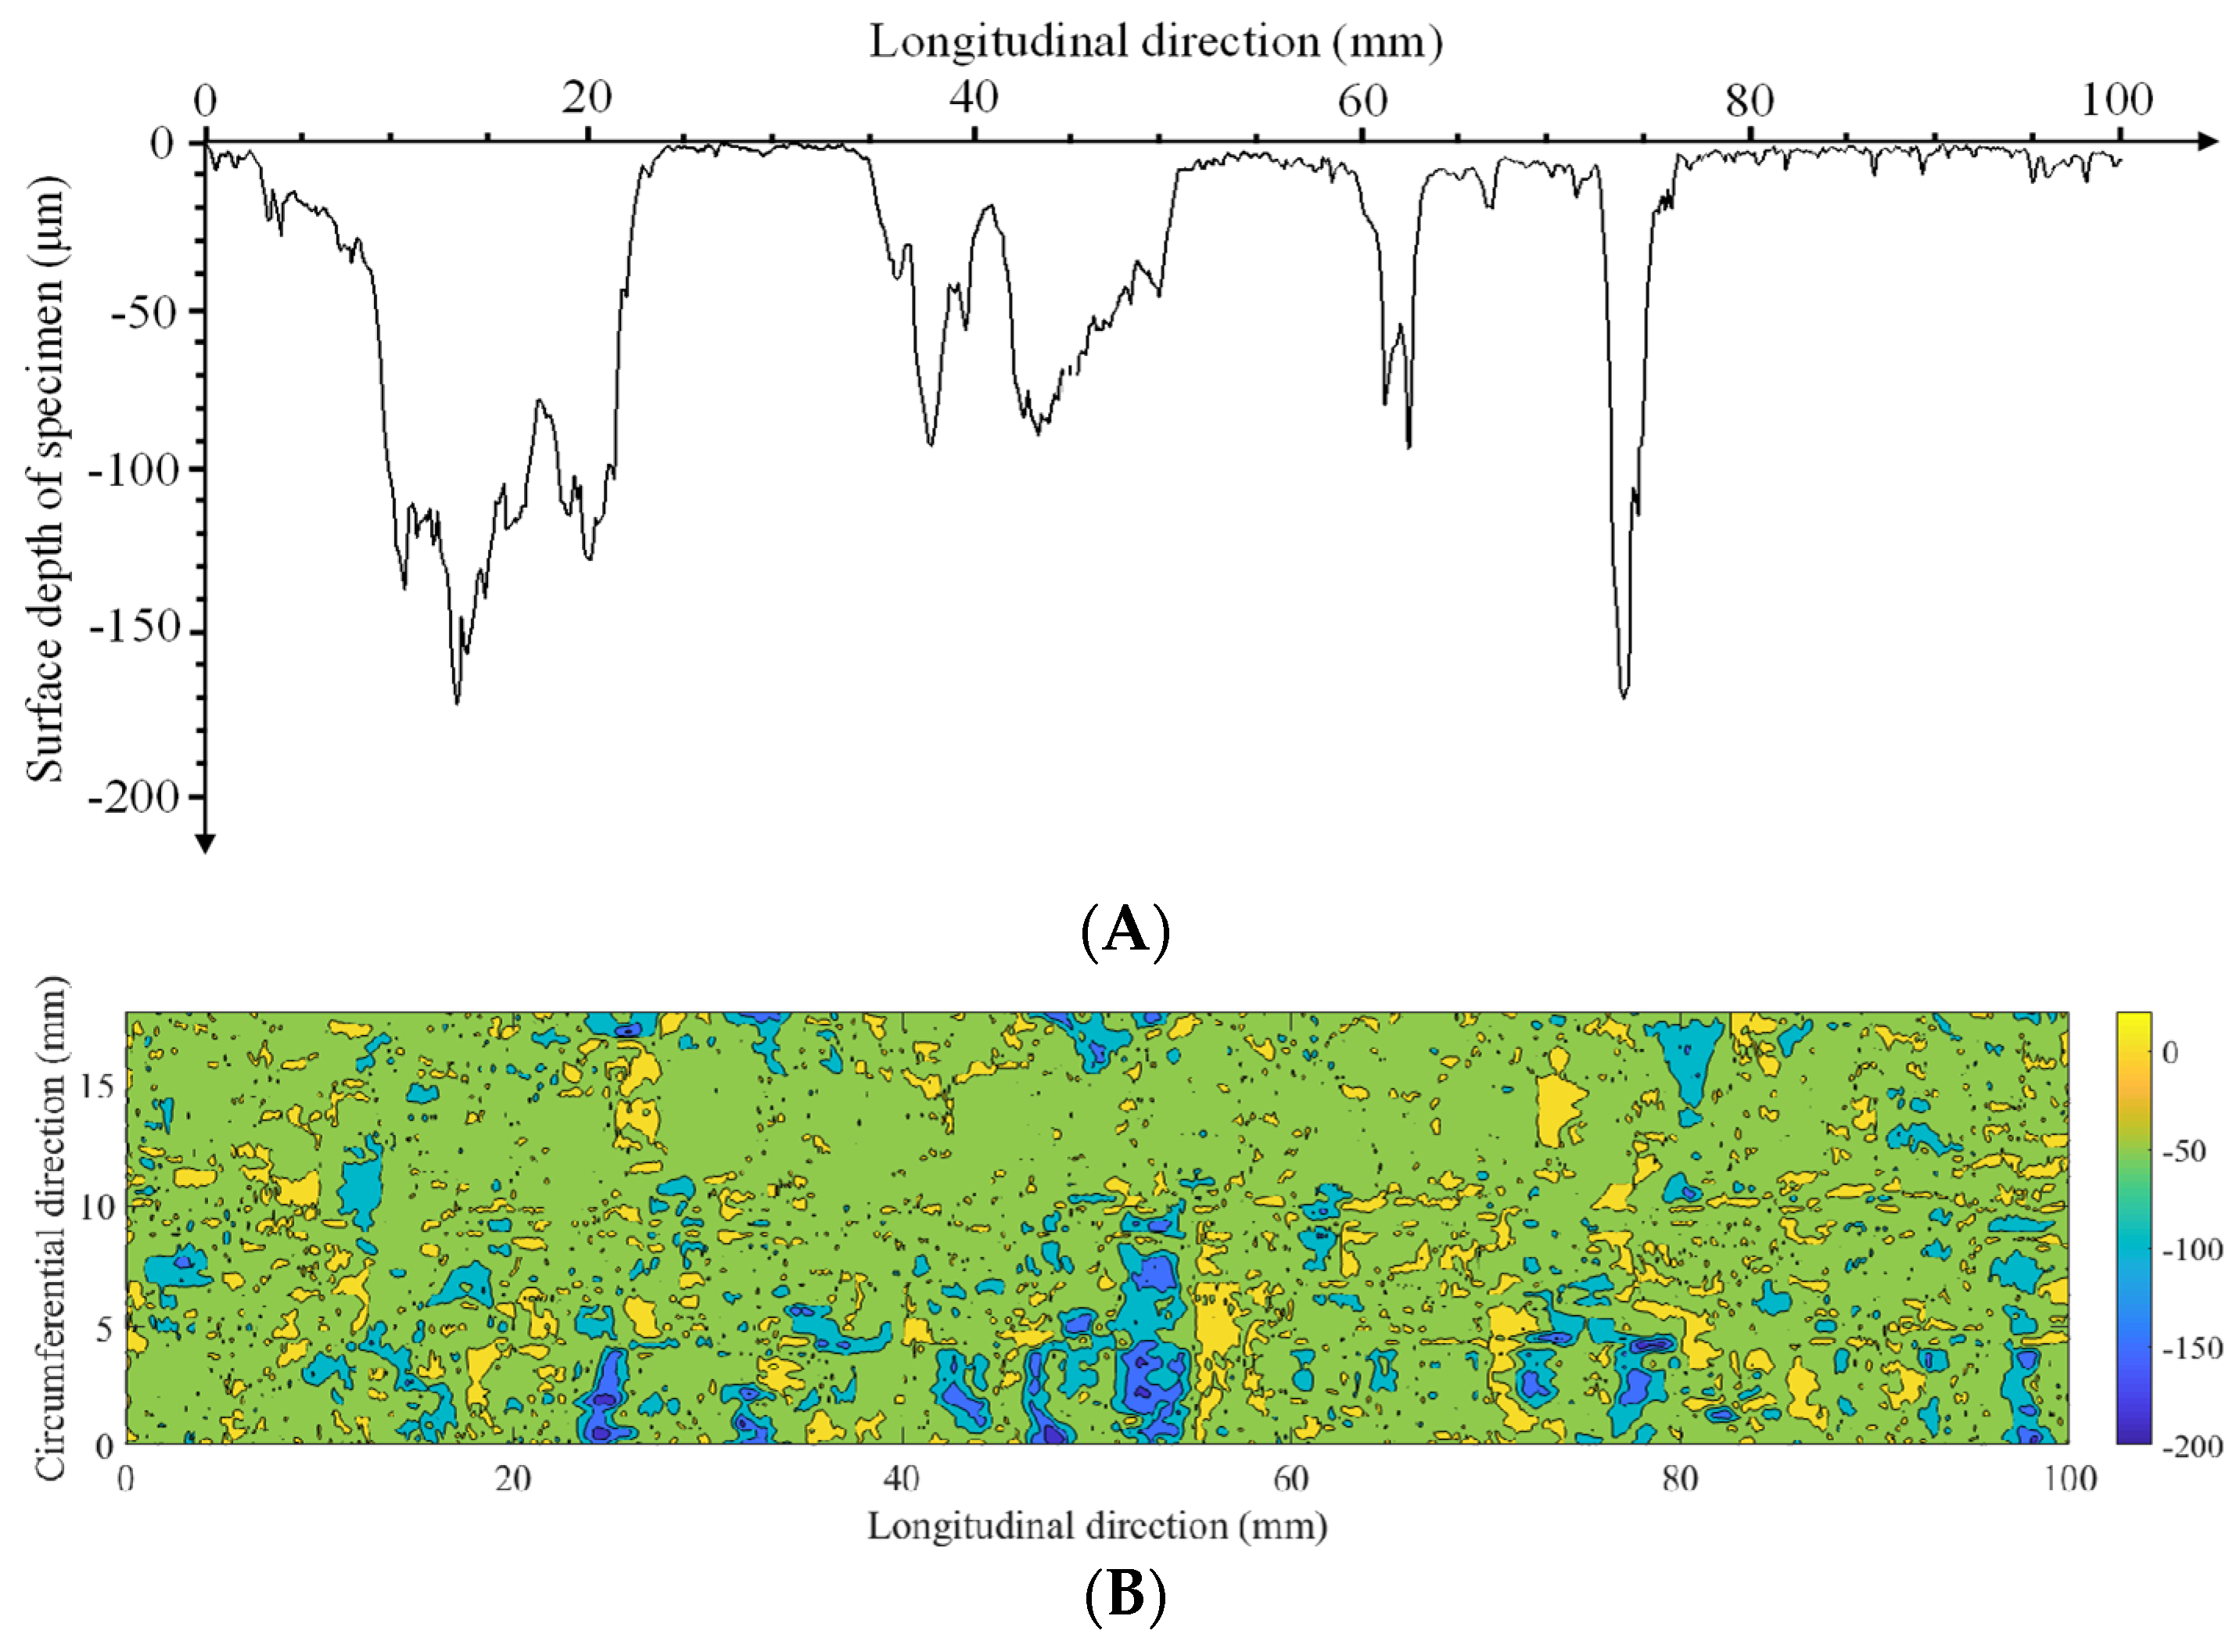
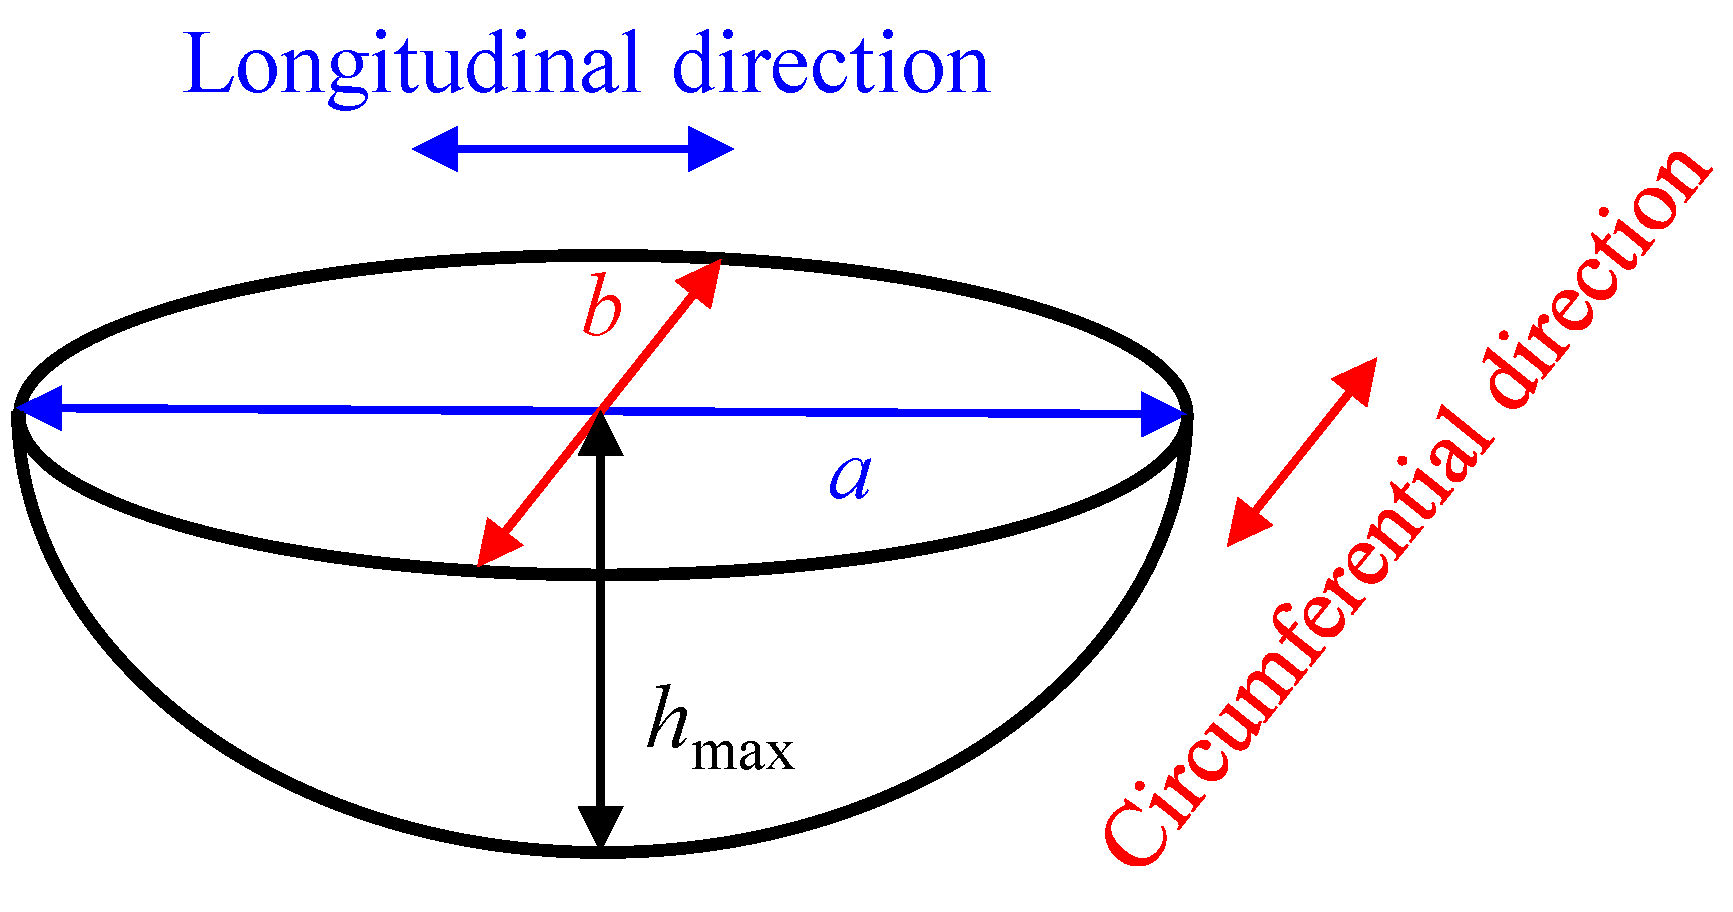
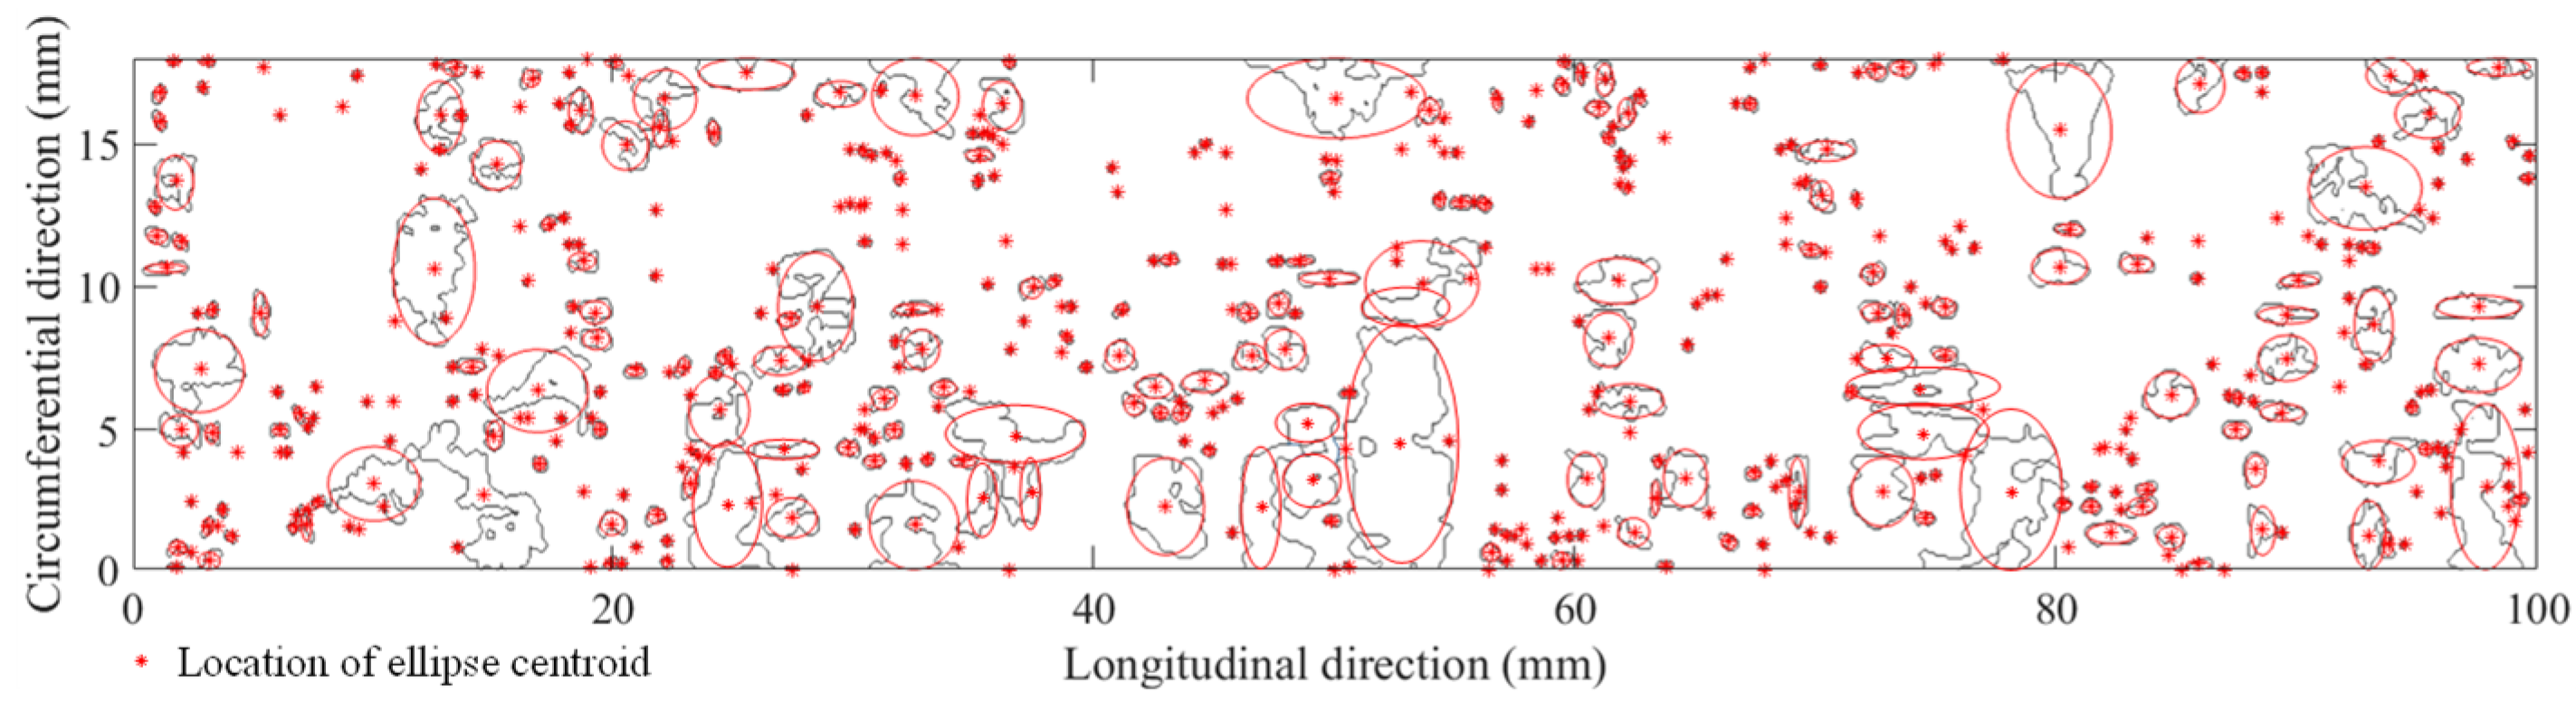
A semi-ellipsoid model is used to simulate individual corrosion pits, which obeys a lognormal distribution. It is clear that the preloading stress has little effect on corrosion pit growth compared to the exposure time. The variability in the aspect ratio of the corrosion pit depth increases under the stress condition. Statistical results for different block lengths, Lκ, show that the block’s maximum pitting factor under the stress condition still has a spatial scale effect. However, the preloading stress can lead to variation in the location parameter and reduce the variability of the block’s maximum pitting factor, which differs from the behavior of the non-stressed specimens.

Author Contributions

Conceptualization, K.F. and X.L. (Xiaoyong Liu); methodology, K.F.; software, X.L. (Xianfu Luo) and J.Z.; validation, P.C.; resources, X.Z. (Xinyao Zhang); data curation, X.Z. (Xiaoqin Zha); writing—original draft preparation, K.F.; writing—review and editing, K.F. and X.L. (Xiaoyong Liu); visualization, X.L. (Xianfu Luo); project administration, X.Z. (Xiaoqin Zha); funding acquisition, Z.L. All authors have read and agreed to the published version of the manuscript.

Funding

This research was funded by National Key R&D Program of China (No. 2023YFB3709904), National Natural Science Foundation of China (NSFC) (No. 52308512).

Institutional Review Board Statement

Not applicable.

Informed Consent Statement

Not applicable.

Data Availability Statement

The data presented in this study are available on request from the corresponding author.

Conflicts of Interest

The authors declare no conflicts of interest.

References

  1. Miki, C.; Homma, K.; Tominaga, T. High strength and high performance steels and their use in bridge structures. J. Constr. Steel Res. 2002, 58, 3–20. [Google Scholar] [CrossRef]
  2. He, P.; Jiang, W.; Song, J. Application of Structural Steel and Corrosion Prevention Technology in China. Dev. Appl. Mater. 2022, 37, 96–100. [Google Scholar] [CrossRef]
  3. Tang, M.C. Super-long span bridges. Struct. Infrastruct. Eng. 2017, 13, 722–730. [Google Scholar] [CrossRef]
  4. Jarwali, T.; Nakamura, S. Anti-corrosion performance of bridge strands consisting of steel wires galvanised with zinc–aluminum alloy. Struct. Infrastruct. Eng. 2016, 12, 682–694. [Google Scholar] [CrossRef]
  5. Wang, X.; Wang, Y.; Zhu, P.; Zhang, X.; Wang, H.; He, Y. Experimental and numerical investigations of UHSS wire main cables for suspension bridges. Structures 2022, 38, 1582–1594. [Google Scholar] [CrossRef]
  6. Sun, G.; Li, X.; Xue, S.; Chen, R. Mechanical properties of Galfan-coated steel cables at elevated temperatures. J. Constr. Steel Res. 2019, 155, 331–341. [Google Scholar] [CrossRef]
  7. Zhang, S.; Chen, W.; Ma, K.; Jiang, L.; Ye, J.; Xu, L. Creep and stress relaxation experiments of 1960-grade high-strength steel wire at elevated temperatures. Structures 2024, 59, 105682. [Google Scholar] [CrossRef]
  8. Yuan, Y.; Liu, X.; Pu, G.; Wang, T.; Guo, Q. Corrosion features and time-dependent corrosion model of Galfan coating of high strength steel wires. Constr. Build. Mater. 2021, 313, 125534. [Google Scholar] [CrossRef]
  9. Xue, S.; Shen, R.; Chen, W.; Shen, L. The corrosion-fatigue measurement test of the Zn-Al alloy coated steel wire. Structures 2020, 27, 1195–1201. [Google Scholar] [CrossRef]
  10. Chen, M.; Lu, X.; Zhou, Z.; Du, Y.; Xu, X.; Li, X. Mechanical properties of 2100 MPa parallel wire strands under and after elevated temperature. J. Constr. Steel Res. 2024, 212, 108323. [Google Scholar] [CrossRef]
  11. Su, M.; Dai, G.; Marx, S.; Liu, W.; Zhang, S. A Brief Review of Developments and Challenges for High-speed Rail Bridges in China and Germany. Struct. Eng. Int. 2019, 29, 160–166. [Google Scholar] [CrossRef]
  12. He, X.; Wu, T.; Zou, Y.; Chen, Y.F.; Guo, H.; Yu, Z. Recent developments of high-speed railway bridges in China. Struct. Infrastruct. Eng. 2017, 12, 1584–1595. [Google Scholar] [CrossRef]
  13. Fang, F.; Zhao, Y.; Zhou, L.; Hu, X.; Xie, Z.; Jiang, J. Texture inheritance of cold drawn pearlite steel wires after austenitization. Mat. Sci. Eng. A-Struct. 2014, 618, 505–510. [Google Scholar] [CrossRef]
  14. Jamoneau, A.; Solas, D.; Bourgon, J.; Morisot, P.; Schmitt, J. Strain localization and delamination mechanism of cold-drawn pearlitic steel wires during torsion. Mat. Sci. Eng. A-Struct. 2021, 814, 141222. [Google Scholar] [CrossRef]
  15. Bargujer, S.; Suri, N.; Belokar, R. Pearlitic steel wire: High carbon steel based natural nanomaterial by lead patenting process. Mater. Today 2016, 3, 1553–1562. [Google Scholar] [CrossRef]
  16. Toribio, J.; Ayaso, F.; Fernández-Viña, A. Environmentally-assisted microstructural integrity of commercial cold drawn pearlitic steel wires. Procedia Struct. Integr. 2022, 37, 1001–1006. [Google Scholar] [CrossRef]
  17. Emamian, Y.; Kolahi, A.; Palizdar, Y. Evaluation of microstructures and mechanical properties of deltha trip steel with different vanadium contents. Results Mater. 2024, 21, 100530. [Google Scholar] [CrossRef]
  18. Berrocal, C.G.; Lundgren, K.; Löfgren, I. Corrosion of steel bars embedded in fibre reinforced concrete under chloride attack: State of the art. Cem. Concr. Res. 2016, 80, 69–85. [Google Scholar] [CrossRef]
  19. Fu, C.; Jin, N.; Ye, H.; Jin, X.; Dai, W. Corrosion characteristics of a 4-year naturally corroded reinforced concrete beam with load-induced transverse cracks. Corros. Sci. 2017, 117, 11–23. [Google Scholar] [CrossRef]
  20. Mohd, H.M.; Kim, D.K.; Kim, D.W.; Paik, J.K. A time-variant corrosion wastage model for subsea gas pipelines. Ships Offshore Struc. 2014, 9, 161–176. [Google Scholar] [CrossRef]
  21. Yu, J.; Wang, H.; Yu, Y.; Luo, Z.; Liu, W.; Wang, C. Corrosion behavior of X65 pipeline steel: Comparison of wet–Dry cycle and full immersion. Corros. Sci. 2018, 133, 276–287. [Google Scholar] [CrossRef]
  22. Bhandari, J.; Khan, F.; Abbassi, R.; Garaniya, V.; Ojeda, R. Modelling of pitting corrosion in marine and offshore steel structures—A technical review. J. Loss Prevent. Proc. 2015, 37, 39–62. [Google Scholar] [CrossRef]
  23. Pantelakis, S.; Setsika, D.; Chamos, A.; Zervaki, A. Corrosion damage evolution of the aircraft aluminum alloy 2024 T3. Int. J. Struct. Integr. 2016, 7, 25–46. [Google Scholar] [CrossRef]
  24. Dursun, T.; Soutis, C. Recent developments in advanced aircraft aluminium alloys. Mater. Des. 2014, 56, 862–871. [Google Scholar] [CrossRef]
  25. Karanci, E.; Betti, R. Modeling Corrosion in Suspension Bridge Main Cables. I—Annual Corrosion Rate. J. Bridge Eng. 2018, 23, 04018025. [Google Scholar] [CrossRef]
  26. Talbot, D.E.J.; Talbot, J.D.R. Corrosion Science and Technology, 3rd ed.; CRC Press: Boca Raton, FL, USA, 2018. [Google Scholar]
  27. Suzumura, K.; Nakamura, S.I. Environmental Factors Affecting Corrosion of Galvanized Steel Wires. J. Mater. Civil Eng. 2004, 16, 1–7. [Google Scholar] [CrossRef]
  28. Wu, S.; Chen, H.; Ramandi, H.L.; Hagan, P.C.; Crosky, A.; Saydam, S. Effects of environmental factors on stress corrosion cracking of cold-drawn high-carbon steel wires. Corros. Sci. 2017, 132, 234–243. [Google Scholar] [CrossRef]
  29. Naghizadeh, M.; Nakhaie, D.; Zakeri, M.; Moayed, M.H. The effect of dichromate ion on the pitting corrosion of AISI 316 stainless steel Part II: Pit initiation and transition to stability. Corros. Sci. 2015, 94, 420–427. [Google Scholar] [CrossRef]
  30. Van der Weeën, P.; Zimer, A.M.; Pereira, E.C.; Mascaro, L.H.; Bruno, O.M.; De Baets, B. Modeling pitting corrosion by means of a 3D discrete stochastic model. Corros. Sci. 2014, 82, 133–144. [Google Scholar] [CrossRef]
  31. Tang, Y.; Zuo, Y.; Wang, J.; Zhao, X.; Niu, B.; Lin, B. The metastable pitting potential and its relation to the pitting potential for four materials in chloride solutions. Corros. Sci. 2014, 80, 111–119. [Google Scholar] [CrossRef]
  32. Velázquez, J.C.; Hernández-Huerta, J.J.; Diaz-Cruz, M.; Hernández-Sánchez, E.; Cervantes-Tobón, A.; Capula-Colindres, S.I.; Cabrera-Sierra, R. Study on the Influence of Non-Metallic Inclusions on the Pitting Corrosion of API 5L X60 Steel. Coatings 2023, 13, 1040. [Google Scholar] [CrossRef]
  33. Stewart, M.G.; Al-Harthy, A. Pitting corrosion and structural reliability of corroding RC structures: Experimental data and probabilistic analysis. Reliab. Eng. Syst. Saf. 2008, 93, 373–382. [Google Scholar] [CrossRef]
  34. Li, F.; Luo, X.; Wang, K.; Ji, Y. Pitting Damage Characteristics on Prestressing Steel Strands by Combined Action of Fatigue Load and Chloride Corrosion. J. Bridge Eng. 2017, 22, 04017023. [Google Scholar] [CrossRef]
  35. Nakamura, S.; Suzumura, K. Experimental Study on Fatigue Strength of Corroded Bridge Wires. J. Bridge Eng. 2013, 18, 200–209. [Google Scholar] [CrossRef]
  36. Sun, H.; Xu, J.; Chen, W.; Yang, J. Time-Dependent Effect of Corrosion on the Mechanical Characteristics of Stay Cable. J. Bridge Eng. 2018, 23, 04018019. [Google Scholar] [CrossRef]
  37. Karuppanasamy, J.; Pillai, R. Statistical distributions for the corrosion rates of conventional and prestressing steel reinforcement embedded in chloride contaminated mortar. Corrosion 2017, 73, 1119–1131. [Google Scholar] [CrossRef] [PubMed]
  38. Xu, F.; Xiao, Y.; Wang, S.; Li, W.; Liu, W.; Du, D. Numerical model for corrosion rate of steel reinforcement in cracked reinforced concrete structure. Constr. Build. Mater. 2018, 180, 55–67. [Google Scholar] [CrossRef]
  39. Biondini, F.; Camnasio, E.; Palermo, A. Lifetime seismic performance of concrete bridges exposed to corrosion. Struct. Infrastruct. Eng. 2014, 10, 880–900. [Google Scholar] [CrossRef]
  40. Betti, R.; West, A.C.; Vermaas, G.; Cao, Y. Corrosion and Embrittlement in High-Strength Wires of Suspension Bridge Cables. J. Bridge Eng. 2005, 10, 151–162. [Google Scholar] [CrossRef]
  41. Yang, W.J.; Yang, P.; Li, X.M.; Feng, W.L. Influence of tensile stress on corrosion behaviour of high-strength galvanized steel bridge wires in simulated acid rain. Mater. Corros. 2015, 63, 401–407. [Google Scholar] [CrossRef]
  42. Chen, C.; Ma, H.; Wang, F.; Yang, Z.; Zhang, F.; Yan, Z. Influence of Carbon Content on Tensile Properties of Pure High Manganese Austenitic Steel. Coatings 2022, 12, 1622. [Google Scholar] [CrossRef]
  43. ISO 9227: 2022(E); Corrosion Tests in Artificial Atmospheres—Salt Spray Tests. International Organization for Standardization: Geneva, Switzerland, 2022.
  44. ASTM G1-03 (2011); Standard Practice for Preparing, Cleaning, and Evaluating Corrosion Test Specimens. ASTM: West Conshohocken, PA, USA, 2011.
  45. Tahara, A.; Shinohara, T. Influence of the alloy element on corrosion morphology of the low alloy steels exposed to the atmospheric environments. Corros. Sci. 2005, 47, 2589–2598. [Google Scholar] [CrossRef]
  46. Cole, I.S.; Marney, D. The science of pipe corrosion: A review of the literature on the corrosion of ferrous metals in soils. Corros. Sci. 2012, 56, 5–16. [Google Scholar] [CrossRef]
  47. Deng, L.; Deng, Y. Temporal and Spatial Variation Study on Corrosion of High-Strength Steel Wires in the Suspender of CFST Arch Bridge. Coatings 2024, 14, 628. [Google Scholar] [CrossRef]
  48. Li, S.; Xu, Y.; Li, H.; Guan, X. Uniform and pitting corrosion modeling for high-strength bridge wires. J. Bridge Eng. 2014, 19, 04014025. [Google Scholar] [CrossRef]
  49. Li, L.; Li, C.; Mahmoodian, M. Effect of Applied Stress on Corrosion and Mechanical Properties of Mild Steel. J. Mater. Civ. Eng. 2019, 31, 04018375. [Google Scholar] [CrossRef]
  50. Hong, H.; Cao, S.; Fu, J.; Tian, H. Experimental Study on Apparent Corrosion Rule of Main Cable Steel Wires of Suspension Bridge in Holding Force State. J. Highw. Transport. Res. Dev. 2022, 39, 97–102. [Google Scholar] [CrossRef]
  51. Stewart, M.G. Mechanical behaviour of pitting corrosion of flexural and shear reinforcement and its effect on structural reliability of corroding RC beams. Struct. Saf. 2009, 31, 19–30. [Google Scholar] [CrossRef]
  52. Valor, A.; Caleyo, F.; Rivas, D.; Hallen, J.M. Stochastic approach to pitting-corrosion-extreme modelling in low-carbon steel. Corros. Sci. 2010, 52, 910–915. [Google Scholar] [CrossRef]
Figure 1. Artificial accelerated spray corrosion test and stress-holding device.
Coatings 14 00890 g001
Figure 2. Pitting corrosion measurement system.
Coatings 14 00890 g002
Figure 3. Comparison of steel wire specimens before and after corrosion product removal.
Coatings 14 00890 g003
Figure 4. SEM photos of zinc–aluminum alloy coating of a steel wire specimen.
Coatings 14 00890 g004
Figure 5. Two-stage model of time-varying uniform corrosion depth.
Coatings 14 00890 g005
Figure 6. Corrosion rates and fitting results under non-stressed conditions [47,48].
Coatings 14 00890 g006
Figure 7. Corrosion rates and fitted results under different stress conditions. (A) Comparisons of corrosion rate data and fitted results. (B) Close-up of comparison results with suspension cable bridge steel wires under different applied strain conditions [50]. (C) Close-up of comparison results with mild steel under non-stressed and stressed conditions in different concentrations of HCl solution [49].
Coatings 14 00890 g007
Figure 8. Uniform corrosion depth changes with preloading stress at different exposure time periods.
Coatings 14 00890 g008
Figure 9. Uniform corrosion depth and fitted bivariate model.
Coatings 14 00890 g009
Figure 10. Pitting corrosion measuring result of specimen with exposure time of 40 days and stress condition of 750 MPa: (A) measuring line at 0°; (B) contour plot.
Coatings 14 00890 g010
Figure 11. Geometrical model of individual corrosion pit.
Coatings 14 00890 g011
Figure 12. Contour line of the corrosion pits and fitted ellipses.
Coatings 14 00890 g012
Figure 13. Fitted lognormal distribution of pitting corrosion depth of corrosion pits under different stress conditions: (A) 0 MPa; (B) 500 MPa; (C) 750 MPa; (D) 1000 MPa.
Coatings 14 00890 g013
Figure 14. Fitted lognormal distribution of aspect ratio of corrosion pits under different stress conditions: (A) 0 MPa; (B) 500 MPa; (C) 750 MPa; (D) 1000 MPa.
Coatings 14 00890 g014
Figure 15. Fitted Gumbel distribution of block’s maximum pitting factor.
Coatings 14 00890 g015
Figure 16. Fitted results of parameters of Gumbel distribution: (A) scale parameter α (κ, η); (B) location parameter β (κ, η).
Coatings 14 00890 g016
Table 1. Mechanical properties of 1960 MPa high-strength steel wires.
Yield Strength
(MPa)
Ultimate Strength
(MPa)
Elastic Modulus
(MPa)
Elongation
≥1750≥1960(2.0 ± 0.1) × 105≥4.0%
Table 2. Chemical composition of 1960 MPa high-strength steel wires (wt.%).
ElementCMnCrSiAlVNiCuPS
Content0.95~
1.20
0.6~
1.0
0.1~
0.5
0.10~
0.48
0.05~
0.15
0.01~
0.05
0.01~
0.03
≤0.05≤0.025≤0.015
Note: The balance is iron and impurities.
Disclaimer/Publisher’s Note: The statements, opinions and data contained in all publications are solely those of the individual author(s) and contributor(s) and not of MDPI and/or the editor(s). MDPI and/or the editor(s) disclaim responsibility for any injury to people or property resulting from any ideas, methods, instructions or products referred to in the content.

