Article

Disintegrated Waste-Activated Sludge (NO2/FNA Method) as a Source of Carbon for Denitrification in the Mainstream of a WWTP

1
Faculty of Environmental Engineering, Wroclaw University of Science and Technology, Wybrzeże Wyspiańskiego 27, 50-370 Wroclaw, Poland
2
Wroclaw Municipal Water and Sewage Company, Na Grobli 14/16, 50-421 Wroclaw, Poland
3
Aquateam COWI, Karvesvingen 2, 0579 Oslo, Norway
*
Author to whom correspondence should be addressed.
Resources 2024, 13(6), 80; https://doi.org/10.3390/resources13060080
Submission received: 19 April 2024 / Revised: 29 May 2024 / Accepted: 5 June 2024 / Published: 10 June 2024

Abstract

:
The deficiency of readily biodegradable organic carbon can be a significant limitation to effective nitrogen removal during wastewater denitrification. Waste-activated sludge (WAS) is a source of carbon produced directly at wastewater treatment plants (WWTPs). Raw WAS has a large molecular weight and complex chemical structure molecules that are not easily available for microorganisms. In this study, easily biodegradable organic fractions were released using pH control and/or nitrites and nitric acid (NO2/FNA). The obtained results indicated that WAS can be a sufficient carbon source for denitrification in WWTPs that are at risk of minor effluent violations. The implementation of WAS disintegration with the use of pH control and NO2/FNA allowed for the denitrification of an additional 0.5 and 0.8 mgN-NO3/L. WAS disintegration, besides being a source of carbon generation, reduces the volume of sludge and leads to the implementation of a closed-loop system.

Graphical Abstract

1. Introduction

Nitrogen is one of the main biogenic compounds and is responsible for eutrophication when it enters water bodies in excessive quantities. Therefore, its efficient removal from wastewater is required [1]. Activated sludge processes (with enhanced nutrient removal) are widely used in wastewater treatment plants (WWTPs) due to their relatively simple operation, low cost, and high efficiency [2]. The biological removal of nitrogen is conventionally carried out via the autotrophic conversion of ammonia to nitrite and nitrate under aerobic conditions (nitrification), which is then followed by heterotrophic reduction to dinitrogen gas under anoxic conditions (denitrification) [3]. Denitrifiers require biodegradable organic compounds as electron donors. Therefore, the potential of denitrification depends on the availability of biodegradable organic carbon in raw wastewater. Efficient nitrogen removal can be achieved if the C/N ratio is at a minimum level of 6. However, wastewaters treated by municipal WWTPs are often characterized by lower C/N ratios. In such cases, the effective removal of nitrogen requires the provision of an external carbon source [4,5].
Methanol, ethanol, acetate, and glucose are the external carbon sources that are often used to enhance nitrogen removal efficiency. Their application leads to a significant increase in the operating costs of wastewater treatment (USD 0.33–1.03/kgC) [4,5,6]. In recent years, research on alternative carbon sources as alternatives to expensive commercial solutions has gained significant interest. Industrial wastewater rich in biodegradable organic compounds (i.e., that coming from ice cream production) and food waste-recycling wastewater, are among the various proposed solutions [4,5,6]. However, such approaches require the availability of a suitable stream in the vicinity of the WWTP. Potentially, the most beneficial solution appears to be the harvesting of organic compounds from the waste-activated sludge (WAS) produced at the WWTP itself. WAS contains high levels of organic substances such as carbohydrates and proteins, which are too complex to be consumed by denitrifiers. However, the carbon compounds contained in WAS can be hydrolyzed to easily biodegradable organic compounds (Ss) such as volatile fatty acids (VFAs) with the use of WAS disintegration [7]. Many disintegration methods are available, among which mechanical, chemical, and biological methods can be distinguished [8,9,10,11]. Most of these technologies require high energy inputs and large quantities of chemicals. Nitrite/free nitrous acid (NO2/FNA) is a biocidal agent that can be produced on-site at a WWTP through nitritation of anaerobic digestion liquor [12]. The mechanism of NO2/FNA disintegration is still uncertain. Wu et al. (2018) indicated a strong effect of FNA on cell membrane disruption and a limited role in EPS disintegration [1]. Wang et al. (2018) concluded that FNA induces the permeabilization of bacteria and may lead to cell membrane lysis [2]. Despite the lack of a complete understanding of the mechanism, many studies have proven the effectiveness of NO2/FNA as a WAS disintegration agent in terms of soluble chemical oxygen demand (SCOD) release, and consequently for increased methane production [12,13,14]. Ma et al. showed that FNA pretreatment of WAS (concentrations up to 2 mgN-HNO2/L) enhanced the exploitation of internal carbon sources during the simultaneous fermentation denitrification process. Additionally, the denitrification efficiency, as well as the reduction in the volume of sludge in a simultaneous fermentation and denitrification reactor, were improved as a result of applying NO2/FNA [15]. Those studies showed the general potential of NO2/FNA to improve denitrification, but crucial data on the application of the process for classical activated sludge operated with vastly different process parameters still require verification. Nitrogen uptake rates (NURs), which indicate whether released SCOD is easily or slowly biodegradable, can be seen to be very important. While slowly biodegradable compounds might be useful in long hydraulic retention systems such as anaerobic digesters, in activated sludge reactors, they will also penetrate into the aerobic reactor, in turn increasing oxygen consumption. Moreover, the overall easily and slowly biodegradable COD yield from WAS, which originates from reactors with high sludge retention time (SRT), should also be assessed.
This study is involved in the developing technology for low-carbon and clean wastewater treatment, which aims to implement FNA for shortcut nitrification/denitrification in wastewater treatment plants (WWTPs). The following issues are covered:
  • The WAS from a full biological nutrient removal plant (operated at a high SRT) is exposed to NO2/FNA concentrations selected according to previous studies (123, 255, and 264 mgN-NO2/L; 2.8 and 5.8 mgN-HNO2/L, pH 5) [16,17].
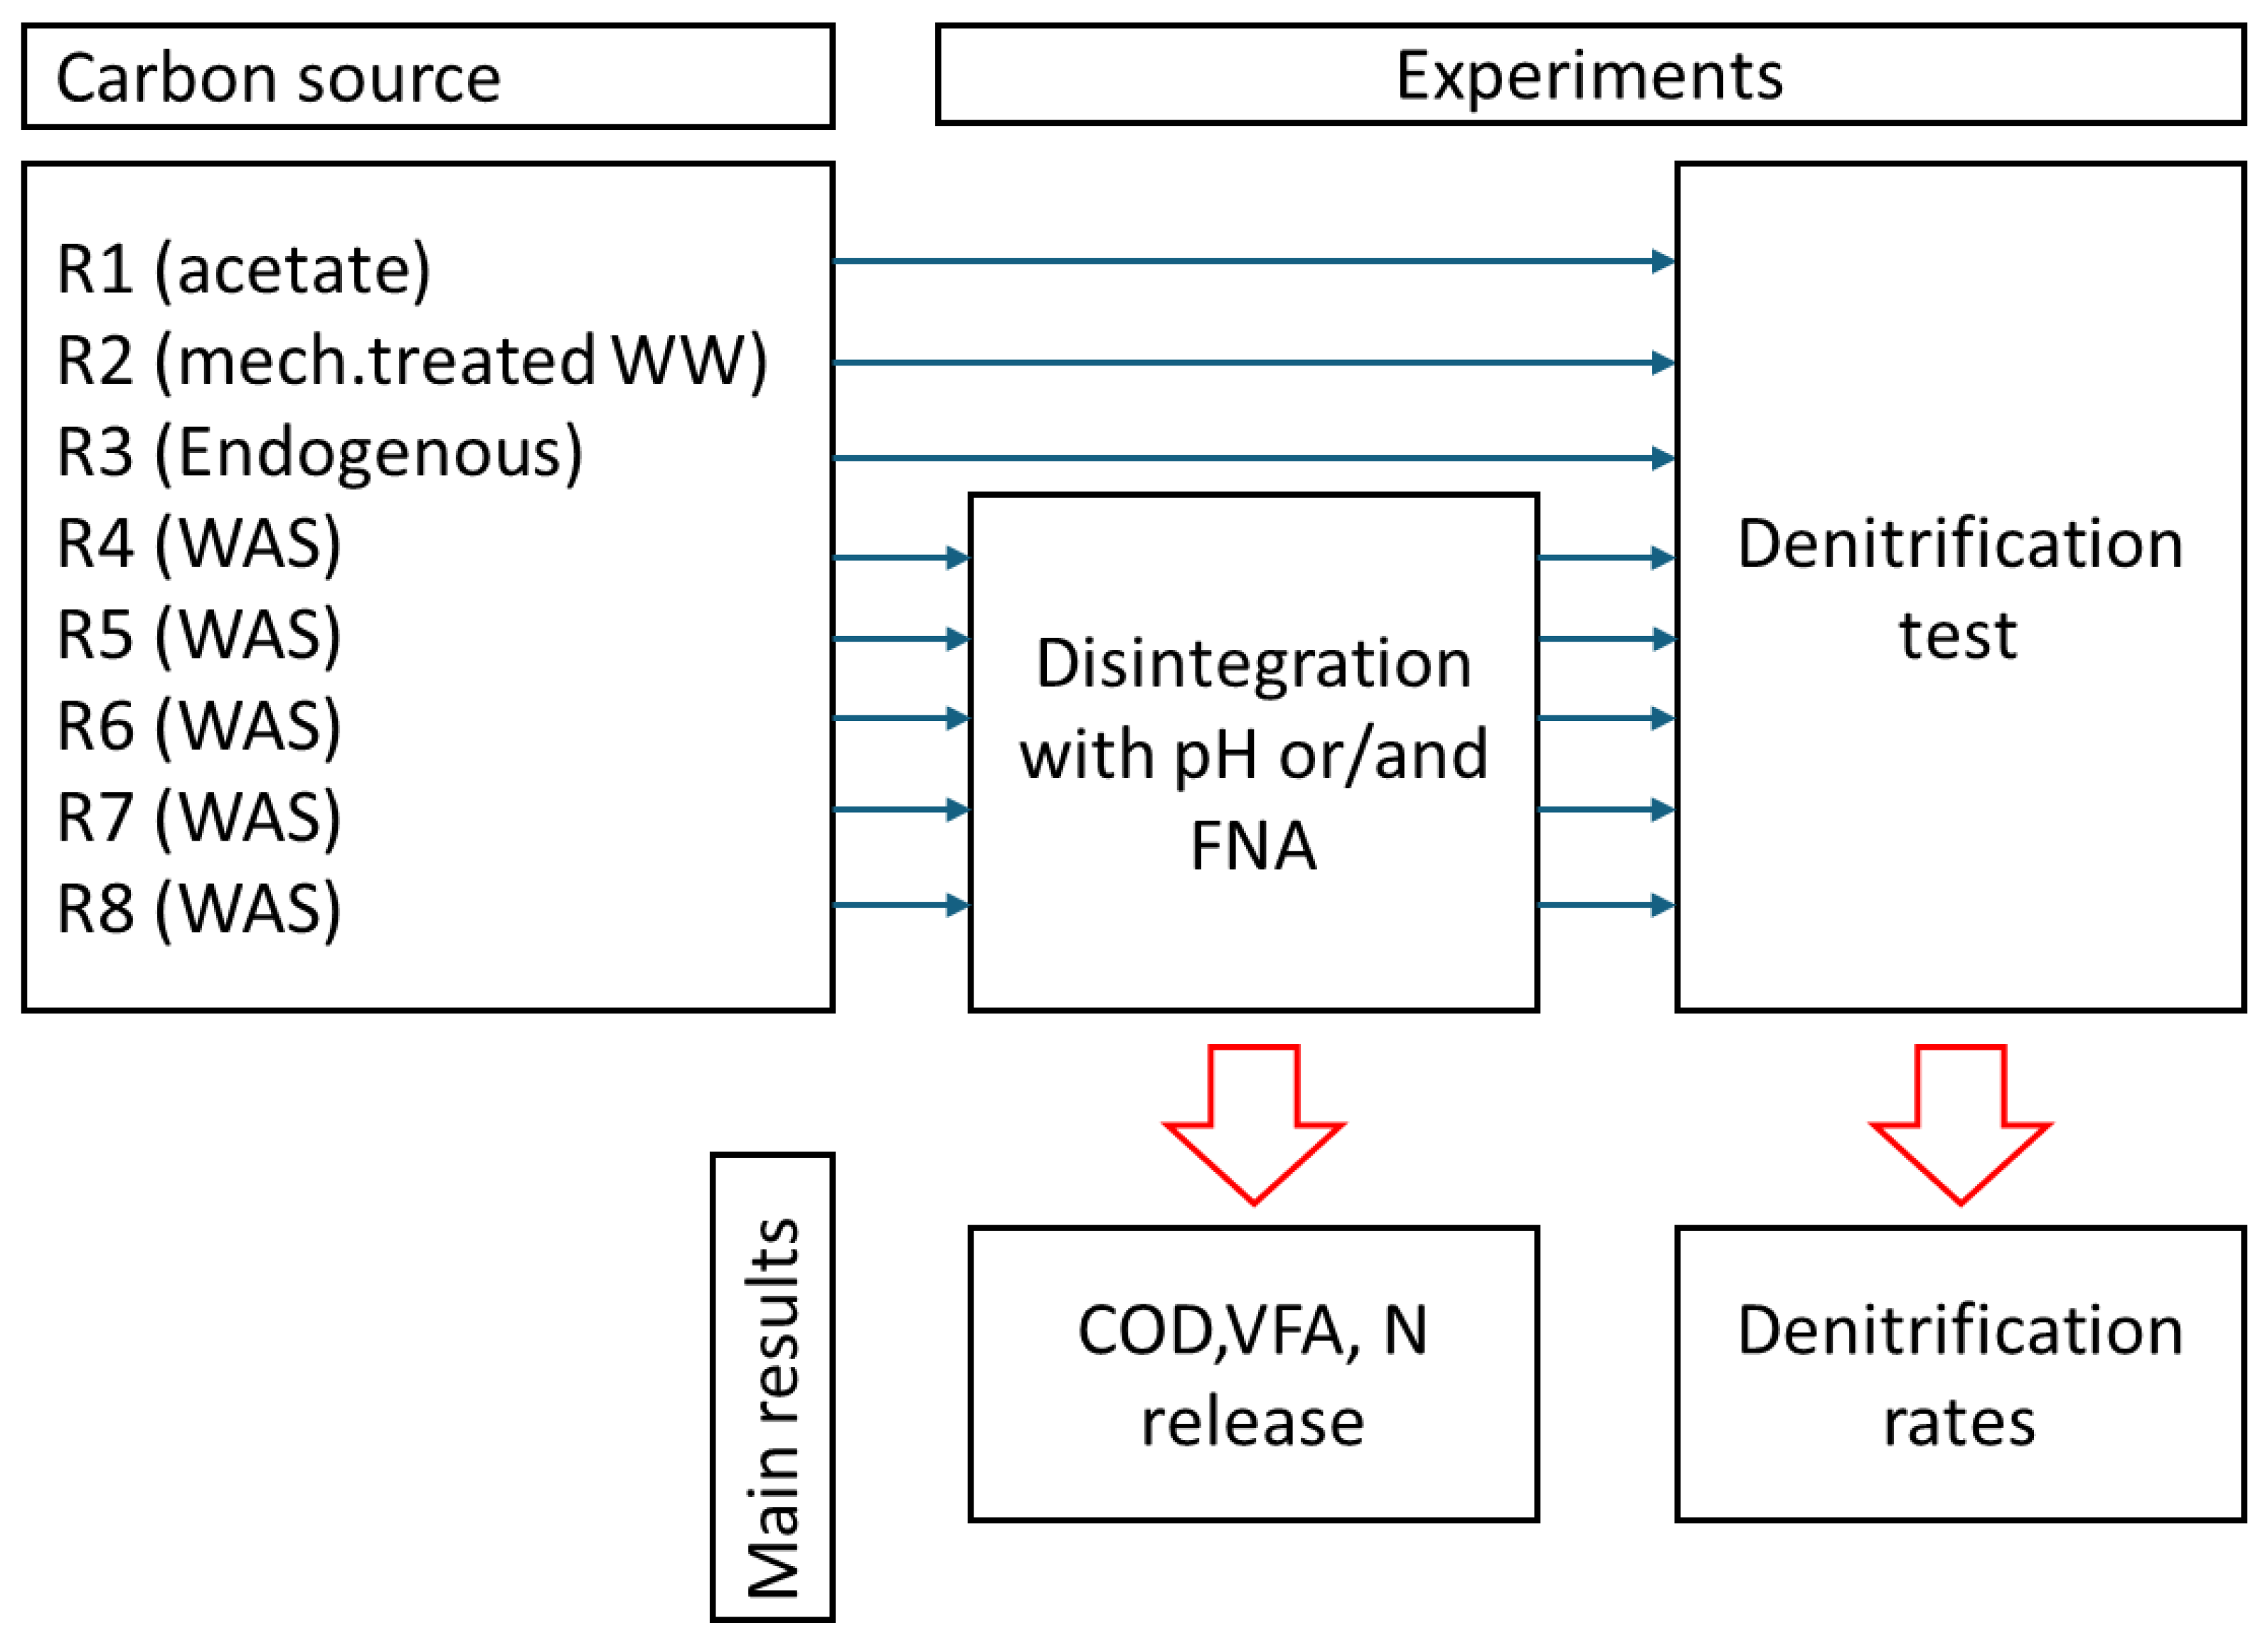
  • Released SCOD is tested as a carbon source for denitrification in the classical activated sludge process. The potential of the obtained carbon sources is evaluated based on NUR and then compared to those obtained for acetate and mechanically treated wastewater. Moreover, the SCOD yield per g of the volatile solids (VS) of the WAS is assessed.
  • The obtained experimental results are used in mass balance calculations and process simulations to show the potential of such an application at the full scale.

2. Materials and Methods

2.1. Wastewater and Sludge Sources

The waste-activated sludge for the disintegration tests, as well as the activated sludge and mechanically treated wastewater for the denitrification tests, were collected from a full-scale wastewater treatment plant (WWTP) in southwest Poland (1,000,000 PE). This WWTP conducts full N and P removal with a sludge retention time (SRT) of 25 days. WAS was harvested from a secondary sludge thickener, activated sludge from the anoxic chamber, and mechanically treated wastewater from the primary settler. The characteristics of the substrates used in this study, including those of the total solids (TS), volatile solids (VS), total chemical oxygen demand (TCOD), soluble chemical oxygen demand (SCOD), and soluble total nitrogen (TN), are presented in Table 1.

2.2. NO2/FNA Disintegrated WAS

The FNA disintegration tests were conducted according to the methodology presented in our previous study [17]. Two concentrations and two retention times were tested (R6-R8; Table S2). In addition, two reference samples (NO2/FNA free) were run parallelly (R4-R5; Table S2). The pH level and nitrite concentration were controlled three times a day and maintained manually with 24% H2SO4 and NaNO2 stock solutions (20 gN/L), respectively. The temperature was recorded during all the tests. The average FNA concentrations presented in Table 2 were calculated according to Equation (1) [18] with regard to the average values of temperature (T), nitrite concentration ( S N O 2 N ), and pH. Immediately after disintegration, the samples were filtrated through a glass fiber filter with a pore diameter of 1.2 µm and then used as a substrate in the denitrification tests.
S H N O 2 N = S N O 2 N 1 + e x p 2300 / ( 273 + T )   ·   10 p H

2.3. Denitrification

The denitrification tests were conducted on supernatants after WAS disintegration (with and without NO2/FNA) (R4-R8; Table 2), as well as on various substrates that were taken as references (R1-R3; Table S2). The activated sludge was collected directly from an anoxic chamber without biomass starvation. This allowed for the simulation of the process conditions, where an external carbon source was added to the real biological reactor. Due to the high SRT (25d), the content of the slowly biodegradable fraction (XS) in the tested sludge was very low. The denitrification tests were conducted in glass reactors with a working volume of 5 L. The reactors were equipped with a mechanical stirrer, pH probe (Endress + Hauser Ceragel CPS76D-7BB21), and oxygen probe (Endress + Hauser COS61D). Before each test, the activated sludge was flushed with nitrogen gas in order to maintain an oxygen concentration below 0.2 mgO2/L. During all the tests, the temperature was controlled at the level recorded in the full-scale chamber (14–18 °C). The denitrification tests were started when the residual nitrite from disintegration (if present) was depleted, as it was assumed that the carbon required for nitrite removal should not be included. The concentration of nitrate at the beginning of each test was maintained by adding KNO3 to reach a level of 35–40 mgN-NO3/L. The volume of the carbon source was calculated for each substrate individually to add 200 mgO2/L. The experiment was conducted at a constant pH of 7.0 ± 0.5 (manually adjusted with HCl 25%). Samples were taken at a time interval of 30 min, with the first sample being taken 5 min after the initial parameters were adjusted. Each sample measured 8.0 mL and was syringed through a glass fiber filter with a pore diameter of 1.2 μm. NURs were calculated on the basis of the decrease in the N-NO3 concentration over time, which was then divided by the grams of the VS. The results were converted according to Equation (2) for a standardized temperature of 20 °C. NUR20 and NURT are the nitrogen uptake rates at the temperature of 20 °C and that at which the test was conducted, respectively. The temperature coefficient was assumed to be equal to θ = 1.072 [19].
N U R 20 = N U R T   ·   θ ( 20 T )

2.4. Analytical Methods

Nitrite, nitrate, ammonium, total nitrogen, and volatile fatty acids (VFAs) were measured using HACH LCK kuvete tests. The chemical oxygen demand (COD), TS, and VS were established according to Standard Methods (2540) [20]. During the disintegration test, the temperature and pH were measured with Hach–Lange LDO and PHC probes, respectively.
The addition of nitrite to the sludge resulted in increased COD results. Therefore, the COD values were corrected using the theoretical oxygen demand for nitrite oxidation. The Standard Methods mention that nitrite exerts a COD of 1.1 mgO2/mgN-NO2 [21]. However, the stoichiometric equation shows that this is precisely 1.14 mg O2/mg NO2-N, and this is the value that was applied.

2.5. Simulation of WWTP Operation

Simulations of WWTP operation were based on the SUMO2 model, which includes phosphorus removal and a two-stage nitrification process [22,23]. All input data are presented in the Supplementary Materials (Table S1). The input parameters were the same for all the scenarios and were taken from a full-scale WWTP, which was the source of the substrates for this study. The influent parameters were the average values recorded during the experimental period. The additional carbon source (WAS disintegration supernatant) was added upstream of anoxic reactor 1, as shown in the WWTP scheme (Figure S2 in the Supplementary Materials). Simulations were run for each WAS disintegration supernatant (R4-R8). A reference simulation (without an additional carbon source) was also performed. Default kinetic parameters were used. The most important kinetic parameters and their values are shown in Table S2.

3. Results and Discussion

Figure 1 presents the scheme of experimental steps, with the main results indicated for each.

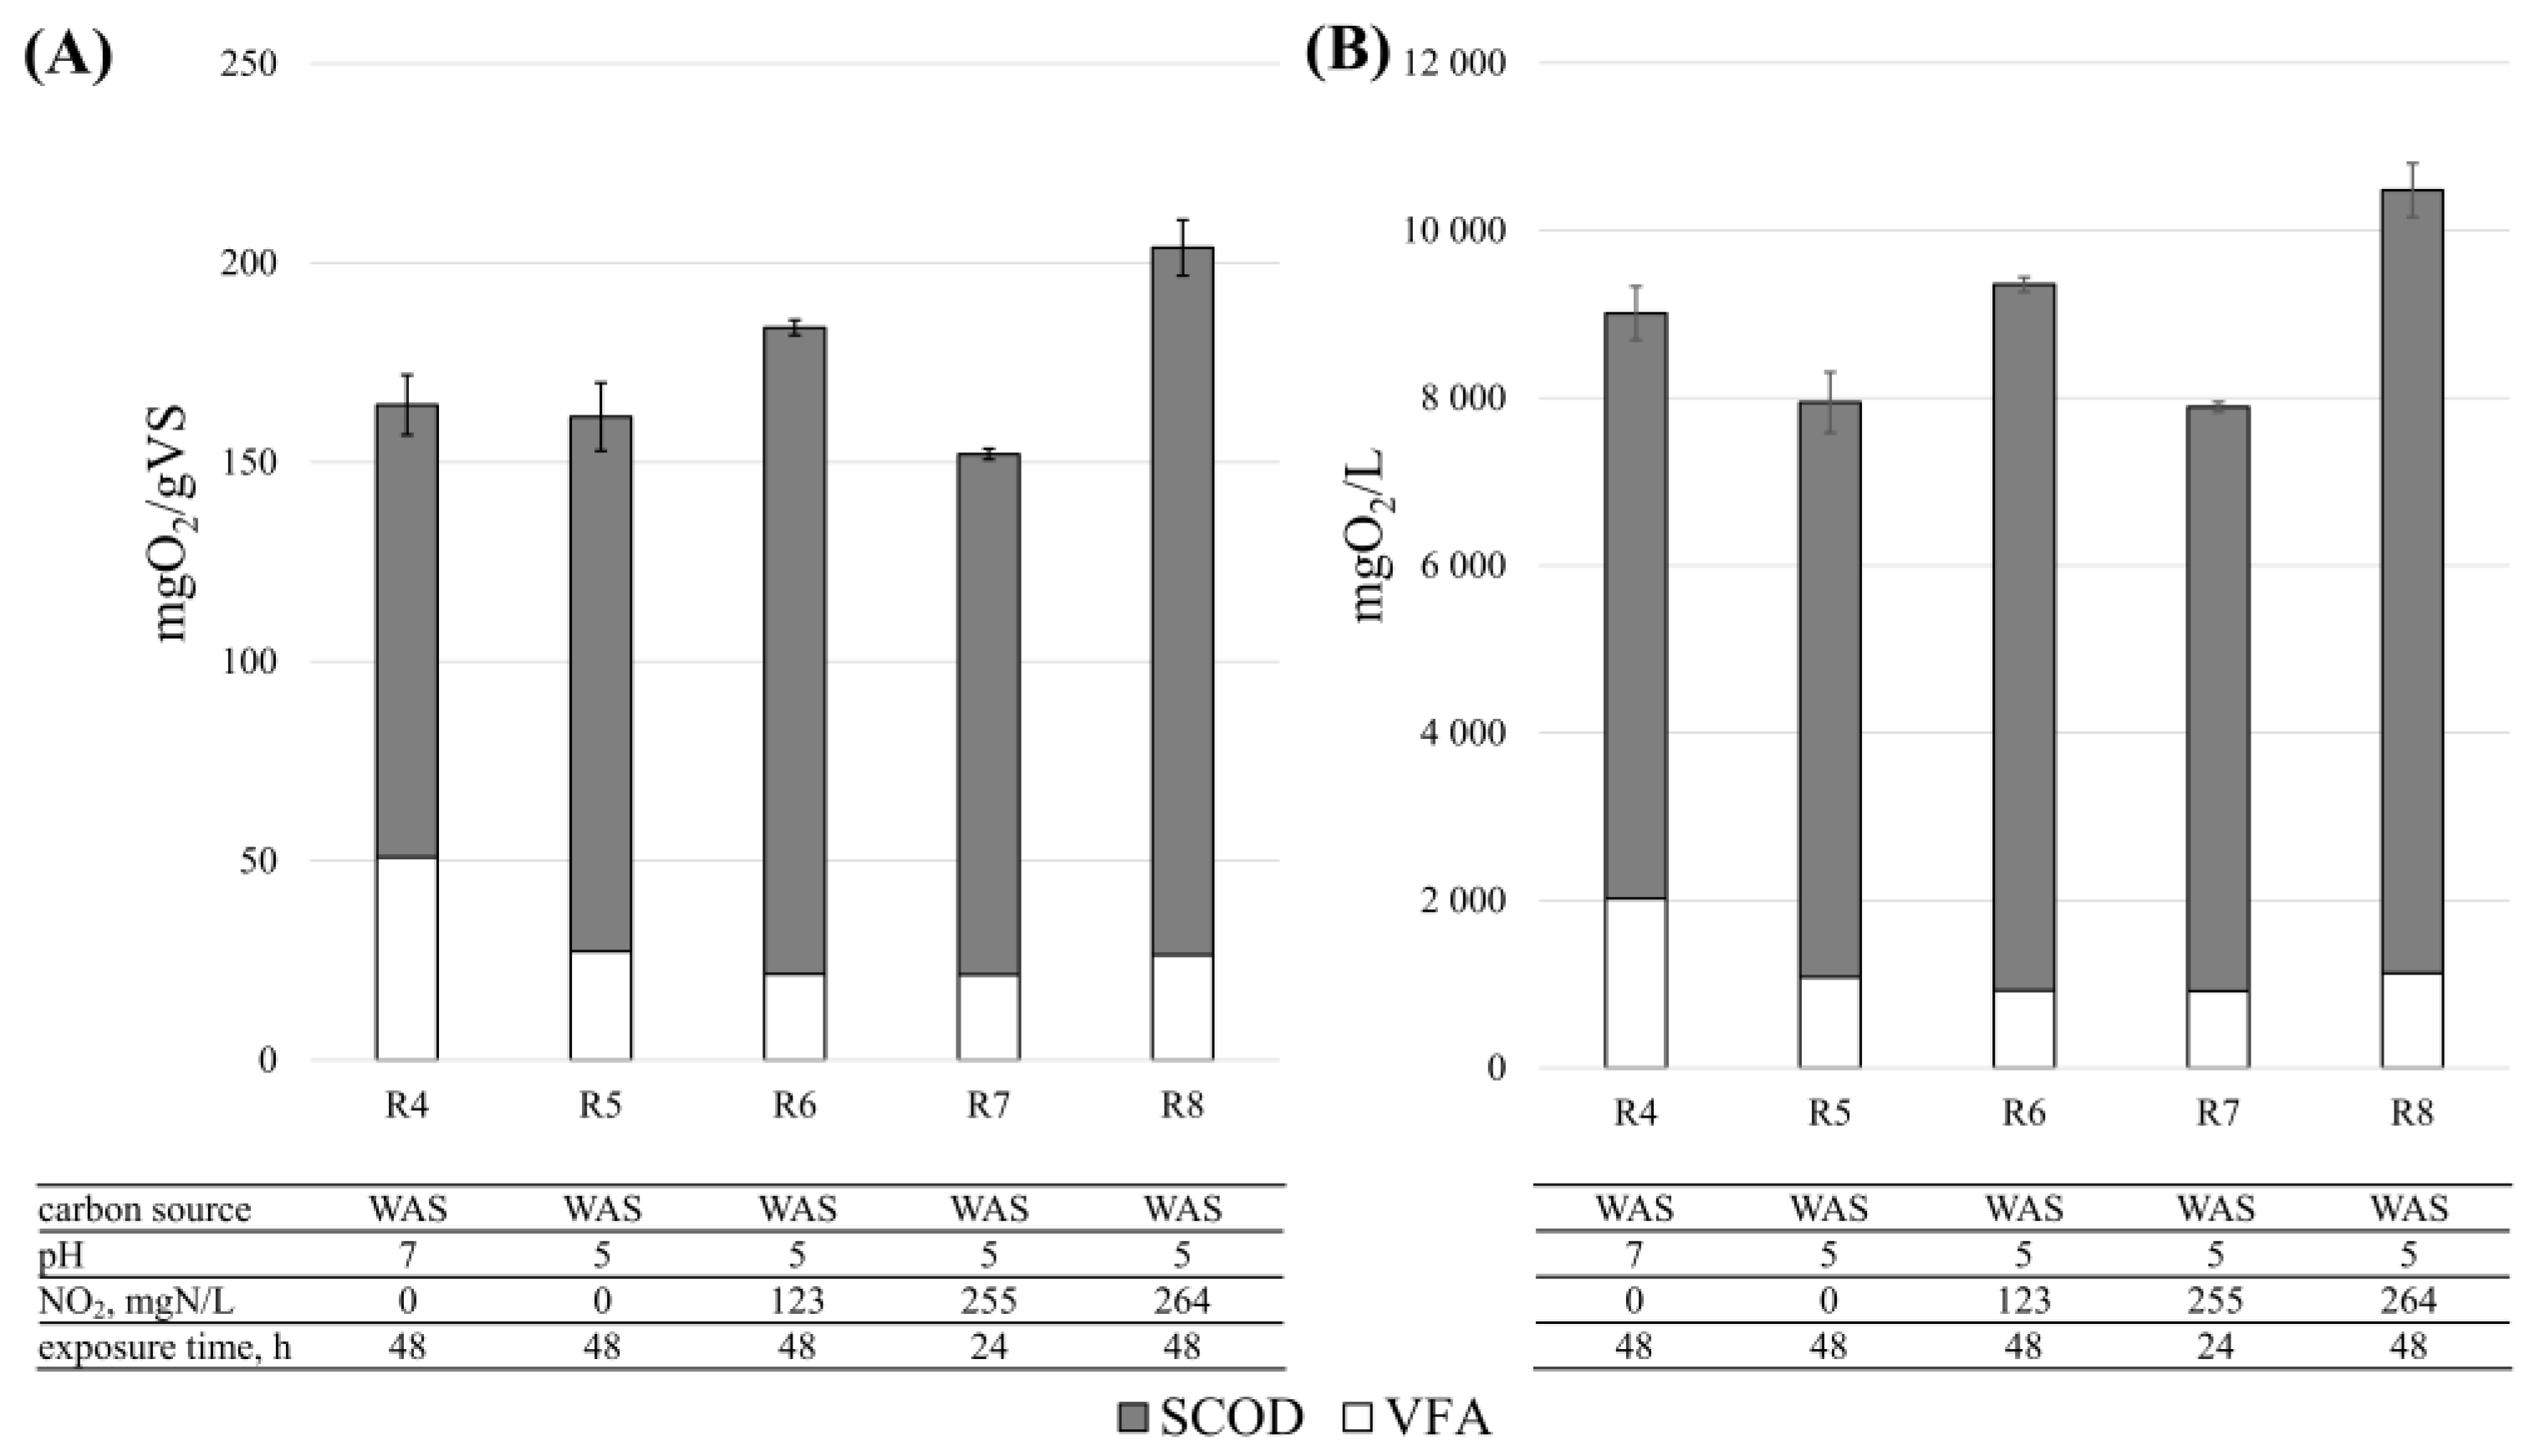
3.1. Disintegration Efficiency—SCOD

The average concentrations of the soluble organic compounds (SCOD and VFA) obtained after the disintegration of WAS (R4-R8) are presented in Figure 2. The exposition of WAS to pH 7 (R4) and 5 (R5) without the addition of nitrite resulted in comparable increases in the SCOD concentration of 160 and 157 mgSCOD/gVS, respectively, which indicated that pH had no influence. The lowest tested NO2/FNA concentration (R6, 123 mgN-NO2/L, pH 5) after 48 h of exposure resulted in a 14% higher SCOD release than when there was only the pH control (R5), which confirms previous studies stating that the implementation of FNA increases the effectiveness of sludge disintegration [17]. The highest SCOD release (200 mgO2/gVS, R8) occurred when the NO2/FNA concentration (264 mgN-NO2/L, pH 5) was in the range reported in the previous study as being most beneficial [17]. The exposure of WAS to a concentration of 255 mgN/L for 24 h resulted in a 25% lower SCOD release when compared to 48 h of exposure to a comparable NO2/FNA concentration (264 mgN/L). This, again, confirms the results of previous studies which indicated that a longer exposure time was beneficial. Moreover, the addition of NO2/FNA could not overcome a shorter retention time, as the value recorded for R7 (255 mgN-NO2/L, pH 5, 24 h) was lower than that observed for the reactors with only pH control (no nitrite addition, but a retention time of 48 h). Overall, the obtained results are in accordance with previous studies, which indicates that the obtained disintegrated streams are reliable [16,17].

3.2. Disintegration Efficiency—Volatile Fatty Acids

VFAs are easily biodegradable organic compounds, and therefore, their significantly higher concentration observed for R4 (pH 7, 48 h) indicates them to be a potentially better carbon source for denitrification than other tested disintegration methods. Much lower values were obtained for all the samples with a pH of 5.0, whether nitrite or FNA were present or not. This may be associated with the addition of small amounts of NaOH to maintain pH 7.0, with numerous studies indicating that alkaline reagents are more effective than acidic reagents in dissolving WAS [24,25]. In a previous study [17], the same influence of pH on VFA release was observed, but only for samples without the addition of NO2/FNA. When NO2/FNA was applied, VFA concentrations rose significantly, especially with very high NO2/FNA concentrations (far above those studied in this paper). Wang et al. also reported the greatest VFA release from WAS when the pH was under 6.4 (without NO2/FNA). The addition of nitrite up to 300 mgN-NO2/L, as well as WAS acidification (pH 5.5), resulted in decreased VFA concentrations [12]. Contrary results were presented by Lu et al., where WAS acidification (pH 5.5) increased VFA release by over 45% when compared to pH 7 (48 h exposure). The addition of nitrite with a pH of 7 increased the VFA concentration by over 100%. However, nitrite with a pH of 5.5 decreased the VFA concentration by nearly 70% when compared to the samples without nitrite [26].
In this study, for all the samples kept under a pH of 5, comparable values of VFA/VS indices (Figure 2A) were obtained. This indicates that the addition of nitrites did not increase the availability of VFAs, at least with the tested NO2/FNA concentrations and exposure times. In our previous study [17], contrary results were observed, which shows the positive impact of an increased NO2/FNA concentration on the release of VFAs. However, the greatest concentrations of VFAs were observed for significantly higher exposure times and NO2/FNA concentrations than those tested in this study. After 48 h of exposure, the concentrations of VFAs were similar for all the tested FNA concentrations up to 6.2 mgN-HNO2/L. However, these values were approximately twice as high as those observed for the reference reactor (pH 5) [17]. These discrepancies between the results obtained in this and previous studies might be associated with differences in the composition of the WAS.
It is worth mentioning that NO2/FNA disintegration of WAS resulted in a VFA/SCOD ratio in the range of 12–14%. WAS exposure to pH 7 and 5 without the addition of nitrite significantly increased the VFA/SCOD ratios to 31 and 17%, respectively. This indicates that WAS disintegration without the addition of nitrite results in low SCOD release; however, the content of easily biodegradable VFA in SCOD remains relatively high. NO2/FNA disintegration of WAS may increase the level of SCOD solubilization, but the content of VFA in it may be lower. This is confirmed by the results of our previous studies, where nitrite concentrations of up to 2000 mgN-NO2/L resulted in VFA/SCOD ratios in the range of 8–15%. The same WAS exposed to pH in the range of 5.5 to 6.7 resulted in 17–32% VFA/SCOD ratios. Concentrations over 2000 mgN-NO2/L resulted in increased VFA/SCOD ratios of up to 24%. Moreover, pH levels lower than 5.5 led to VFA/SCOD ratios under 10% [16,17].

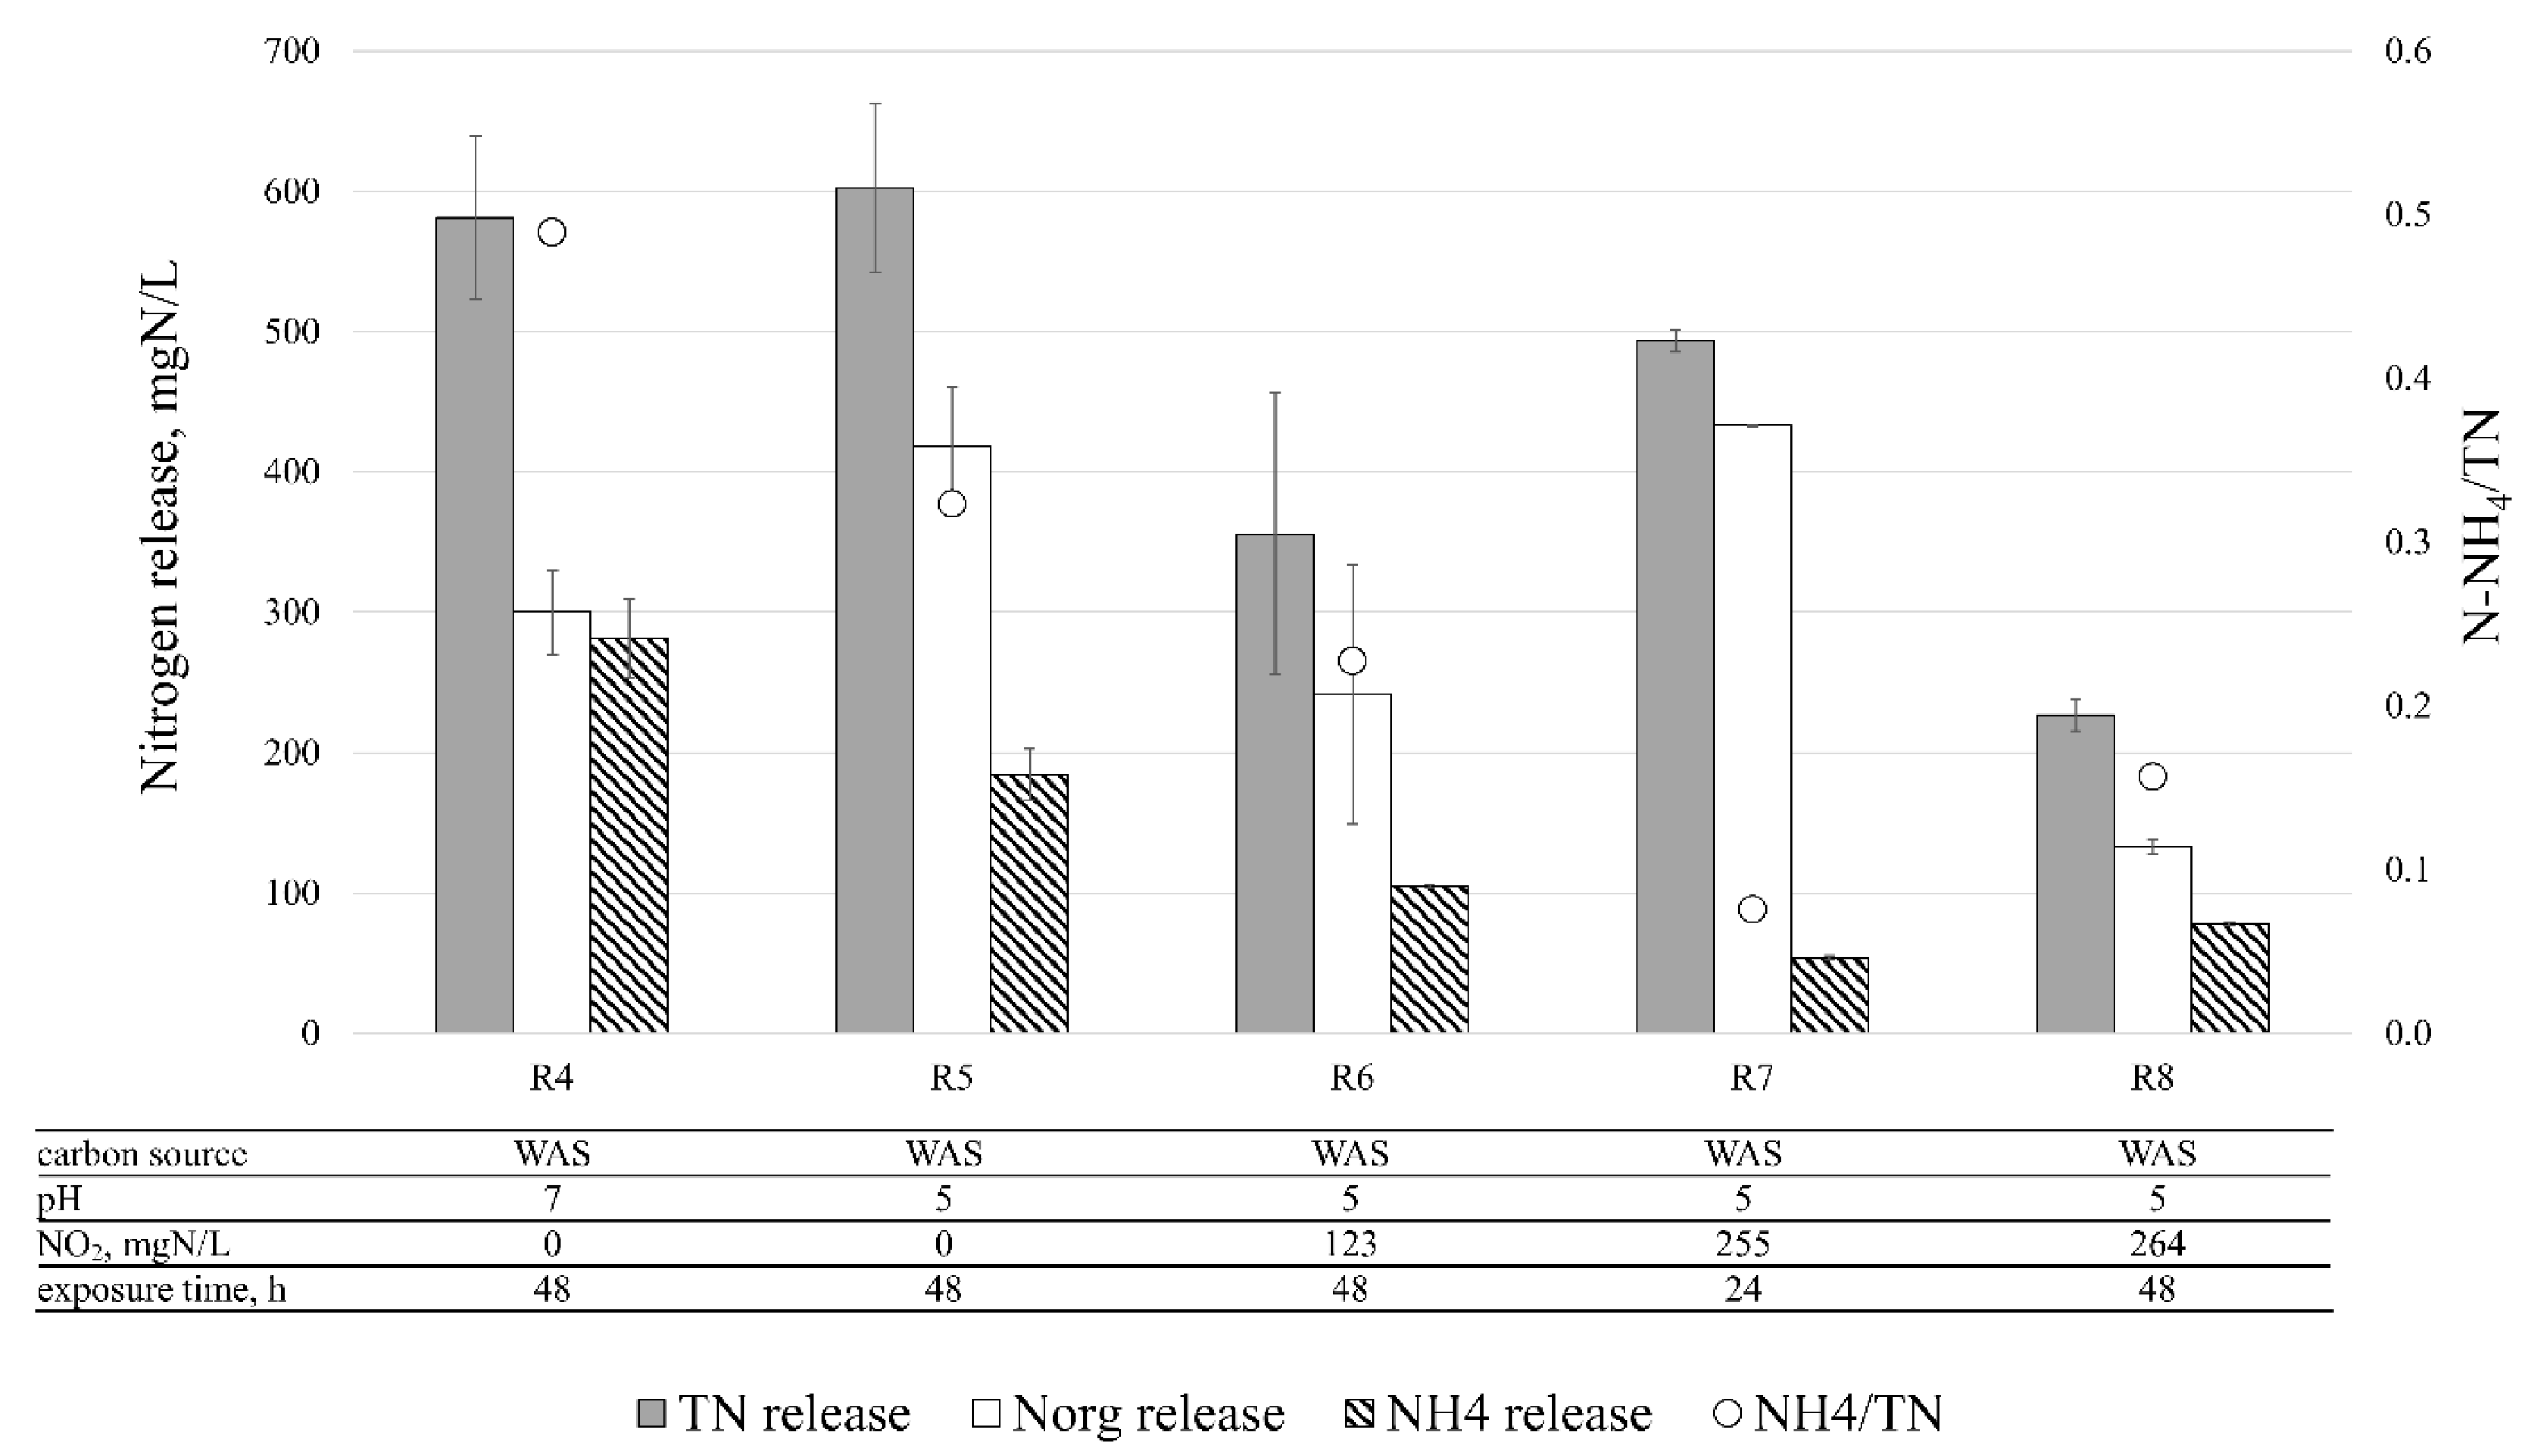
3.3. Disintegration Efficiency—Nitrogen

NO2/FNA disintegration of WAS resulted in significantly increased concentrations of soluble nitrogen forms, as presented in Figure 3. The observed trends varied from those obtained for SCOD and VFA (Figure 2). Generally, the released TN concentrations were lower for the reactors with the addition of NO2/FNA (48 h exposure) when compared to R4 and R5 (no NO2/FNA). The exception is R7, where WAS exposed to 5.8 mgN-HNO2/L for 24 h released a TN concentration that was greater than R8 by over 100% (264 mgN-NO2/L, pH 5, 48 h). Disintegration without the addition of nitrite resulted in a comparable TN release at pH 7 (R4) and 5 (R5) of approximately 600 mgN/L. However, pH 7 (R4) was close to being optimal for the ammonification process and brought about the greatest ammonium release, and consequently an N-NH4/TN ratio of about 0.5. WAS exposure to pH 5 (R5) resulted in a lower ammonium and a higher organic nitrogen release by 35% and 39%, respectively. The addition of nitrite caused further inhibition of the microorganisms conducting the ammonification process, with the greatest effect being observed for 255 mgN-NO2/L (R7, pH 5, 24 h). An extended exposure time from 24 h to 48 h (R8) allowed for the acclimatization of microorganisms to the presence of NO2/FNA and increased the N-NH4/TN ratio from 0.08 (R7) to 0.16 (R8).
The SCOD/TN ratio is an important factor when considering external carbon sources for denitrification in the mainstream of a WWTP. For the supernatants after WAS disintegration, the SCOD/TN ratios were 9 (R7), 11 (R4, R5), and 18 (R6, R8). These values were lower than those reported as being favorable for carbon sources to enhance nitrogen removal (25–30 SCOD/TN) [2], but substantially higher than the COD demand for denitrification, which is 2.86 gCOD/gN. The addition of nitrogen to activated sludge leads to the necessity of its nitrification (enhanced oxygen demand) and further denitrification (enhanced COD demand). Assuming 2.86 gSCOD per denitrification of each gN, approximately 16–17% (R6, R8), 26–27% (R4, R5), and 31% (R7) of SCOD will be used for denitrification of the TN released during disintegration, with the remaining part still being available for denitrification of nitrogen from inflowing wastewater. However, it should be noted that if WAS is anaerobically digested instead of being used as an external carbon source, the same amount of nitrogen will be released and subjected to nitrification and denitrification in the WWTP mainstream.

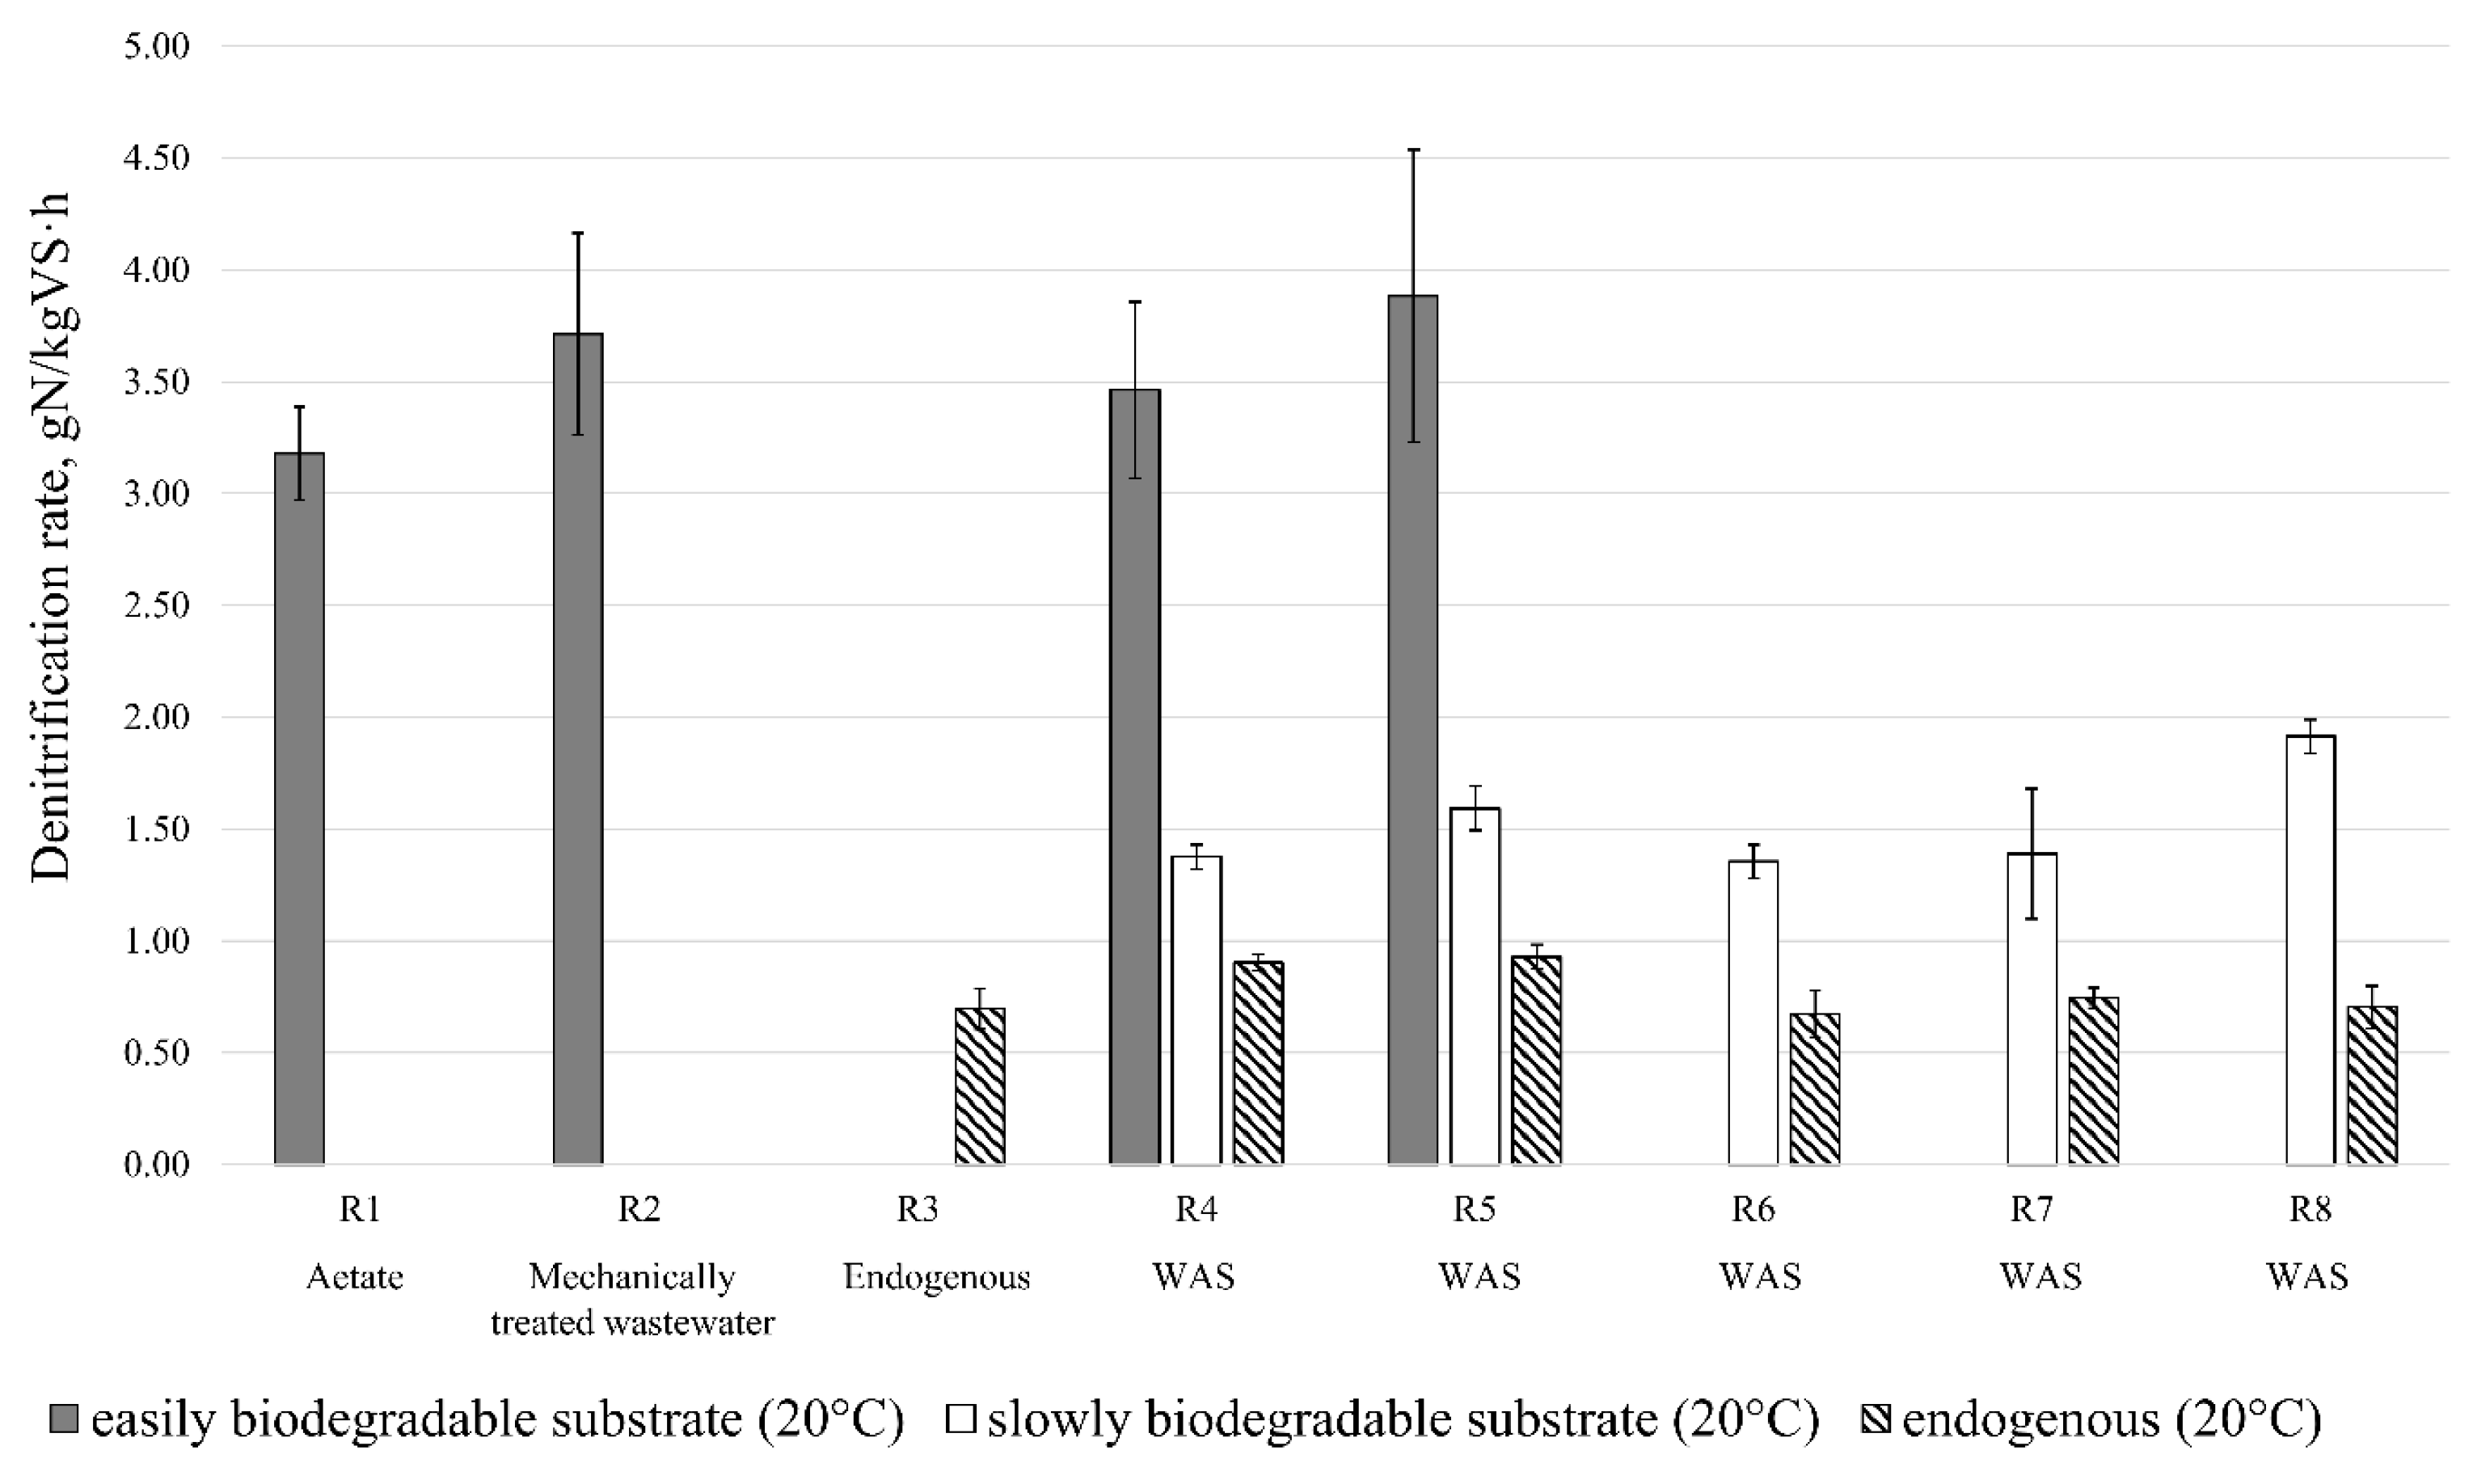
3.4. Denitrification—Process Rates

3.4.1. Reference Substrates

A typical carbon source for the denitrification process at a WWTP is mechanically treated wastewater, and as an external carbon source, acetate is commonly used. When these substrates are exhausted, endogenous denitrification may still be occurring, but at a much lower rate. Therefore, when evaluating the potential of WAS disintegration, supernatants such as carbon sources, acetate, mechanically treated wastewater, and endogenous substrate were used as the references. The average NUR obtained for the mechanically treated wastewater amounted to 3.7 ± 0.5 gN/kgVS · h (Figure 4). This value was within the wide range of nitrogen utilization rates (3.0–7.3 gN/kgVS · h) reported in the literature for mechanically treated wastewater [27,28,29].
In this study, acetate resulted in a NUR value in the lower range of the values found in the literature (3.2 ± 0.2 gN/kgVS · h). Additionally, this value was slightly lower than that obtained for the mechanically treated wastewater (R2). The probable reason for the differences in NUR, which, in this study, were observed between the R1 and R2 reactors, was the adaptation of the activated sludge microorganisms to mechanically treated wastewater (as a carbon source). The phenomenon of biomass adaptation and its positive influence on NUR have been reported elsewhere [30].
The lowest NURs were provided by endogenous carbon sources and amounted to an average of 0.7 ± 0.1 gN/kgVS · h. This does not deviate from other literature values, which cover the range of 0.6–2.2 gN/kgVS · h [28,31,32,33].
According to the range of nitrogen uptake rates obtained for both easily biodegradable reference substrates, NUR above 2.9 gN/kgVS · h (the lowest recorded NUR for acetate) was assumed to be characteristic of easily biodegradable organic compounds for further analyses. Values of approximately 0.8 gN/kgVS · h (the highest recorded NUR for the endogenous substrate) and below were considered in further analyses to be typical for endogenous carbon sources. In contrast, intermediate NURs between 0.8 and 2.9 gN/kgVS · h were determined as being representative of slowly biodegradable organic matter.

3.4.2. Disintegration Products

The obtained nitrogen uptake rates for the disintegration products are shown in Figure 4. Nitrate removal curves for both supernatants obtained after WAS disintegration without NO2/FNA (R4 and R5) were characteristic of complex carbon sources, where both easily and slowly biodegradable fractions could be detected (R4 as an example—Figure S1). This indicates the presence of easily biodegradable organic compounds released during WAS disintegration.
The reaction rates based on Ss substrates (R4 and R5) were comparable to the values observed for the reference carbon sources (R1 and R2) and amounted to 3.2–4.5 gN/kgVS · h. However, in both cases, the availability of easily biodegradable organic matter was rather low, and this source was depleted within two sampling times: 0–60 min. The consumption of easily biodegradable carbon sources was followed by a phase of the experiment with 2–3 times lower NUR, which indicated the presence of slowly biodegradable substrates (XS). XS nitrogen uptake rates ranged from 1.3 to 1.7 gN/kgVS · h. After the depletion of XS, an endogenous phase was observed with significantly lower process rates (0.9–1.0 gN/kgVS · h).
Easily biodegradable substrates were not observed during the denitrification process when supernatants were used as the carbon sources for nitrate removal after WAS exposition to FNA (Figure 4). This is associated with lower VFA-to-SCOD ratios (Figure 2), as well as the need to denitrify nitrites remaining after the disintegration process (measurements of NUR were started after depletion of residual nitrite, as explained in Section 2.3).
The residual nitrite concentrations observed in the reactors prior to the denitrification tests were approximately 1.4 (R6), 5.1 (R7), and 4.8 mgN-NO2/L (R8), and their denitrification required about 8 (R6), 32 (R7), and 30 mgCOD/L (R8). Please note that nitrite, as well as the SCOD and VFA concentrations found in the denitrification reactors, were much lower than those sustained in the disintegration tests due to the dilution of supernatants. According to stoichiometry, the VFA concentrations observed in the denitrification reactors at the beginning of the denitrification tests were close to those required for nitrite denitrification in each test and amounted to approximately 23, 28, and 26 mg COD/L for R6, R7, and R8, respectively. Therefore, it was assumed that the easily biodegradable organic matter released during the NO2/FNA disintegration of WAS was sufficient for nitrite removal, but its availability was too low to be observed during the denitrification tests.
The greatest process rate (1.92 gN/kgVS · h) for slowly biodegradable substrates was recorded for the highest tested NO2/FNA concentration and exposure time (R8, 264 mgN-NO2/L, pH 5, 48 h). For the other tested NO2/FNA concentrations (R6, R7), denitrification of the slowly biodegradable carbon source resulted in comparable average process rates of approximately 1.4 gN/kgVS · h. The origin of the differences is unknown. The endogenous process rates recorded when slowly biodegradable substrates were depleted were similar for all the tests (R6, R7, R8) and amounted to approximately 0.7 gN/kgVS · h, the value recorded for the reference substrate.
Guo et al. [34] tested carbon sources based on liquids obtained from WAS disintegration using thermal and acid hydrolysis. The resulting NURs were comparable with those obtained in this study for easily biodegradable substrates and amounted to 2.8 (thermal hydrolysis liquid) and 3.2 gN/kgVS · h (acidogenic liquid). Zhang et al. (2020) reported significantly higher NUR (5.4 gN/kgVS · h in 20 °C, θ = 1.072) for SS for a carbon source obtained as a result of WAS disintegration with a composite ferrate solution. However, Zhang et al. [2] did not provide any specific data on WAS parameters, and it is therefore difficult to assess whether the differences were due to different disintegration methods or peculiar WAS characteristics (e.g., a low SRT).

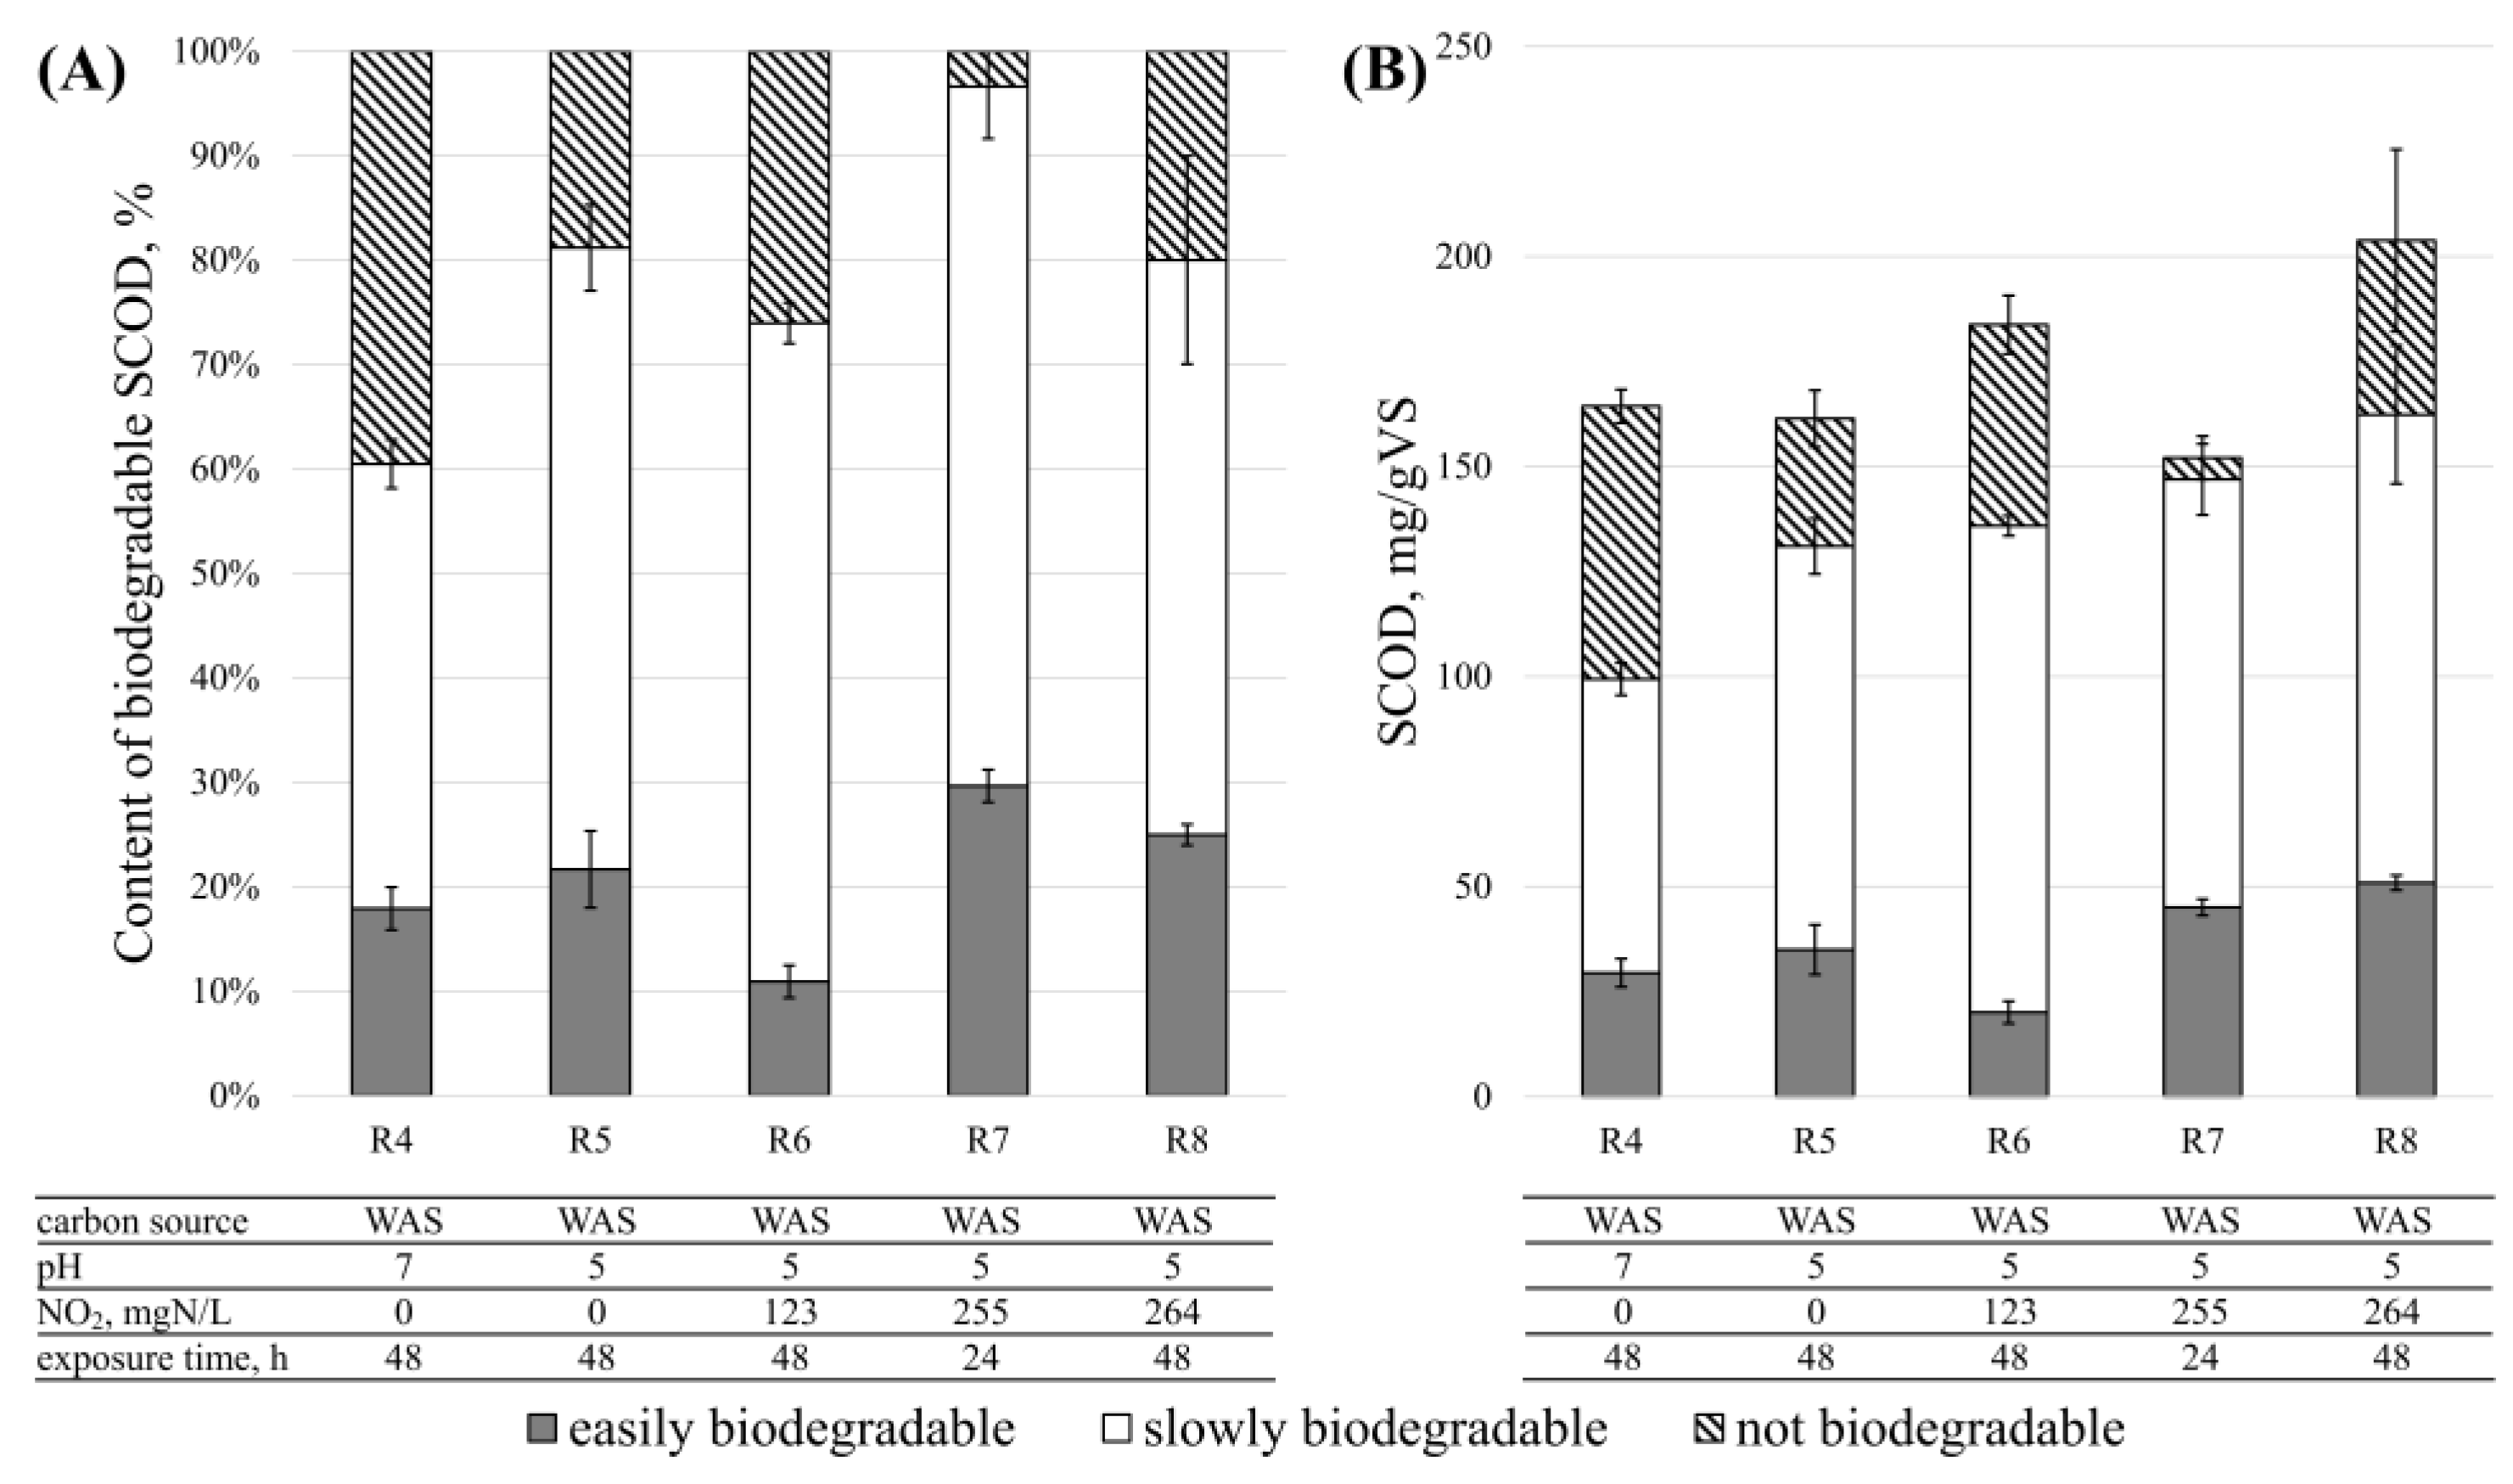
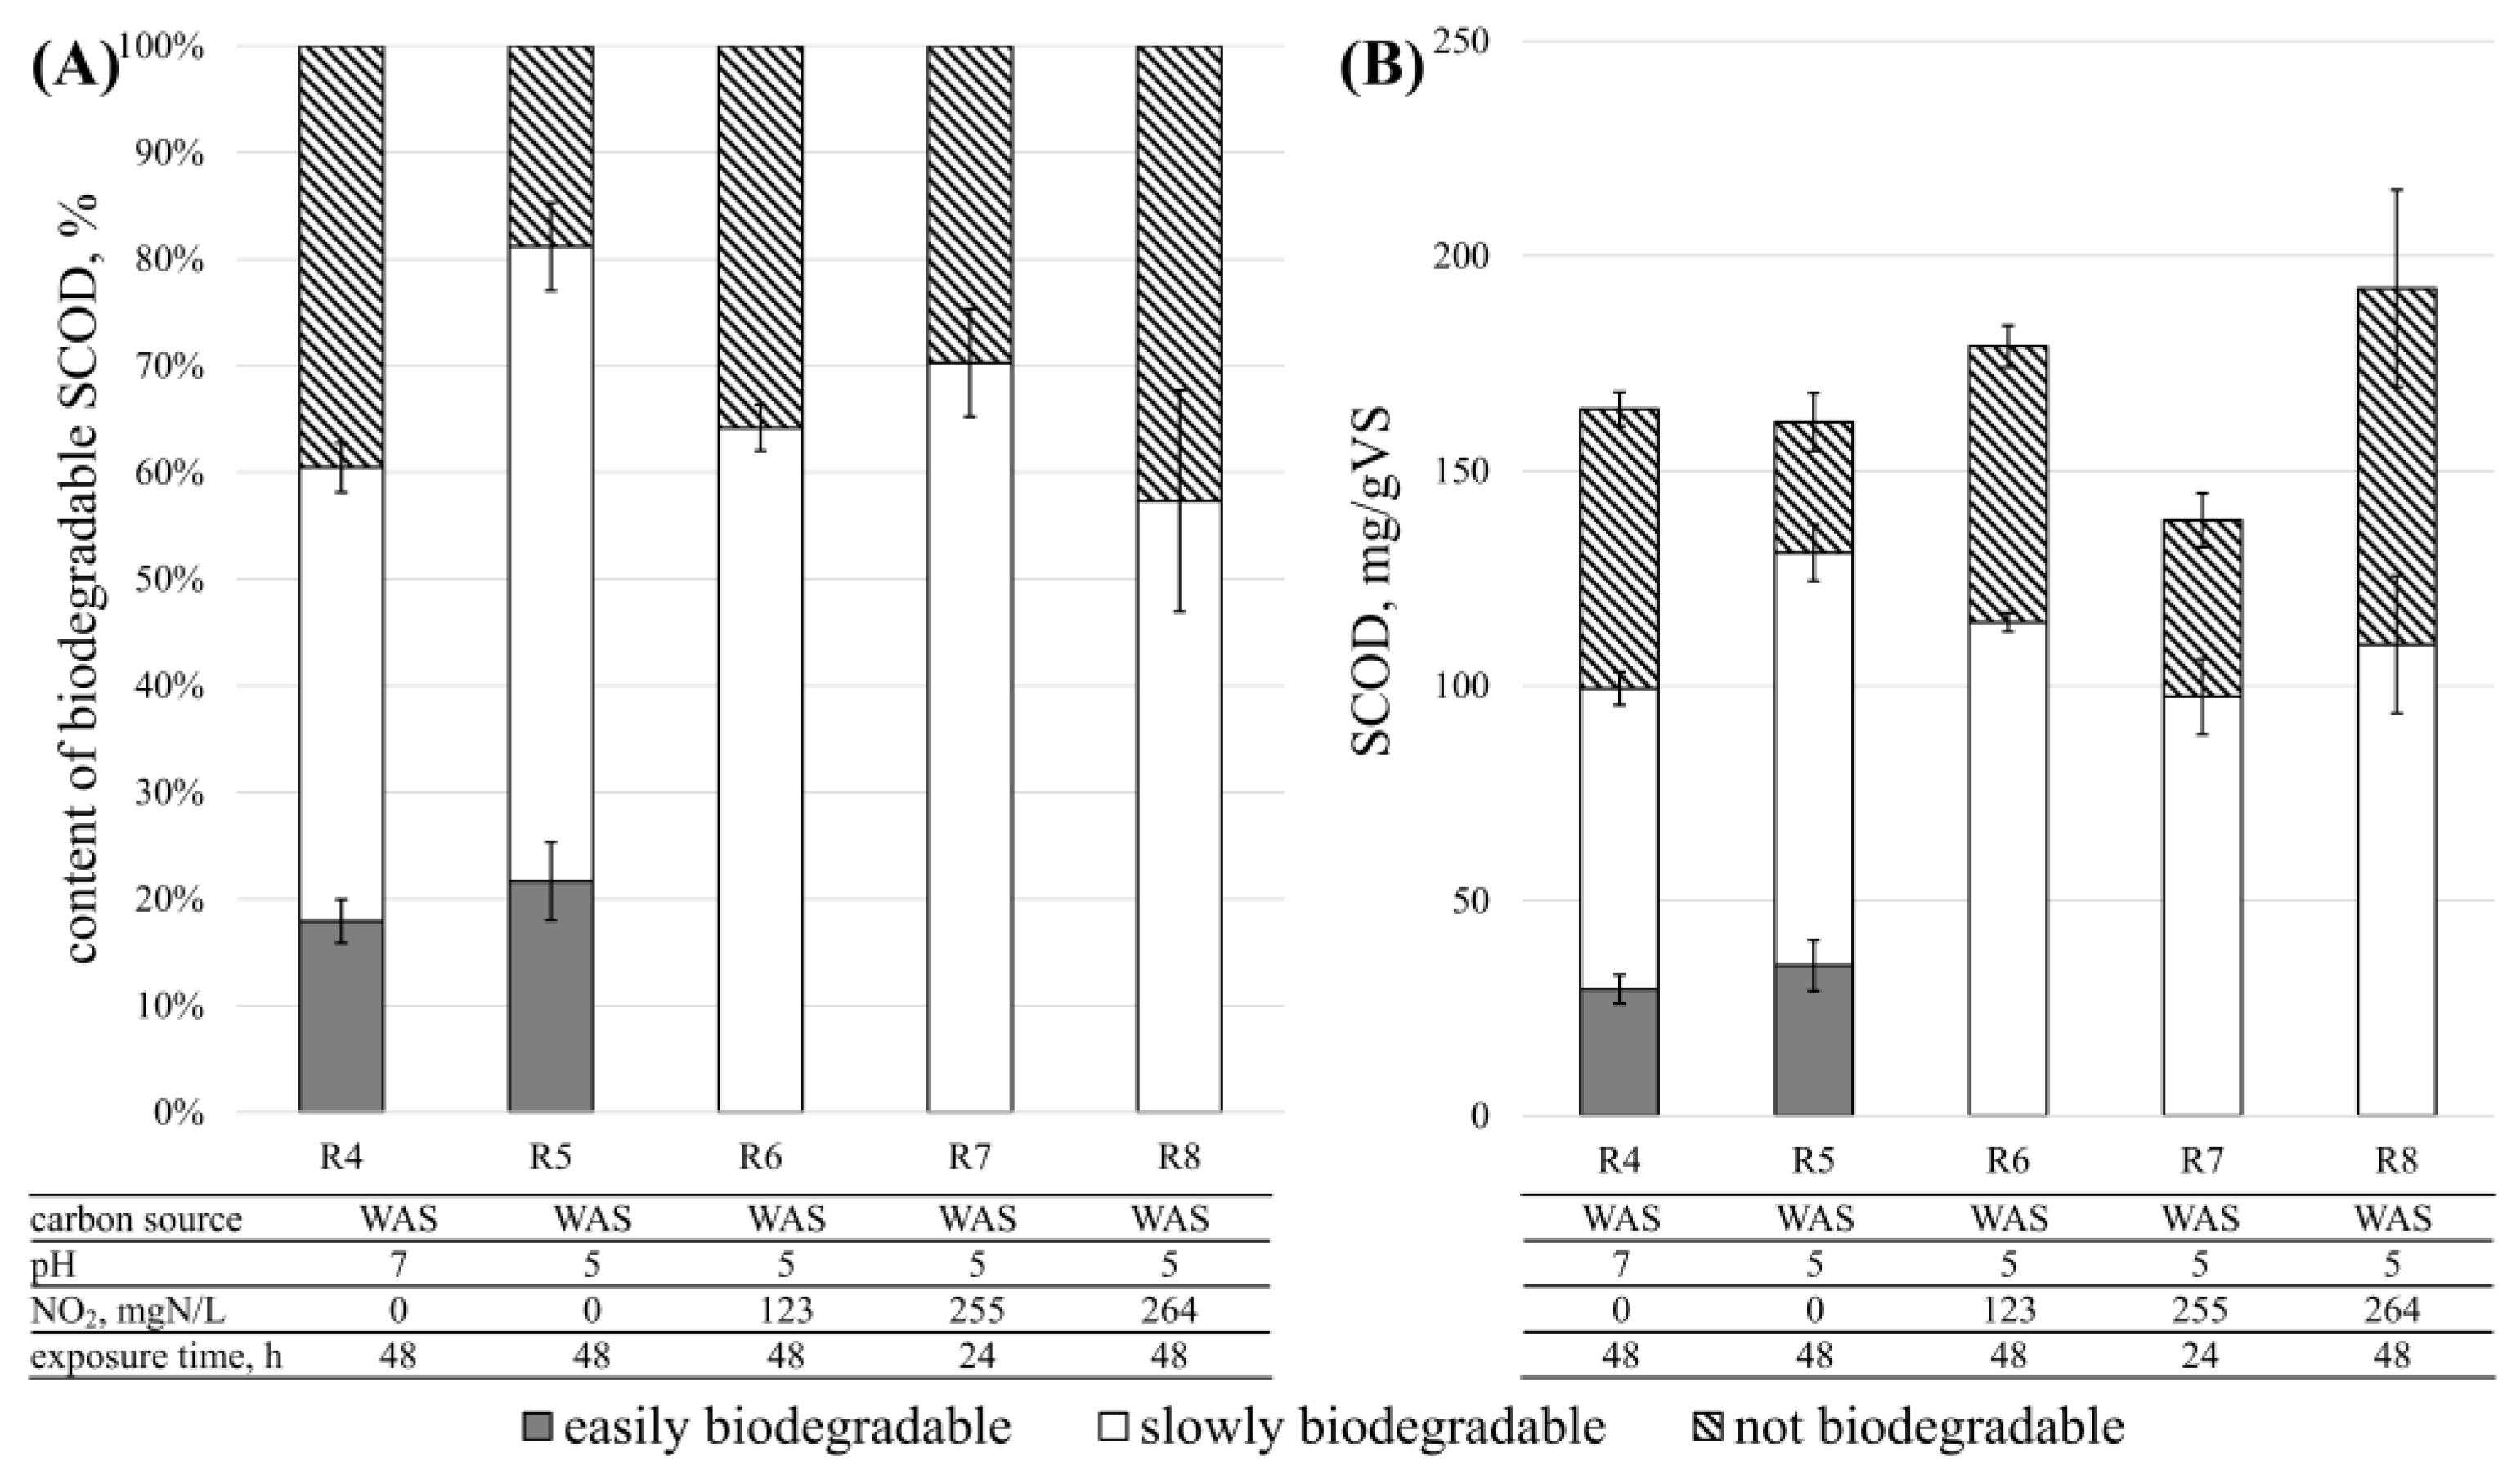
3.5. Denitrification—The Biodegradability of Disintegration Products

The content of the easily and slowly biodegradable compounds in the tested carbon substrates was determined based on the recorded consumption of the nitrates and the calculated NURs. The average values, with standard deviations, are presented in Figure 5. Note that for R6-R8, the content of the easily biodegradable fraction was assessed based on the residual nitrites, as that fraction was not detected directly in the NUR tests (see Section 3.4.2).
As a result, 60–97% (or 99–162 mgO2/gVS) of the total SCOD released during disintegration was biodegradable under anoxic conditions. This is consistent with other disintegration methods. For example, Mancuso et al. demonstrated that, during the disintegration of WAS (hydrodynamic cavitation), biodegradable SCOD (measured under aerobic conditions) increased with a rise in SCOD and ranged from approximately 50 to 75% of the SCOD concentration [35].
The conditions in R4 resulted in the lowest SCOD biodegradability (both in mgO2/gVS and percentage). In all instances except R4 (pH 7, no NO2/FNA), it can be assumed that more than 70% of the released SCOD was biodegradable. A lower pH and the presence of NO2/FNA in the remaining reactors led to an overall increase in the biodegradable fraction; however, for reactors R5 and R6, it was only the slowly biodegradable fraction that increased. Moreover, this additional yield was fully consumed during the denitrification of the residual nitrites (Figure 6). Considering the potential use of WAS disintegration to produce a carbon source for denitrification, NO2/FNA does not seem favorable. It leads to a lack of an easily biodegradable organic carbon source and consequently enables a process rate two to three times lower than that of mechanically treated wastewater or acetate. Compared to WAS which is not pretreated, NO2/FNA increases the availability of biodegradable organic carbon for denitrification [15], but the characteristics of these compounds do not allow such a substrate to be used as an alternative to acetate. Guo et al. (2017), who used thermal and acidic disintegration, reported greater availability of SS in hydrolysis liquid (after the disintegration of WAS). This in turn enabled larger amounts of N-NOx (approximately 17 mgN-NOx/L) to undergo denitrification when compared to the results of this study [32]. There is no significant effect of exposition time on the biodegradability of released SCOD (Figure 5B R7 vs. R8); a longer exposition time results in a higher SCOD release, but more importantly, the additional SCOD is nonbiodegradable. Furthermore, there is no effect of a higher NO2/FNA concentration on available SCOD for denitrification in the mainline (Figure 6). Exposure to a higher NO2/FNA concentration results in a higher biodegradable SCOD release (Figure 5B R6 vs. R8); however, this gain is fully consumed during the denitrification of the residual nitrites. Please note that if the NO2/FNA solution is created in situ from digester liquor and no side-stream deammonification is present, the removal of residual nitrites also contributes to a lower nitrogen load to the mainline.
When comparing the easily biodegradable fraction contents (Figure 5B) with the VFA measurements (Figure 2A), it can be seen that VFA constituted 50–70% of the total easily biodegradable fraction for R5-R8. The only exception is R4, where the VFA content was clearly overestimated (compare Figure 2A and Figure 5). Generally, it can be assumed that, on average, 35 mgO2/gVS of the easily biodegradable fraction is released during disintegration, with at least half of that being VFA.
Additionally, on average, 100 mgO2/gVS of the slowly biodegradable fraction was released. Although the concentration of the total SCOD obtained after the disintegration process was the greatest for R8 (264 mgN-NO2/L, pH 5, 48 h), amounting to over 200 mgO2/gVS, nearly half of that (45%) was not available for denitrification in the mainline (Figure 6A). Nitrogen uptake rates lower than that for the acetate attained for supernatants after WAS disintegration were also reported by Walczak et al. when using the hydrodynamic method [27].

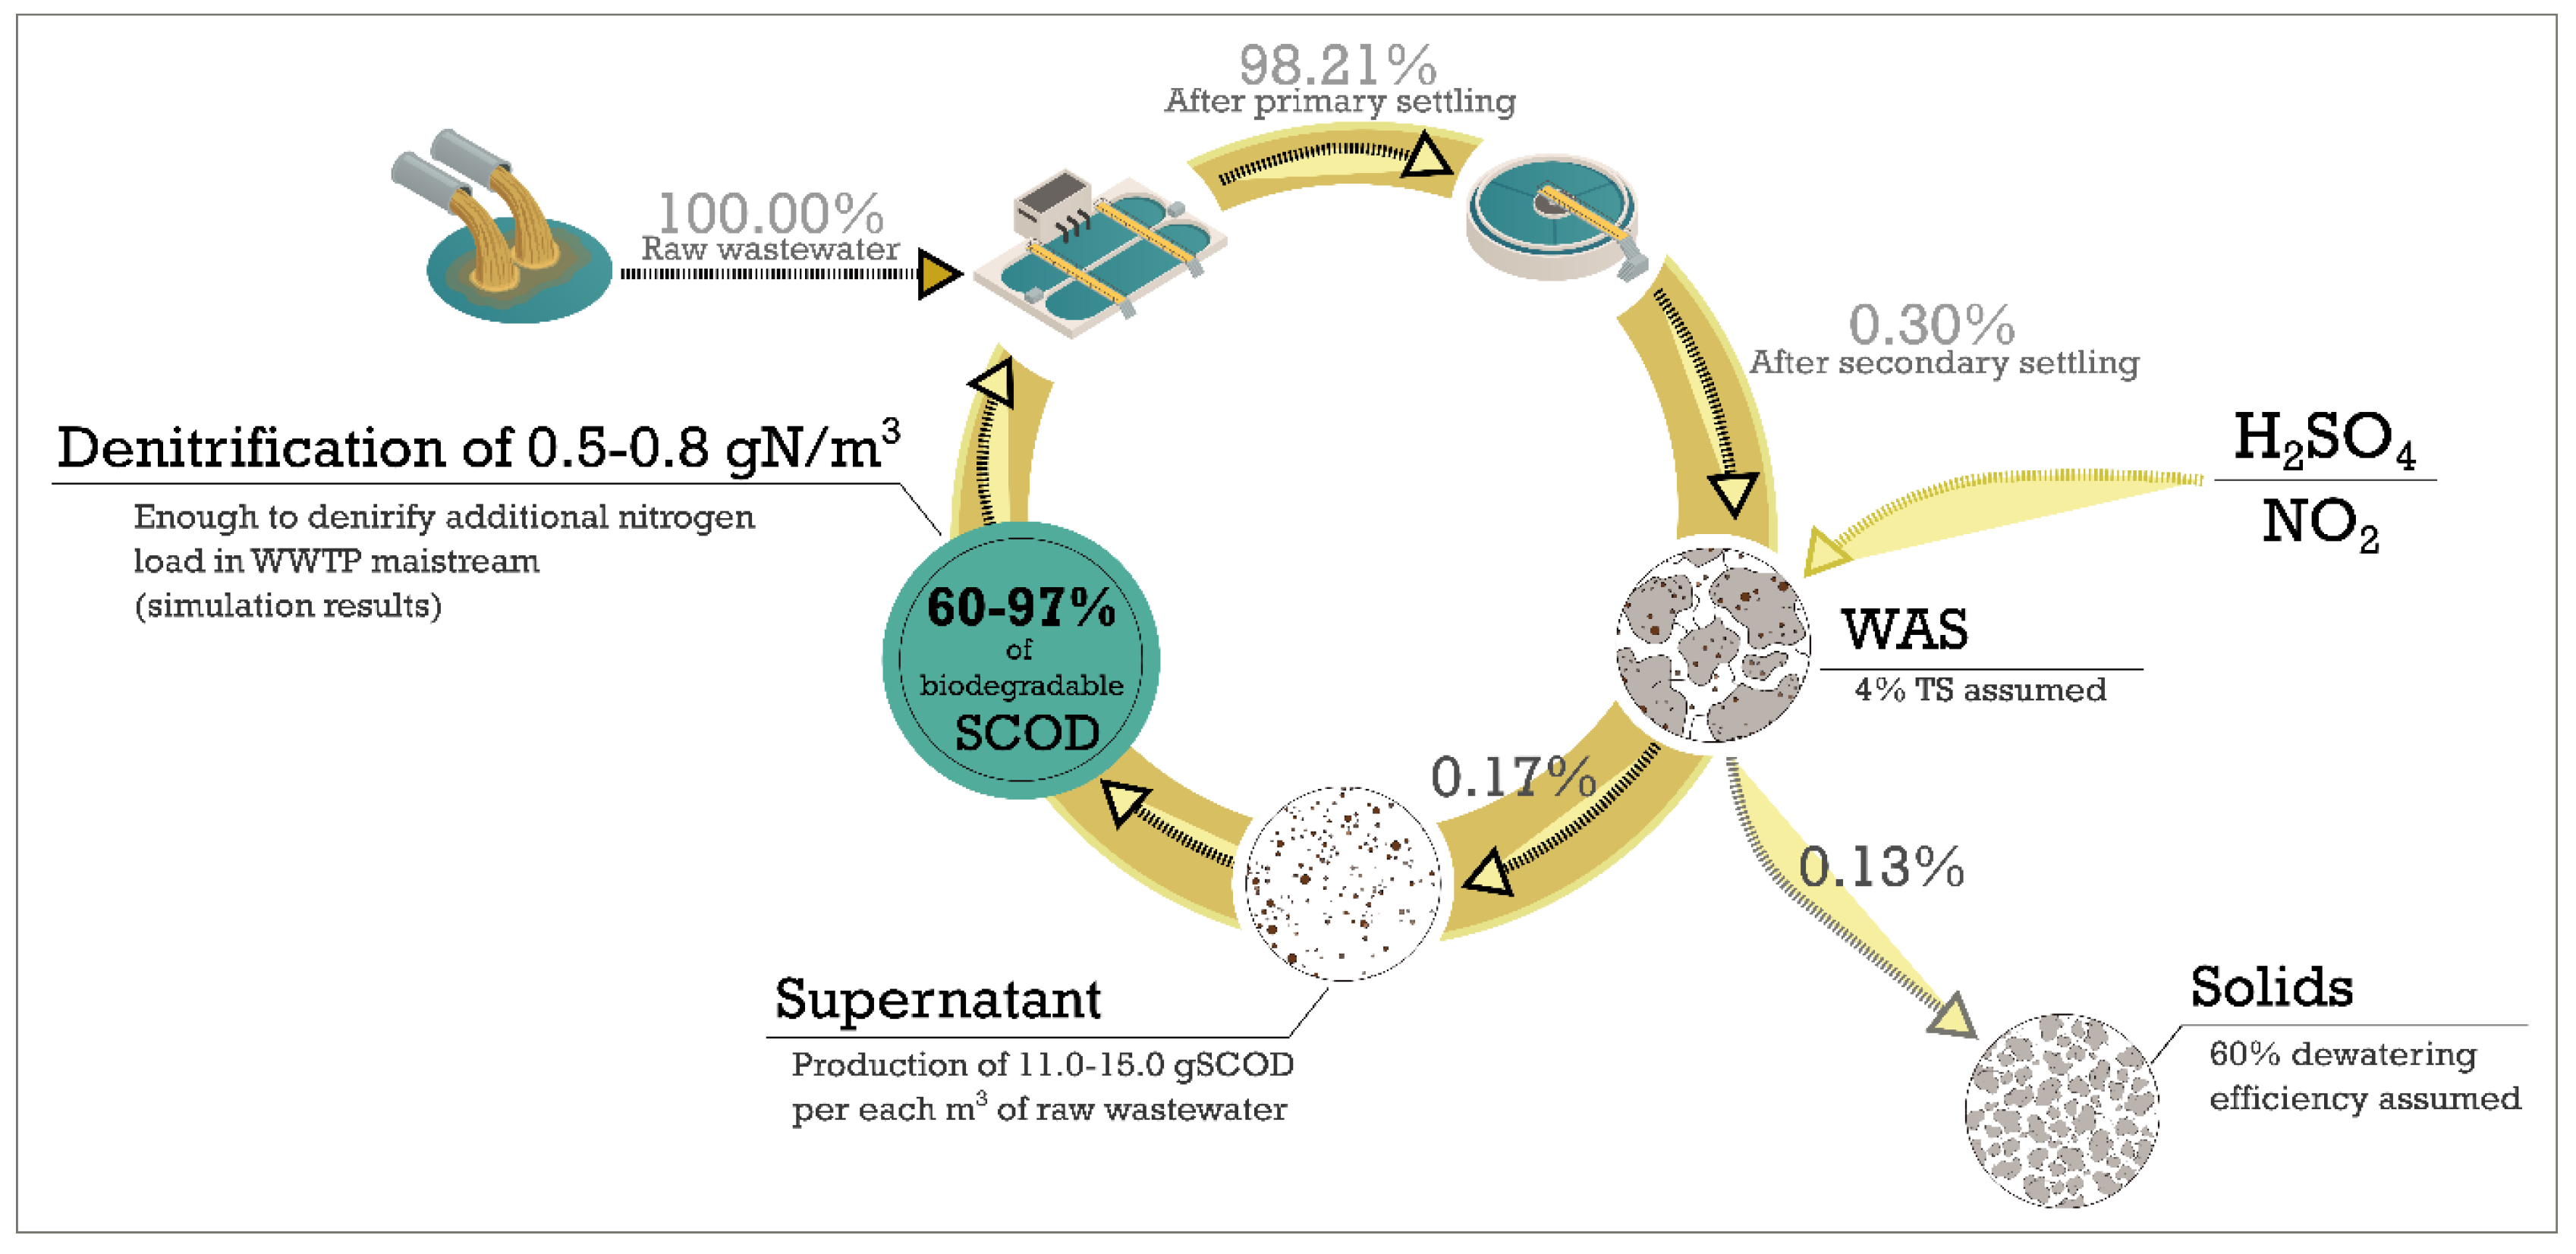
3.6. Assessment of Full-Scale Potential

The concept of full-scale implementation of the discussed technology is presented in Figure 7. The supernatant, which provides an external carbon source for denitrification, has to be produced through centrifugation since the separation of the solid and liquid phases requires a higher energy input. In the course of the study, a 60% efficiency of supernatant production was achieved, and while this can be considered as a threshold, it should also be noted that in process conditions, this value will be dependent on the respective centrifuge properties.

Simulation Results

To assess the potential of using WAS disintegration supernatants as carbon sources for denitrification in a full-scale WWTP (scheme in Figure S2), simulations for each tested disintegration product were conducted. The most important parameters of the WWTP effluent (treated wastewater) obtained for each scenario are presented in Table 3, while the input data are shown in Table S1. Total nitrogen, as well as nitrate concentrations, were the highest in the reference scenario (without the addition of an external carbon source). Each of the analyzed carbon sources enhanced the efficiency of the nitrogen removal, with the highest improvement being up to 0.8 gN/m3 (Scenario R8). The addition of supernatants from R4 and R5 (no nitrite addition) to the WWTP mainline had a comparable effect on the wastewater treatment process. The achieved improvement in the denitrification process was approximately 0.5 gN/m3 in those cases. The lack of significant differences between pH 7 (R4) and 5 (R5) indicates that it is not reasonable to acidify WAS in order to produce a carbon source for denitrification. Acidification of WAS (pH 5) with the addition of nitrite resulted in a slightly higher efficiency of the total nitrogen removal (0.7–0.8 gN/m3). It should be noted that both nitrite concentration and exposure time had no significant influence on the nitrogen removal efficiency (compare R6-R8).
The reason for the improvement of the total nitrogen concentration in the effluent was the greater load of readily biodegradable substrates that flowed into anoxic reactor 1 (Table S3). This is due to the fact that additional readily biodegradable substrates were depleted in the first anoxic reactor in all the scenarios. The availability of Ss at the input to anoxic reactor 2 was comparable for all the scenarios and was around 1400 kg/d. The lower nitrogen concentrations observed in the effluent for scenarios R6-R8, when compared to R4-R5, were related to the higher concentrations of the slowly biodegradable SCOD available in the supernatants, which in turn led to higher hydrolysis and the release of easily biodegradable matter in the anoxic chambers (Table S4). A higher inflow of Xs into the denitrification process also resulted in a higher load of Xs into the aerobic reactors (Table S4), and consequently in an increase in the uptake of air (Table 1). However, this was of a minor scale (ca. 3%).
Considering the economic and environmental benefits of using WAS as a carbon source instead of external carbon sources (sourced outside the WWTP), the disintegration of WAS by controlling the pH or NO2/FNA may be an advantageous solution. According to the simulation results, Figure 8 presents the potential of disintegrated WAS as a carbon source for denitrification. By assuming that recovery efficiency in supernatant separation from WAS is at a level of 60%, about 0.5–0.8 gN/m3 can be additionally denitrified in the WWTP mainstream. This denitrification potential is relatively low, but can be sufficient for those WWTPs that are at risk of minor effluent violations. It should also be noted that if recovery efficiency could be enhanced, these values would increase. Furthermore, the use of WAS will enable both a reduction in sludge volume for further management and the implementation of a closed-loop system in practice.

3.7. Summary

Biodegradable matter released during NO2/FNA disintegration of WAS can be used for denitrification or methane production, or even both. In this study, we proposed the use of a centrifuge and the direct transfer of 60% of released SCOD to the denitrification reactor, with the other 40% being anaerobically digested. In most studies to date [12,13,17,36,37], it has been assumed that the entire stream is directed to the fermentation reactors, which results in a substantial increase in the methane yield—a 16–52% surplus in comparison to sludge that is not pretreated.
The results obtained in this study, which show the relatively low potential of NO2/FNA-disintegrated WAS as a carbon source for denitrification, as well as the results from other studies (indicated above) showing the high potential of this disintegration method in enhancing the biodegradability of WAS, lead to the conclusion that the conditions in anaerobic digesters are more suitable for the degradation of released organic matter. Under anaerobic digestion process conditions, their potential can be fully used. This is due to the long retention time (typically over 20 days), the higher processing temperature (approximately 37 °C), and the fact that the biomass is adapted to the slowly biodegradable carbon sources. The denitrification process in full-scale WWTPs is characterized by completely different conditions. The wastewater temperature is significantly lower (mostly up to 20 °C), and therefore, biological processes are slower. Moreover, the retention time in the denitrification chamber is short, and due to the regular influent of mechanically treated wastewater or easily biodegradable external carbon sources, the activated sludge biomass is not able to utilize the slowly degradable organic carbon.
It can therefore be concluded that WAS disintegration by NO2/FNA is suitable for producing additional organic carbon for the denitrification process in cases where a slight reduction in the nitrogen concentration in the plant effluent is required in order to meet the requirements for treated wastewater.

4. Conclusions

Disintegration of WAS by 264 mgN-NO2/L (48 h) resulted in the highest release of SCOD. The VFA content in this sample was lower (13%) compared to pH-controlled reactors (without NO2/FNA), where 17% (pH 5) and 31% (pH 7) VFA/SCOD ratios were recorded.
The nitrogen uptake rates recorded for the disintegration products indicated a relatively low availability of easily biodegradable compounds.
According to the simulation results, the implementation of WAS disintegration allows for the denitrification of an additional 0.5–0.8 mgN/L. The denitrification could be enhanced to ca. 1 mgN/L if there were a complete recovery of SCOD during centrifugation.

Supplementary Materials

The following supporting information can be downloaded at: https://www.mdpi.com/article/10.3390/resources13060080/s1, Table S1. Technological parameters; Table S2. Key kinetic parameters used in simulations; Table S3. Easily biodegradable substrates [kgCOD/d]; Table S4. Slowly biodegradable substrates [kgCOD/d]; Figure S1. Run of the denitrification process with the supernatant after WAS disintegration (R4, only pH adjustment) as carbon source; Figure S2. Scheme of WWTP.

Author Contributions

Conceptualization, K.J. and A.W.; methodology, K.J., M.M. and S.S.; software, B.Z.; validation, K.J., D.S. and B.Z.; formal analysis, D.S. and K.J.; investigation, A.W. and S.S.; resources, K.J.; data curation, K.J.; writing—original draft preparation, D.S.; writing—review and editing, K.J., D.S., B.Z., M.M. and R.T.-W.; visualization, B.Z. and D.S.; supervision, K.J.; project administration, K.J.; funding acquisition, K.J. All authors have read and agreed to the published version of the manuscript.

Funding

This research was funded by National Centre for Research and Development and Development in the Norway Grants POLNOR19 programme (grant no. NOR/POLNOR/SNIT/0033/2019-00).

Data Availability Statement

The original contributions presented in the study are included in the article/Supplementary Materials. Further inquiries can be directed to the corresponding author/s.

Acknowledgments

The authors gratefully acknowledge co-funding from the National Centre for Research and Development and Development.

Conflicts of Interest

Author Kamil Janiak and Sławomir Szerzyna were employed by the MPWiK company. Renata Tomczak Wandzel was employed by Aquateam COWI. The remaining authors declare that the research was conducted in the absence of any commercial or financial relationships that could be construed as a potential conflict of interest. The remaining authors declare that the research was conducted in the absence of any commercial or financial relationships that could be construed as a potential conflict of interest.

References

  1. Li, C.; Liu, S.; Ma, T.; Zheng, M.; Ni, J. Simultaneous nitri fi cation, denitri fi cation and phosphorus removal in a sequencing batch reactor (SBR) under low temperature. Chemosphere 2019, 229, 132–141. [Google Scholar] [CrossRef] [PubMed]
  2. Zhang, Y.; Lu, G.; Zhang, H.; Li, F.; Li, L. Enhancement of nitrogen and phosphorus removal, sludge reduction and microbial community structure in an anaerobic/anoxic/oxic process coupled with composite ferrate solution disintegration. Environ. Res. 2020, 190, 110006. [Google Scholar] [CrossRef] [PubMed]
  3. Winkler, M.K.H.; Straka, L. New directions in biological nitrogen removal and recovery from wastewater. Curr. Opin. Biotechnol. 2019, 57, 50–55. [Google Scholar] [CrossRef] [PubMed]
  4. Sun, S.-P.; Carles, P.I.N.; Merkey, B.; Zhou, Q.; Xia, S.-Q.; Yang, D.-H.; Sun, J.-H.; Smets, B.F. Effective Biological Nitrogen Removal Treatment Processes for Domestic Wastewaters with Low C/N Ratios: A Review. Environ. Eng. Sci. 2010, 27, 111–126. [Google Scholar] [CrossRef]
  5. Kim, E.; Gu, S.; Hanifa, A.; Vincent, J. Use of food waste-recycling wastewater as an alternative carbon source for denitri fi cation process: A full-scale study. Bioresour. Technol. 2017, 245, 1016–1021. [Google Scholar] [CrossRef] [PubMed]
  6. Qi, S.; Yuan, S.; Wang, W.; Xiao, L.; Zhan, X.; Hu, Z. Effect of solid-liquid separation on food waste fermentation products as external carbon source for denitri fi cation. J. Clean. Prod. 2021, 284, 124687. [Google Scholar] [CrossRef]
  7. Shao, M.; Guo, L.; She, Z.; Gao, M.; Zhao, Y.; Sun, M.; Guo, Y. Enhancing denitrification efficiency for nitrogen removal using waste sludge alkaline fermentation liquid as external carbon source. Environ. Sci. Pollut. Res. 2019, 26, 4633–4644. [Google Scholar] [CrossRef] [PubMed]
  8. Nzila, A. Mini review: Update on bioaugmentation in anaerobic processes for biogas production. Anaerobe 2017, 46, 3–12. [Google Scholar] [CrossRef] [PubMed]
  9. Bonilla, S.; Choolaei, Z.; Meyer, T.; Edwards, E.A.; Yakunin, A.F.; Allen, D.G. Evaluating the effect of enzymatic pretreatment on the anaerobic digestibility of pulp and paper biosludge. Biotechnol. Rep. 2018, 17, 77–85. [Google Scholar] [CrossRef]
  10. Sun, D.; Qiao, M.; Xu, Y.; Ma, C.; Zhang, X. Pretreatment of waste activated sludge by peracetic acid oxidation for enhanced anaerobic digestion. Environ. Prog. Sustain. Energy. 2018, 37, 2058–2062. [Google Scholar] [CrossRef]
  11. Lippert, T.; Bandelin, J.; Vogl, D.; Tesieh, Z.A.; Wild, T.; Drewes, J.E.; Koch, K. Full-Scale Assessment of Ultrasonic Sewage Sludge Pretreatment Using a Novel Double-Tube Reactor. ACS ES T Eng. 2020, 1, 298–309. [Google Scholar] [CrossRef]
  12. Wang, Q.; Ye, L.; Jiang, G.; Jensen, P.D.; Batstone, D.J.; Yuan, Z. Free nitrous acid (FNA)-based pretreatment enhances methane production from waste activated sludge, Environ. Sci. Technol. 2013, 47, 11897–11904. [Google Scholar] [CrossRef] [PubMed]
  13. Zahedi, S.; Icaran, P.; Yuan, Z.; Pijuan, M. Assessment of free nitrous acid pre-treatment on a mixture of primary sludge and waste activated sludge: Effect of exposure time and concentration. Bioresour. Technol. 2016, 216, 870–875. [Google Scholar] [CrossRef] [PubMed]
  14. Karimi, R.; Hallaji, S.M.; Siami, S.; Torabian, A.; Aminzadeh, B.; Eshtiaghi, N.; Zahedi, S. Synergy of combined free nitrous acid and Fenton technology in enhancing anaerobic digestion of actual sewage waste activated sludge. Sci. Rep. 2020, 10, 5027. [Google Scholar] [CrossRef] [PubMed]
  15. Ma, B.; Peng, Y.; Wei, Y.; Li, B.; Bao, P.; Wang, Y. Free nitrous acid pretreatment of wasted activated sludge to exploit internal carbon source for enhanced denitrification. Bioresour. Technol. 2015, 179, 20–25. [Google Scholar] [CrossRef]
  16. Szypulska, D.; Miodoński, S.; Muszyński-Huhajło, M.; Zięba, B.; Janiak, K. Determination of the major factor responsible for soluble organic matter release during nitrite/free nitrous acid pre-treatment of waste activated sludge. Bioresour. Technol. 2021, 329, 124917. [Google Scholar] [CrossRef]
  17. Szypulska, D.; Miodoński, S.; Janiak, K.; Muszyński-Huhajło, M.; Zięba, B.; Cema, G. Waste activated sludge disintegration with free nitrous acid—Comprehensive analysis of the process parameters. Renew. Energy 2021, 172, 112–120. [Google Scholar] [CrossRef]
  18. Park, S.; Bae, W. Modeling kinetics of ammonium oxidation and nitrite oxidation under simultaneous inhibition by free ammonia and free nitrous acid. Process Biochem. 2009, 6, 631–640. [Google Scholar] [CrossRef]
  19. Kadlec, R.H.; Reddy, K.R. Temperature Effects in Treatment Wetlands. Water Environ. Res. 2001, 73, 543–557. [Google Scholar] [CrossRef]
  20. APHA. 2540 G. Total, fixed, and volatile solids in solid and semisolid samples. In Standard Methods for the Examination of Water and Wastewater; American Public Health Association: Washington, DC, USA, 2012. [Google Scholar]
  21. APHA. 5220 Chemical Oxygen Demand (COD). In Standard Methods for the Examination of Water and Wastewater; American Public Health Association: Washington, DC, USA, 2000. [Google Scholar]
  22. Hauduc, H.; Takács, I.; Smith, S.; Szabo, A.; Murthy, S.; Daigger, G.T.; Spérandio, M. A dynamic physicochemical model for chemical phosphorus removal. Water Res. 2015, 73, 157–170. [Google Scholar] [CrossRef]
  23. Varga, E.; Hauduc, H.; Barnard, J.; Dunlap, P.; Jimenez, J.; Menniti, A.; Schauer, P.; Vazquez, C.M.L.; Gu, A.Z.; Sperandio, M.; et al. Recent advances in bio-P modelling—A new approach verified by full-scale observations. Water Sci. Technol. 2018, 78, 2119–2130. [Google Scholar] [CrossRef] [PubMed]
  24. Atay, Ş.; Akbal, F. Classification and Effects of Sludge Disintegration Technologies Integrated into Sludge Handling Units: An Overview. Clean-Soil Air Water 2016, 44, 1198–1213. [Google Scholar] [CrossRef]
  25. de Sousa, T.A.T.; Monte, F.P.D.; Silva, J.V.D.N.; Lopes, W.S.; Leite, V.D.; van Lier, J.B.; de Sousa, J.T. Alkaline and acid solubilisation of waste activated sludge. Water Sci. Technol. 2021, 83, 2980–2996. [Google Scholar] [CrossRef] [PubMed]
  26. Lu, Y.; Xu, Y.; Dong, B.; Dai, X. Effects of free nitrous acid and nitrite on two-phase anaerobic digestion of waste activated sludge: A preliminary study. Sci. Total Environ. 2019, 654, 1064–1071. [Google Scholar] [CrossRef] [PubMed]
  27. Walczak, J.; Zubrowska-Sudol, M. The rate of denitrification using hydrodynamically disintegrated excess sludge as an organic carbon source. Water Sci. Technol. 2018, 77, 2165–2173. [Google Scholar] [CrossRef] [PubMed]
  28. Naidoo, V.; Urbain, V.; Buckley, C.A. Characterization of wastewater and activated sludge from European municipal wastewater treatment plants using the NUR test. Water Sci. Technol. 1998, 38, 303–305. [Google Scholar] [CrossRef]
  29. Rodríguez, L.; Villaseñor, J.; Fernández, F.J.J. Use of agro-food wastewaters for the optimisation of the denitrification process. Water Sci. Technol. 2007, 55, 63–70. [Google Scholar] [CrossRef] [PubMed]
  30. Kowal, P.; Ciesielski, S.; Otieno, J.; Majtacz, J.B.; Czerwionka, K.; Mąkinia, J. Denitrification process enhancement and diversity of the denitrifying community in the full scale activated sludge system after adaptation to fusel oil. Energies 2021, 14, 5225. [Google Scholar] [CrossRef]
  31. Sage, M.; Daufin, G.; Ge, G. Denitrification potential and rates of complex carbon source from dairy effluents in activated sludge system. Water Res. 2006, 40, 2747–2755. [Google Scholar] [CrossRef]
  32. Świniarski, M. The Effect of External Carbon Cources on Enhancing the Denitrification Process in Activated Sludge Systems. Ph.D. Thesis, Gdańsk University of Technology, Gdańsk, Poland, 2011. [Google Scholar]
  33. Henze, M.; Gujer, W.; Mino, T.; Van Loosdrecht, M.C.M. Activated Sludge Models ASM1, ASM2, ASM2d and ASM3; IWA Publishing: London, UK, 2000. [Google Scholar]
  34. Guo, Y.; Guo, L.; Sun, M.; Zhao, Y.; Gao, M.; She, Z. Effects of hydraulic retention time (HRT) on denitrification using waste activated sludge thermal hydrolysis liquid and acidogenic liquid as carbon sources. Bioresour. Technol. 2017, 224, 147–156. [Google Scholar] [CrossRef] [PubMed]
  35. Mancuso, G.; Langone, M.; Andreottola, G. Ultrasonics Sonochemistry A swirling jet-induced cavitation to increase activated sludge solubilisation and aerobic sludge biodegradability. Ultrason.-Sonochem. 2017, 35, 489–501. [Google Scholar] [CrossRef] [PubMed]
  36. Guerrero, A.; Duan, H.; Chen, X.; Wu, Z.; Yu, W.; Silva, C.E.; Li, Y.; Shrestha, S.; Wang, Z.; Keller, J.; et al. Enhancing anaerobic digestion using free nitrous acid: Identifying the optimal pre-treatment condition in continuous operation. Water Res. 2021, 205, 117694. [Google Scholar] [CrossRef] [PubMed]
  37. Pijuan, M.; Wang, Q.; Ye, L.; Yuan, Z. Improving secondary sludge biodegradability using free nitrous acid treatment. Bioresour. Technol. 2012, 116, 92–98. [Google Scholar] [CrossRef] [PubMed]
Figure 1. Scheme of experimental steps.
Resources 13 00080 g001
Figure 2. WAS disintegration results (as SCOD and VFA concentrations), presented as mgO2 per gVS of the feedstock (A) and per L of supernatant (B), obtained for various disintegration parameters (pH, HNO2 dose, exposure time).
Resources 13 00080 g002
Figure 3. WAS disintegration results shown as a release of nitrogen (TN, N-organic, N-NH4) and the ratio of N-NH4/TN obtained for different disintegration parameters (pH, HNO2 dose, exposure time).
Resources 13 00080 g003
Figure 4. The average denitrification rates (standard deviations as error bars) observed for all the tested substrates (pH 7.0 ± 0.5; T 14–18 °C—rates on the chart converted to 20 °C; initial N and SCOD concentrations—35–40 mgN-NO3/L and 200 mgO2/L, respectively).
Resources 13 00080 g004
Figure 5. The average values of the SCOD (±standard deviations) fractions (A) and concentrations (B) obtained from the disintegrated WAS.
Resources 13 00080 g005
Figure 6. SCOD available for denitrification in the mainline: data on average SCOD (±standard deviations) fractions (A) and concentrations (B) obtained from disintegrated WAS without SCOD required for the denitrification of residual nitrites.
Resources 13 00080 g006
Figure 7. Full-scale implementation concept of an external carbon source from NO2/FNA disintegrated WAS.
Resources 13 00080 g007
Figure 8. The potential of WAS disintegration products as a carbon source for denitrification in the mainstream of a WWTP (Designed by macrovector/Freepik).
Resources 13 00080 g008
Table 1. The average parameters (±standard deviations) of substrates collected at a full-scale WWTP.
SubstrateTSgTS/kgVSgVS/kgTCODmgO2/LSCODmgO2/LTN
mgN/L
WAS60.2 ± 1.044.2 ± 1.775 650 ± 1 774276 ± 2434 ± 11
Activated sludge5.9 ± 0.54.1 ± 0.4not determined38 ± 7not determined
Mechanically treated wastewater0.3 ± 0.10.2 ± 0.1700 ± 147229 ± 3162 ± 10
Table 2. Characteristics of additional carbon sources for denitrification.
Carbon SourceDisintegration Parameters before DenitrificationNumber of Repetitions
NO2,
mg N-NO2/L
FNA,
mg N-HNO2/L
pHExposure Time, h
R1Acetate Not applicated3
R2Mechanically treated wastewater Not applicated3
R3Endogenous Not applicated3
R4WAS0.0 ± 0.00.0 ± 0.07.0 ± 0.0483
R5WAS 0.0 ± 0.00.0 ± 0.05.1 ± 0.0483
R6WAS 123.0 ± 29.72.8 ± 0.15.1 ± 0.0482
R7WAS 254.6 ± 25.25.8 ± 0.95.1 ± 0.1242
R8WAS 263.5 ± 17.05.8 ± 0.05.1 ± 0.2482
Table 3. Quality of WWTP effluent according to the simulation results.
Scenarios
ParameterUnitReferenceR4R5R6R7R8
Total ammonia (NHx)g N/m30.640.640.640.640.640.64
Nitrate (NO3)g N/m37.987.397.487.237.197.15
Total nitrogeng N/m39.819.259.339.089.039.00
Orthophosphate (PO4)g P/m30.150.150.150.150.150.15
Air flow ratem3/d1,785,6491,785,6491,783,6861,784,4681,773,7311,789,684
Disclaimer/Publisher’s Note: The statements, opinions and data contained in all publications are solely those of the individual author(s) and contributor(s) and not of MDPI and/or the editor(s). MDPI and/or the editor(s) disclaim responsibility for any injury to people or property resulting from any ideas, methods, instructions or products referred to in the content.

