The platform used for implementation of the 100-kW 3-phase grid connected to the photovoltaic system is Matlab/Simulink. The effect of fault parameters for the system are investigated for designed FLC based on the LM and BFCL-based FRT strategy. The response of fault parameters at both grids as well as the PV side are analyzed at two locations i.e., PCC and at 5-km of distance from PCC. Moreover, for justification of the proposed control, a comparative assessment is carried out with conventionally tuned PI and crowbar based FRT strategy.
3.1. Asymmetrical Faults at PCC
Asymmetrical faults are applied at 0.1 s for 150 ms at PCC. Performance analysis of the proposed approach in comparison with conventionally used schemes is presented below.
The DC-link voltage behavior during the phase to the ground (P-G) and phase-to-phase (P-P) faults are depicted in
Figure 8. The proposed BFCL in combination with FLC based on LM (LM+BFCL) shows a smooth and optimized response throughout the fault duration. The proposed strategy gives minimum spikes at the fault occurring and clearing the time. It also responds with a minimum overshoot and undershoot as compared to any of the other approaches. However, the double phase fault responds more severely as compared to a single-phase fault. However, the response of the proposed strategy justifies its robustness for the P-P fault as well. Moreover, during the start of simulations, LM+BFCL responds in minimum transients, comparatively.
Additionally, the contents of
Table 1,
Table 2 and
Table 3 elaborates the control measures to evaluate the performance of different control schemes. Three control measures i.e., Integral Absolute Error (IAE), Integral Square Error (ISE), and Integral Time-weighted Absolute Error (ITAE) are calculated. These measures give a very precise and exact comparison between the different controllers. The minimum is the value while the more is the efficiency.
Performance evaluations of the proposed strategy for the dc-link voltage with other possible combinations are carried out in
Table 1.
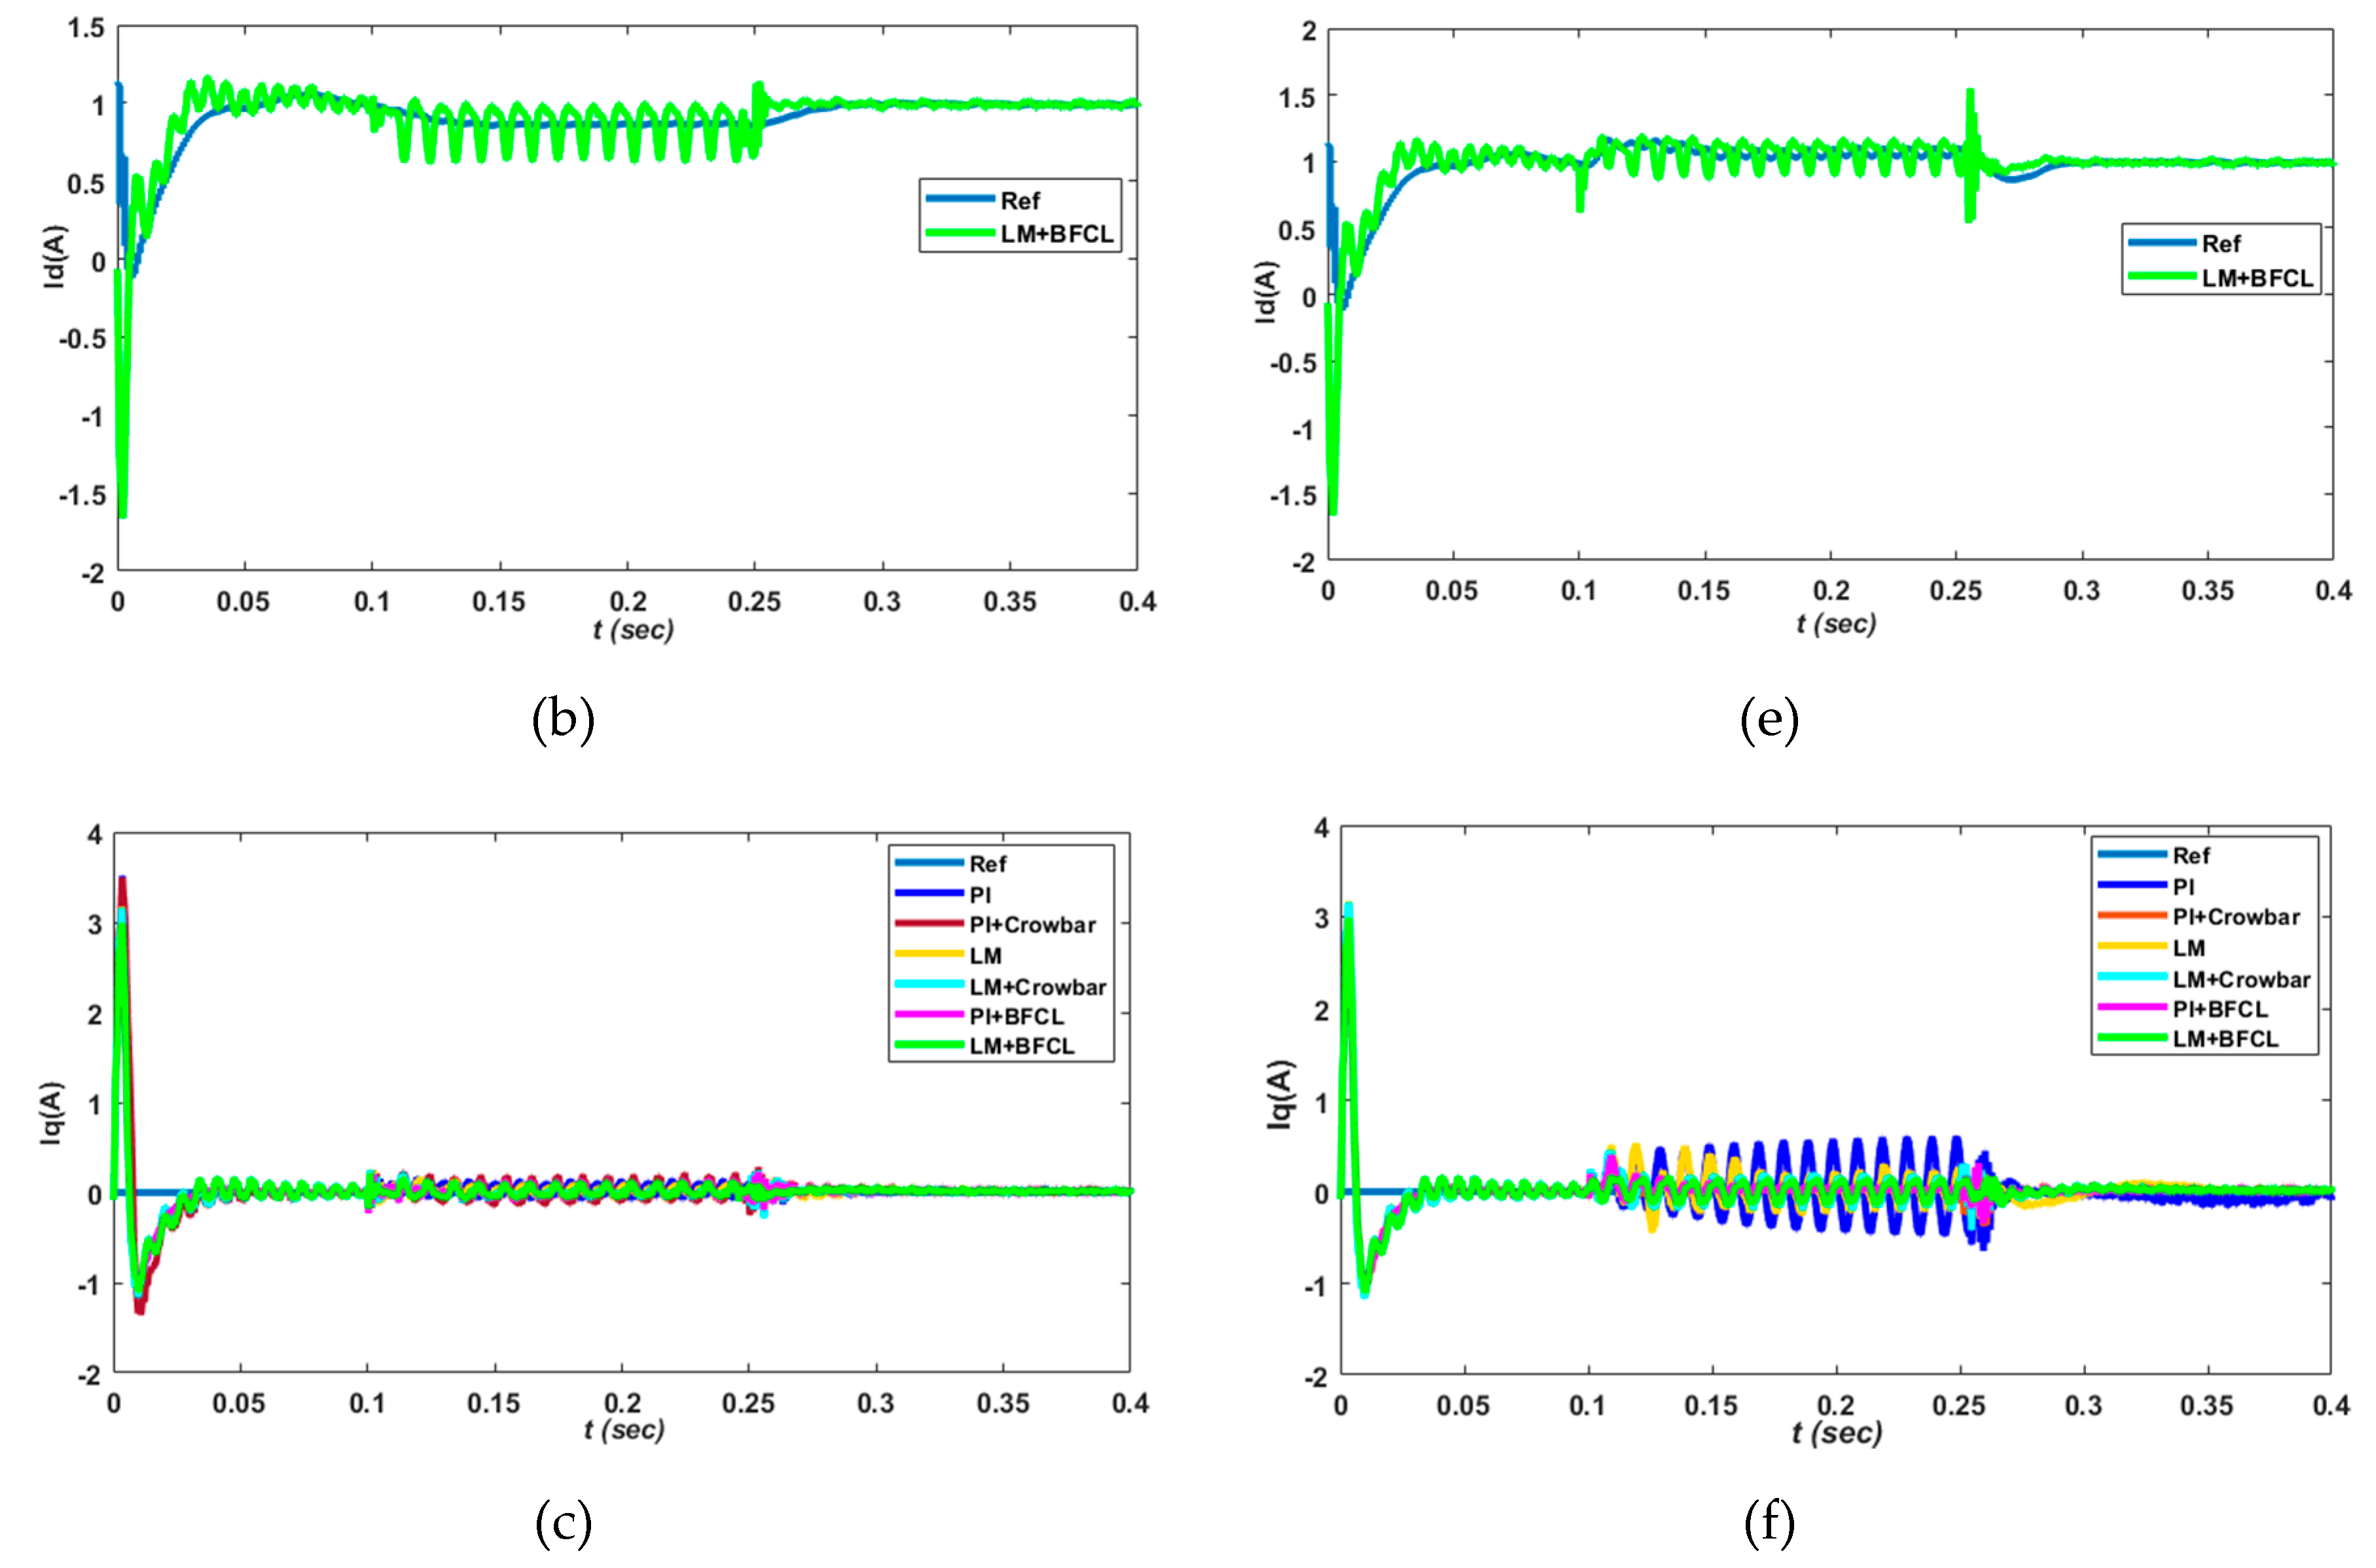
Figure 9 depicts the inverter active (Id) and reactive (Iq) current components in the synchronous reference frame i.e., d-q frame. In both the unbalanced fault conditions P-G and P-P, the proposed scheme authenticates the low oscillations and surges in currents. This is due to the inductive effect of BFCL comparatively to crowbar as the FRT strategy. Furthermore, the P-P fault proposed scheme gives an optimum response even though it is a severe fault than the P-G fault. However, as mentioned before, the Iq component is kept at zero for the unity power factor. Therefore, the Iq component also proposed LM+BFCL, which gives negligible spikes for both fault cases, as shown in
Figure 9c,f. Additionally, most of the performance evaluation indices give minimum values for the proposed approach, as shown in
Table 2;
Table 3. The minimum value of adopted performance evaluation indices means efficient performance.
Performance evaluation of the proposed strategy with other possible combinations are derived in
Table 2 for the real current component (Id).
However, performance evaluations for a reactive current component for all possible combinations are carried out in
Table 3.
Figure 10 shows the propagation of real power waveforms during unbalanced short circuit faults. These faults are simulated at the PCC of PVS, which is measured through 100 kVA power rating and 260V/20kV coupling transformer. Both of the controllers i.e., PI and LM alone results in the worst behavior. Approximately 8% and 20% of power dips occurred during P-G and P-P, respectively, along with extensively high transition surges. However, with the combination of crowbar circuitry, an increase in power is achieved but with high and long duration oscillations during the fault occurring and clearing time. The proposed LM+BFCL results in rated power during the fault without compromising at high oscillations and surges, as shown by
Figure 10a,b for single phase and double phase abnormal conditions.
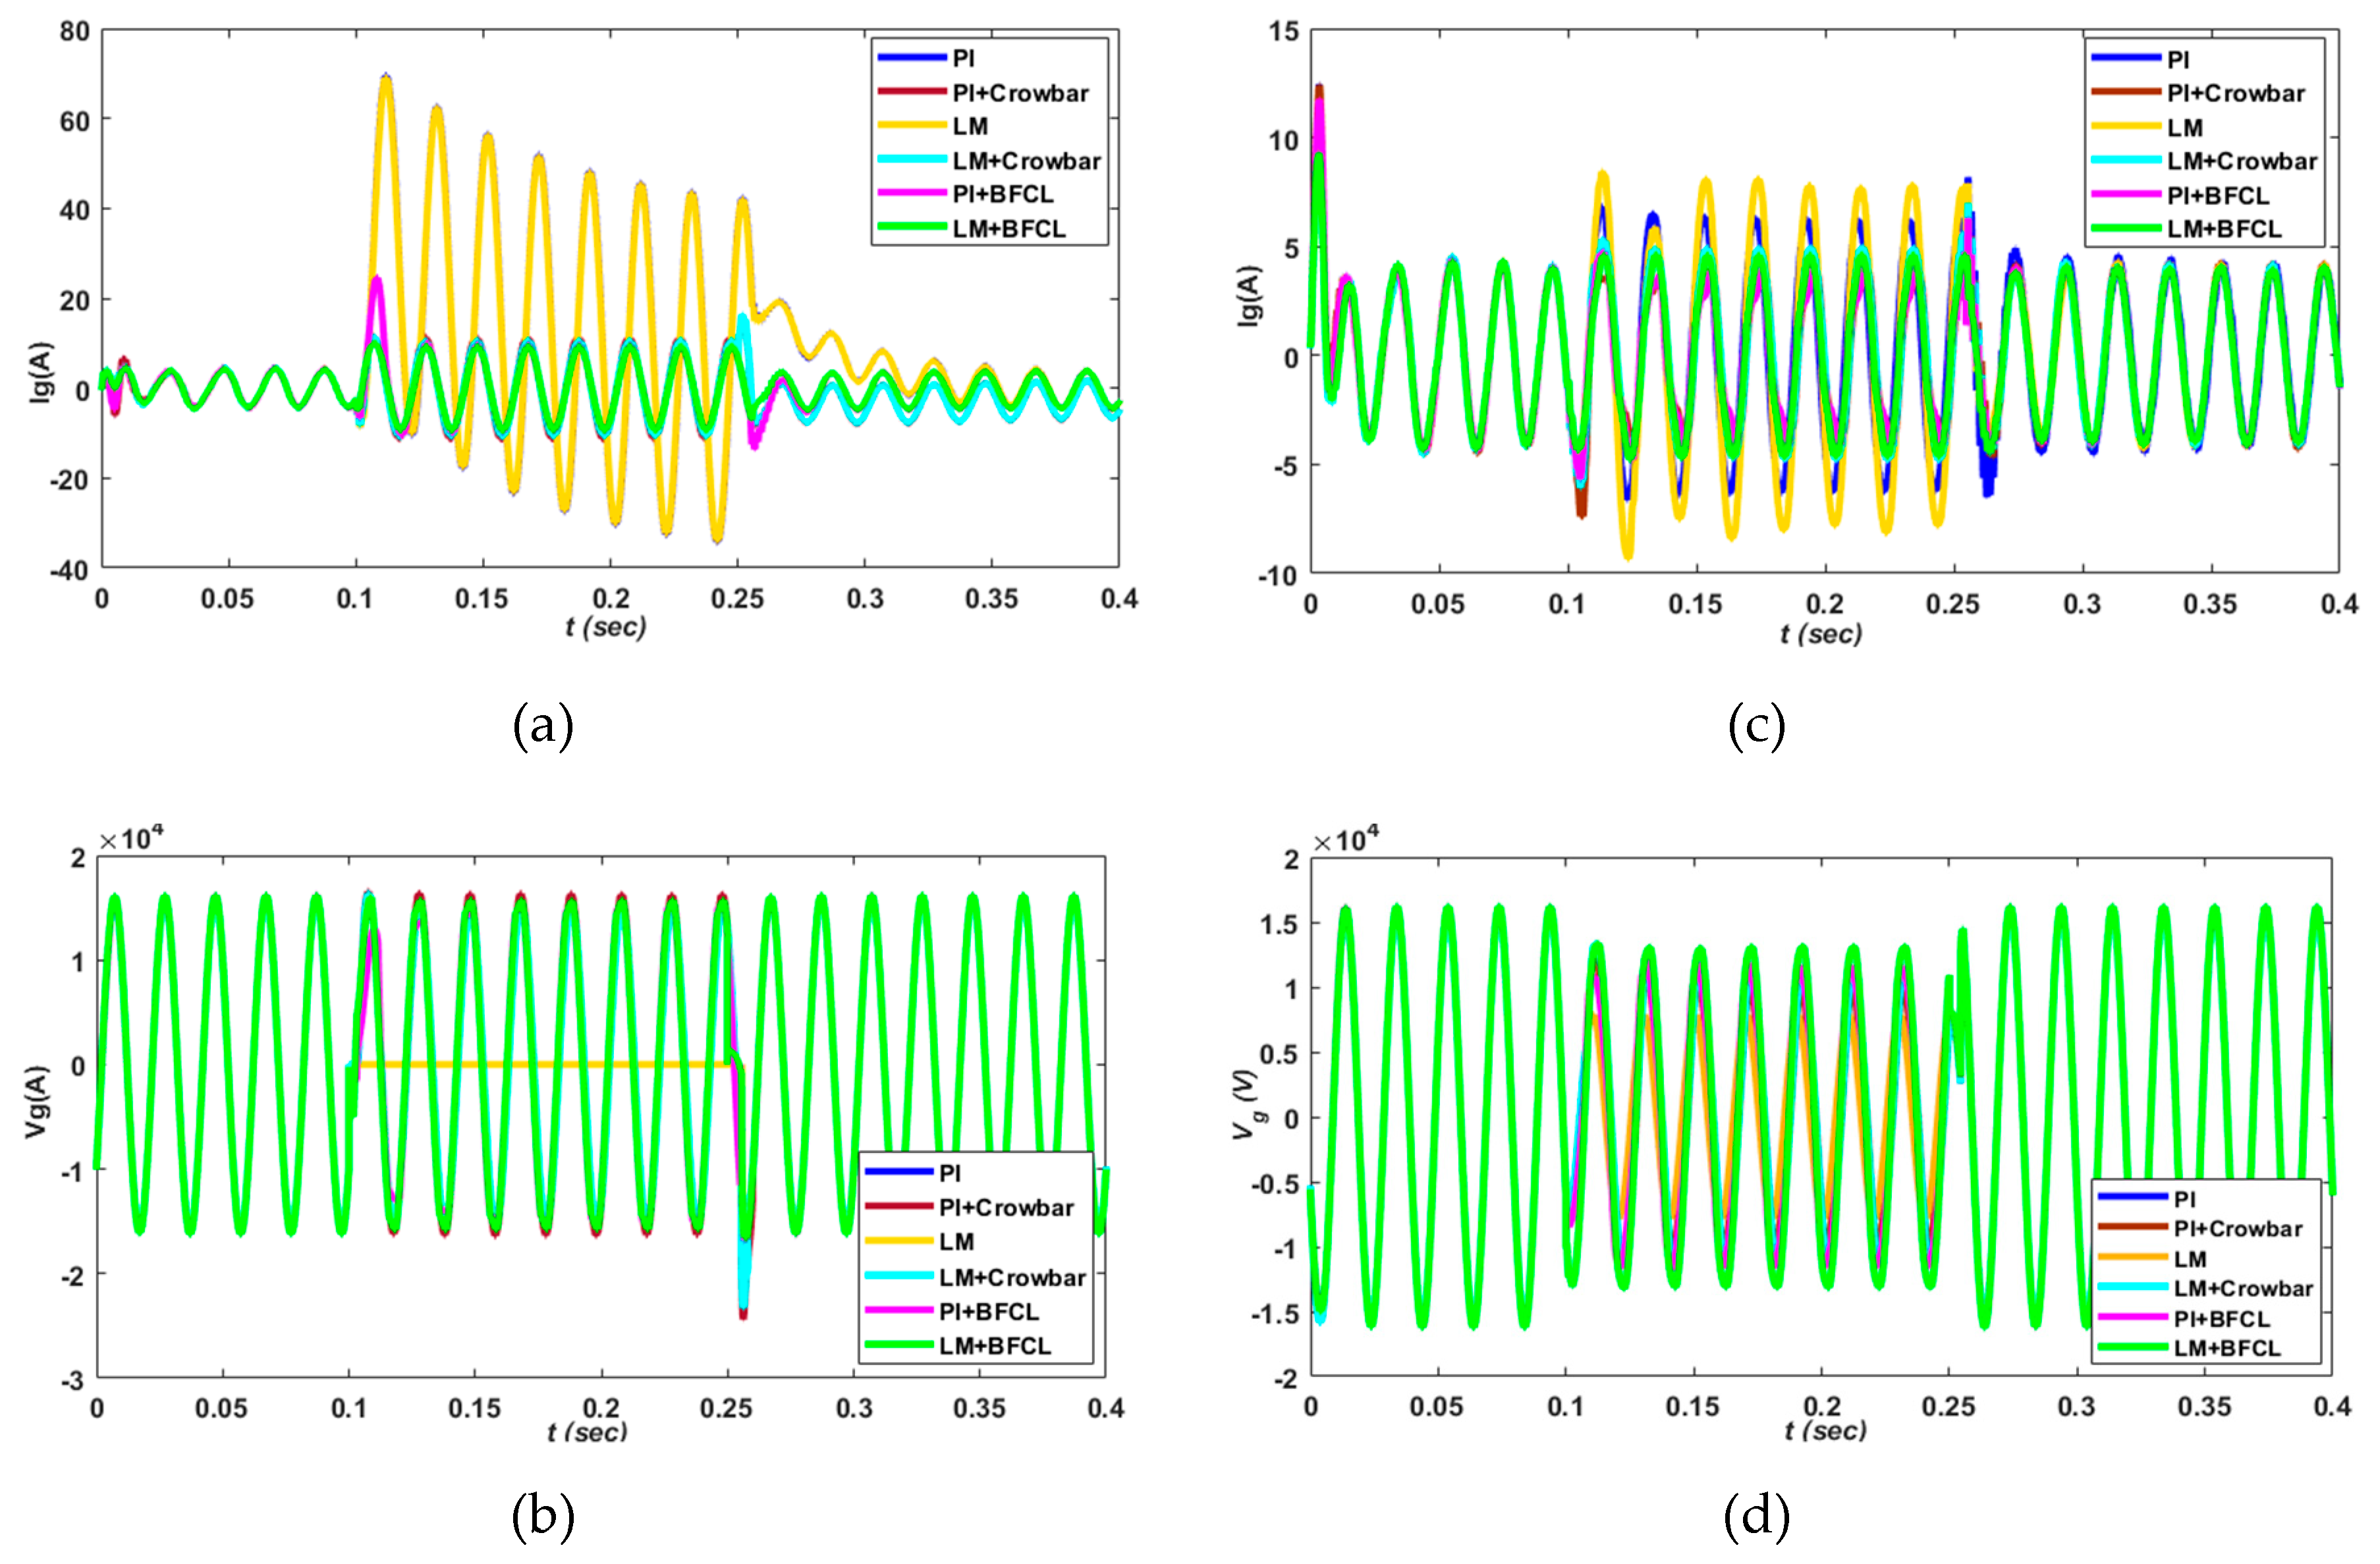
The fault current waveforms are substantially restrained to acceptable limits through a proposed strategy, and loss of voltage is regained to a rated value without any ripples during the P-G fault as shown in
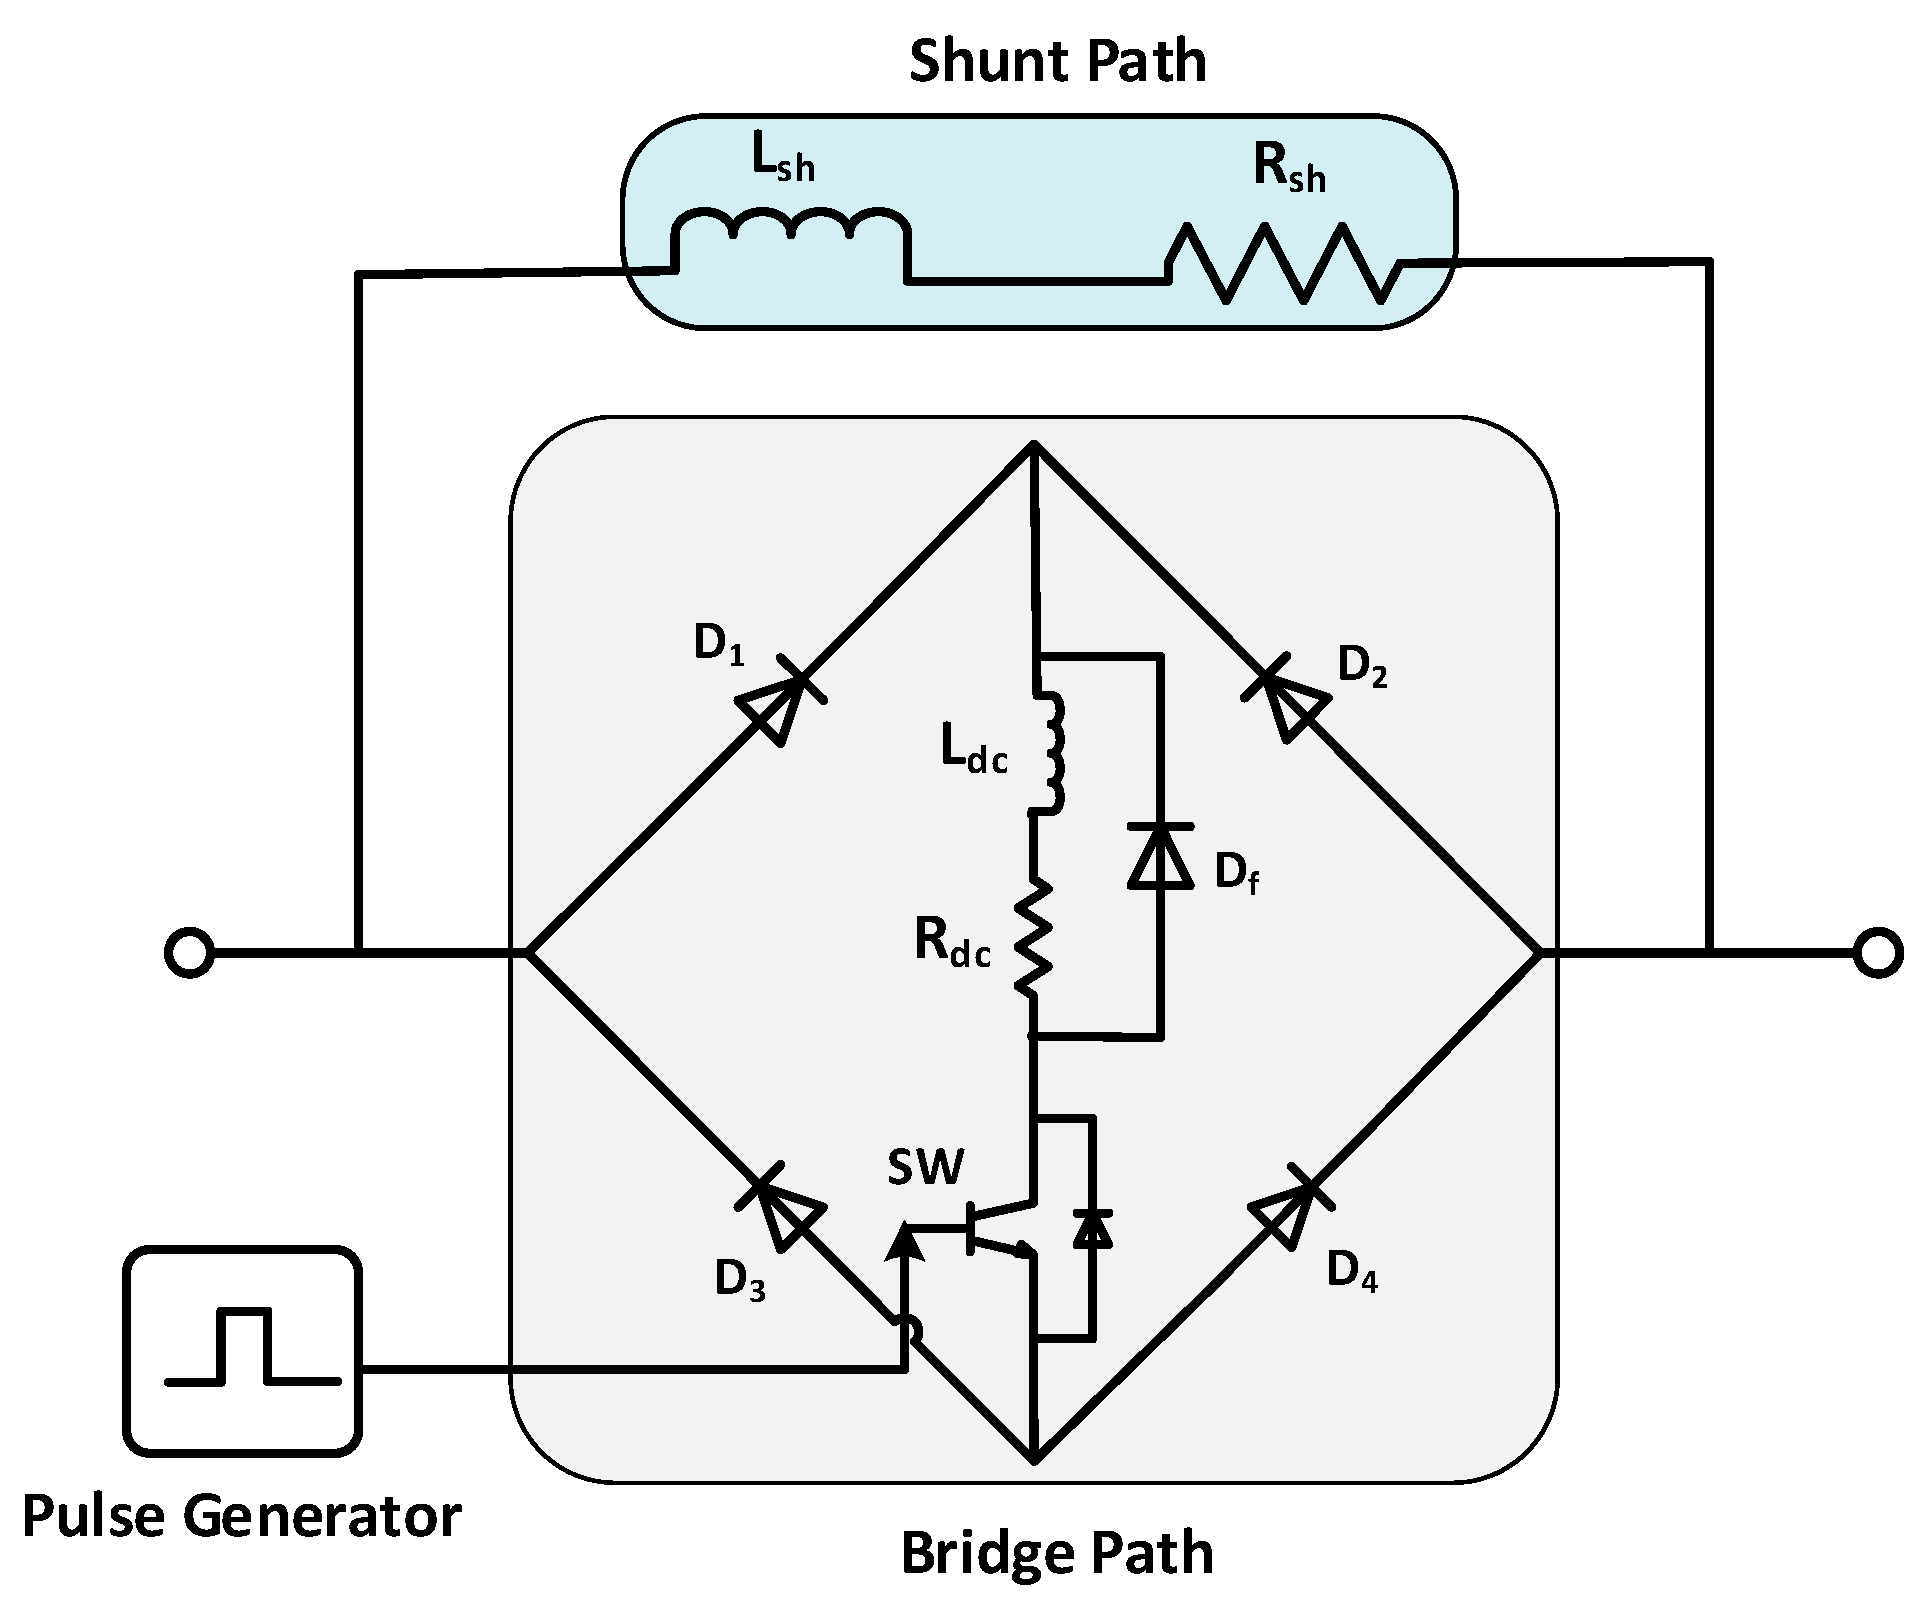
Figure 11. However, the crowbar strategy with any of the controllers restricts current due to its pure resistive effect but results in high spikes during the fault occurring and clearing time. During the P-P fault, the proposed strategy gives a smooth and optimized response due to shunt inductance during the fault and bridge inductance for switching surge elimination.
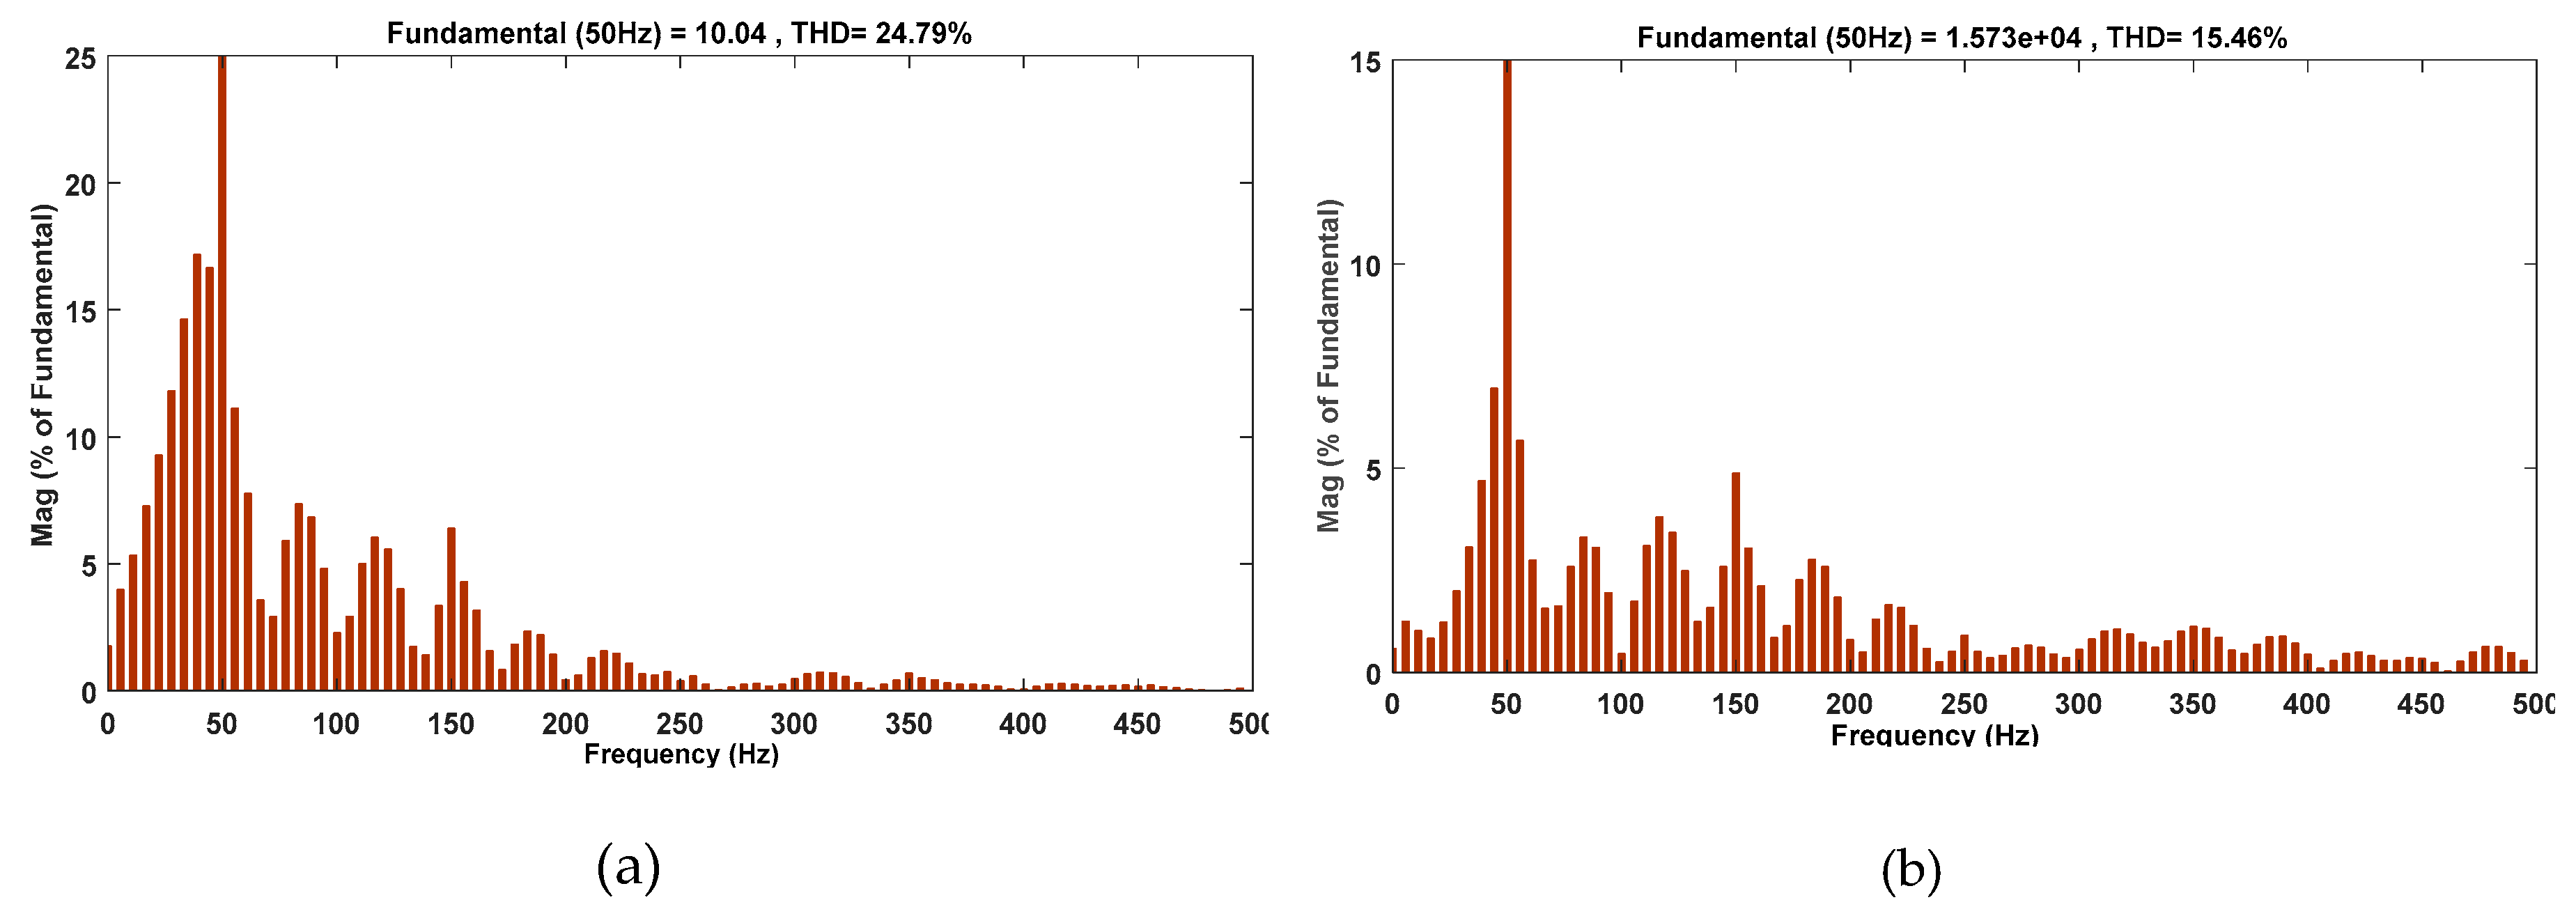
Furthermore, total harmonic distortion (THD) is calculated with fast Fourier transform (FFT) analysis for grid current and voltage during the P-G fault. The distortion in harmonics is carried out under analysis for a proposed approach (LM+BFCL) and for other possible combinations i.e., from
Figure 12,
Figure 13,
Figure 14,
Figure 15,
Figure 16 and
Figure 17. The proposed approach gives minimum values of THD for current and voltage i.e., 16.24% and 9.20%, respectively, as depicted by
Figure 17. However, for the conventionally adopted PI + Crowbar strategy, the THD values 24.79% and 15.46% for the current and voltage are depicted in
Figure 13.
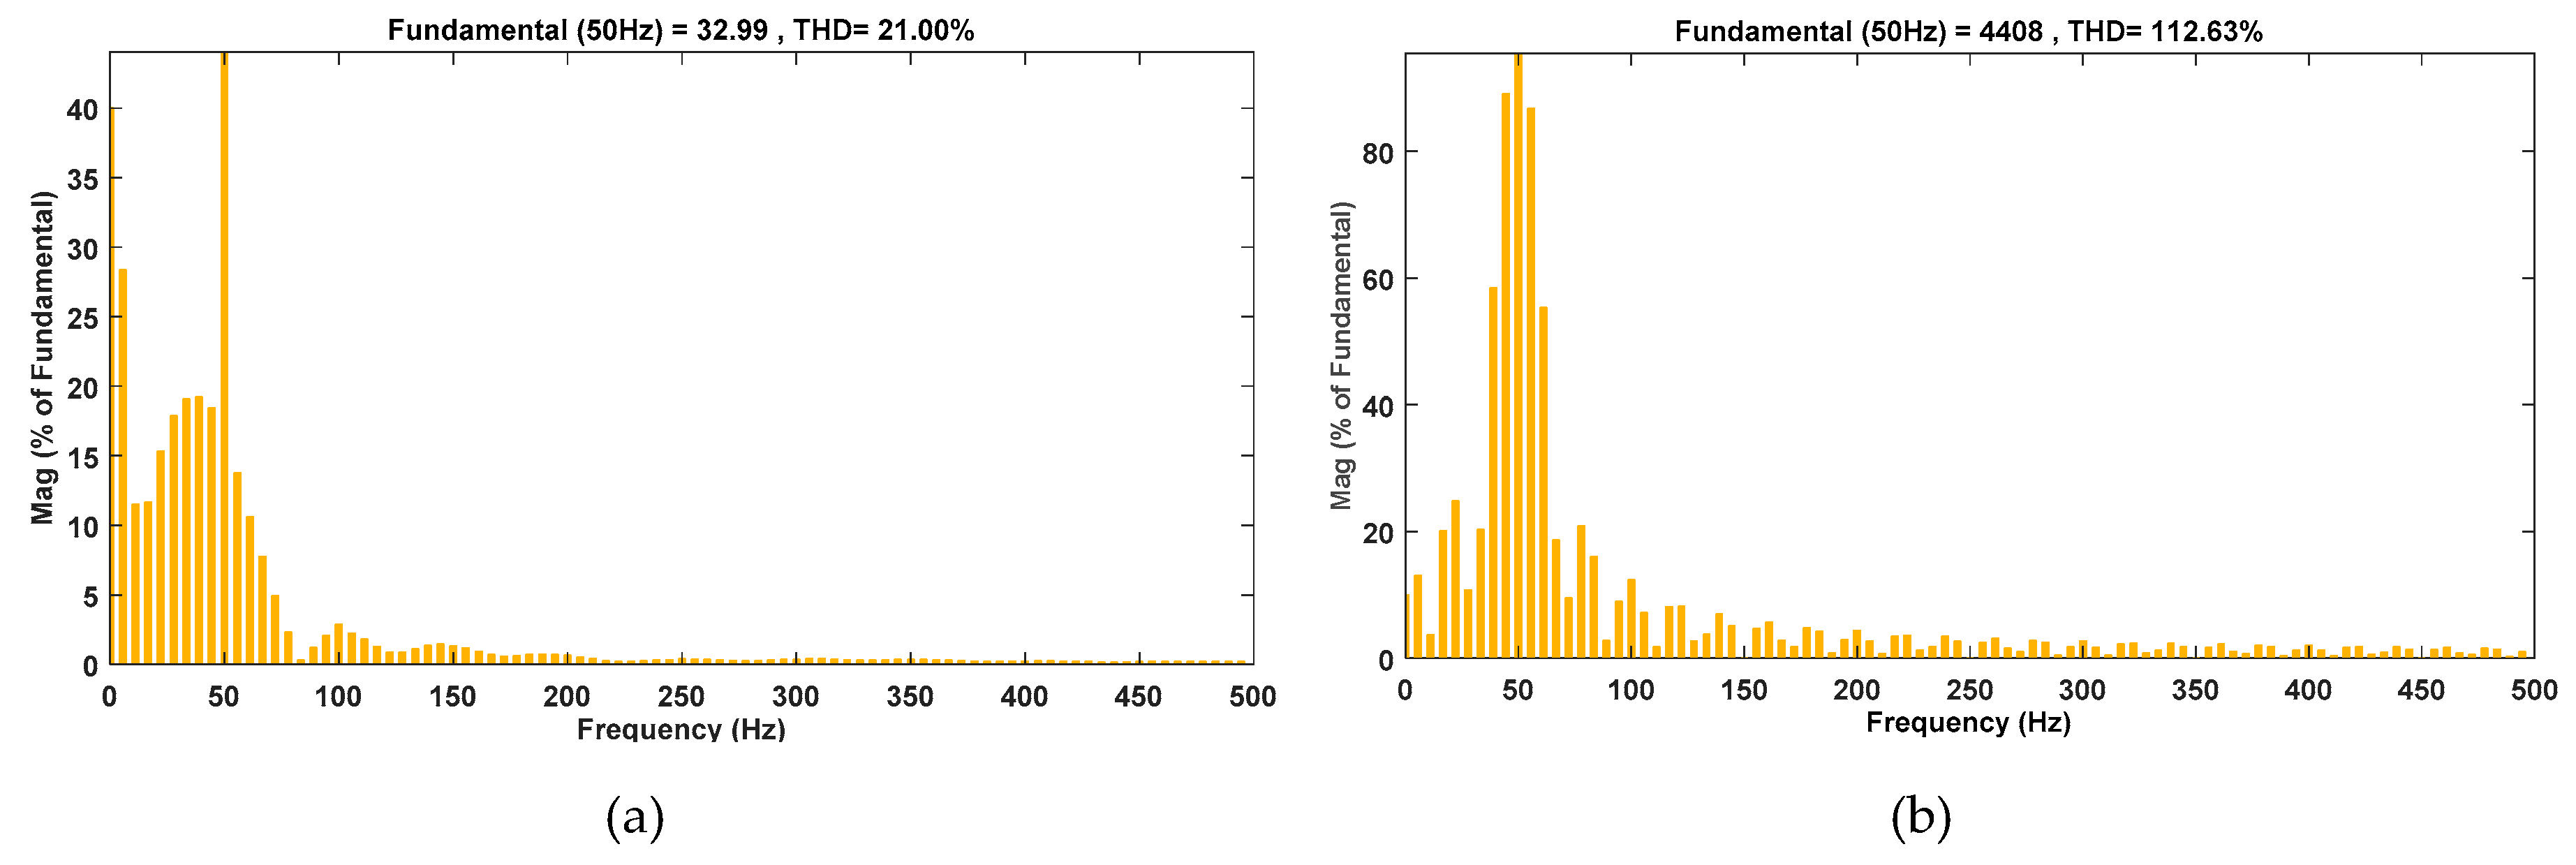
However, considering the THD response of controllers without FRT strategy i.e., for PI and FLC based on LM optimization. The LM optimization-based control have 21% and 112.63% THD for current and voltage, respectively. However, the conventional PI controller results in 24.95% and 175.08% for current and voltage, respectively, as shown by
Figure 12 and
Figure 13. Therefore, the minimum percent value of THD for LM optimization-based control shows low harmonics as compared to a conventionally tuned PI controller. According to overall harmonics analysis, it is clearly authenticated that the proposed approach is more efficient and have low harmonics distortion than all possible combinations of controllers and FRT strategies.
The frequency variations during P-G and P-P are depicted in
Figure 18. According to the German grid code, the frequency variation limits for normal operation are 49.5-50.5 Hz for 50 Hz nominal frequency. However, for serious contingency, the critical frequency variations are 47.0-48.0 Hz for 50 Hz nominal frequency [
42,
43]. Therefore, each of the presented schemes is obeying the frequency requirements of grid codes. The crowbar strategy results in high variations. However, proposed LM+BFCL gives minimum variations for P-G faults as shown by
Figure 18a. In the case of the P-P fault, frequency responds in high amplitude variations than the P-G fault for the crowbar FRT strategy, as shown by
Figure 18b. However, for both fault cases, the smooth and optimum response of the proposed approach is authenticated.
The impact of faults on PV array output power results in a decrease at the fault occurring and clearance time. This decrease in power is more significant for the P-P fault whereas, for the P-G fault, it varies little. Considering the performance of FRT schemes,
Figure 19a,b clearly show a smooth and fast response for the proposed strategy in both cases of the fault. Yet, with other schemes, a decrease in PV power is faced for 0.04 s as the fault transients, which is more significant with the crowbar strategy due to its pure resistive nature. This is why it results in a high copper loss (
).
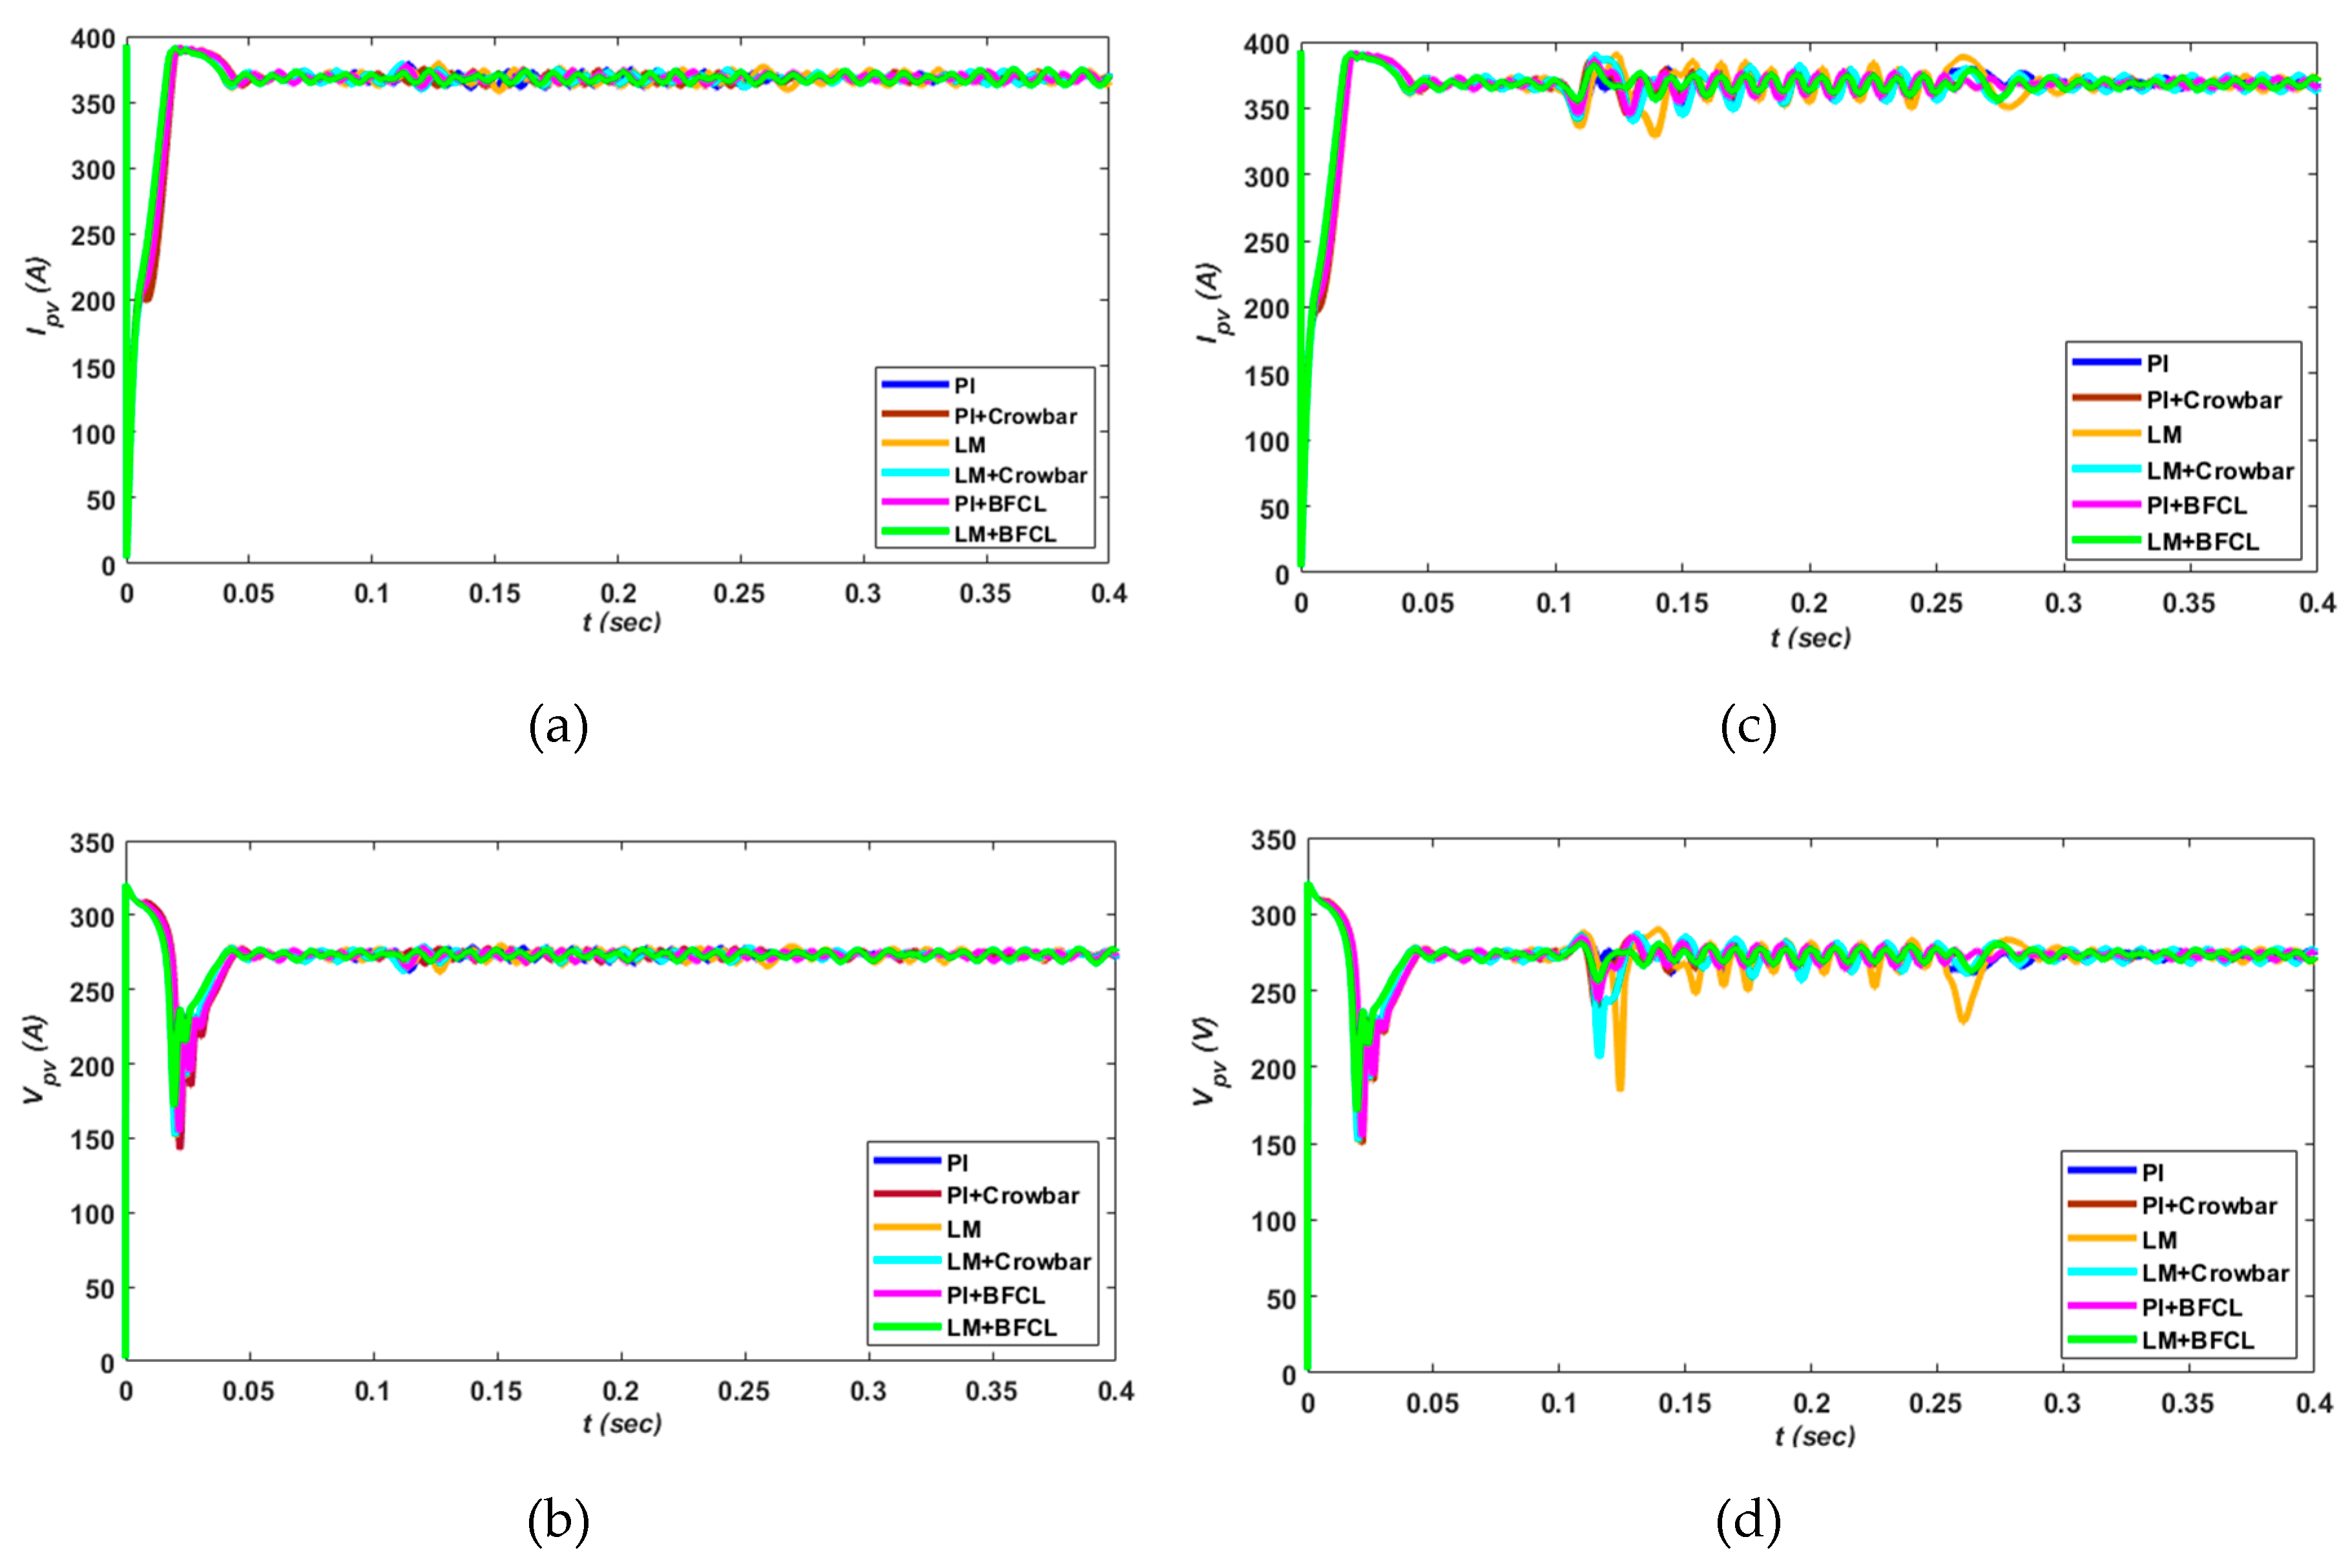
The PV array current and voltage wave forms during single phase and double phase fault are shown in
Figure 20. Both current and voltage give high magnitude surges during fault occurring and clearing time, which are higher for the P-P fault and less for the P-G fault. The instantaneous product of voltage and current in both fault cases justifies the PV power waveform, as shown in
Figure 19, according to the power law i.e., P = V*I. Moreover, the proposed strategy authenticates its optimum response comparatively to other schemes in PV output power.
3.2. Asymmetrical Faults at 5-km Distance
The simulated parameters at 5-km from PCC influenced little more than the type of fault rather than the distance. The small variations with respect to distance are due to the addition of extra 5-km line impedance. A negligible increase in voltage waveforms and a decrease in current waveforms are depicted even though the overall behavior is the same as in PCC.
The DC-link voltage response during the P-G and P-P fault at the 5-km distribution line from PCC is shown in
Figure 21a,b, respectively, which results in small variations throughout fault time due to the line impedance. Line distance does not alter the effectiveness of the proposed strategy as compared to other schemes.
Figure 22 clarifies the low amplitude oscillations in active (Id) and reactive (Iq) current components for the proposed LM + BFCL strategy during both unbalanced conditions. Yet, insignificant increases in spikes are observed due to line impedance for the conventional crowbar with the PI controller as compared to that of PCC. However, the proposed strategy results in more surge suppression due to line series impedance and shunt impedance of the BFCL strategy.
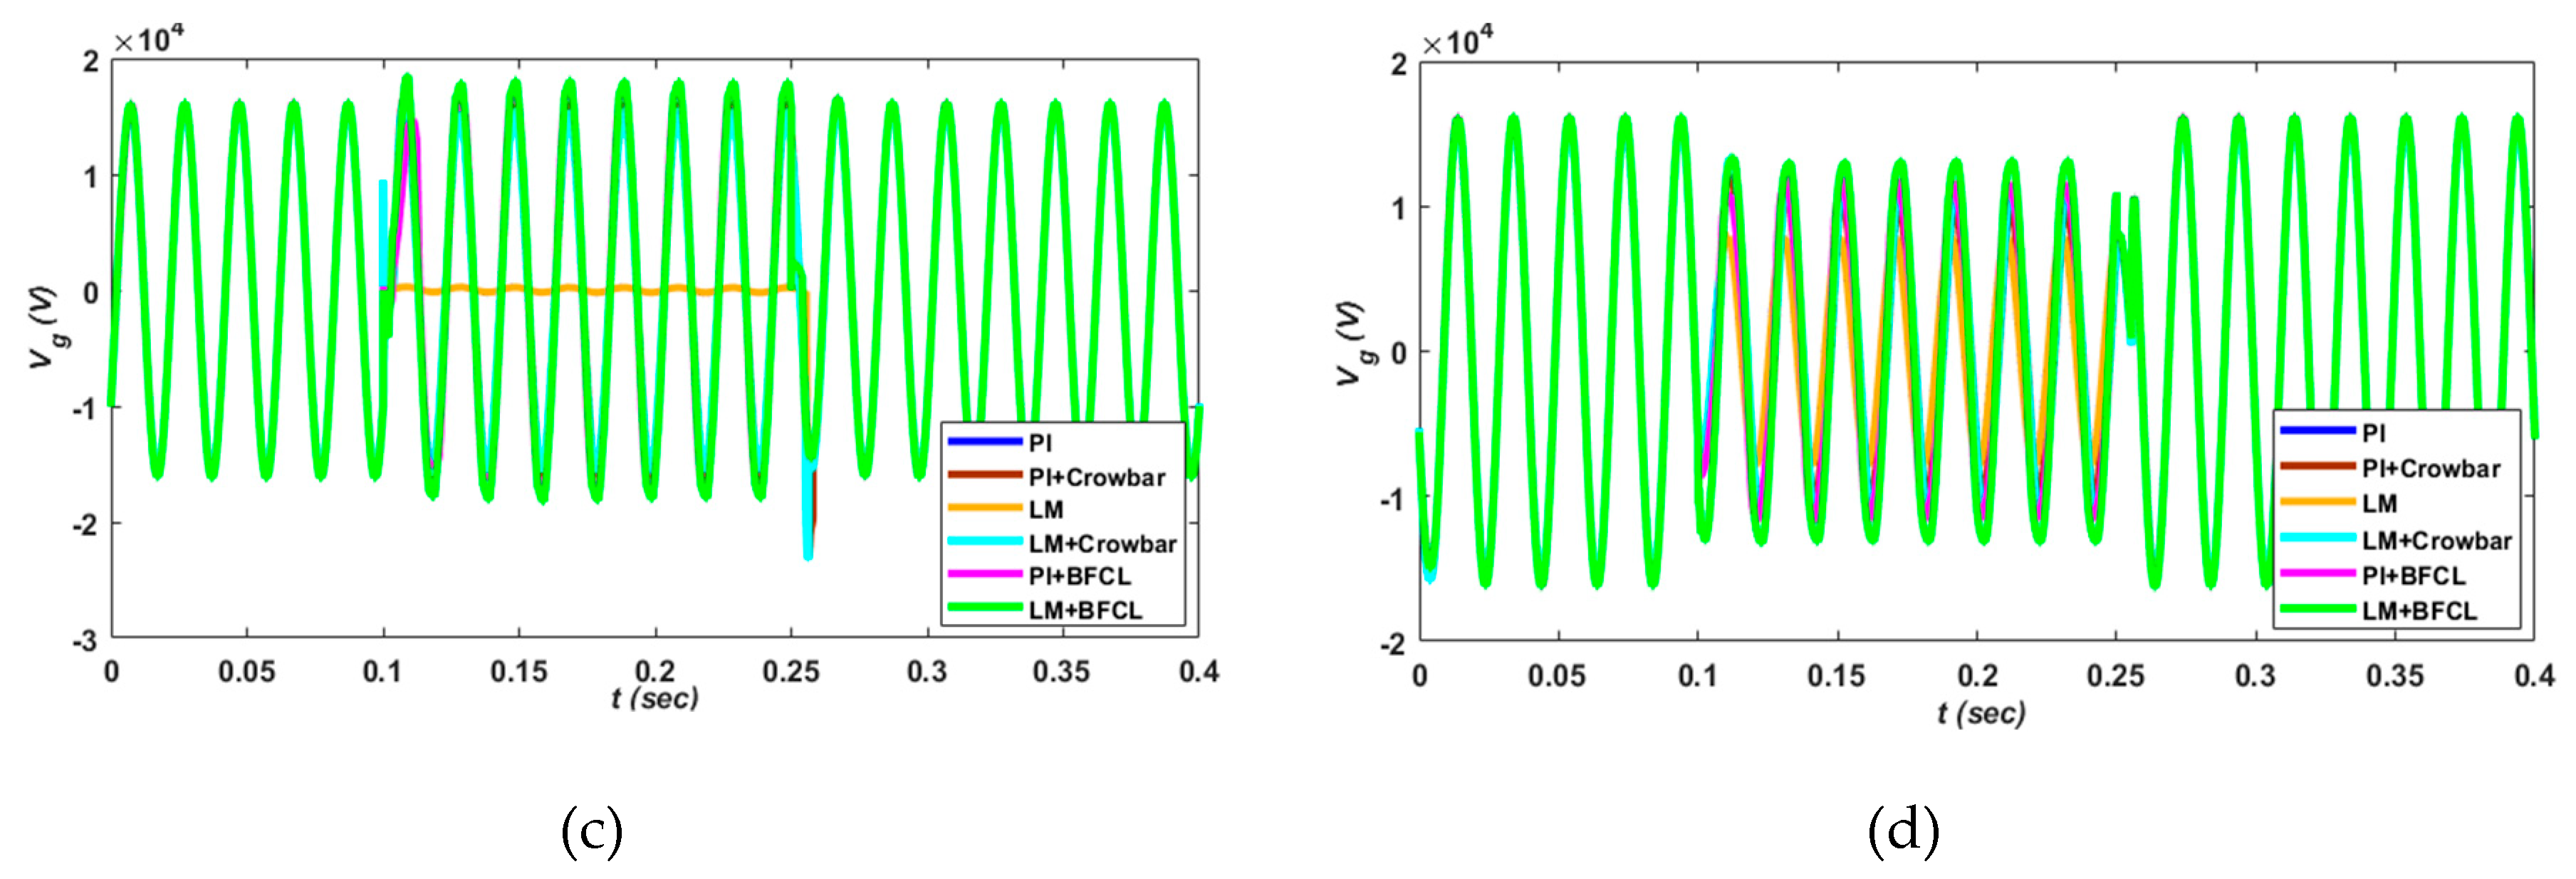
The small decrease in current and increase in grid voltage due to faults at 5-km of distance from PCC are shown in
Figure 23. Same as in PCC, grid currents and voltages at 5-km away abnormalities result in spikes and ripples with conventional crowbar circuitry.
The frequency response is approximately the same as in PCC since frequency is independent of line resistance, which is shown by
Figure 24 for asymmetrical faults at the 5-km distance of the distribution line.
Moreover, the grid side parameters like PV power, current, and voltage authenticates the efficiency of the proposed methodology even at fault at the distribution line. However, negligible variations are there but these variations are for all combinations of presented schemes and the power law justifies in this case, as discussed for faults in PCC. The simulated responses of PV parameters at P-G and P-P faults at 5-km of distance from PCC are given by
Figure 25 below.


 ,
, 


