Effects of Sterols on the Interaction of SDS, Benzalkonium Chloride, and A Novel Compound, Kor105, with Membranes

 ,
,  ,
,  ,
, 
Abstract
:1. Introduction
2. Materials and Methods
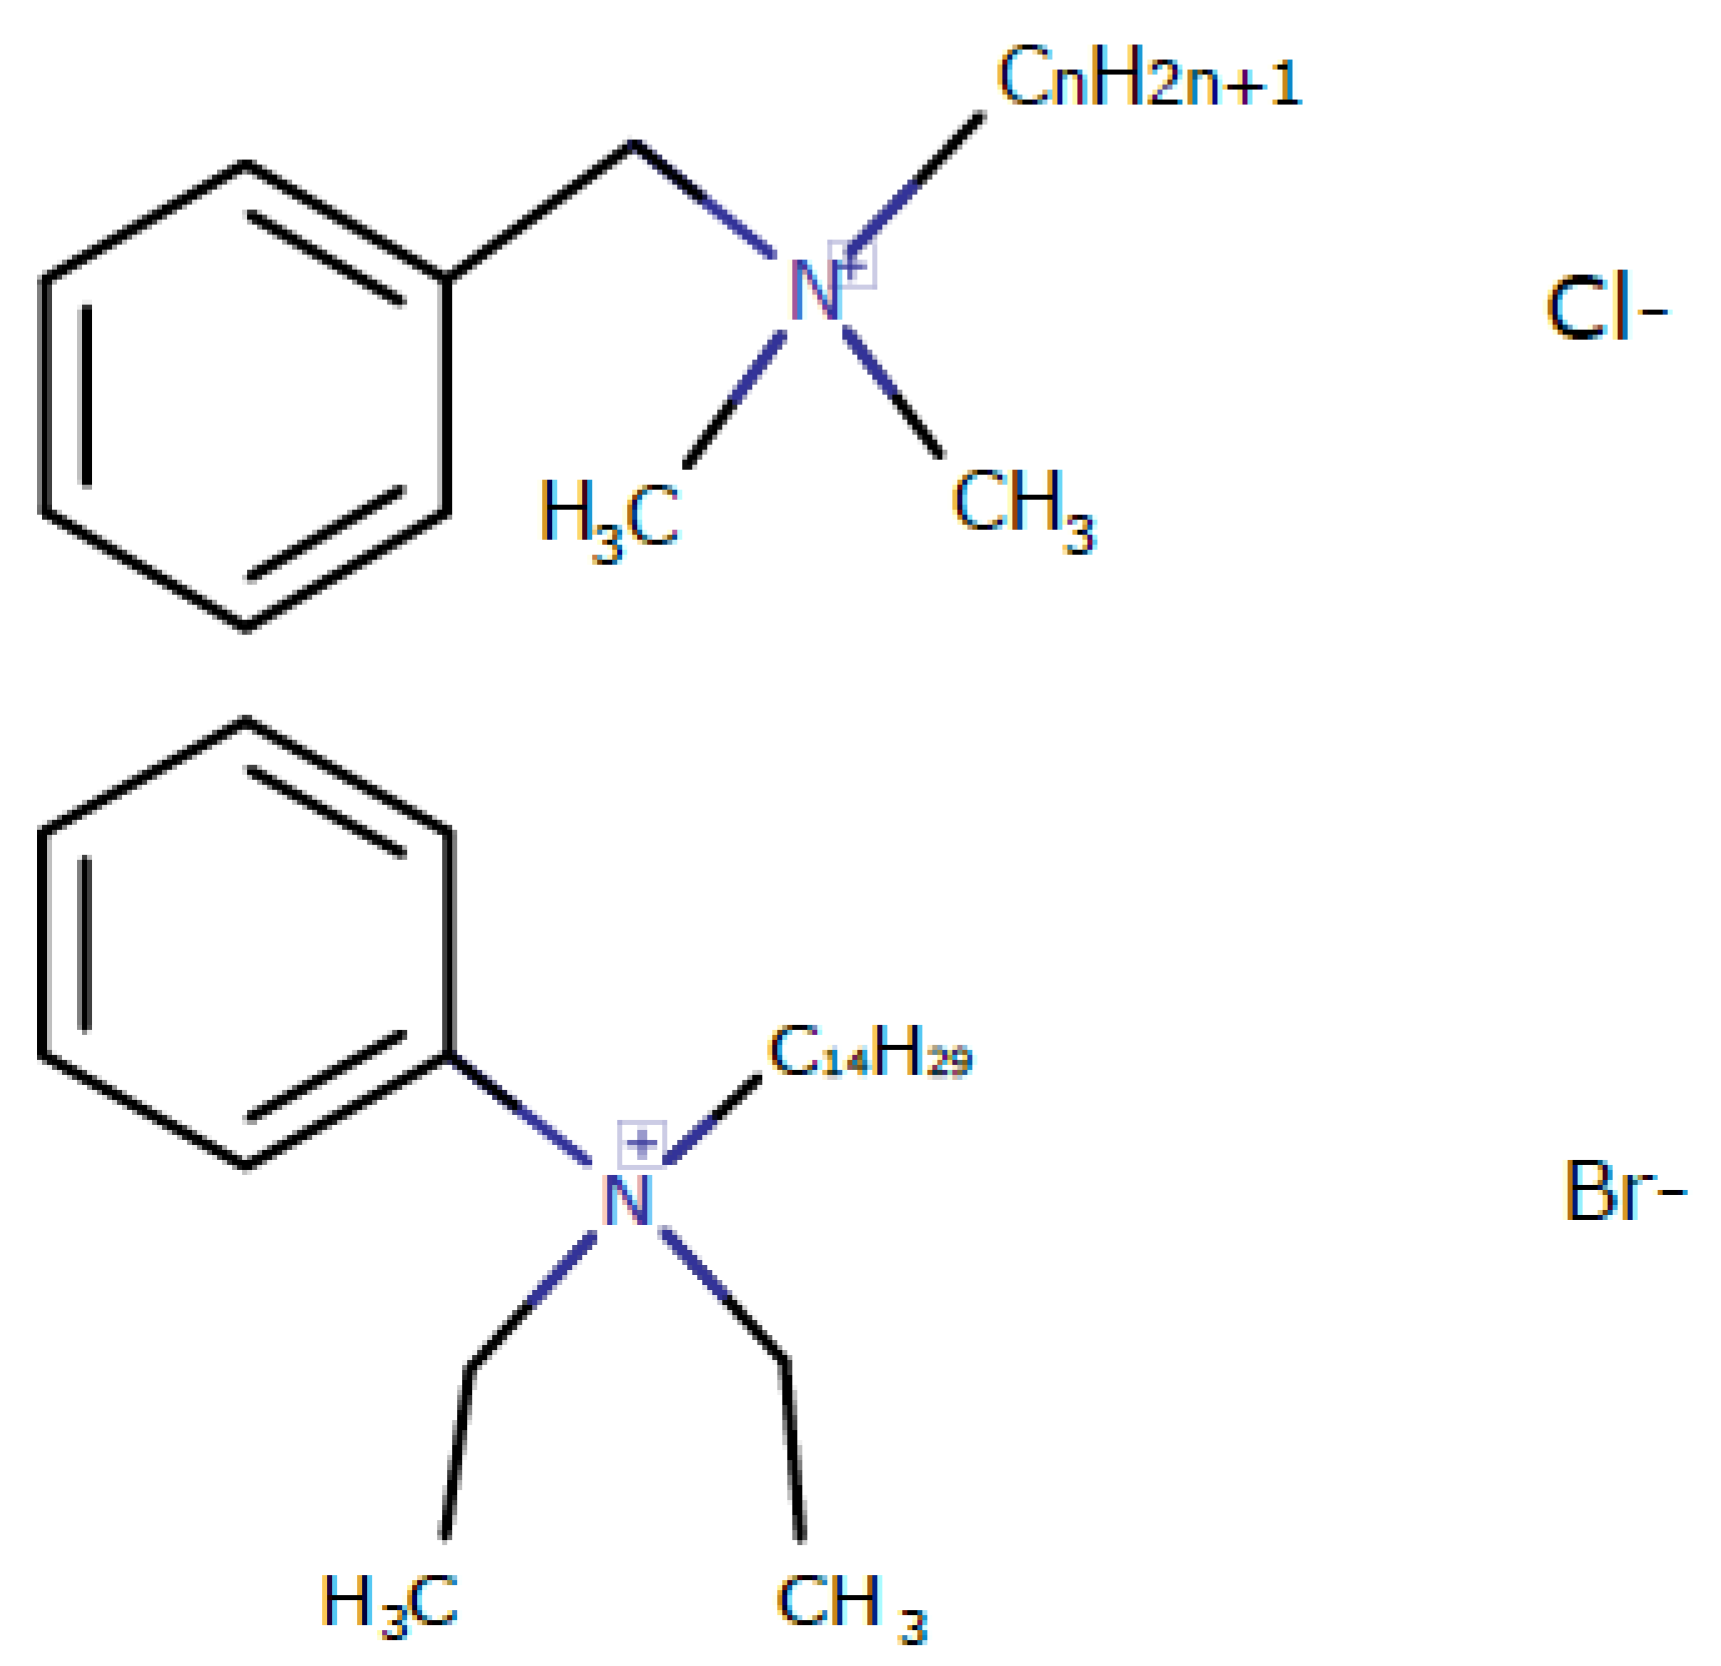
2.1. Synthesis of Kor105 (Diethyl (Tetradecyl) Phenyl Ammonium Bromide)
2.2. Study of the Effect of BAC and Kor105 on Model Membranes
2.3. MD Modeling of Membranes with Incorporated Hydrophobic Ions
2.4. Yeast Strains and Growth Analysis
3. Results and Discussion
3.1. Effect of Hydrophobic Ions on Model Membranes
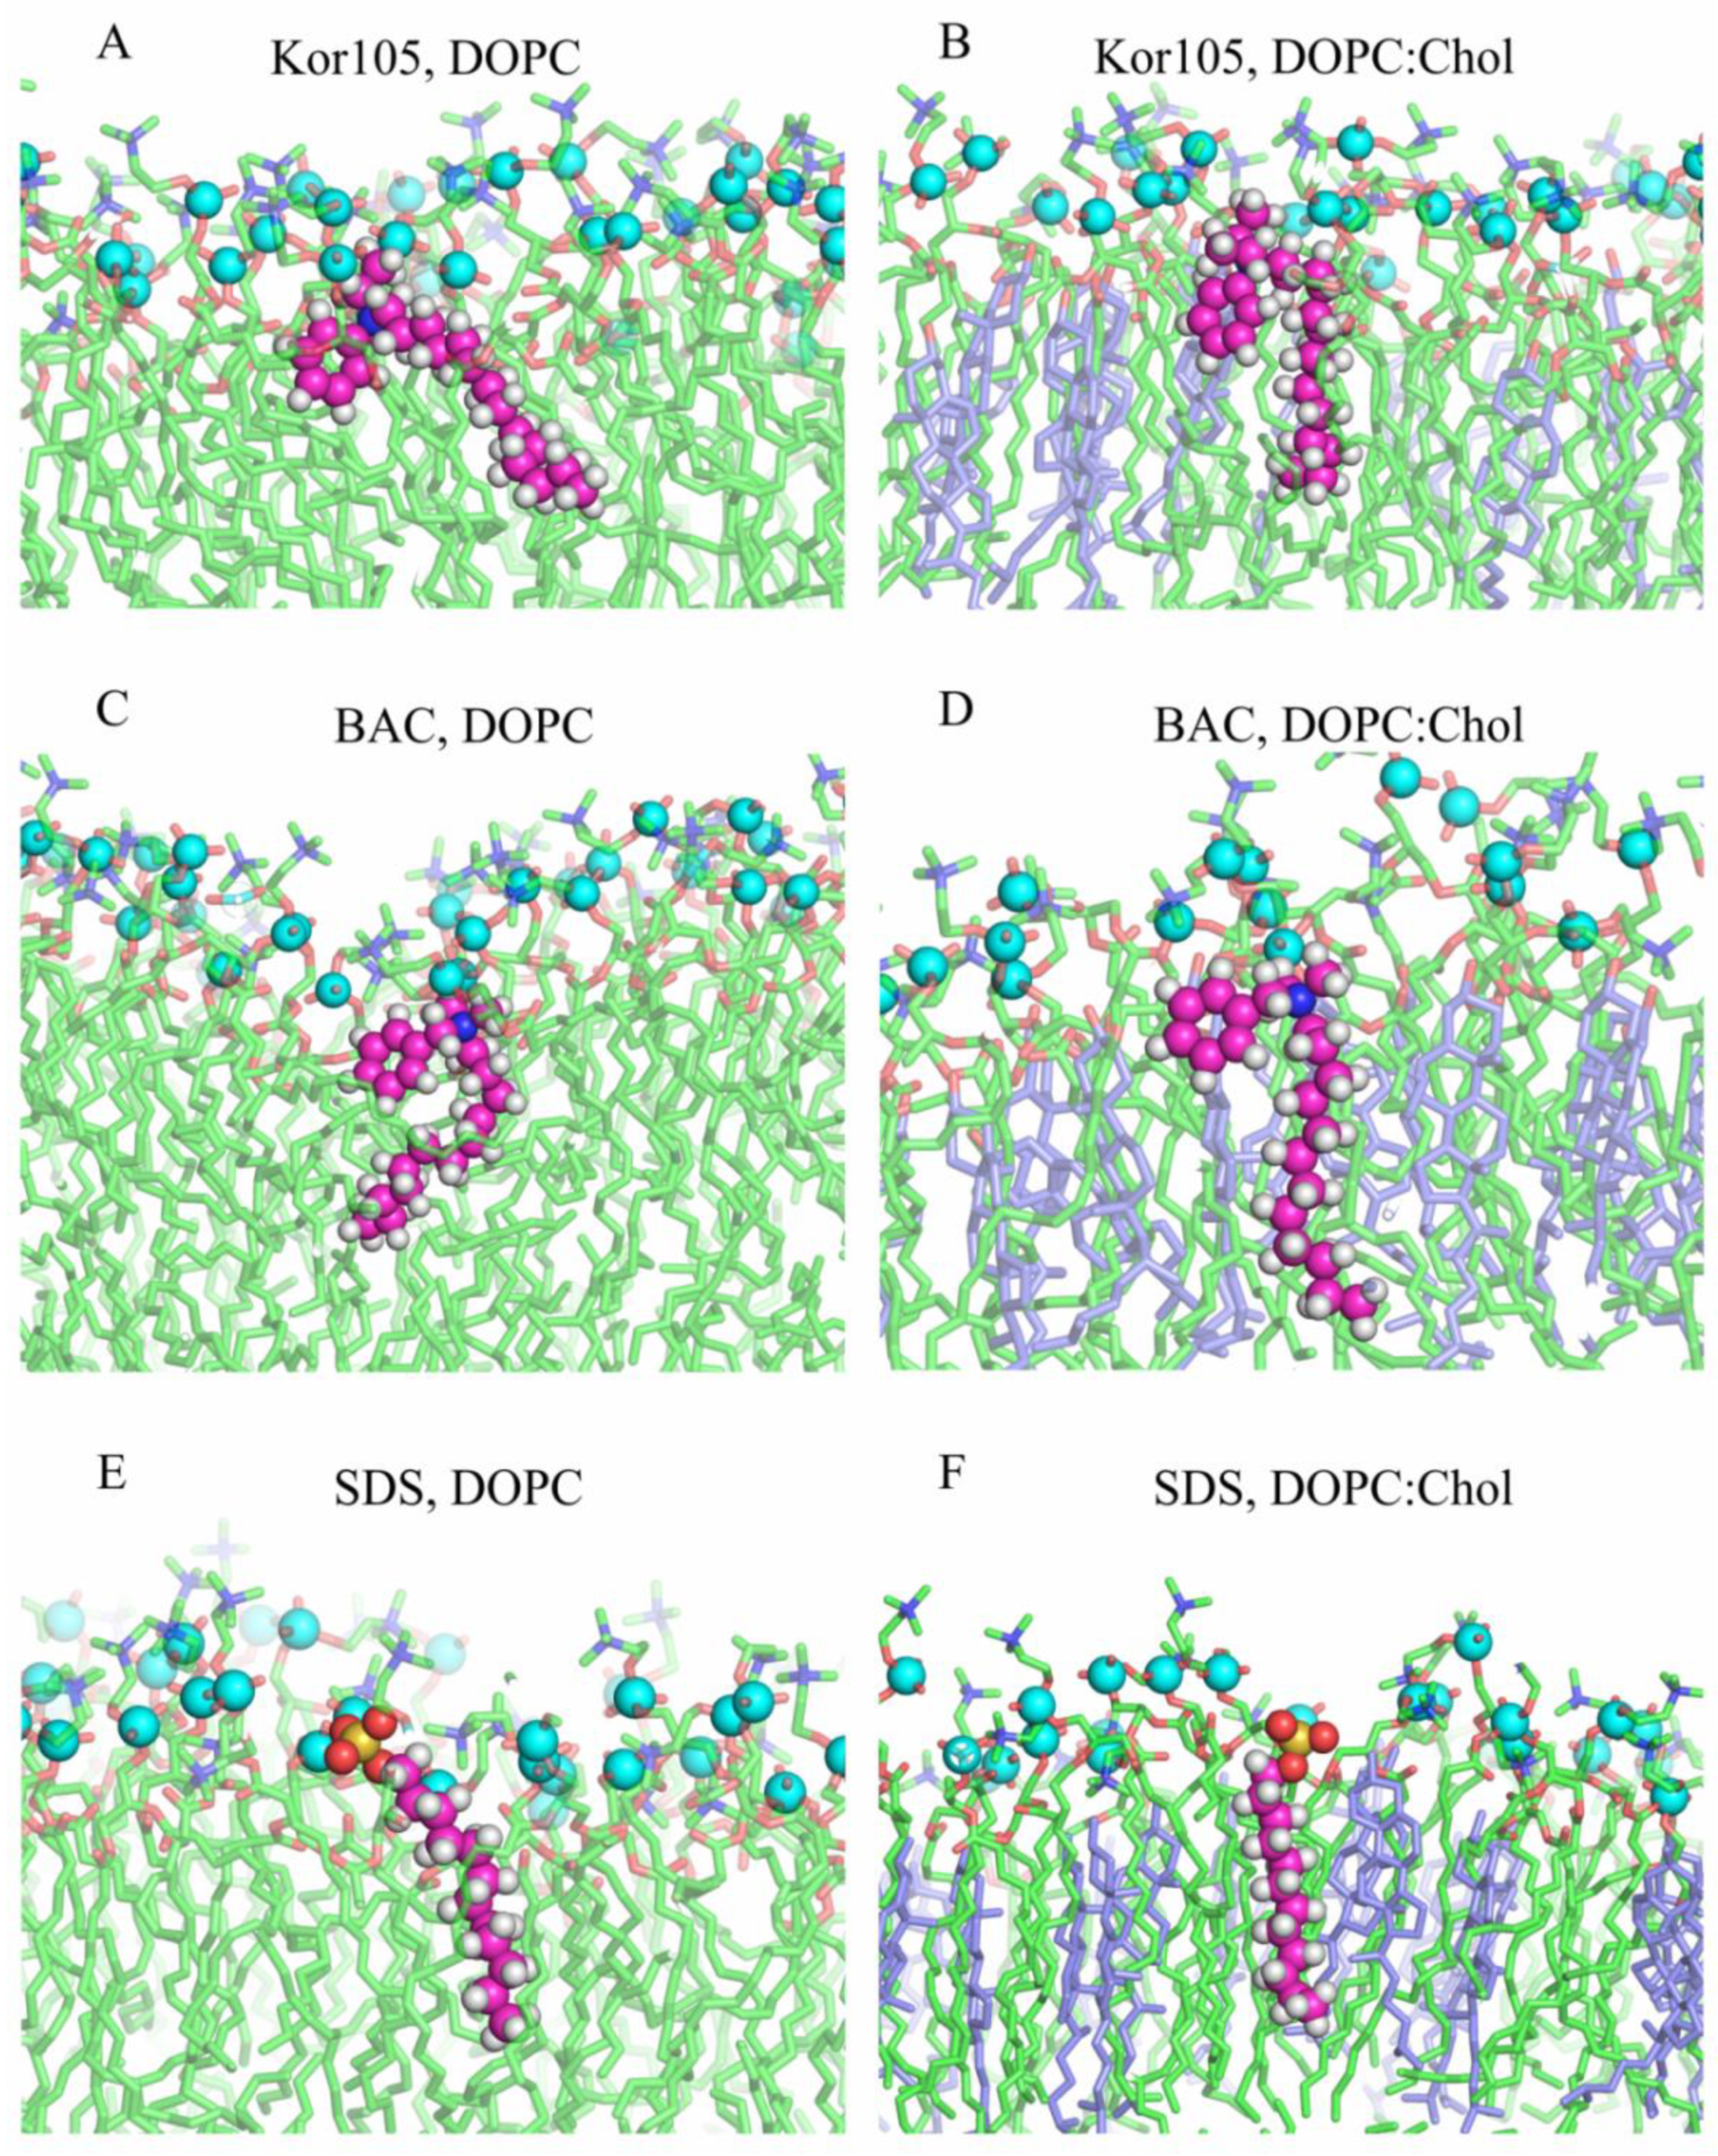
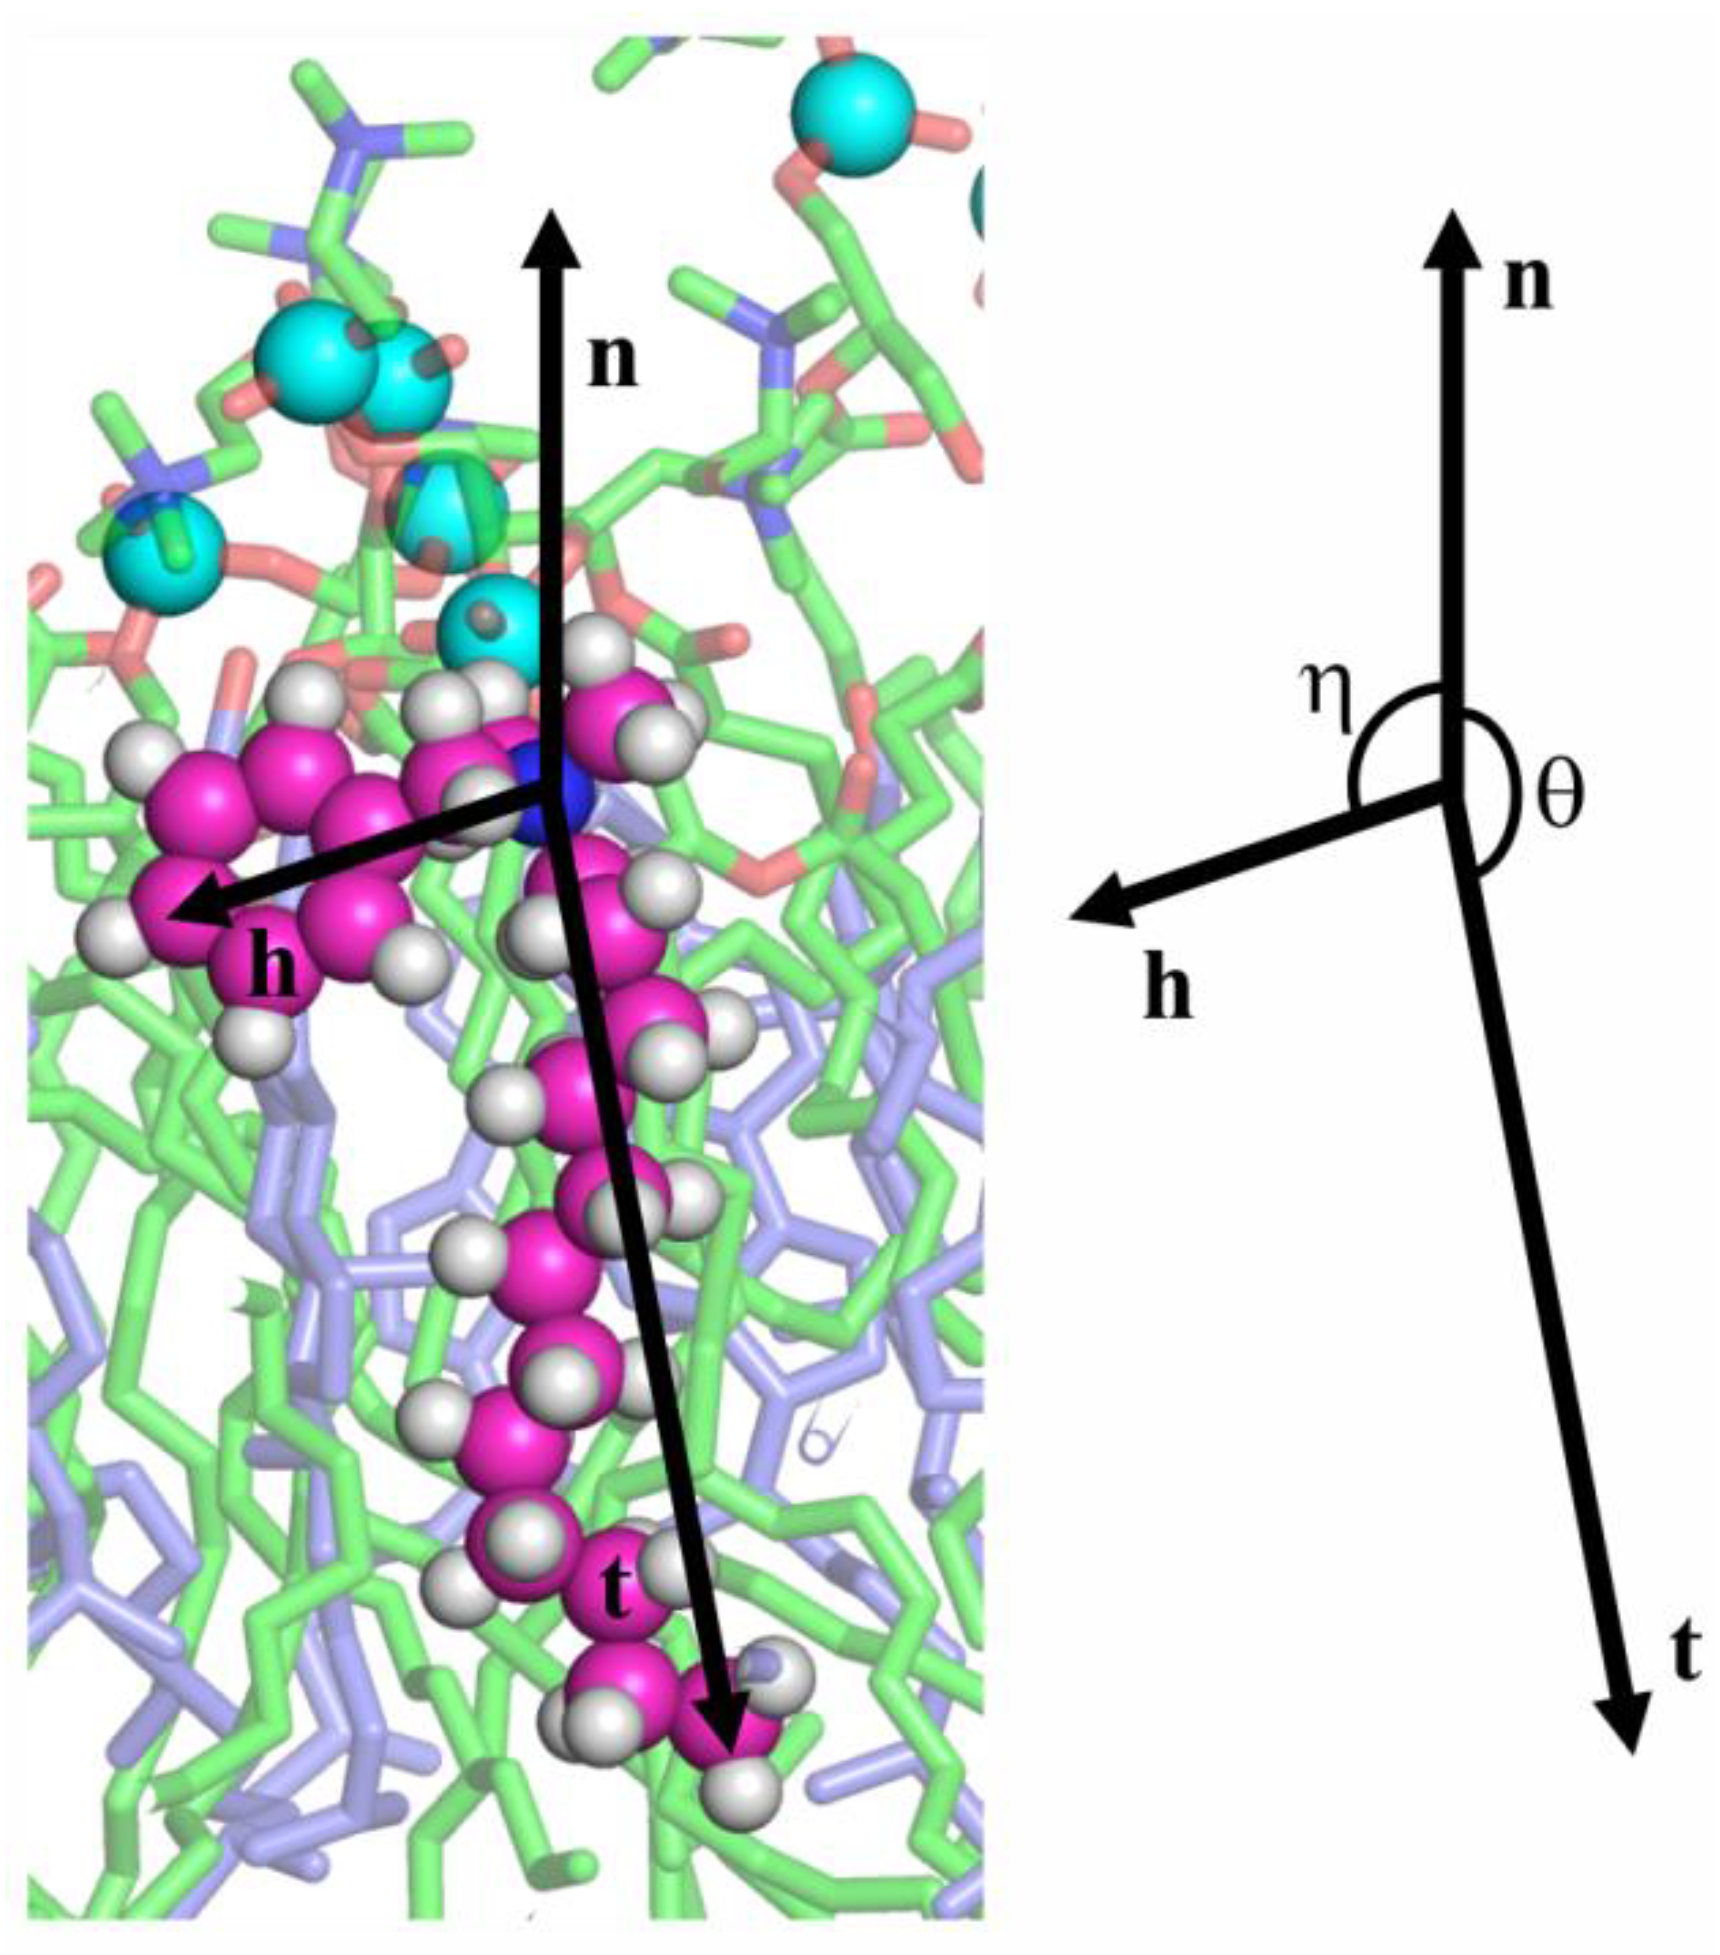
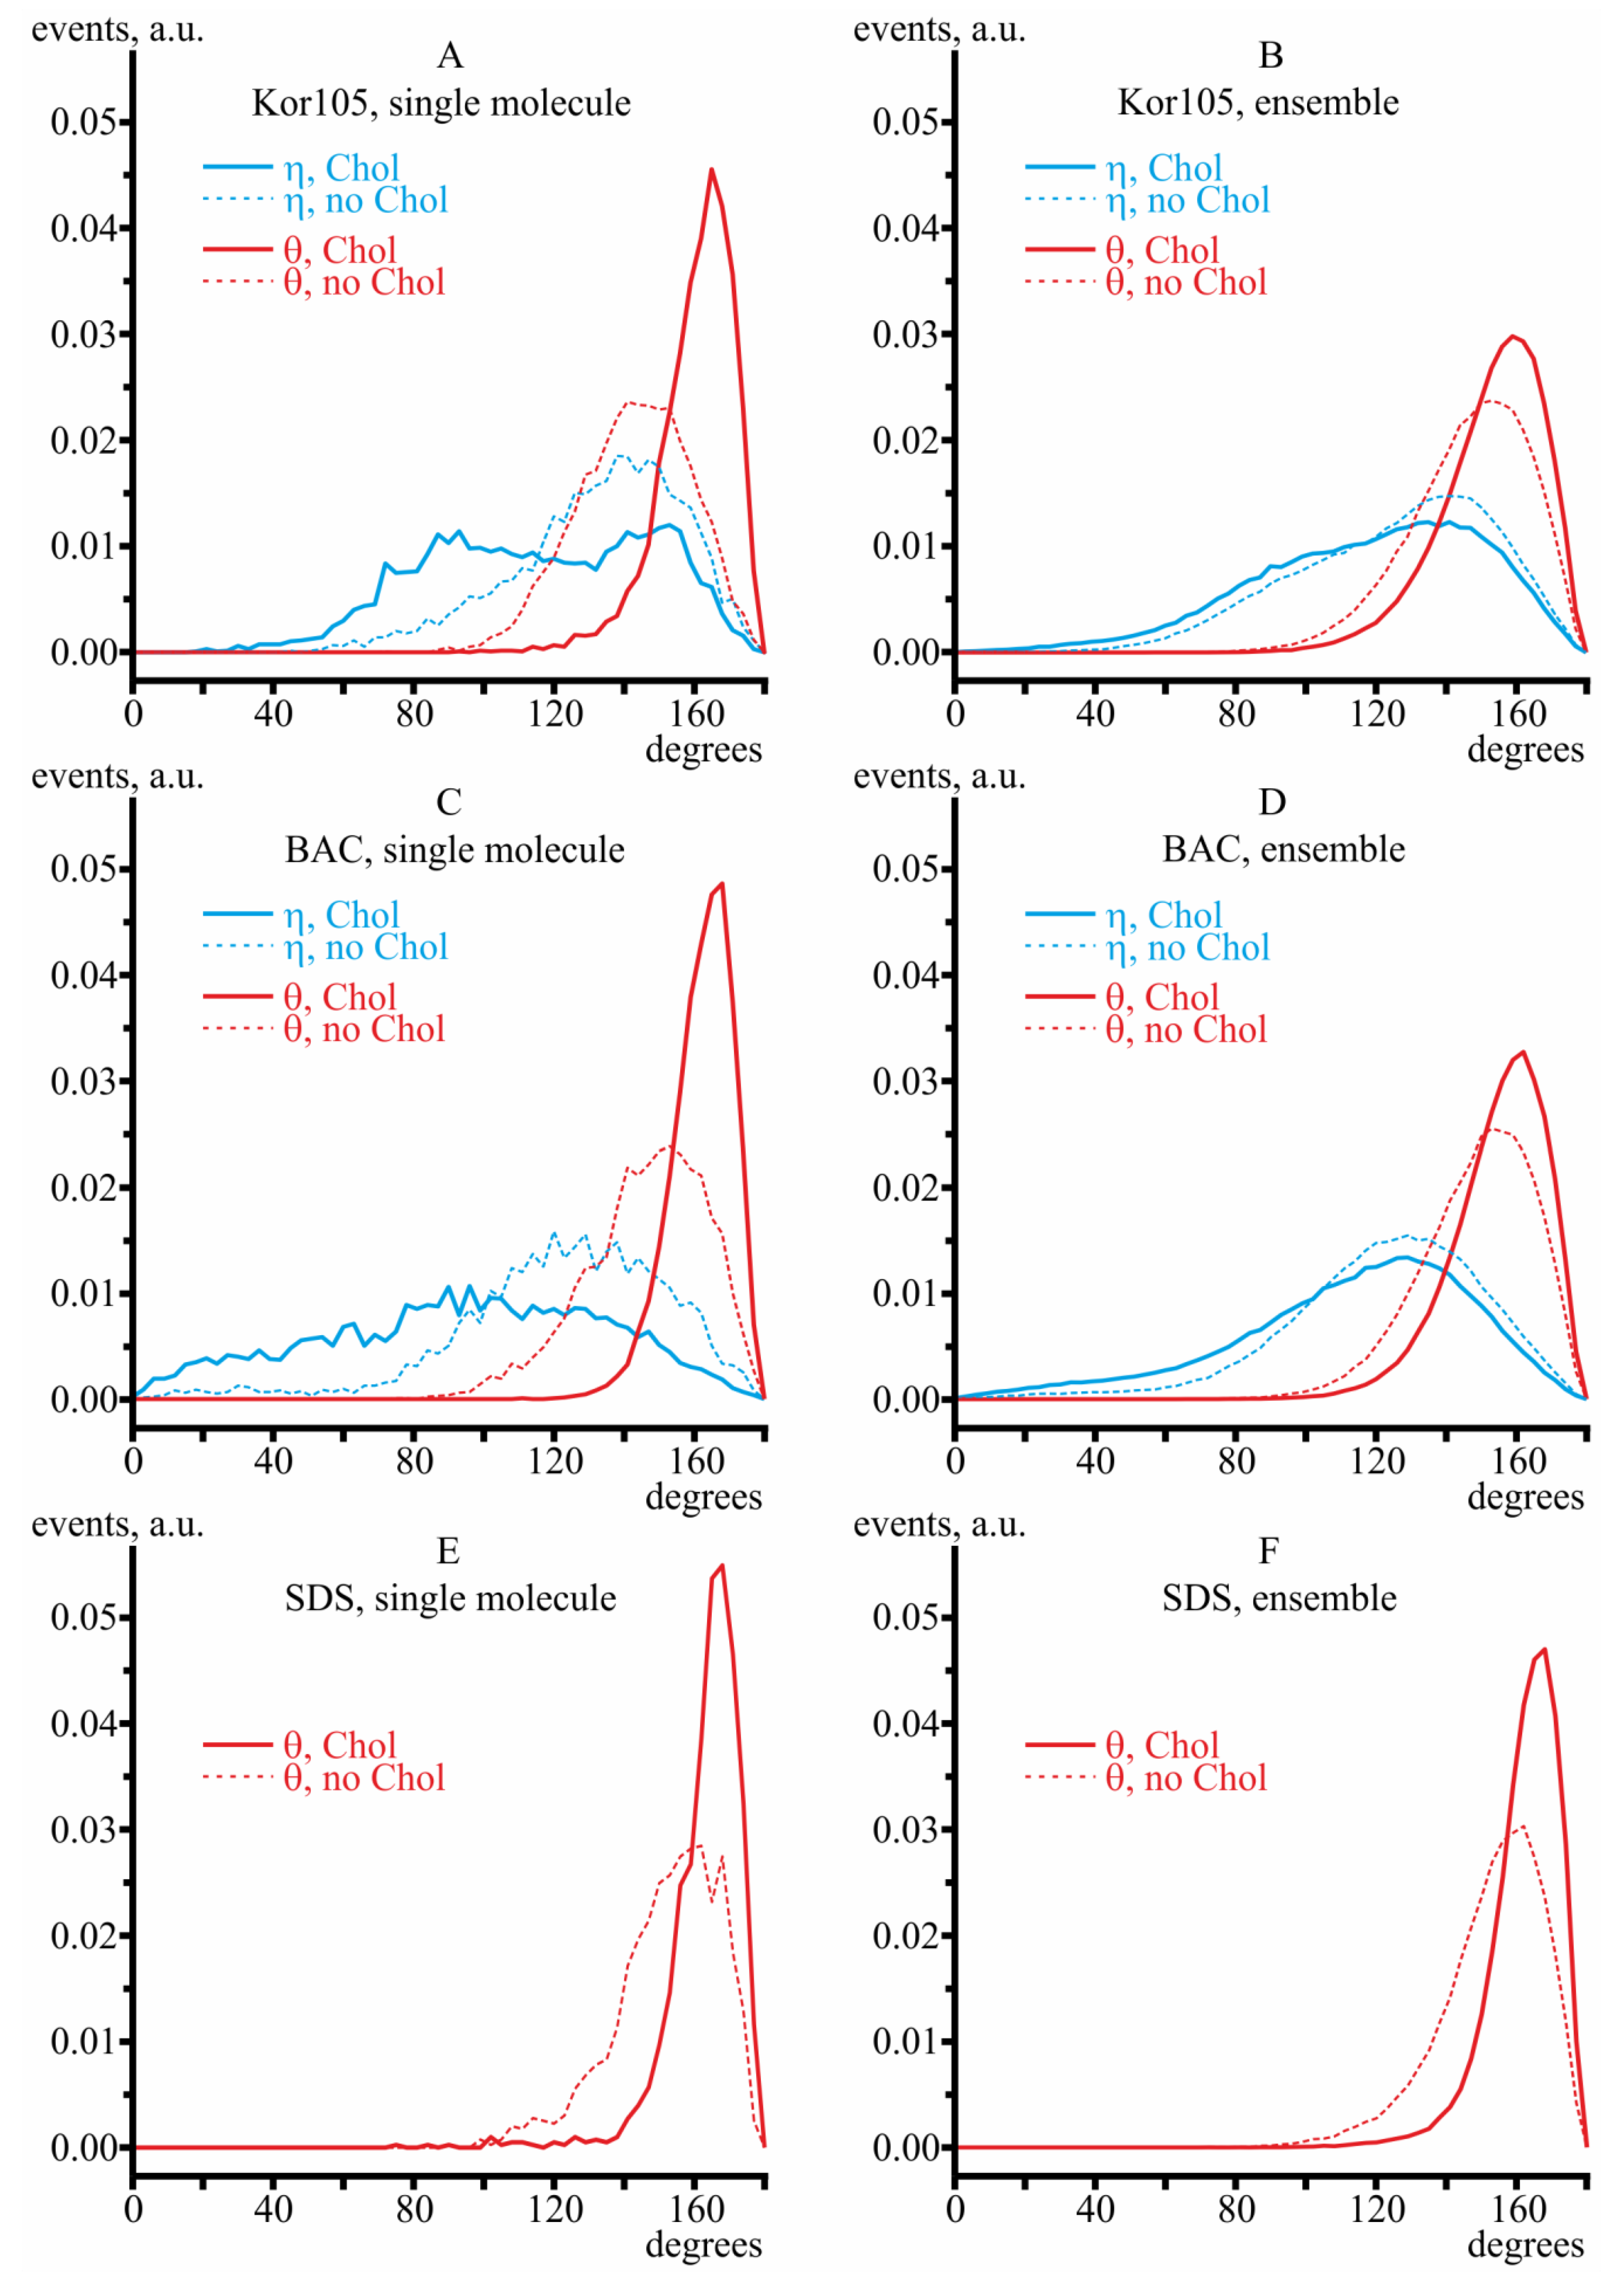
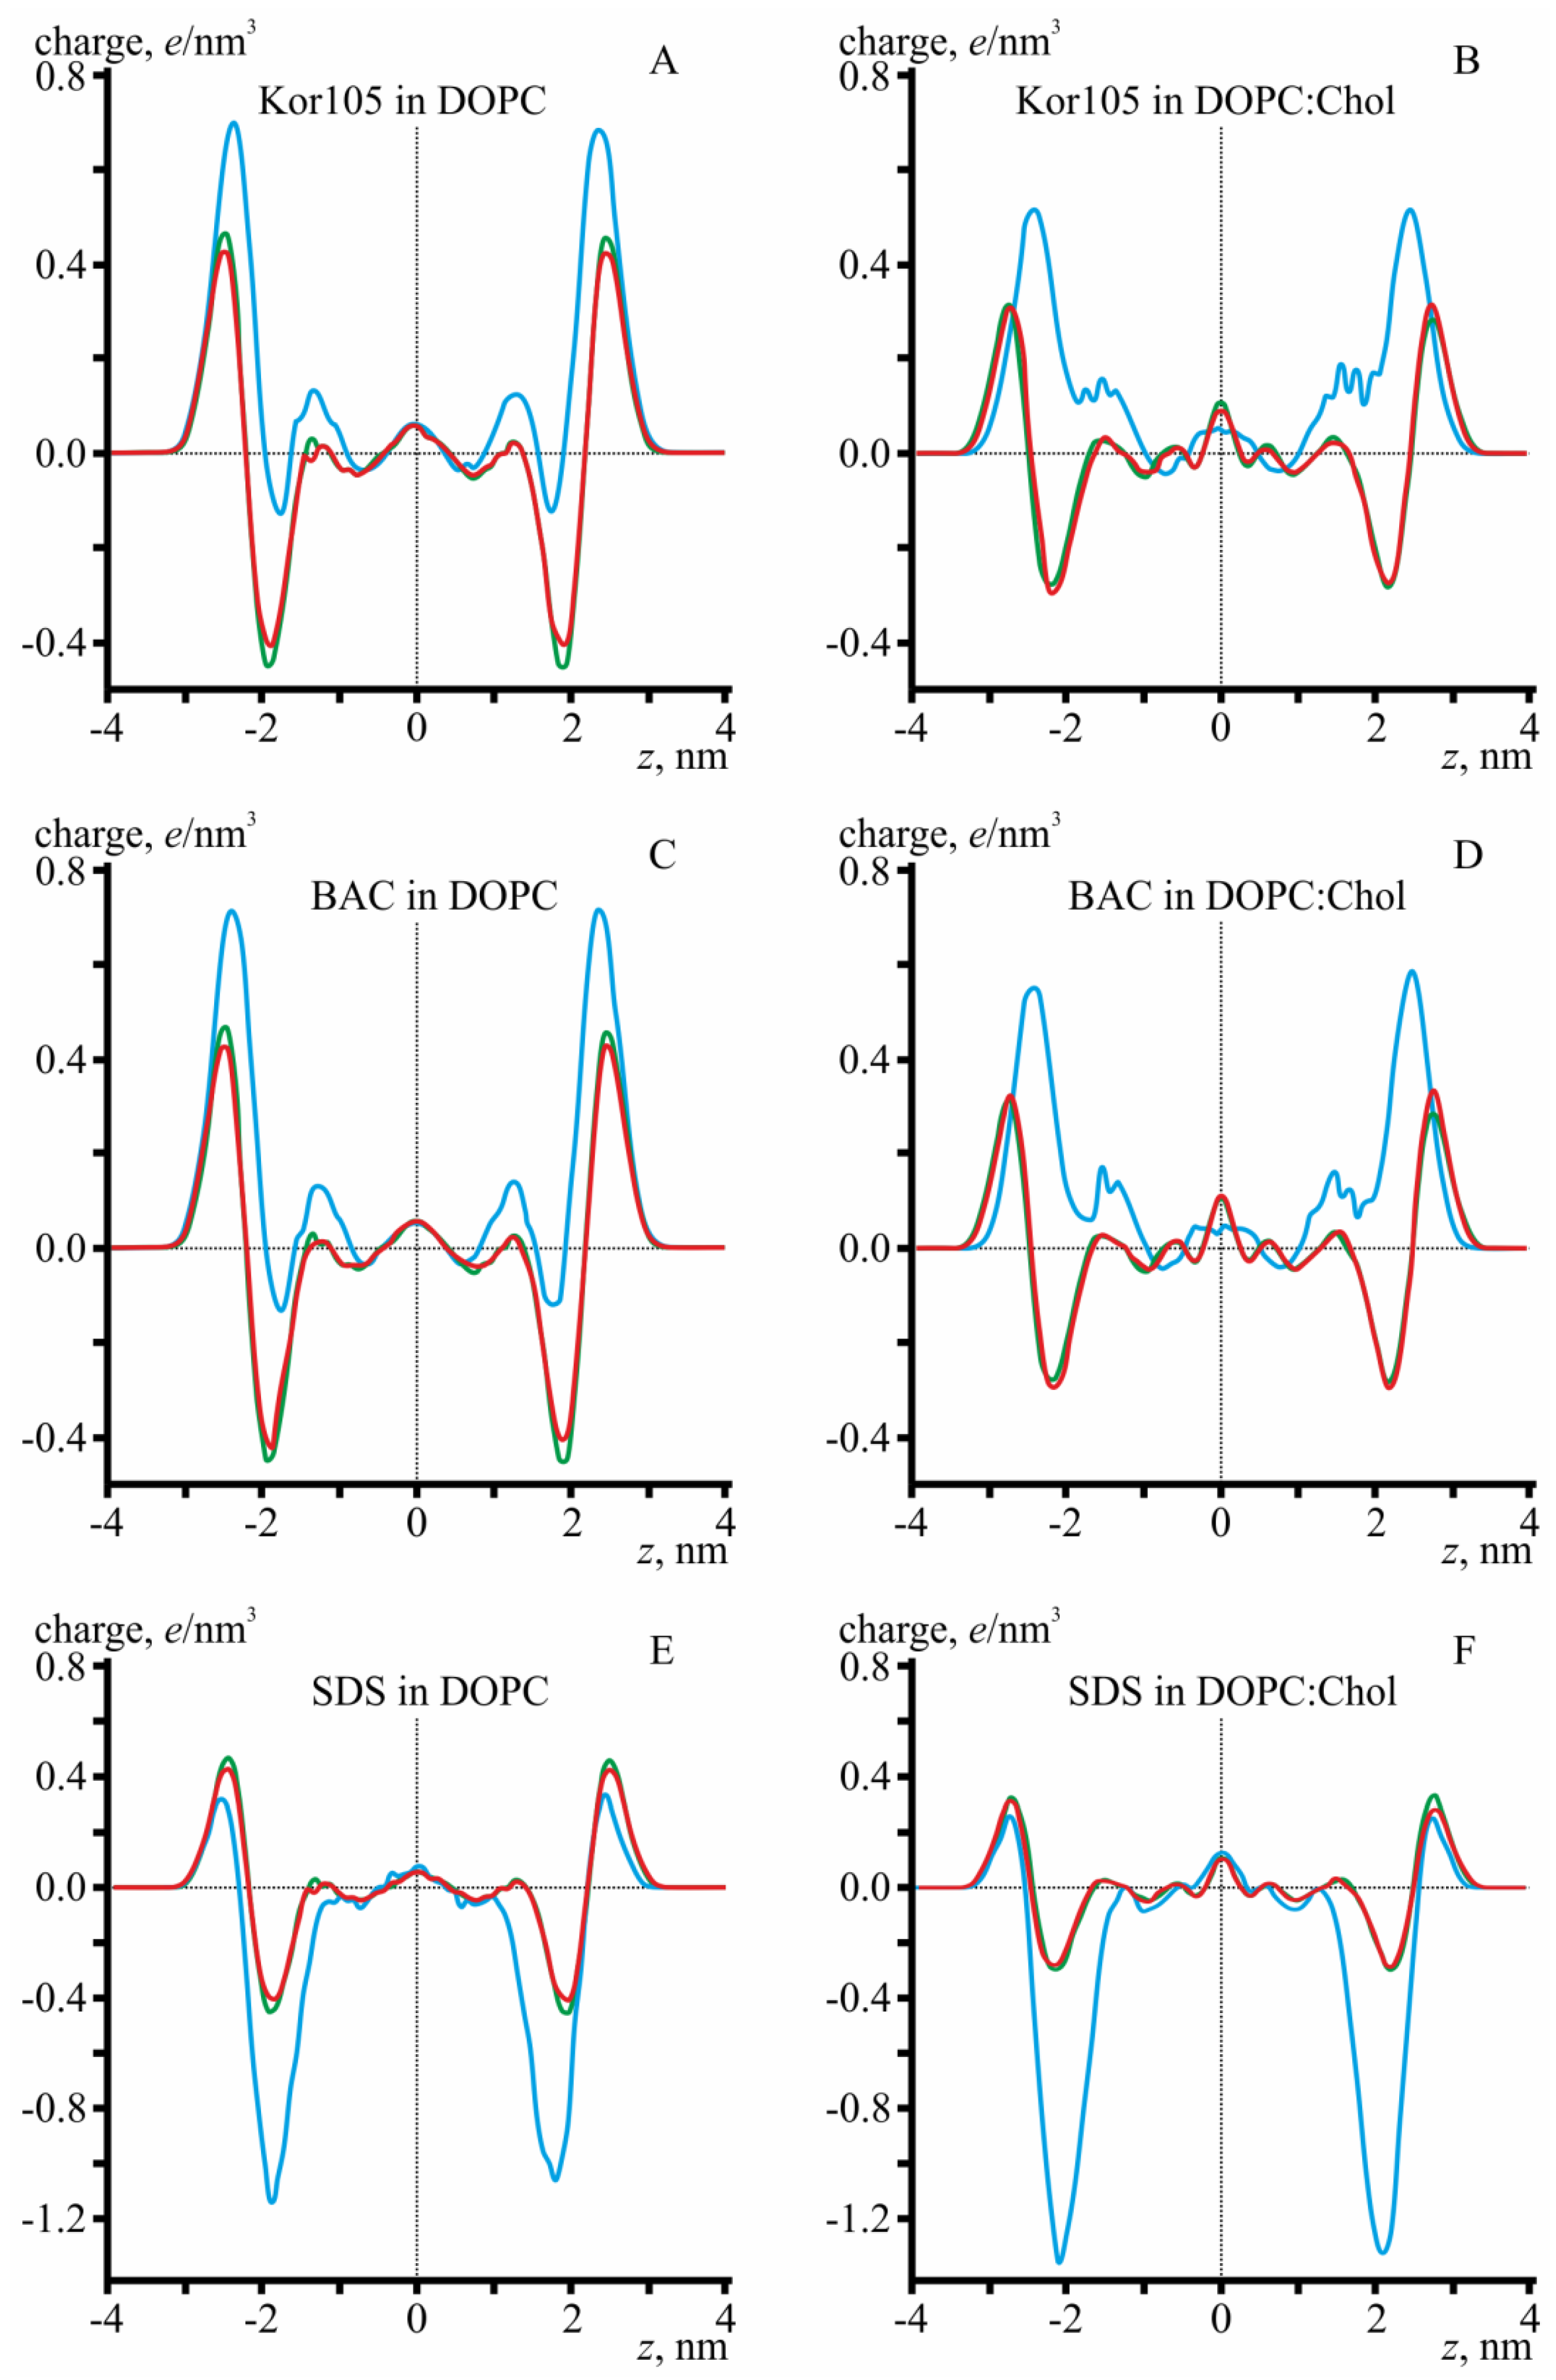
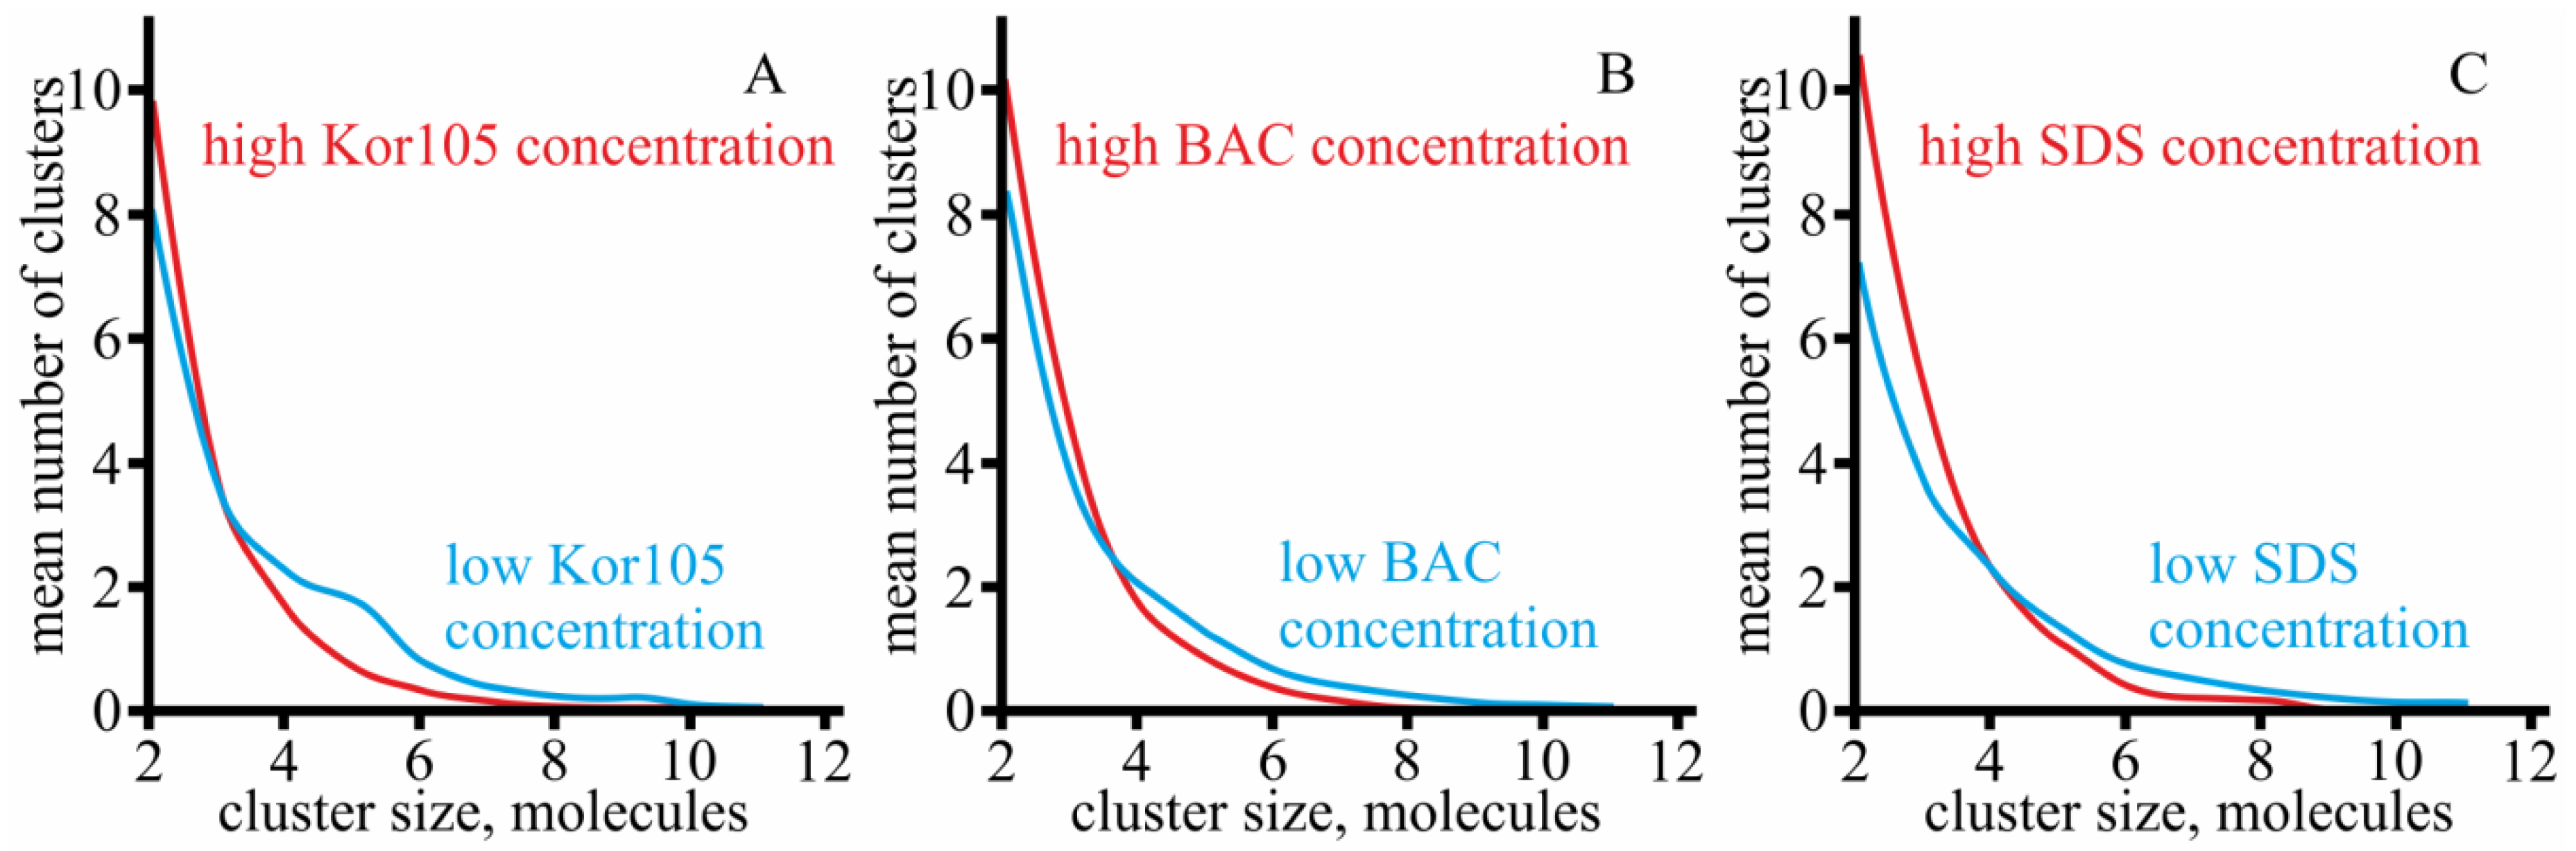
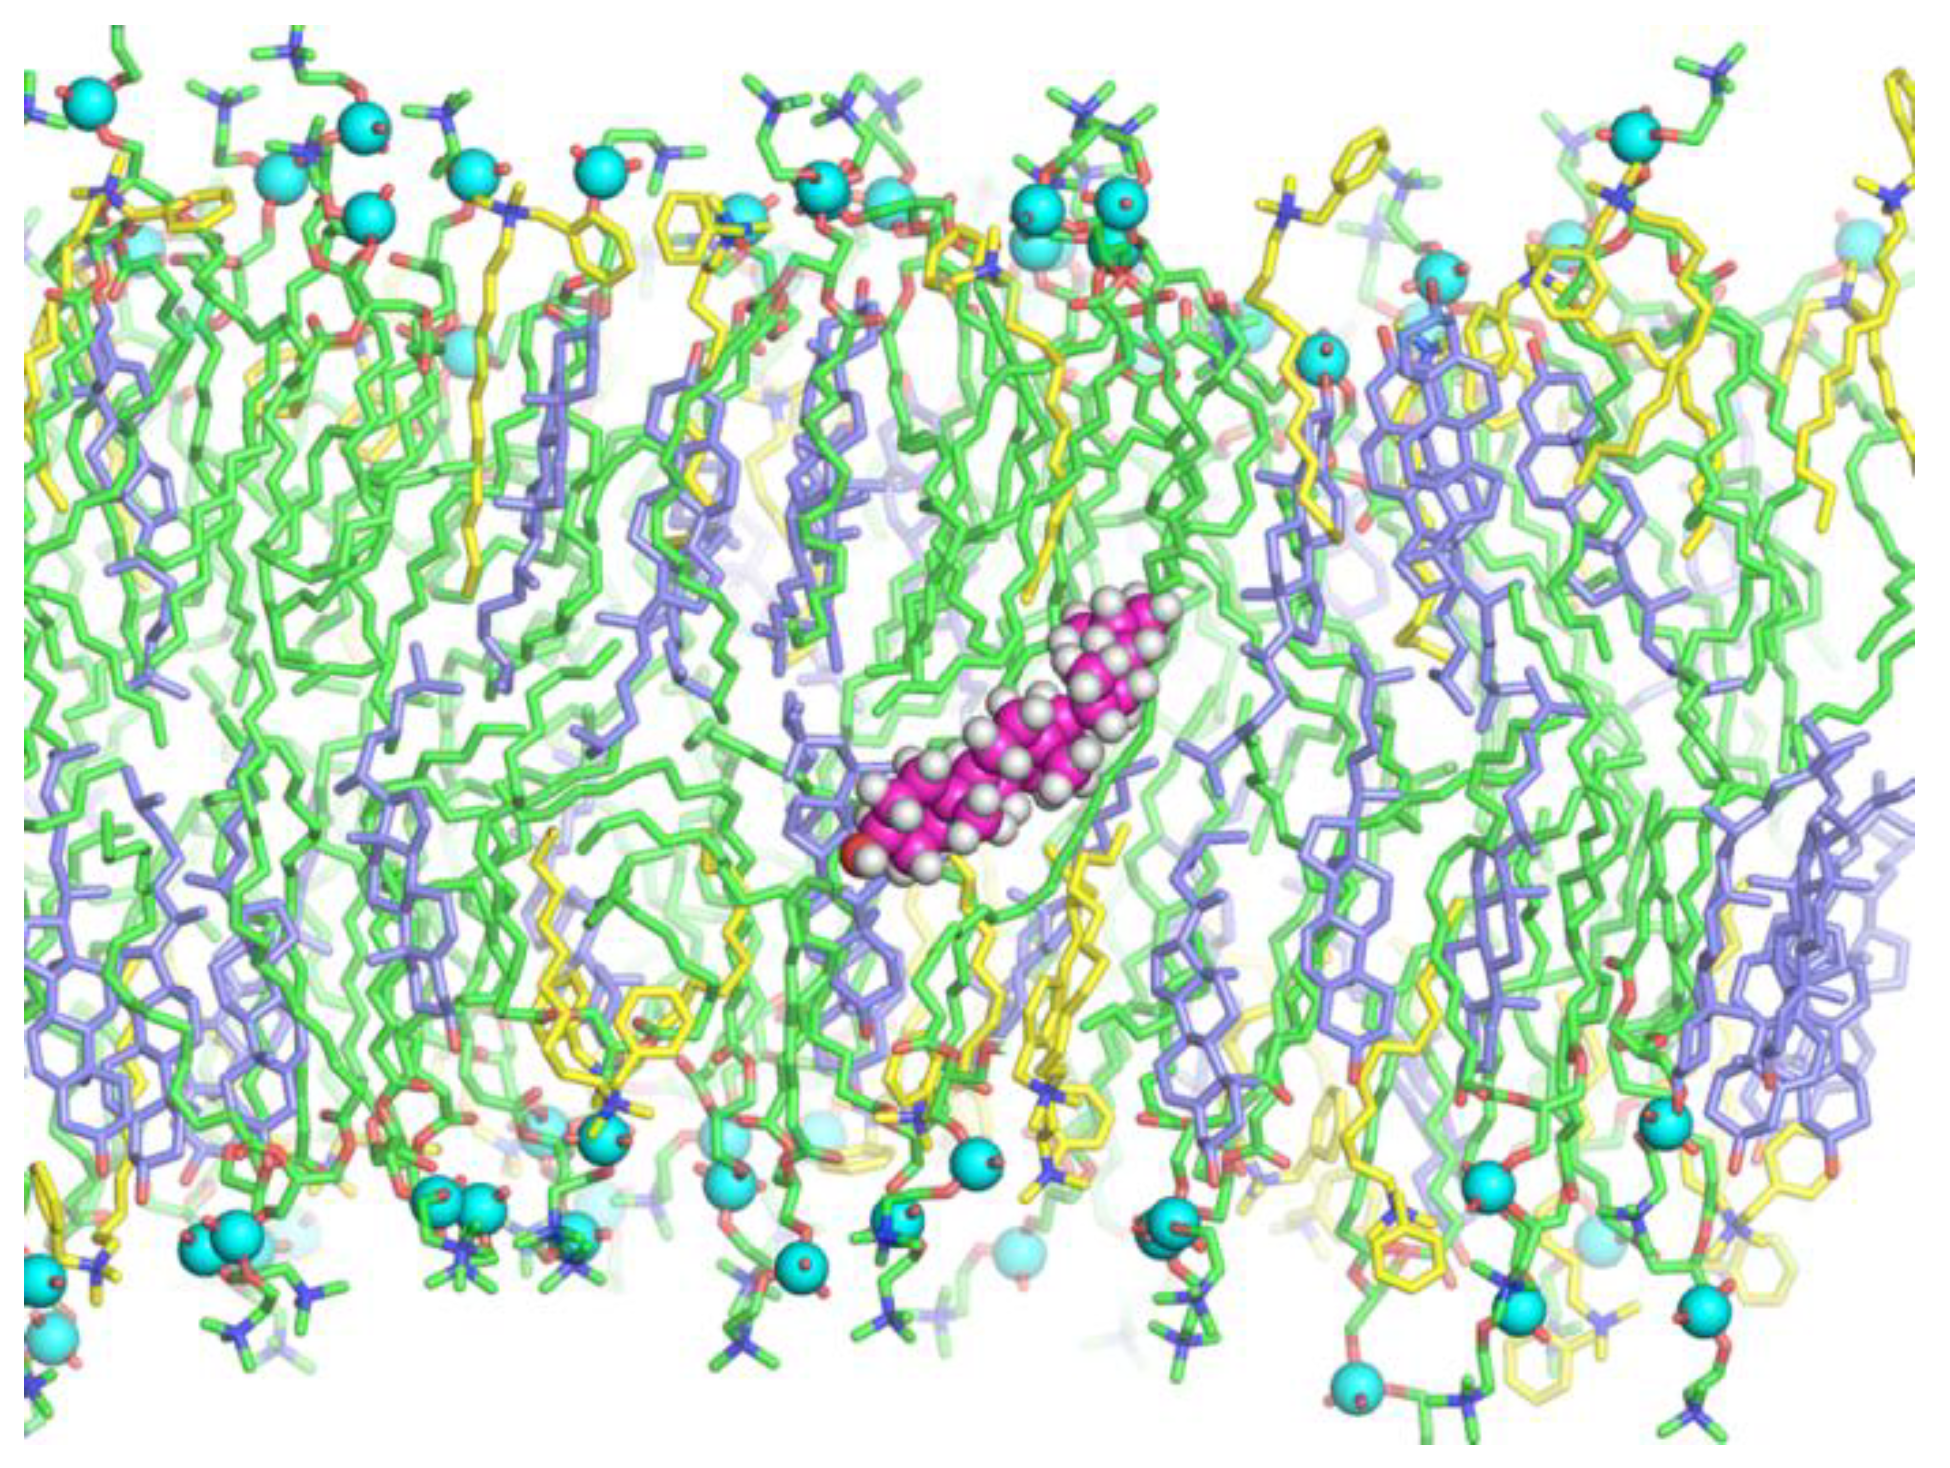
3.2. MD Modeling of Membranes with Incorporated Hydrophobic Ions
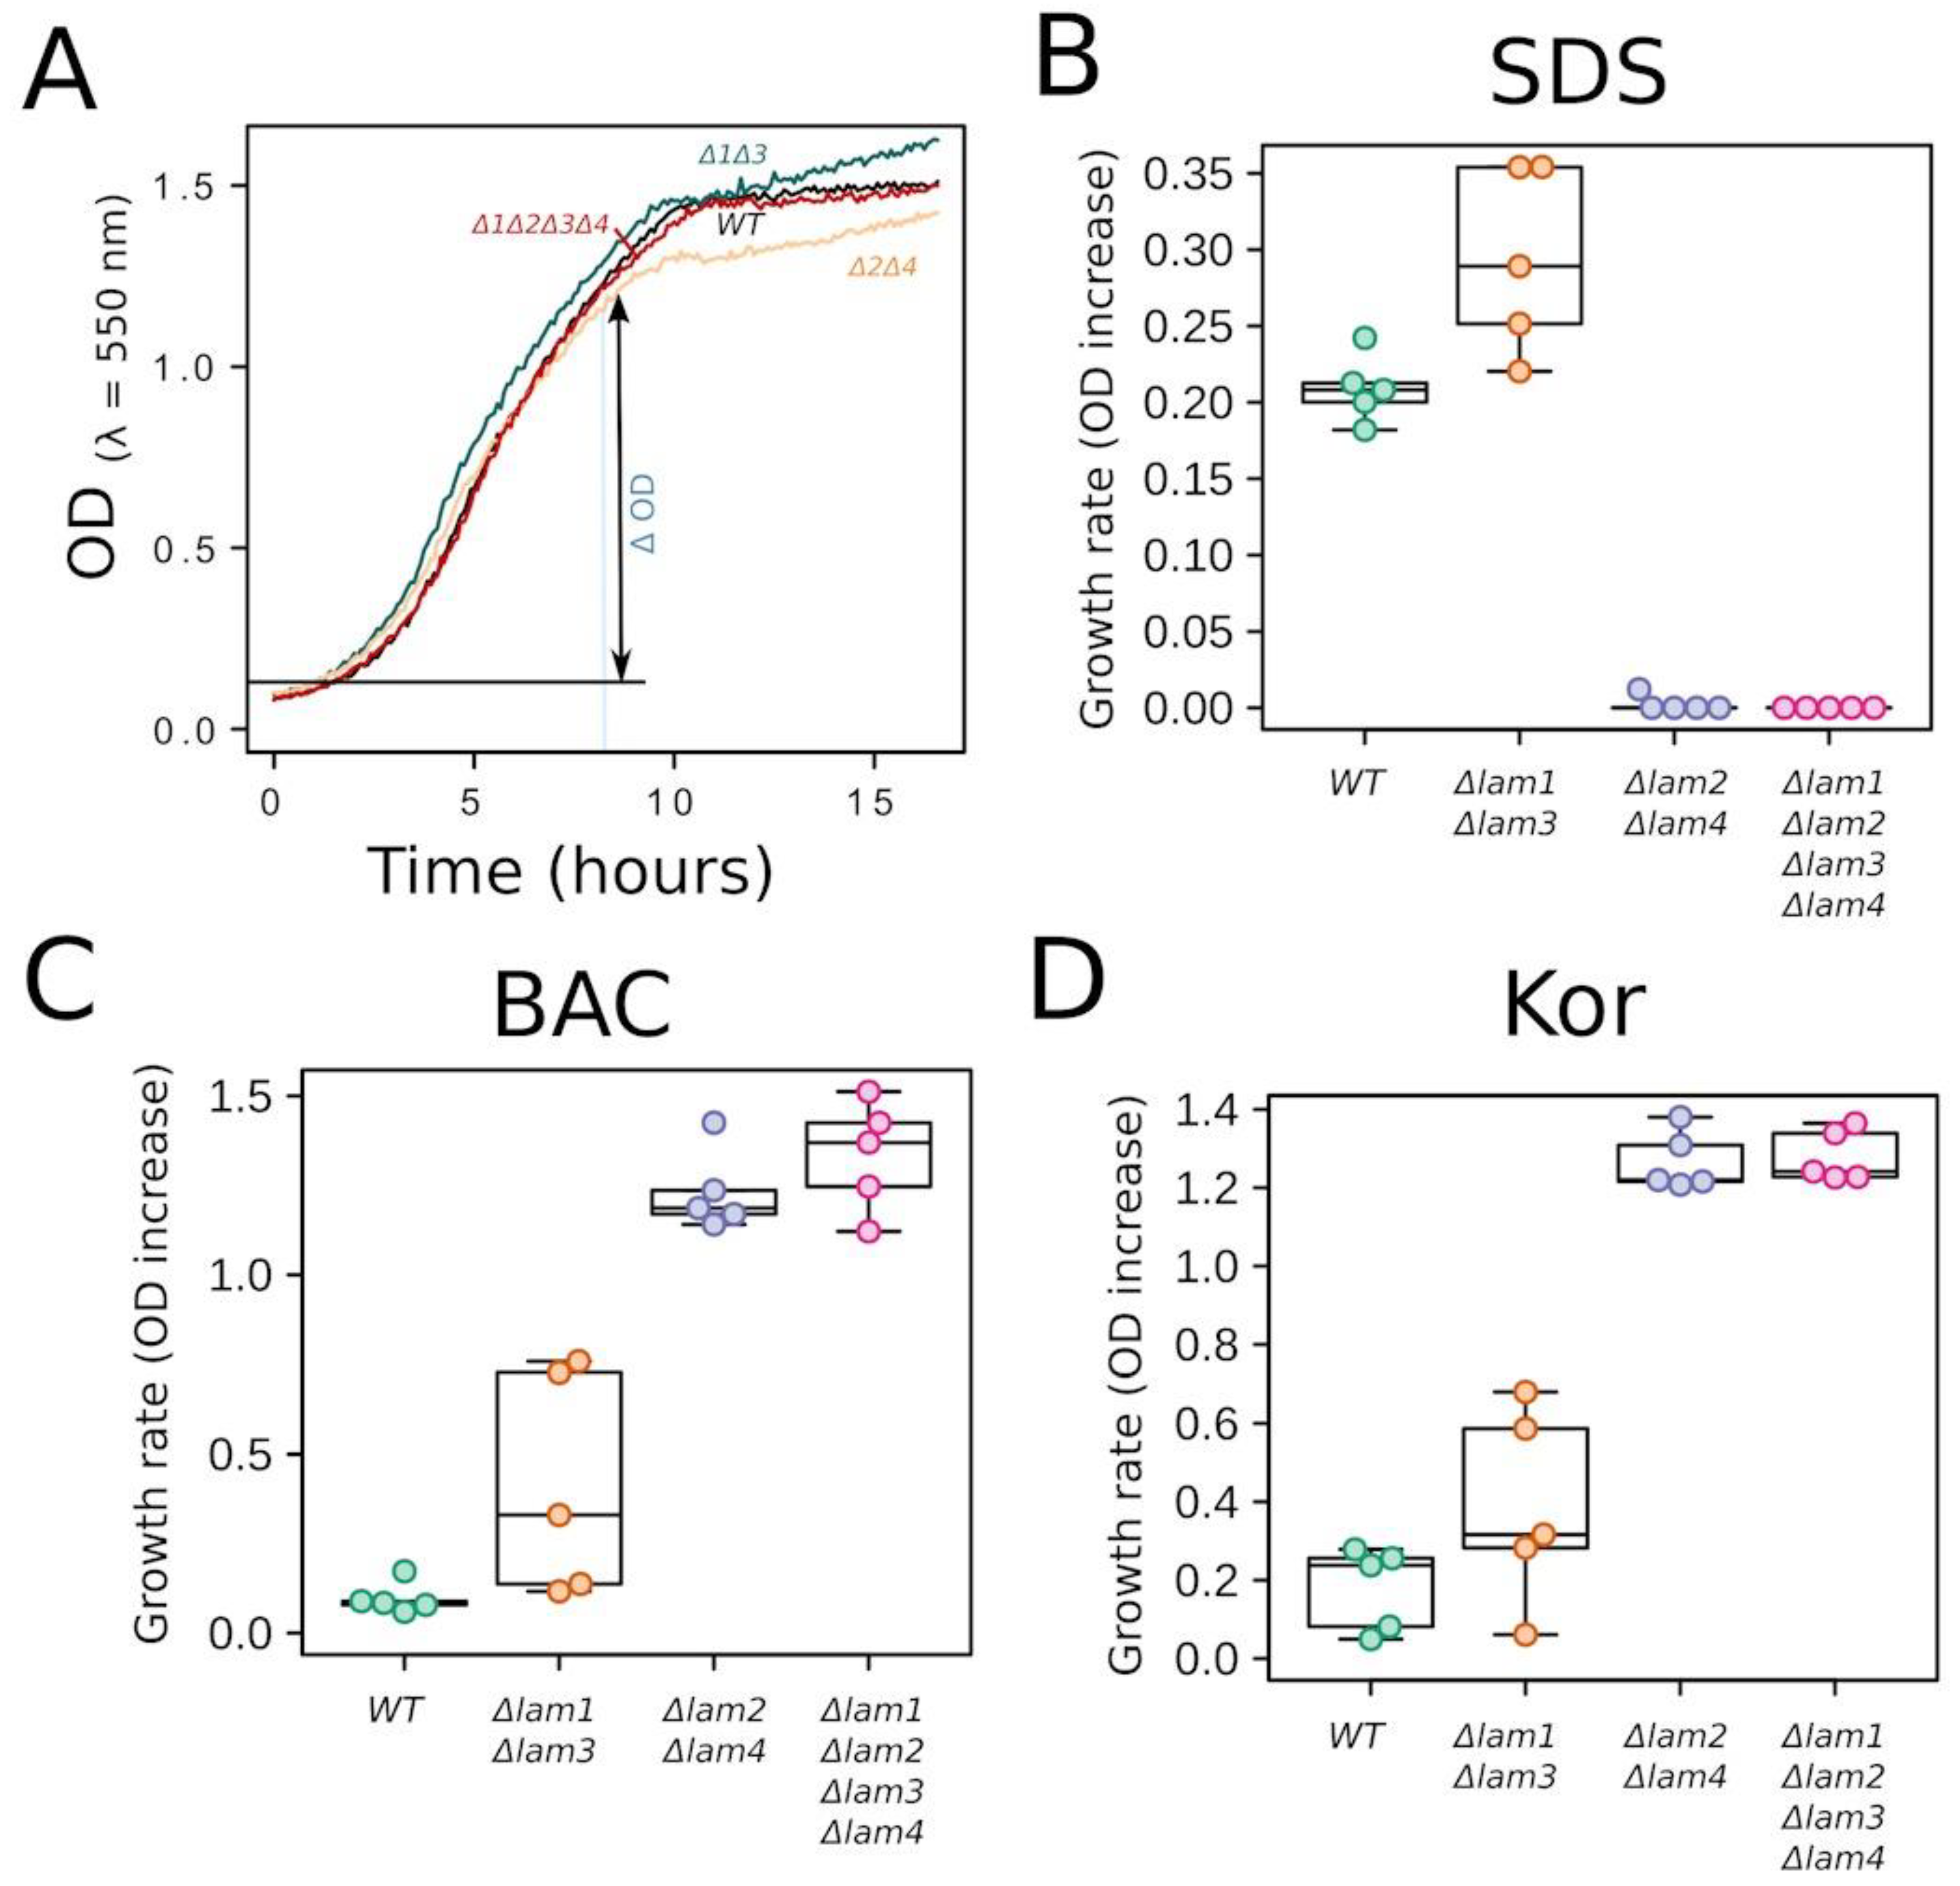
3.3. Experiments on Yeast Cells with Deletion of PM Sterol Transporters
4. Conclusions
Author Contributions
Funding
Acknowledgments
Conflicts of Interest
References
- Ejsing, C.S.; Sampaio, J.L.; Surendranath, V.; Duchoslav, E.; Ekroos, K.; Klemm, R.W.; Simons, K.; Shevchenko, A. Global analysis of the yeast lipidome by quantitative shotgun mass spectrometry. Proc. Natl. Acad. Sci. USA 2009, 106, 2136–2141. [Google Scholar] [CrossRef] [PubMed] [Green Version]
- Mouritsen, O.G.; Zuckermann, M.J. What’s so special about cholesterol? Lipids 2004, 39, 1101–1113. [Google Scholar] [CrossRef] [PubMed]
- Subczynski, W.K.; Pasenkiewicz-Gierula, M.; Widomska, J.; Mainali, L.; Raguz, M. High Cholesterol/Low Cholesterol: Effects in Biological Membranes: A Review. Cell Biochem. Biophys. 2017, 75, 369–385. [Google Scholar] [CrossRef] [PubMed]
- Sokolov, S.S.; Trushina, N.I.; Severin, F.F.; Knorre, D.A. Ergosterol Turnover in Yeast: An Interplay between Biosynthesis and Transport. Biochemistry 2019, 84, 346–357. [Google Scholar] [CrossRef] [PubMed]
- Montañés, F.M.; Pascual-Ahuir, A.; Proft, M. Repression of ergosterol biosynthesis is essential for stress resistance and is mediated by the Hog1 MAP kinase and the Mot3 and Rox1 transcription factors. Mol. Microbiol. 2011, 79, 1008–1023. [Google Scholar] [CrossRef]
- Fan, H.Y.; Heerklotz, H. Digitonin does not flip across cholesterol-poor membranes. J. Colloid Interface Sci. 2017, 504, 283–293. [Google Scholar] [CrossRef]
- Heuck, A.P.; Moe, P.C.; Johnson, B.B. The cholesterol-dependent cytolysin family of gram-positive bacterial toxins. Subcell. Biochem. 2010, 51, 551–577. [Google Scholar]
- Dufourc, E.J. Sterols and membrane dynamics. J. Chem. Biol. 2008, 1, 63–77. [Google Scholar] [CrossRef] [Green Version]
- Edidin, M. Shrinking patches and slippery rafts: Scales of domains in the plasma membrane. Trends Cell Biol. 2001, 11, 492–496. [Google Scholar] [CrossRef]
- Sot, J.; Manni, M.M.; Viguera, A.R.; Castañeda, V.; Cano, A.; Alonso, C.; Gil, D.; Valle, M.; Alonso, A.; Goñi, F.M. High-melting lipid mixtures and the origin of detergent-resistant membranes studied with temperature-solubilization diagrams. Biophys. J. 2014, 107, 2828–2837. [Google Scholar] [CrossRef]
- Mattei, B.; França, A.D.C.; Riske, K.A. Solubilization of binary lipid mixtures by the detergent Triton X-100: The role of cholesterol. Langmuir 2015, 31, 378–386. [Google Scholar] [CrossRef] [PubMed]
- Caritá, A.C.; Mattei, B.; Domingues, C.C.; de Paula, E.; Riske, K.A. Effect of Triton X-100 on Raft-Like Lipid Mixtures: Phase Separation and Selective Solubilization. Langmuir 2017, 33, 7312–7321. [Google Scholar] [CrossRef] [PubMed]
- Tandukar, M.; Oh, S.; Tezel, U.; Konstantinidis, K.T.; Pavlostathis, S.G. Long-term exposure to benzalkonium chloride disinfectants results in change of microbial community structure and increased antimicrobial resistance. Environ. Sci. Technol. 2013, 47, 9730–9738. [Google Scholar] [CrossRef] [PubMed]
- Fait, M.E.; Bakas, L.; Garrote, G.L.; Morcelle, S.R.; Saparrat, M.C.N. Cationic surfactants as antifungal agents. Appl. Microbiol. Biotechnol. 2019, 103, 97–112. [Google Scholar] [CrossRef]
- Weete, J.D.; Abril, M.; Blackwell, M. Phylogenetic distribution of fungal sterols. PLoS ONE 2010, 5, e10899. [Google Scholar] [CrossRef]
- Van Meer, G.; Voelker, D.R.; Feigenson, G.W. Membrane lipids: Where they are and how they behave. Nat. Rev. Mol. Cell Biol. 2008, 9, 112–124. [Google Scholar] [CrossRef]
- Schlame, M. Cardiolipin synthesis for the assembly of bacterial and mitochondrial membranes. J. Lipid Res. 2008, 49, 1607–1620. [Google Scholar] [CrossRef]
- Bramkamp, M.; Lopez, D. Exploring the existence of lipid rafts in bacteria. Microbiol. Mol. Biol. Rev. 2015, 79, 81–100. [Google Scholar] [CrossRef]
- Nesterenko, A.M.; Krasilnikov, P.M.; Ermakov, Y.A. Molecular-dynamic simulation of DPPC bilayer in different phase state: Hydration and electric field distribution in the presence of Be2+ cations. Biochem. (Mosc.) Suppl. Ser. A Membr. Cell Biol. 2011, 5, 370–378. [Google Scholar] [CrossRef]
- Gatta, A.T.; Wong, L.H.; Sere, Y.Y.; Calderón-Noreña, D.M.; Cockcroft, S.; Menon, A.K.; Levine, T.P. A new family of StART domain proteins at membrane contact sites has a role in ER-PM sterol transport. Elife 2015, 4, e07253. [Google Scholar] [CrossRef]
- Roelants, F.M.; Chauhan, N.; Muir, A.; Davis, J.C.; Menon, A.K.; Levine, T.P.; Thorner, J. TOR complex 2-regulated protein kinase Ypk1 controls sterol distribution by inhibiting StARkin domain-containing proteins located at plasma membrane-endoplasmic reticulum contact sites. Mol. Biol. Cell 2018, 29, 2128–2136. [Google Scholar] [CrossRef] [PubMed]
- Wong, L.H.; Levine, T.P. Lipid transfer proteins do their thing anchored at membrane contact sites… but what is their thing? Biochem. Soc. Trans. 2016, 44, 517–527. [Google Scholar] [CrossRef] [PubMed]
- Sandhu, J.; Li, S.; Fairall, L.; Pfisterer, S.G.; Gurnett, J.E.; Xiao, X.; Weston, T.A.; Vashi, D.; Ferrari, A.; Orozco, J.L.; et al. Aster Proteins Facilitate Nonvesicular Plasma Membrane to ER Cholesterol Transport in Mammalian Cells. Cell 2018, 175, 514–529.e20. [Google Scholar] [CrossRef] [PubMed] [Green Version]
- Mueller, P.; Rudin, D.O.; Tien, H.T.; Wescott, W.C. Methods for the formation of single bimolecular lipid membranes in aqueous solution. J. Phys. Chem. 1963, 67, 534–535. [Google Scholar] [CrossRef]
- Sokolov, V.S.; Kuz’min, V.G. Measurement of differences in the surface potentials of bilayer membranes according to the second harmonic of a capacitance current. Biofizika 1980, 25, 170–172. [Google Scholar]
- Sokolov, V.S.; Sokolenko, E.A.; Sokolov, A.V.; Dontsov, A.E.; Chizmadzhev, Y.A.; Ostrovsky, M.A. Interaction of pyridinium bis-retinoid (A2E) with bilayer lipid membranes. J. Photochem. Photobiol. B 2007, 86, 177–185. [Google Scholar] [CrossRef]
- Batishchev, O.V.; Shilova, L.A.; Kachala, M.V.; Tashkin, V.Y.; Sokolov, V.S.; Fedorova, N.V.; Baratova, L.A.; Knyazev, D.G.; Zimmerberg, J.; Chizmadzhev, Y.A. pH-Dependent Formation and Disintegration of the Influenza A Virus Protein Scaffold To Provide Tension for Membrane Fusion. J. Virol. 2016, 90, 575–585. [Google Scholar] [CrossRef] [Green Version]
- Shtykova, E.V.; Petoukhov, M.V.; Dadinova, L.A.; Fedorova, N.V.; Tashkin, V.Y.; Timofeeva, T.A.; Ksenofontov, A.L.; Loshkarev, N.A.; Baratova, L.A.; Jeffries, C.M.; et al. Solution Structure, Self-Assembly, and Membrane Interactions of the Matrix Protein from Newcastle Disease Virus at Neutral and Acidic pH. J. Virol. 2019, 93, e01450-18. [Google Scholar] [CrossRef]
- Gouy, M. Sur la constitution de la charge electrique a la surface d’un electrolyte. J. Phys. 1910, 9, 457–468. [Google Scholar] [CrossRef]
- Chapman, D.L. A contribution to the theory of electrocapillarity. Philos. Mag. 1913, 25, 475–481. [Google Scholar] [CrossRef]
- Sokolov, A.V.; Sokolov, V.S.; Feldman, T.B.; Ostrovsky, M.A. Interaction of all-trans-Retinal with bilayer lipid membranes. Biochem. (Mosc.) Suppl. Ser. A Membr. Cell Biol. 2008, 2, 404–411. [Google Scholar] [CrossRef]
- Huang, J.; MacKerell, A.D., Jr. CHARMM36 all-atom additive protein force field: Validation based on comparison to NMR data. J. Comput. Chem. 2013, 34, 2135–2145. [Google Scholar] [CrossRef] [PubMed] [Green Version]
- Jorgensen, W.L.; Chandrasekhar, J.; Madura, J.D.; Impey, R.W.; Klein, M.L. Comparison of simple potential functions for simulating liquid water. J. Chem. Phys. 1983, 79, 926–935. [Google Scholar] [CrossRef]
- Cheng, A.; Merz, K.M. Application of the Nosé−Hoover Chain Algorithm to the Study of Protein Dynamics. J. Phys. Chem. 1996, 100, 1927–1937. [Google Scholar] [CrossRef]
- Berendsen, H.J.C.; Postma, J.P.M.; van Gunsteren, W.F.; DiNola, A.; Haak, J.R. Molecular dynamics with coupling to an external bath. J. Chem. Phys. 1984, 81, 3684–3690. [Google Scholar] [CrossRef] [Green Version]
- Parrinello, M.; Rahman, A. Polymorphic transitions in single crystals: A new molecular dynamics method. J. Appl. Phys. 1981, 52, 7182–7190. [Google Scholar] [CrossRef]
- Longtine, M.S.; McKenzie, A., 3rd; Demarini, D.J.; Shah, N.G.; Wach, A.; Brachat, A.; Philippsen, P.; Pringle, J.R. Additional modules for versatile and economical PCR-based gene deletion and modification in Saccharomyces cerevisiae. Yeast 1998, 14, 953–961. [Google Scholar] [CrossRef]
- Alli-Balogun, G.O.; Levine, T.P. Regulation of targeting determinants in interorganelle communication. Curr. Opin. Cell Biol. 2019, 57, 106–114. [Google Scholar] [CrossRef] [Green Version]
- Huang, W.; Zhang, Z.; Han, X.; Tang, J.; Wang, J.; Dong, S.; Wang, E. Ion channel behavior of amphotericin B in sterol-free and cholesterol- or ergosterol-containing supported phosphatidylcholine bilayer model membranes investigated by electrochemistry and spectroscopy. Biophys. J. 2002, 83, 3245–3255. [Google Scholar] [CrossRef]
- Tischer, M.; Pradel, G.; Ohlsen, K.; Holzgrabe, U. Quaternary ammonium salts and their antimicrobial potential: Targets or nonspecific interactions? Chem. Med. Chem. 2012, 7, 22–31. [Google Scholar] [CrossRef]
- Gerba, C.P. Quaternary ammonium biocides: Efficacy in application. Appl. Environ. Microbiol. 2015, 81, 464–469. [Google Scholar] [CrossRef] [PubMed]
- Jennings, M.C.; Minbiole, K.P.C.; Wuest, W.M. Quaternary Ammonium Compounds: An Antimicrobial Mainstay and Platform for Innovation to Address Bacterial Resistance. ACS Infect. Dis. 2015, 1, 288–303. [Google Scholar] [CrossRef] [PubMed]


© 2019 by the authors. Licensee MDPI, Basel, Switzerland. This article is an open access article distributed under the terms and conditions of the Creative Commons Attribution (CC BY) license (http://creativecommons.org/licenses/by/4.0/).
Share and Cite
Jiménez-Munguía, I.; Volynsky, P.E.; Batishchev, O.V.; Akimov, S.A.; Korshunova, G.A.; Smirnova, E.A.; Knorre, D.A.; Sokolov, S.S.; Severin, F.F. Effects of Sterols on the Interaction of SDS, Benzalkonium Chloride, and A Novel Compound, Kor105, with Membranes. Biomolecules 2019, 9, 627. https://doi.org/10.3390/biom9100627
Jiménez-Munguía I, Volynsky PE, Batishchev OV, Akimov SA, Korshunova GA, Smirnova EA, Knorre DA, Sokolov SS, Severin FF. Effects of Sterols on the Interaction of SDS, Benzalkonium Chloride, and A Novel Compound, Kor105, with Membranes. Biomolecules. 2019; 9(10):627. https://doi.org/10.3390/biom9100627
Chicago/Turabian StyleJiménez-Munguía, Irene, Pavel E. Volynsky, Oleg V. Batishchev, Sergey A. Akimov, Galina A. Korshunova, Ekaterina A. Smirnova, Dmitry A. Knorre, Sviatoslav S. Sokolov, and Fedor F. Severin. 2019. "Effects of Sterols on the Interaction of SDS, Benzalkonium Chloride, and A Novel Compound, Kor105, with Membranes" Biomolecules 9, no. 10: 627. https://doi.org/10.3390/biom9100627