1. Introduction
The extensive growth of cities in recent decades, combined with the sustained increase in daily mobility, has meant a rise in the use of mechanised means of transport in urban areas, as well as the generation of high levels of traffic congestion and a severe environmental impact. At a time of growing concern for global warming, an increased use of public transport is seen as part of the solution [
1], and an effective way of reducing external costs and the negative effects of motorised travel [
2]. The relationship between transport and environmental, social and economic sustainability has been explored by a number of researchers [
1,
3,
4,
5,
6,
7,
8].
In this context, one of the strategic objectives of many city governments is to promote the substitution of the use of private motorised vehicles with other systems that have a lower impact on the environment, the economy and public health, such as public transport, walking or cycling [
9]. However, organising an alternative user-friendly transport system that is effective in providing services and facilities that can guarantee the shortest possible travel and waiting times [
10] is not a simple process. A public user-friendly transport system requires consideration of crucial aspects such as accessibility to stops/stations, system mobility and connectivity with other transport modes [
11]. The spatial equity of transport systems impacts on economic dynamics, personal opportunities and, ultimately, the quality of life of the population [
12,
13]. In other words, poor planning of territorial coverage can lead to situations of social disadvantage. In this regard, the contribution of GIS in the field of Transport Geography is more than a simple control of generic functionality [
14]. GIS offer key possibilities in transport modelling [
15], facilitating the storage, updating and processing of spatial data and allowing the planning, analysis, control and management of transport networks.
Numerous and widely varying research studies have used GIS tools to analyse and organise transport networks. Blythe et al. [
16] examined the wide range of emerging technologies and techniques capable of integrating different public transport modes and services at urban and inter-city scale in order to improve the attractiveness and competitiveness of public transport networks to the detriment of the use of private vehicles. Arampatzis et al. [
15] presented a GIS-based decision support system (DSS) to analyse and evaluate different transport policies with the purpose of improving environmental and energy efficiency in the supply of transport. Different characteristics of public transport, including spatial coverage, frequency, comfort or fleet adaptation for disabled persons, may require special analysis, given that they provide an understanding of the efficacy and equity of the service provided for the citizens. Along these lines, Murray [
7] identified the inefficiencies of the coverage of access to public transport in the city of Brisbane using GIS-based spatial analysis techniques. Moro and Villaescusa [
17] studied spatial accessibility to primary schools in Bilbao, basing their work on the hypothesis that the criteria used to assign students to schools were not the most appropriate, with some students possibly being forced to commute for longer spatial and temporal distances than necessary. Salado et al. [
18] proposed a set of indicators related to measurements of the equity and efficiency of the urban public transport service of the city of Alcala de Henares (Madrid). Saghapour et al. [
2], in the city of Melbourne (Australia), developed a new measure of accessibility to public transportation that integrated transport service frequencies and population density. The results show that the use of public transport is substantially higher in areas with a higher rate of accessibility. Delmelle and Casas [
19] evaluated the spatial equity of the express bus transport service in the city of Cali (Colombia) by means of exploration patterns of accessibility in relation to the socioeconomic level of the city neighbourhoods. They demonstrated that transport network accessibility was higher for middle-class neighbourhoods than for those of higher and lower socioeconomic classes. Cardozo et al. [
20] analysed the relationship between urban and socioeconomic variables and the demand for public transport in the subway system of Madrid.
Other interesting and particularly innovative applications have been developed by Benenson et al. [
21] and Stenneth et al. [
22]. The first presented an extension of ArcGIS©, Urban.Access, which allows to estimate and compare the accessibility of different modes of transport to the workplace and other places of interest. Meanwhile, the second proposed a methodology for identifying user mode of transport by means of GPS sensors in their mobile devices and knowledge of the transport network (real-time bus location; spatial information of the railway line, and spatial data about bus stops and stations).
However, limited research exists involving the use of GIS tools for studying the impact of floating populations in mobility analyses and transport planning. This is mostly due to the difficulty of quantifying tourist population flows and the areas where they tend to be concentrated. Among recent works that have incorporated this perspective, special mention should be given to the Xue et al. [
23] study in the city of Singapore, where automatic learning techniques were applied using public transport data provided by the Terrestrial Transport Authority of Singapore to identify tourists using public transport. In another study, Rendeiro and Suarez [
24] proposed a methodology to assess the impacts of tourist mobility on the island of Lanzarote, and the implantation of a tourist route that would reduce contamination while at the same time satisfying the mobility needs of the tourists.
The pressure on urban and regional transport systems has become a critical issue in tourist cities [
25,
26]. The concentration of users in periods of greater influx entails a strain on services and an in-depth reconfiguration of urban and regional mobility patterns. For instance, tourist activity along the European Mediterranean coast, given its natural conditions as a “sun and beach” destination, is principally concentrated in the summer period. There are very significant differences between high season and the rest of the year in terms of number of passengers and mobility patterns. Any strains on the system and any negative externalities are heightened by this concentration and polarisation, which become a major challenge for public transport operators. In this regard, the main challenges associated with tourist mobility at tourist destinations can be categorized into three key areas for consideration: (1) the strategic importance of local public transport to guarantee the competitiveness of the tourist destination [
27,
28]; (2) the impact of tourism on local transport and the need to implement measures to guarantee that it does not imply a decrease in the quality of the service provided to the local population [
29]; and (3) the contribution of local public transport to promote more sustainable mobility patterns in tourist destinations which help to mitigate any environmental impact that may be caused by the increased flows [
8,
30,
31,
32].
From this context, the aim of this study is to validate a methodological proposal to assess the effectiveness and spatial coverage of public transport in tourist destinations. Coverage analysis of public transport networks has diverse applications in transport planning [
33]. Generally, spatial coverage analyses the physical accessibility of the supply and the adequacy of the distribution of stops or stations to cover the demand [
34]. The more people that reside and/or are employed in close proximity to a bus stop or station, the greater the likelihood that the service will be used [
35,
36]. In this sense, several studies have been developed to evaluate the spatial coverage of public transport networks and to assess the distance-measure impacts on the calculation of transport service areas [
33,
37,
38]. Other studies, such as the ones developed by Murray, propose models for identifying inefficiencies in public transport access coverage in order to improve the use of public transport provision [
7,
39]. Some theoretical and ex-ante approximations have underlined the importance of considering the impact of tourism on local transport systems [
26,
40,
41]. However, as mentioned previously, there is a notable lack of studies which focus on public transport networks at inframunicipal scale and which specifically analyse the relationships between tourism and the effectiveness of public transport at tourist destinations using spatial coverage approximation. Even more specifically, there is a lack of studies that include the floating (tourist) population in their calculation of public transport coverage. Hence, the main novelty of our study is the incorporation into the analysis of both the resident and floating (tourist) populations. For this, we used data on the registered resident population by means of the geolocation of their postal addresses, as well as data concerning the occupancy of the different official tourist accommodations in the case study area (hotels, camping sites and tourist apartments). Using GIS, an analysis was made of the extent of the public transport network coverage for the two population groups. The municipality of Cambrils (Camp de Tarragona, Spain) on the Costa Daurada (one of the main coastal destinations of the Spanish Mediterranean) was used as a case study.
The literature analysing the effect of seasonal tourism on mobility in European cities has tended to focus on the study of large urban areas. Some case studies have been used to analyse mobility and public transport in cities with a significant tourism pressure [
28,
29,
42,
43,
44,
45]. However, the impact of tourism seasonality on public transport networks in coastal tourist cities remains a field that has been studied little [
26,
27]. Coastal tourist cities have become established during recent decades as the territories with the greatest capacity to attract new residents and economic activity, especially that related to the services sector [
46]. Within these urban areas, tourism activity has become a key variable that determines their evolution and, furthermore, the reconfiguration of metropolitan dynamics [
47]. Previous studies on mobility and regional dynamics in Camp de Tarragona (the region in which Cambrils is found) have shown that the number of passengers in summer on the intercity bus lines increases by 441% (data from 2013 [
48]) compared to winter [
31]. Moreover, the marked seasonality of tourism requires reformulation of the functional hierarchies of the whole region, placing the coastal towns as the epicentre of regional mobility flows as they become not just mass tourist destinations, but also the main regional job and leisure centres [
48].
In this sense, the present study aims to contribute to this field using evidence gathered in the case of Cambrils, a coastal municipality that in summer experiences a growth of 553% (data from 2013 [
48]) in public transport users compared to winter. The study is based on the following initial hypotheses:
- (1)
The public transport network of Cambrils offers a territorial coverage which differs between the various areas of the municipality. This implies unequal conditions of accessibility to public transport services for the residents and tourist population.
- (2)
The seasonality of tourism activities in Cambrils implies a significant increase in demand for public transport services during summer. This situation alters the efficacy and spatial coverage of the public transport network.
Following the Introduction, we present the scope of this case study (the municipality of Cambrils) (
Section 2). Subsequently, in
Section 3, we explain in detail the data used, the treatment given to the data to allow geolocation, and the indicators that have been applied. In
Section 4 we present and discuss the results. Finally, the article ends with the main conclusions derived from these results.
2. Methods
An efficient spatial coverage of public transport is understood to be one that favours the access of citizens to transport services and ensures the connection between journeys at intra and inter-city scale. In order to study the level of achievement of these findings in a tourist destination, an evaluation system has been designed of the spatial coverage of public transport facilities in relation to the amount of potential population that can access them. Specifically, in the designed evaluation system (see
Table 1), indicators have been incorporated to evaluate public transport conditions in terms of the spatial coverage of the network for the resident and tourist population (supply and quality), and to measure the degree of network accessibility (interconnectivity, intermodality). These indicators were previously proposed by Salado et al. [
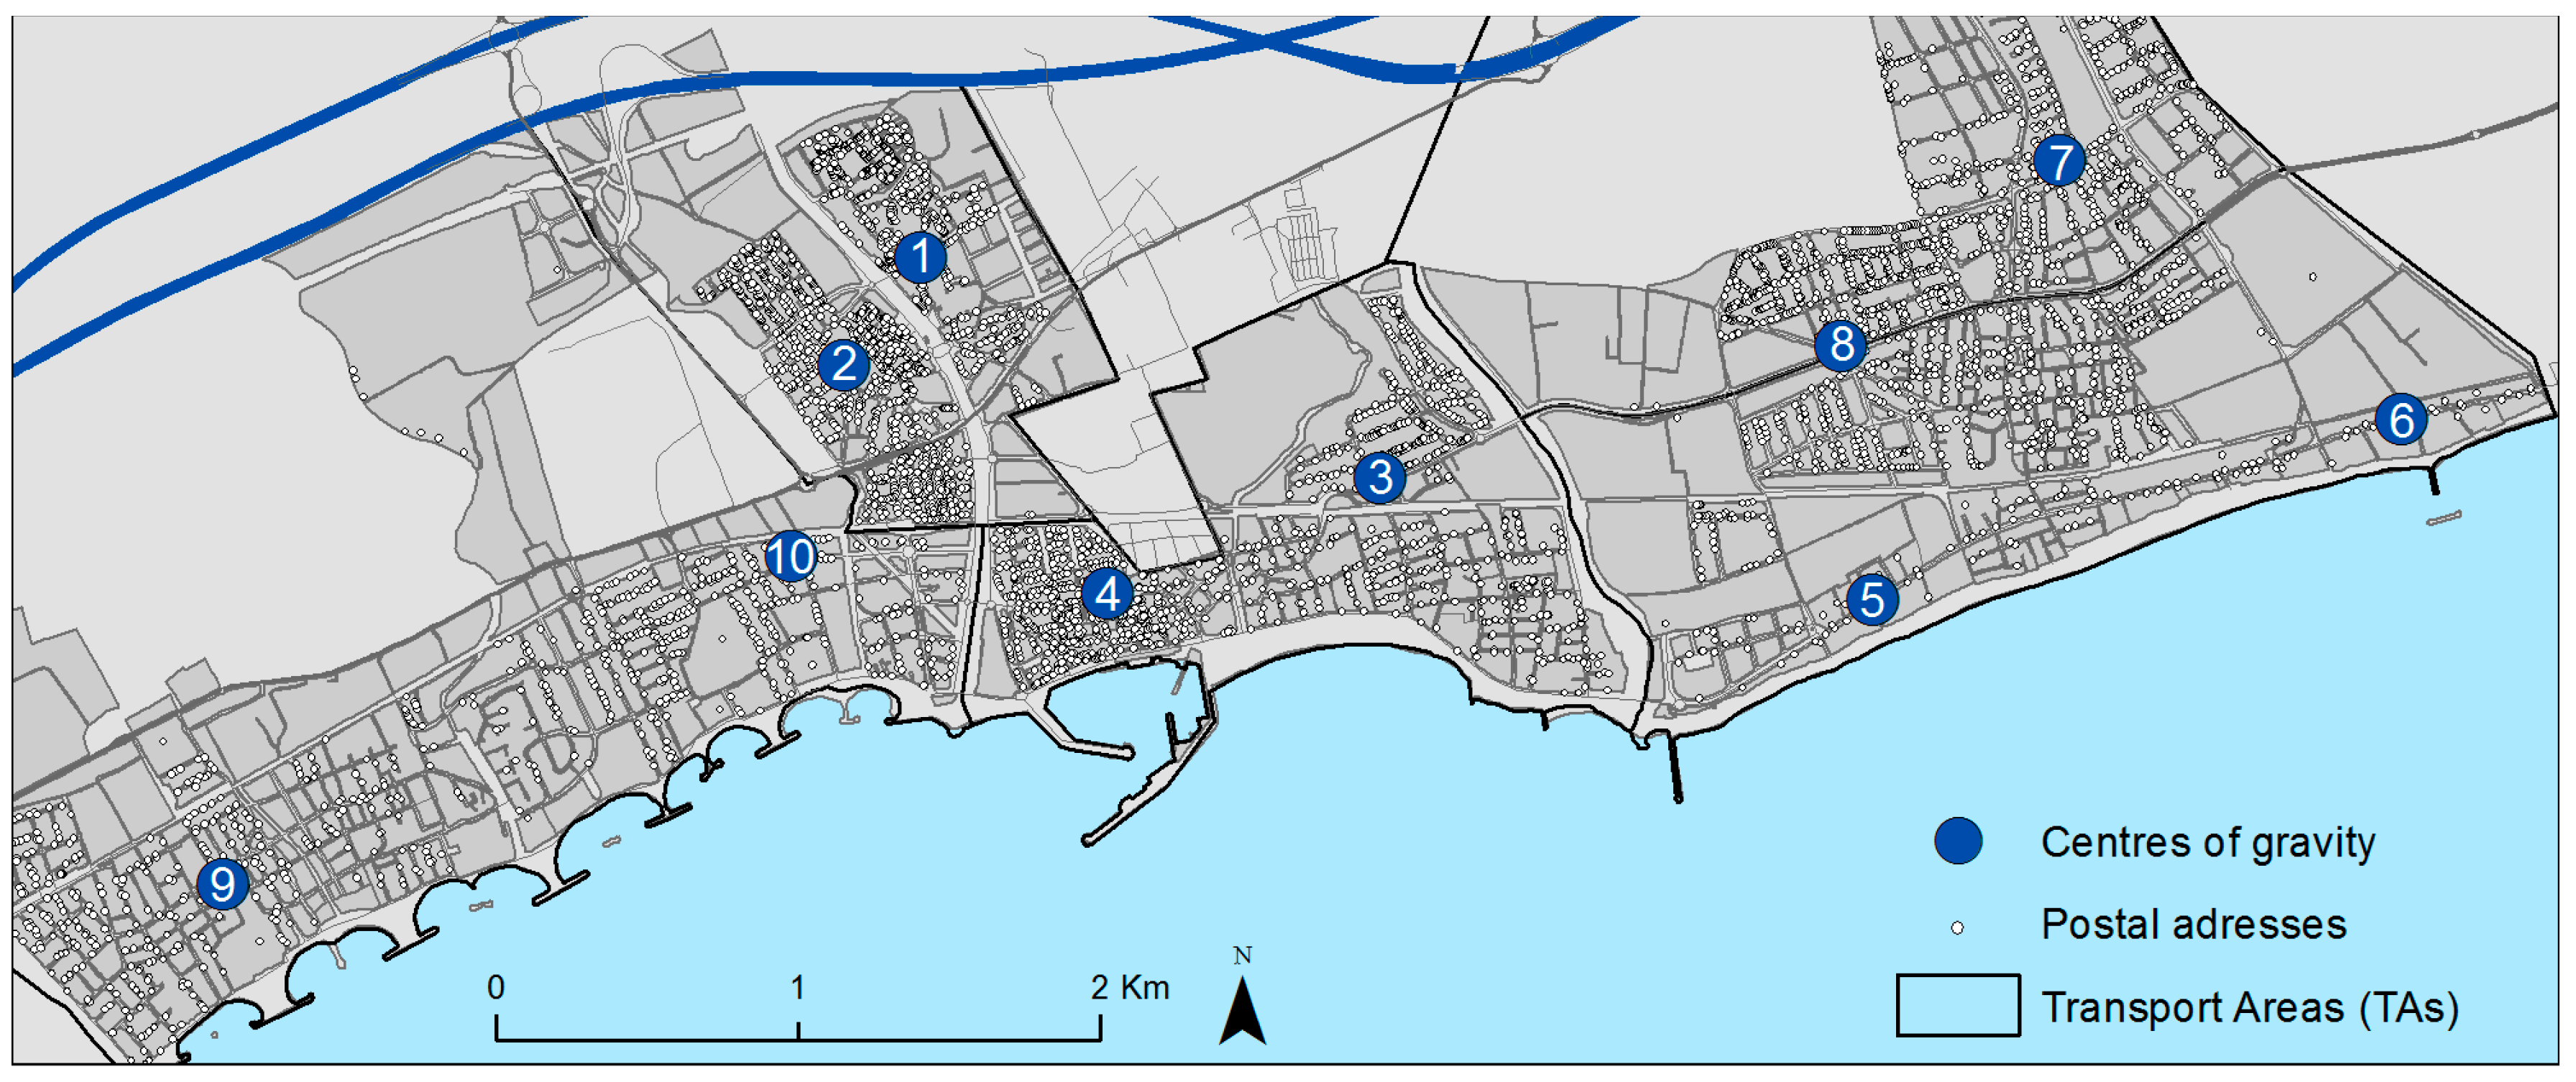
18] and were applied in the evaluation of the Alcala de Henares (Spain) public transport network. In our case, we have updated their proposal by incorporating the seasonal population in the analysis and by including a new indicator of interconnectivity (number 4: Drift Index), which allows measurement of the extra time that the urban buses require to connect the different transport areas (see
Figure 1) compared to the shortest possible route with the use of private transport.
Although seasonal population has been taken into account before in other studies to estimate its impact on the demographic and economic structure of rural areas [
49], and also to examine the impact of second-home developments on the socio-demographic structure of the population of coastal tourist destinations [
50], a lack of studies has been detected on public transport networks at inframunicipal scale that specifically analyse the relationships between tourism and the effectiveness of public transport at tourist destinations using spatial coverage approximation. The present study contributes to this field.
With the objective of allowing a comparative analysis between the different areas of the city, we defined five functional and spatial units (see
Figure 1) consisting of Transport Areas (TAs). We have used four main criteria for their definition. First, they correspond to five areas clearly differentiable in terms of urban morphology and functionality. Second, the characteristics of the housing and the built environment are especially differentiated between the established zones. Each has been developed in a different historical context (the more peripheral the neighbourhood, the more recent its development). Third, the distribution of the regulated tourist accommodation in the city is diverse. It is concentrated mainly along the waterfront, which suggests it should be split from the rest of the city in each area. Finally, the five TAs correspond to the delimitation of districts defined by the City Council, which also determines that the public transport network is articulated through a radial system based on its five neighbourhoods conception (see study area,
Section 3, for more detail).
All the proposed indicators, except number 4, were applied twice, firstly only taking into account the resident population and secondly also including the seasonal population.
Below is a summary of the characteristics, the calculation method and the meaning of the interpretation of the numerical values for each of the indicators.
| Type of indicator | Supply/quality |
| Indicator 1 | Stops/1000 inhabitants |
| Description |
| Discriminates between different supply levels. If the differences between transport areas are slight, this would indicate that Cambrils enjoyed relative spatial coverage in terms of access to the public transport service.
|
| Data gathering procedure |
Each bus stop is assigned the TA where it is located. From the resulting information, we extracted the total number of stops for each TA, and these data were associated in the zonas_transporte.shp layer. Similarly, each TA is assigned its potential demand. Finally, the indicator is calculated.
|
| Observations |
| The results provided by this indicator do not take into account the typology of the stop, urban or intercity, nor do they contemplate the frequency of the bus passing through each stop. |
| Type of indicator | Supply/quality |
| Indicator 2 | TA population percentage with bus stop/s at less than 200 m |
| Description |
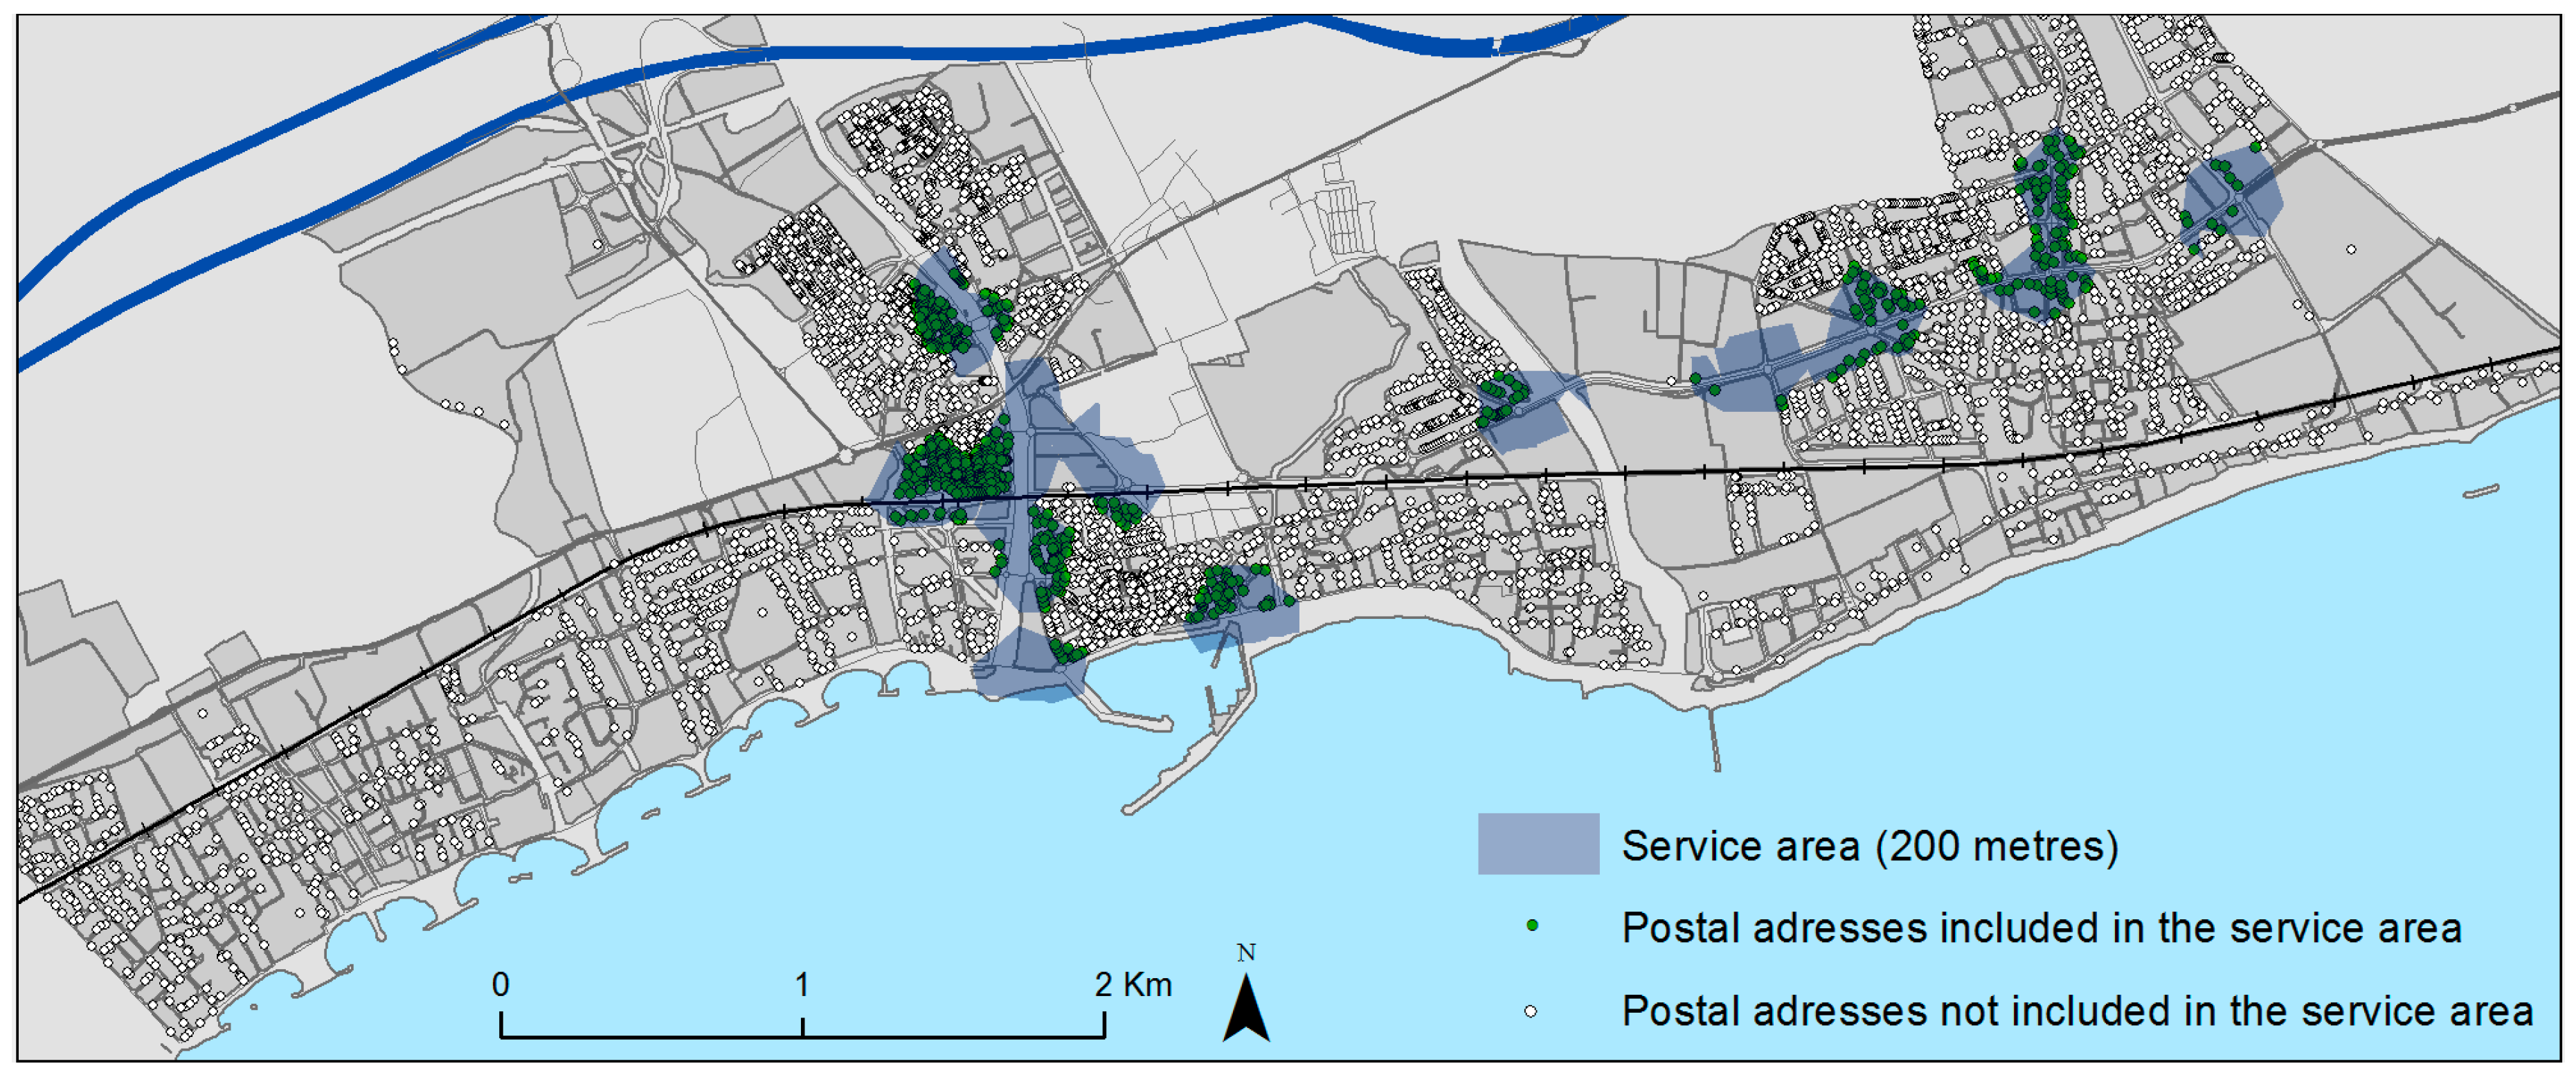
| To the time consumed during a bus journey, a user adds the time needed to arrive on foot to the nearest bus stop. For this reason, this indicator of spatial coverage includes the percentage of the population within each TA located at less than 200 m (about 2 min on foot) from any bus stop.
|
| Data gathering procedure |
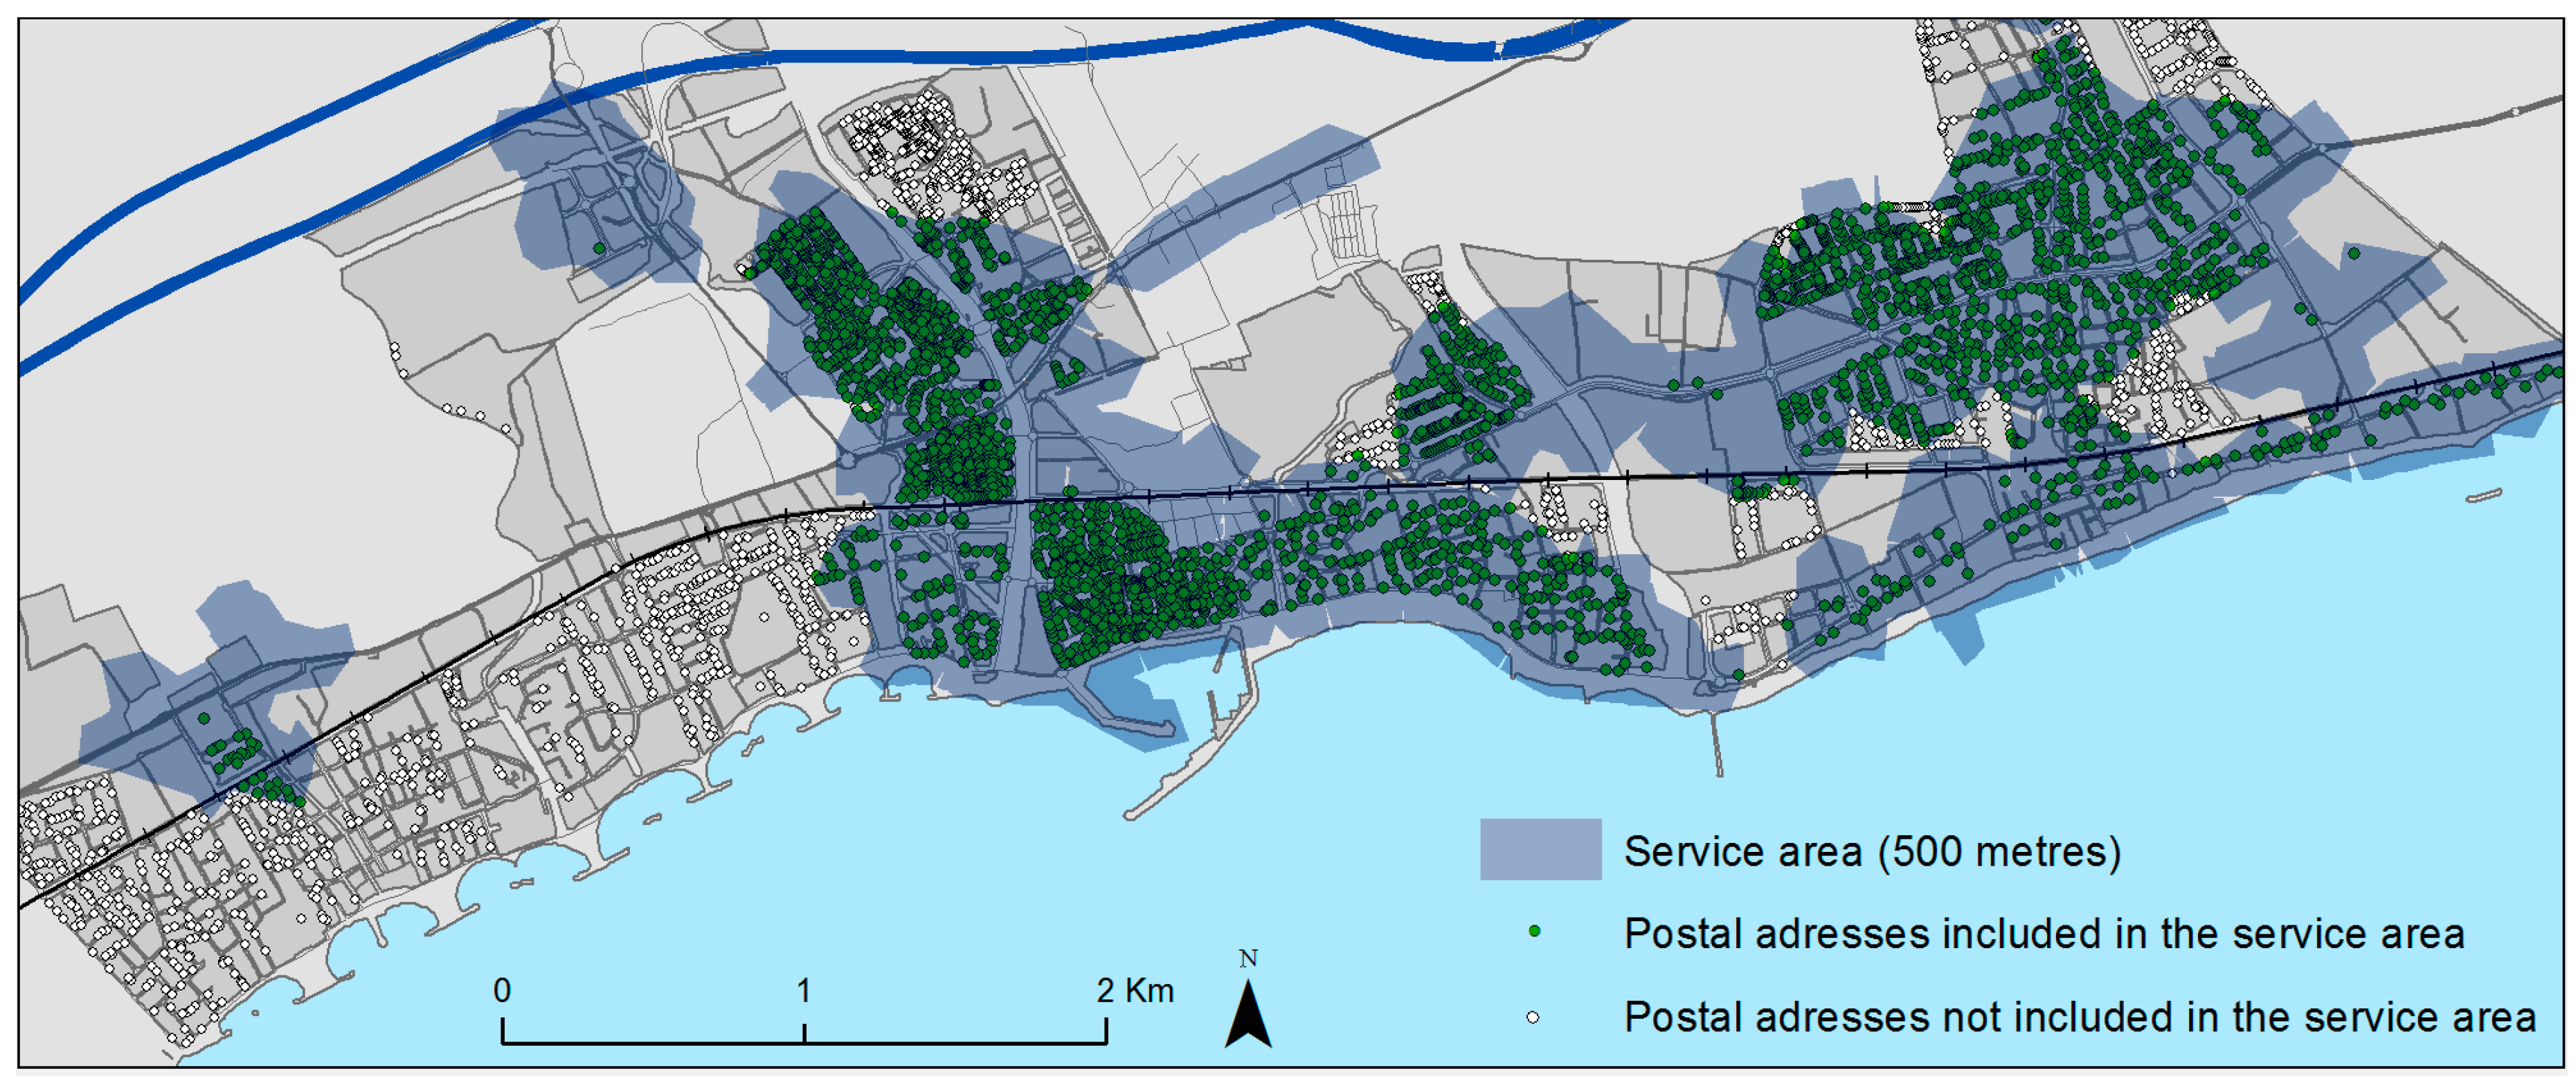
For each bus stop, we calculated a walkable distance of 200 m (service area) through the road network using the “Network Analyst” of theArcGIS 10.3© software. We decided to calculate a service area through the road network in order to avoid overestimation errors (Gutiérrez and García-Palomares 2008). Subsequently, we quantified the population (residents + tourists) at the postal addresses within these 200 m areas. We then added the information to the table of attributes of the transport zones. After adding this information to the TA layer, we calculated the percentage of the population within each TA located at less than 200 m (about 2 minutes on foot) from any bus stop.
|
| Observations |
| Similar to the previous indicator, this also did not establish differences between typologies of services, nor did it consider the bus frequency. In addition, it assumed that the nearest stop belonged to the bus line that the user needed. |
| Type of indicator | Interconnectivity |
| Indicator 3 | TA population percentage with multimodal stops at less than 200 m |
| Description |
| In a similar manner to the previous indicator, this indicator shows the proportion of the inhabitants of each TA with easy access to bus stops used by two or more bus lines. |
| Data gathering procedure |
For each multimodal bus stop, we calculated a walkable distance of 200 m (service area) through the road network of Cambrils using the “Network Analyst” of the ArcGIS 10.3© program. The analysis only takes into account multimodal stops. We quantified the existing population at the addresses included in these 200 m areas. We then added the information to the table of attributes of the transport zones. After adding this information to the TA layer, we calculated the percentage that it represented over the total population.
|
| Observations |
| This indicator complemented the two previous indicators. This study decided not to consider the multimodal stops in function of the frequencies and destinations of the different urban and intercity services. This would be an interesting option for studies with a special focus on intermodal practices. |
| Type of indicator | Interconnectivity |
| Indicator 4 | Connectivity between TA: Drift Index |
| Description |
| This indicator measures the extra time that urban buses require to connect the different TAs in comparison to the shortest possible journey if using a private vehicle. For its calculation we used, for both the public transport network as well as the road network, the minimum possible time between the centres of gravity of the TAs. The formula applied is called the modified Drift Index:
where Txy is the actual travel time by public transport + the average walking time from the postal addresses to their assigned bus stop; and TVxy is the minimum journey time by means of the road network using a private vehicle + the parking time |
| Data gathering procedure |
Calculation of two centres of gravity for each TA by means of the distribution of addresses weighted by the number of resident and tourist inhabitants and using the “Location-Allocation” tool of the Network Analyst (Figure 9 shows the centres of gravity of each TA.). Each centre corresponds to a bus stop and every postal address has a stop assigned depending on the TA to which it belongs and its location inside this TA. Calculation of the average time walking from each postal address to its assigned stop, only taking into account those located at less than 500 m. Creation of the time matrix using the “Shortest Path Network” procedure (which allows calculation of the time between all origins/destinations). To calculate the shortest route by private vehicle we considered the entire Cambrils road network, and to calculate the shortest route by bus we considered the public transport network bus itineraries. Travelling time should take into account the number of stops that have to be made along the route, the waiting time at each stop, and the number of metres that a user must walk from the centre of gravity to the nearest bus stop. Calculation of the Drift Index.
|
| Observations |
| When people travel by bus they tend to include in the total journey time the time spent on foot to reach the bus stop and the destination. For this reason, we decided to add to the time travelled by bus, the average walking time covered by the user from the centre of gravity to the bus stop and vice versa. |
| Type of indicator | Intermodality |
| Indicator 5 | TA population percentage at less than 500 m from an intercity bus stop |
| Description |
| Application of this indicator allows determination of how easy it is for the resident population of the different areas of the city to access intercity transport. We considered a walkable distance of 500 m from each stop (approximately 8 minutes on foot). The longer distances and times employed for this indicator compared to those used for urban buses (200 m and 2 min) reflect the longer journey times and distances associated with intercity mobility. |
| Data gathering procedure |
For each multimodal bus stop, we calculated a 500 m service area using the “Network Analyst” of the ArcGIS 10.3© program. Subsequently, we quantified the existing population (residents + tourists) at the addresses included in these 500 m areas. We then added this information to the table of attributes of the TAs. After adding this information to the TA layer, we calculated the percentage that it represented with respect to the total population of each TA.
|
3. Study Area
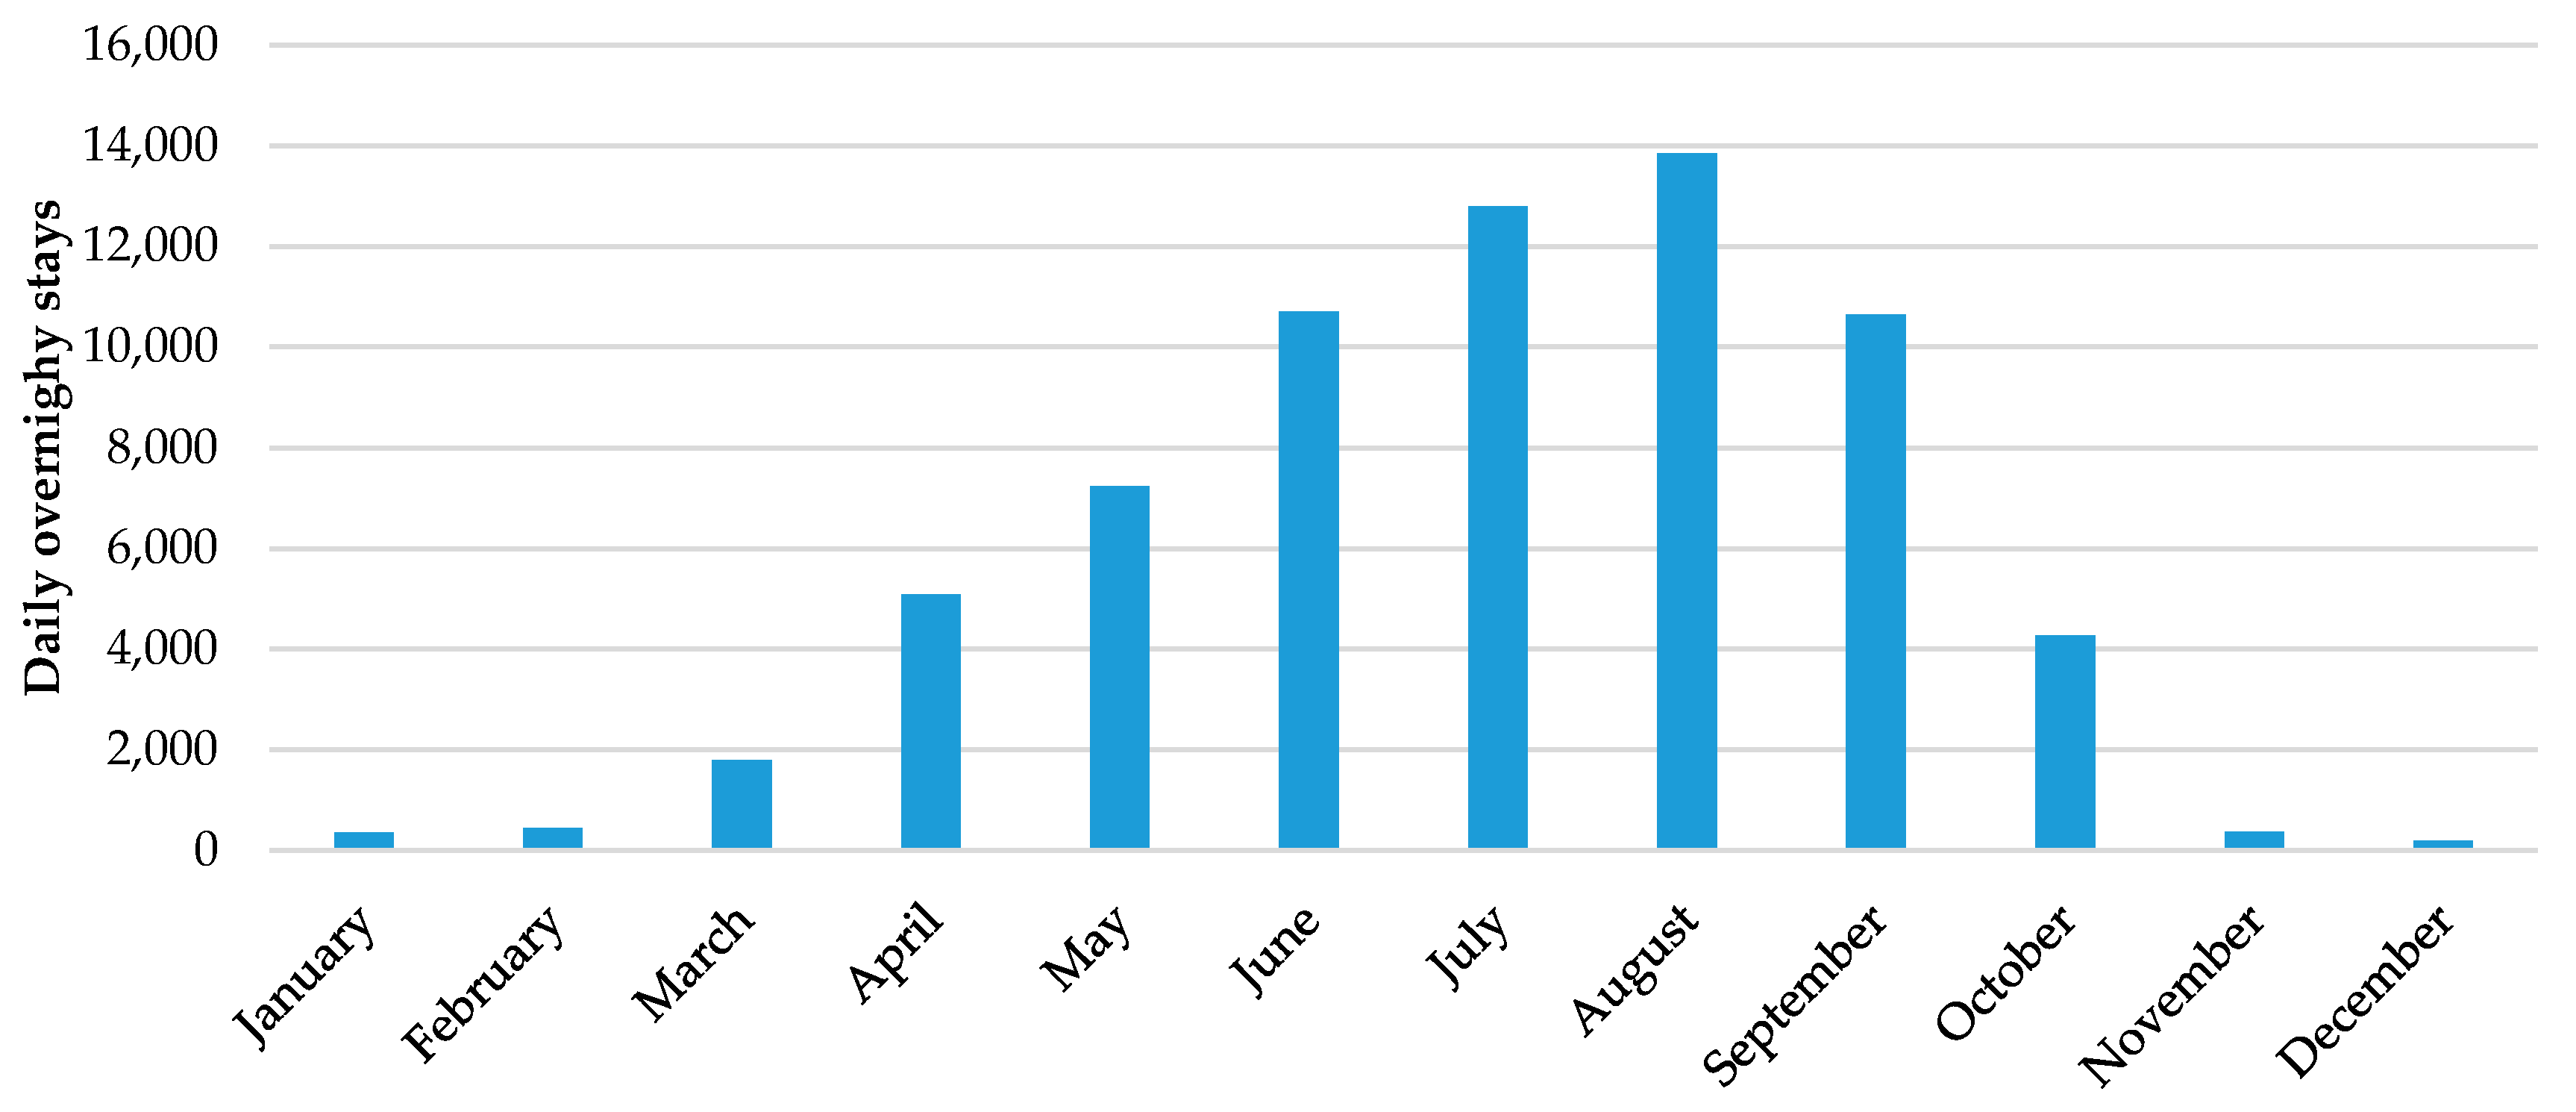
In just over 30 years, the population of Cambrils has increased threefold to a total of 33,660 registered inhabitants in 2014. Along with this increase in the resident population, Cambrils has attracted an ever growing number of tourists, becoming a major centre for tourism on the Costa Daurada in Catalonia (Spain). The seasonal character of tourism in the area is a structural feature of the economy of the Mediterranean coast and a defining characteristic of the municipality. The increase in tourist activity during the high season (June to September) generates an important influx of tourists that significantly increases the population load that the municipality has to handle.
Cambrils forms part of an urban region known as the central area of Camp de Tarragona, comprised of 23 municipalities totalling approximately 375,000 inhabitants and which includes two cities with more than 100,000 inhabitants (Tarragona and Reus). The Tarragona-Reus axis forms a central space for the development of economic activity and the concentration of infrastructures (airport, port, main highways and railways). Nevertheless, during the last three decades, the urban centres of the coast have experienced a rapid growth [
51], which has led to a redefinition of the historical polarities of this complex urban region, consolidating the Cambrils/Salou/Vila-seca urban continuum as the third most important area in the region (
Figure 2b). The coastal centres form part of the so-called Costa Daurada, one of the leading tourist destinations along the Spanish Mediterranean coast. In this context, the towns of Cambrils, Salou and Vila-seca have a high concentration of tourists and make up the area known as the Central Costa Daurada. According to data published by the Costa Daurada Tourist Studies Foundation, these coastal centres welcomed more than 4.6 million tourists in 2014.
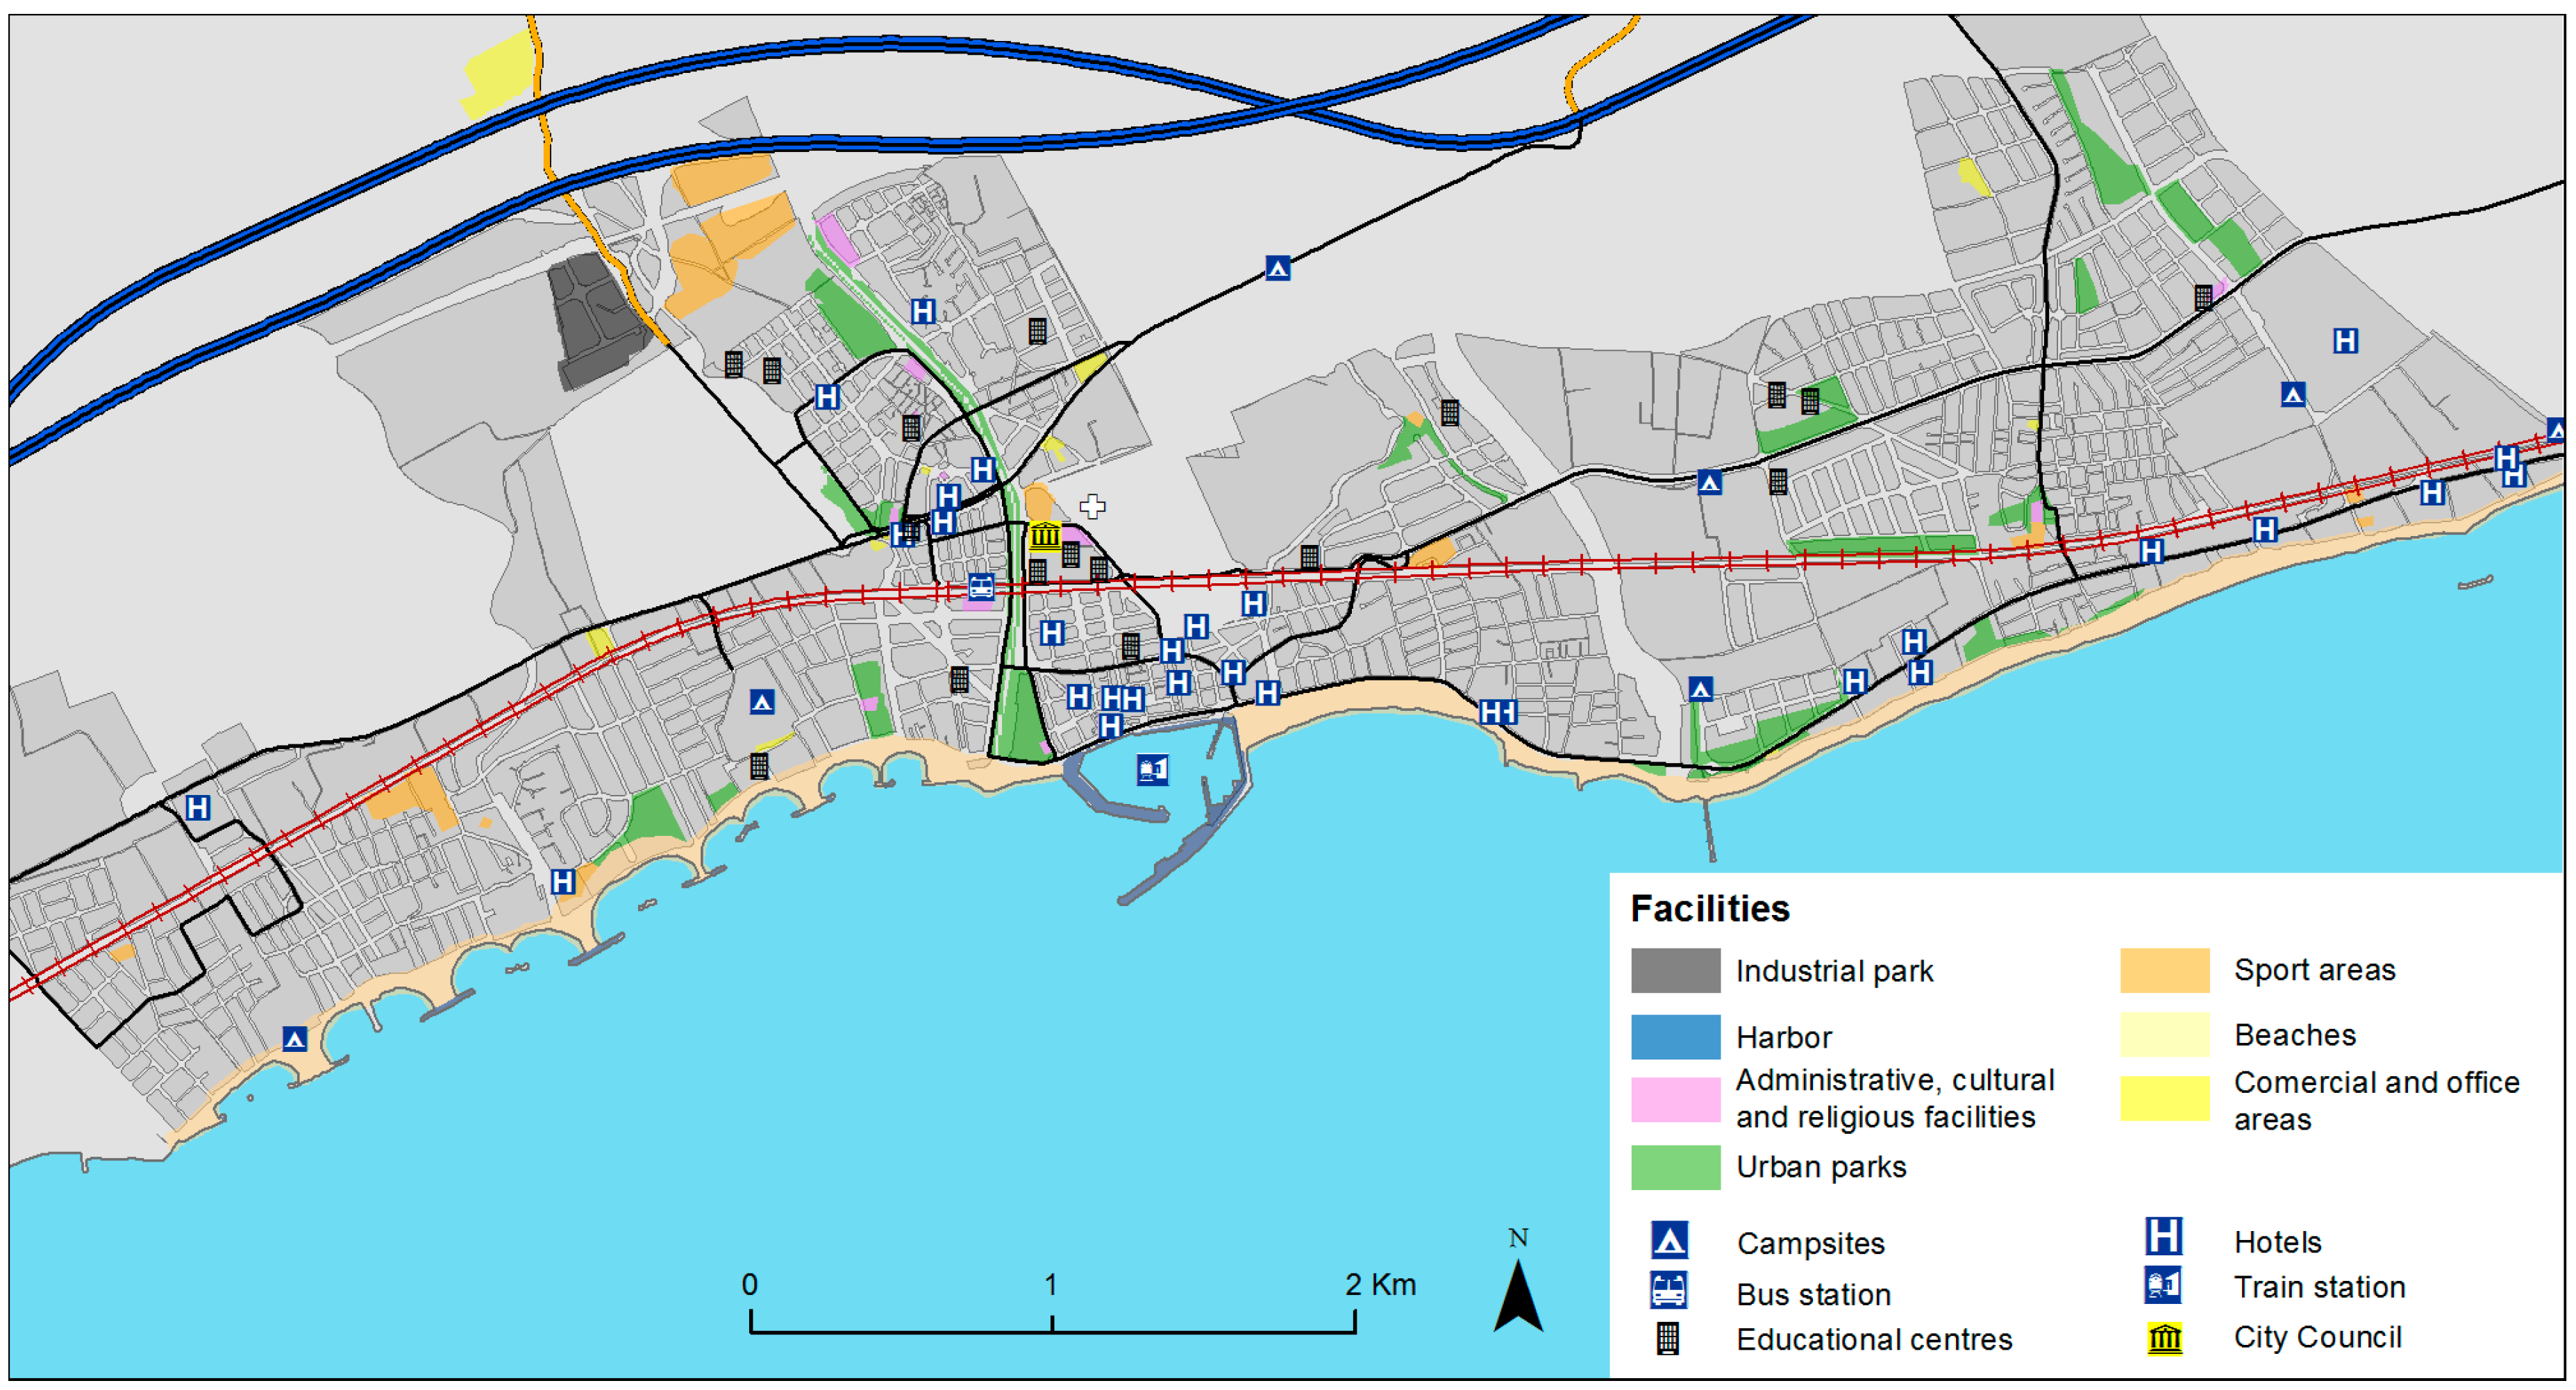
The city of Cambrils extends along the coast. It is characterised by a more compact urban fabric in the centre, where multi-family housing units predominate and therefore higher population densities, and by a more sprawled urban fabric at the peripheries, where single-family residences are located in neighbourhoods to the east and west (see
Figure 2c). These urban peripheries correspond to suburbs developed during the last three decades. As can be seen in
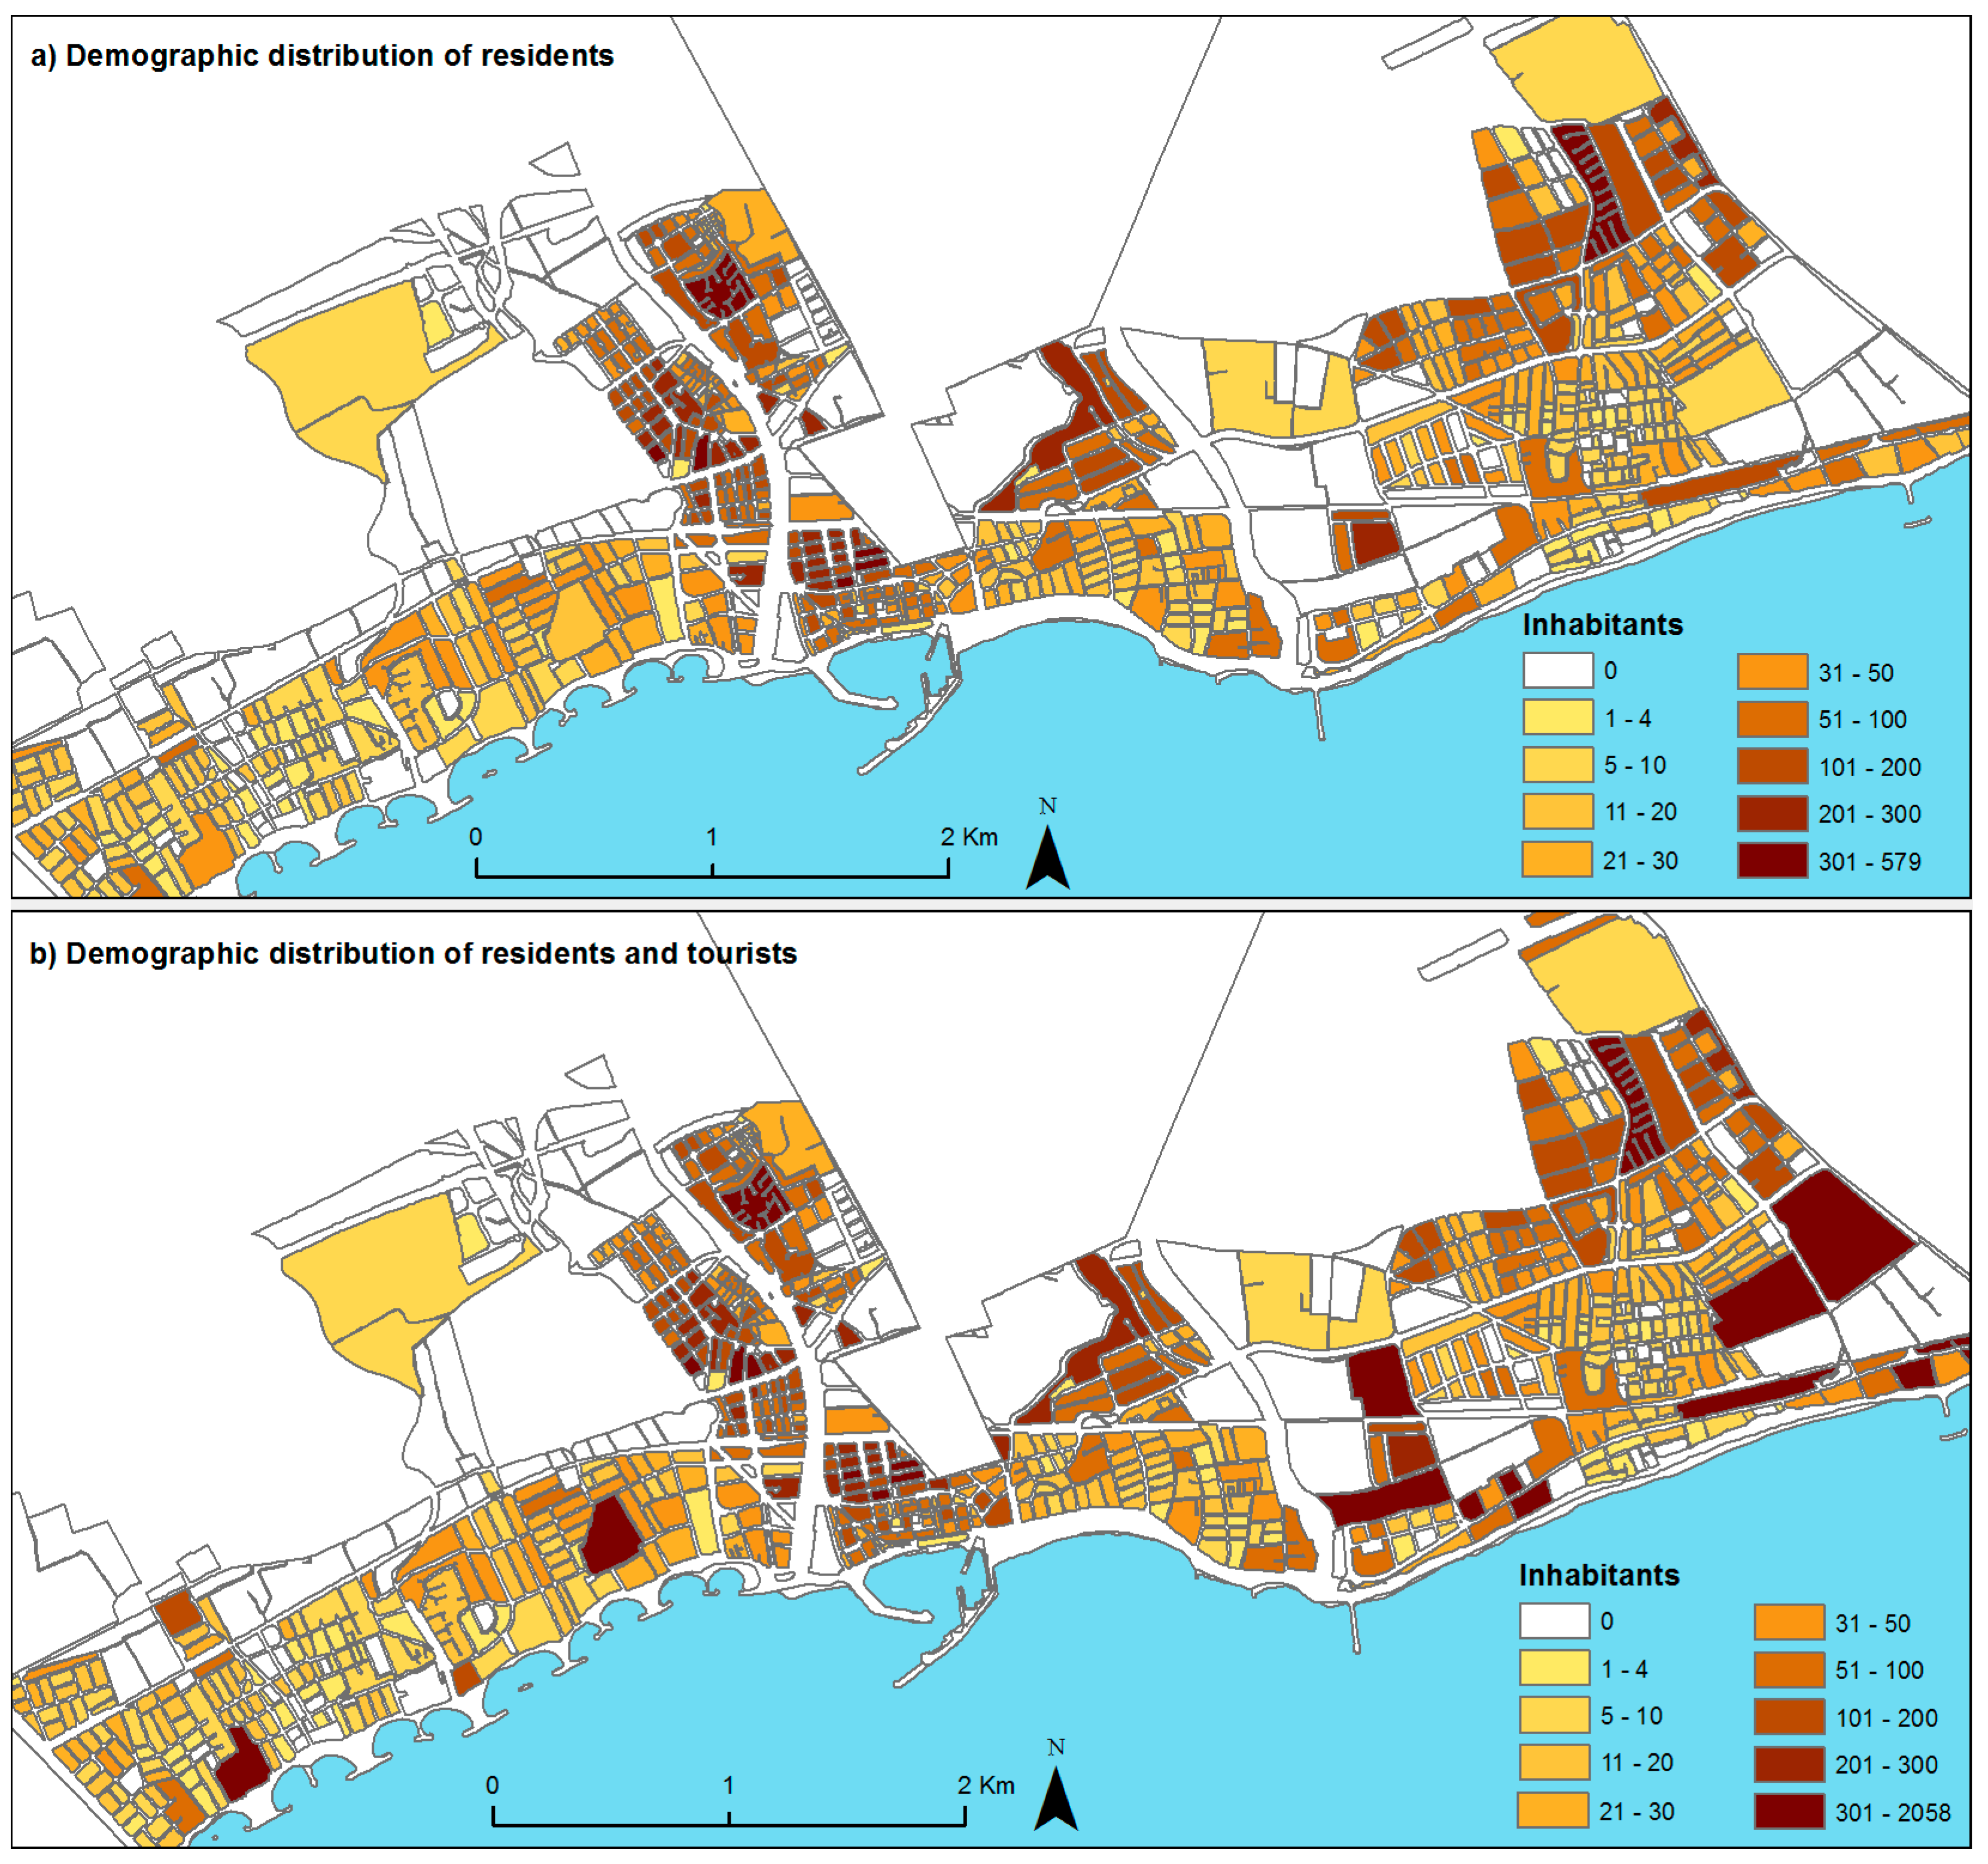
Figure 3, the eastern coastal area (Vilafortuny beach) is characterised by the presence of a large number of hotels and tourist apartment buildings for holiday use, while “Vilafortuny residential” and the “western neighbourhoods” are areas of lesser population density and with a clear predominance of single-family housing. The main difference between these two areas is the greater predominance of primary residences in “Vilafortuny residential”, whereas in the west, holiday residences predominate. As we shall see, clearly diverging population distribution patterns between the different Cambrils neighbourhoods can be derived from these characteristics.
In the centre, where the urban fabric is more compact, there is a higher accumulation of facilities for the residential population, including schools, administrative, cultural and religious centres, as well as health care facilities and shopping areas.


