1. Introduction
In the era of big data, with the development of mobile Internet technology and the popularity of intelligent mobile terminals, people are increasingly accustomed to obtaining or sharing information through mobile intelligent terminal applications whenever and wherever possible. Among the numerous mobile applications for information acquisition and sharing, Location-Based Service (LBS) has become mainstream. In the process of using such applications, massive amounts of social media data containing geographic location information (i.e., geo-tagged social media big data) have been generated; moreover, the volume of such data is exploding. The emergence of this new type of massive social media data has brought new opportunities and challenges to many research fields, attracting researchers’ interests and attentions.
For example, on the Chinese mainland, through the Sina micro-blog, the user can attach his or her location to the published text or picture. Similarly, many applications providing local life information services (such as Dianping.com, Baidu NearYou, Jiepang.com, etc.) allow people to “check-in” in restaurants, hotels, attractions and other businesses and to comment on the business’s products or services. Some photo-sharing applications (e.g., Flickr and Instagram) permit users to add not only the textual description, but also their current location to the picture they take, hence called geo-tagged photos. A number of travel experience-recording and sharing-applications (such as Baidu tourism, Bread Trip and so forth) enable users to record their travel trajectory, take pictures and write travel notes anytime on their trip. These aforementioned social media data (such as geo-tagged photos, check-in data) contain not only description information, such as title, tag and so forth, but also time information—the time of photographing or checking—and the spatial location information—the latitude and longitude of the place where the user took the photo or checked in.
A typical application domain of geo-tagged data mining is the discovery of popular tourist attractions. As the tourist attractions are often frequently photographed and then uploaded onto the social media platform, related research on finding popular tourist attractions and recommending appropriate attractions that match users’ interest has quickly become a hotspot [
1,
2,
3,
4,
5]. The geo-tagged photo collections or check-in records, provided by tourists, are viewed as temporal sequences of locations and from which both the popular tourist attractions and the visitors’ travel footprints can be extracted. Hence, through observing the behaviors of tourists from the social media geo-tagged big data, popular tourist attractions and many travelling laws could be effectively found, thus providing evidence and support for applications such as tourism planning, tourism resource development and intelligent travel recommendations.
In recent years, researchers have proposed various approaches to discover popular attractions from geo-tagged data, and the spatial clustering algorithm is a common means among them [
6,
7]. There are several reasons for using spatial clustering to discover tourist attractions. First of all, we often find it difficult to get the exact boundary data of the tourist attractions, especially many tourist attractions without walls have no exact boundaries, such as the People’s Heroes Monument and the Eiffel Tower. Thus, through spatial clustering of the original user locations, generating the ‘natural’ boundaries of the tourist attractions is a better choice from the perspective of human activities. Second, the clustering-generated tourist attractions, which are naturally rich in human activity information (including users, time, space and visiting frequency), enable performing popularity analysis of tourist attractions and extracting the travelers’ spatio-temporal patterns or travel laws. The potential extracted knowledge could provide decision support to the tourism management department and play an important role in both tourism planning and tourism resource development. In addition, from the individual view, the travel preferences of the tourist are able to be extracted from the clustering-generated attractions, and thus, intelligent travel recommendation services could be developed for the tourist to promote the realization of ‘smart tourism’.
2. Related Work
A classical spatial clustering method applied in tourist attraction discovering is the mean-shift algorithm. For example, Crandal and Kurashima used the mean-shift algorithm to cluster the geographic coordinates and extracted the popular tourist attractions [
7,
8]. Yin et al. used the mean-shift algorithm to cluster the geo-tagged photos and to predict locations [
9]. The advantage of the mean-shift algorithm is that there is no need to specify the number of classes in advance, but only the bandwidth of the search neighborhood is specified, so that the mean-shift clustering algorithm can find several clustering centers without much prior knowledge [
7,
10]. In addition, Kennedy et al. used the k-means algorithm to classify the geometric labels (i.e., latitude and longitude) of the pictures and then obtained the information of the scenic spots [
11]. Another more popular spatial clustering method is the DBSCAN (Density-Based Spatial Clustering of Applications with Noise) algorithm, which has the advantage of requiring less field knowledge and enables finding irregularly-shaped clusters [
12]; Kisilevich et al. introduced an adaptive density-based clustering method named P-DBSCAN [
13], which is designed on the basis of the DBSCAN algorithm. Moreover, Yang used a spectral clustering method in attraction mining [
14,
15]; the advantage of this method is that the number of clusters can automatically be adjusted. Zheng and Yuan studied how to mine points of interest and popular attractions using GPS trajectory data and proposed a hierarchical algorithm [
16,
17,
18]. The algorithm first deals with the GPS trajectory data and extracts the user’s stay points. Then, the hierarchical clustering of the stay points is performed, and thus, a graph structure is created. In the hierarchy, the higher the clustering level is, the more stay points are contained in the clusters. Lastly, places and areas can be sorted at different levels so as to get points of interest, attractions and popular areas.
There was also some work to reveal how to add semantic information to the tourist attractions on the basis of spatial clustering. For example, Cao et al. studied how to find the tourist attractions from the photos with geographical location information and extracted representative photos and corresponding text labels, allowing users to use pictures or text to search tourist attractions [
19]. Gao extracted the user knowledge from the existing travel recommendation website (Yahoo Travel) and then enhanced the text semantics of the photos [
20]. Using the knowledge that has been excavated from existing travel sites, it is possible to measure whether the text label of the photo is related to the travel and to spread the existing labels of the scenic spot to the photograph, thus increasing the semantics of attractions.
Spatial clustering is the core issue in finding popular attractions from geo-tagged data. In the clustering algorithms described above, DBSCAN is widely used in spatial clustering as an excellent density-based clustering algorithm. Zhou used the DBSCAN algorithm in his work of predicting travel destination [
21]. Lee adopted the DBSCAN algorithm in the work of attraction popularity analysis [
22]. Moreover, the DBSCAN spatial clustering method, which is frequently used to discover tourist attractions, has become the basis of further applications such as travel trajectory extraction, travel pattern analysis and intelligent attraction recommendation. For example, Cai extracted the semantic trajectories from the geo-tagged dataset after using DBSCAN as the tourist attraction-discovering method [
22]. Vu and Chen performed the analysis of travel behaviors and movement patterns after finding attractions from geo-tagged photos [
23,
24]. Memon and Lee studied personalized travel recommendation approaches using the Flickr geo-tagged dataset [
25,
26].
However, because the geo-tagged social media data are more complex in geographical distribution, the clusters are diverse in shape and often contain many noisy data, which brings great challenges to the traditional spatial clustering algorithm. There are many shortcomings as to the widely-used density-based clustering algorithm like DBSCAN. On the one hand, there is a need to determine fixed clustering thresholds (e.g., density and cluster number) in advance, which results in difficulty to adapt to the clustering scenes when the regional density has a large difference. On the other hand, it is difficult to distinguish adjacent high-density areas, resulting in multiple different categories being assigned to the same cluster class.
Therefore, this paper proposes a new popular tourist attraction discovery approach based on Flickr geo-tagged photos, taking into account the irregular shape of the clustering area and the uneven distribution of the original coordinate points. Popular tourist attractions are extracted effectively through spatial clustering of the geo-location dataset and text mining methods. Then, popularity analysis of the extracted tourist attractions is performed in different contexts.
3. Methodology
3.1. Data Pre-Processing
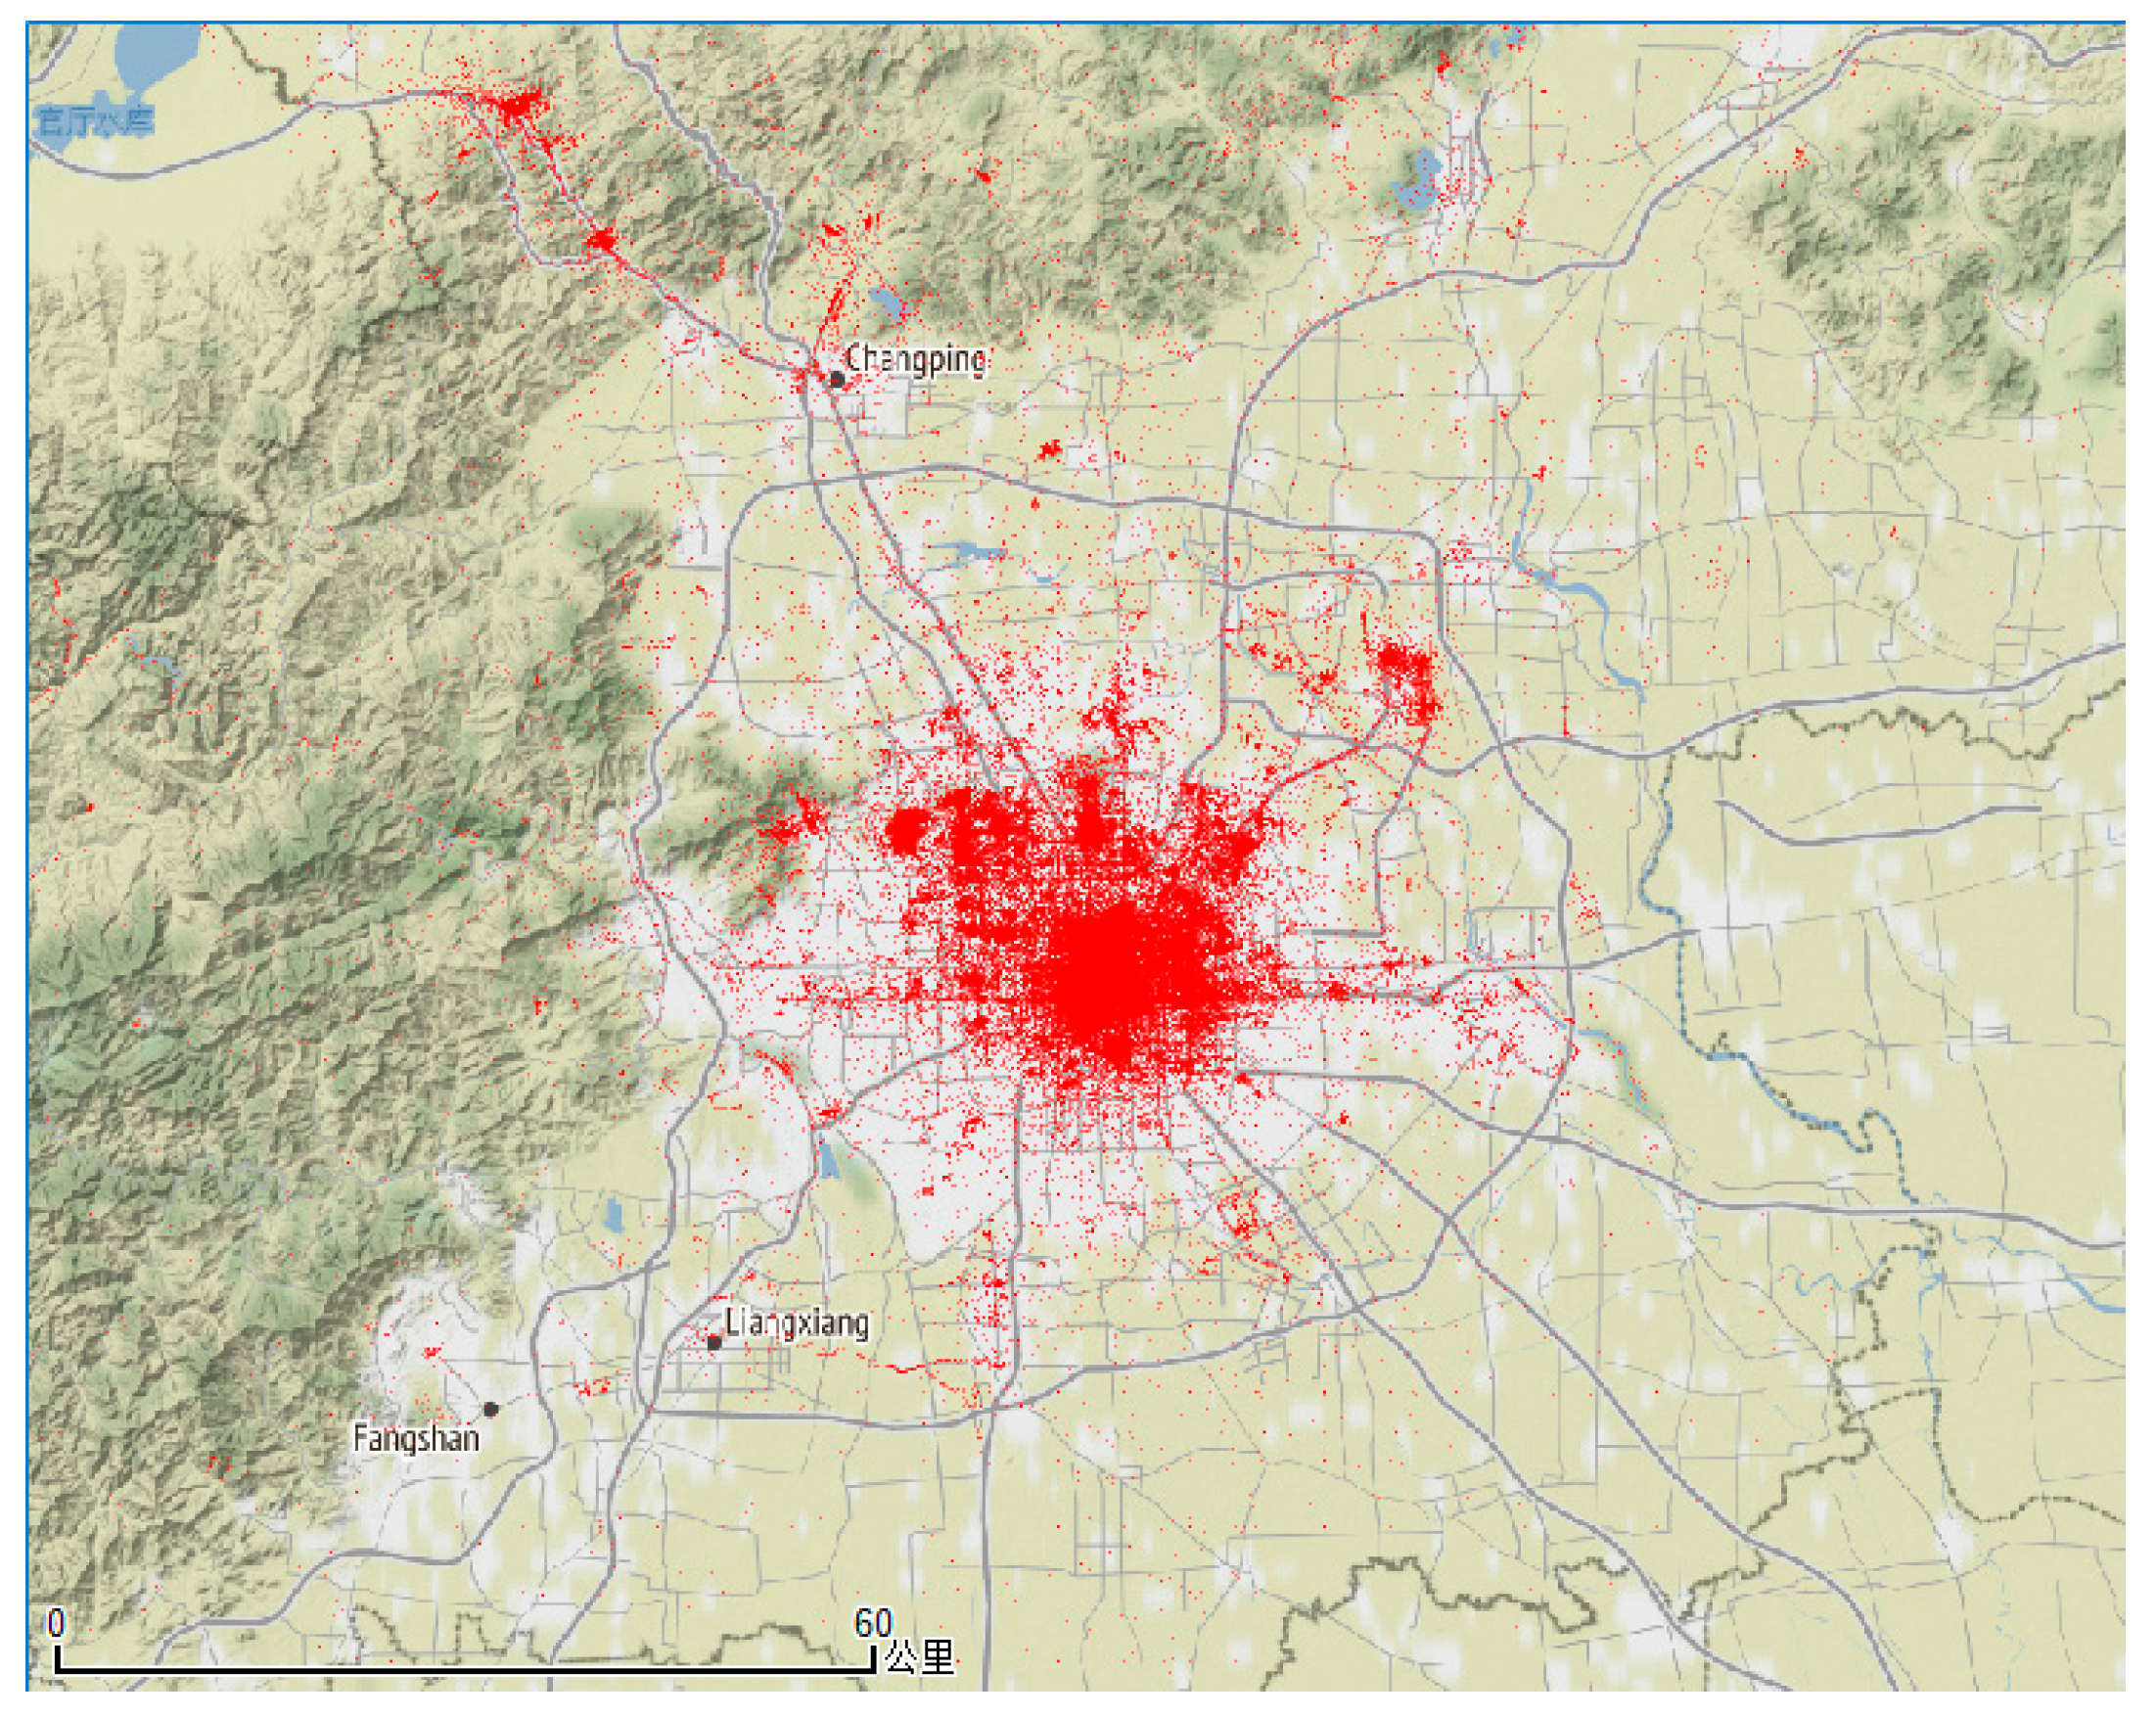
We use the Flickr public API to obtain a total of 213,938 geo-tagged photos and related meta tag data from 1 January 2005 to 1 January 2016, in Beijing, China. The data span 11 years and come from 22,354 users worldwide. Then, the Flickr dataset is preprocessed to remove the noisy data. Here, it mainly refers to removing the redundancy of the photos; a person may photograph a few times in a short time at the same place, and these photos are upload onto the Flickr website in all. For this situation, the redundancy should be removed. The photos taken by the same user within one hour in the same place should be treated as one. After redundancy processing, the number of pictures is 185,531.
Figure 1 shows the geographical distribution of Flickr geo-tagged points after removing redundancy.
In addition, in order to analyze the heat distribution of tourist attractions in different time and weather conditions (i.e., contexts), we also use the historical weather data of Beijing, which include temperature and weather condition information, provided by the Wunderground website (
http://www.wunderground.com/history).
3.2. Spatial Clustering
A new spatial clustering method is used to achieve tourist attraction discovering. First of all, using the idea of CFSFDP (Clustering by Fast Search and Find of Density Peaks) proposed by Rodriguez and Laio [
27], the cluster centers are extracted adaptively. Then, in order to achieve initial clustering, the remaining points are classified to the extracted clusters. The specific approach is: unclassified point i belongs to the category of the point whose density is greater than point i and the distance from point i is the shortest; after recursion, the remaining points are assigned to the extracted cluster centers.
The selection of the cluster center is determined by the two parameters of the point density ρ and the relative distance δ (i.e., the point that has large product value ρδ is chosen as the cluster center). Equations (1) and (3) illustrate the method of calculating the point density ρ and the relative distance δ.
where
represents the density of point i,
represents the shortest distance between point i and the point whose density is greater than point i,
is the distance from point i to the other point j in the clustering region and
is the search radius.
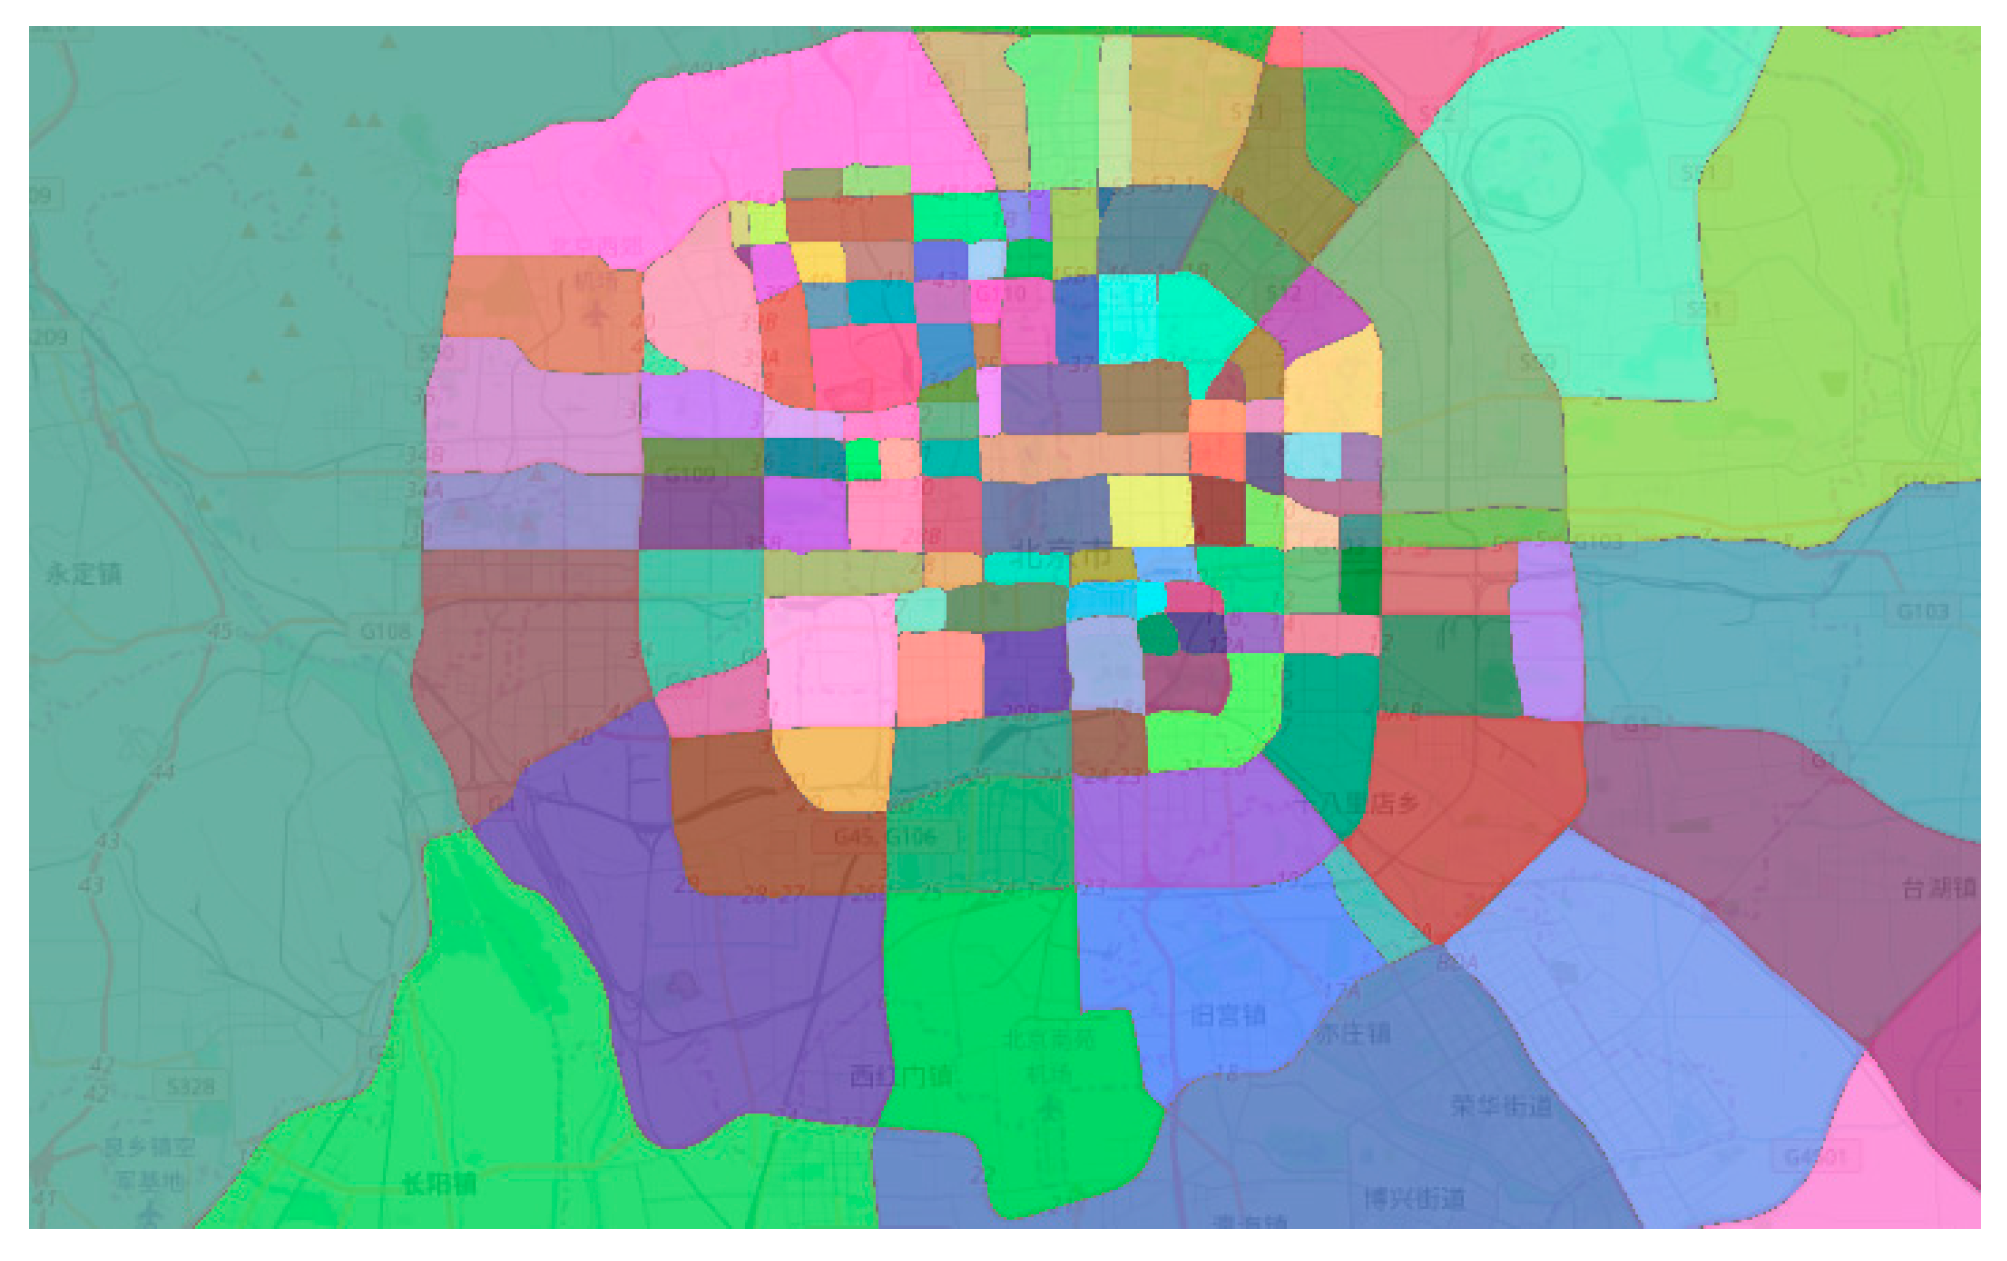
There are two implied assumptions. First, the cluster center has high-density, while being surrounded by low-density areas, and second, the cluster center has a relative large distance from other high-density centers. Since the density ρ and the relative distance δ are taken into account together to determine cluster centers, the traditional DBSCAN algorithm’s shortcoming of having difficulty distinguishing adjacent high-density areas can be overcome. In addition, in order to solve the problem of large differences in the density distribution of the clustering region, we use the road network to divide the classification region into several zones (see
Figure 2), and the density and the relative distance of the points are standardized in each zone. Hence the zoning and standardization steps enables our approach to be more adaptive to the clustering scenes when the regional density has a large difference.
Figure 2 illustrates the zoning result by main roads in Beijing, which has exactly 144 zones.
3.3. Class Mergence
In the above clustering process, the threshold of ρδ can be adjusted to set the discovering granularity of tourist attractions: the lower the threshold of ρδ is set, the more micro-scale clusters will be found. In this case, due to some reasons, e.g., some places have a large geographical area or the individual behavior data themselves are quite sparse, these may lead to the same place being partitioned into several different clusters. In order to solve this problem, the following steps are performed to achieve class mergence:
- (1)
First, we use the classical text similarity measure algorithm TF-IDF (Term Frequency-Inverse Document Frequency) to calculate the semantic tag’s weight for each initial cluster (in addition to geo-tagged information, there are many semantic text tags in Flickr photos). Equation (4) illustrates the weight calculation method.
where
represents the frequency of the current tag
in cluster j, N is the total number of clusters and
indicates how many clusters have the current tag
.
- (2)
Then, a multidimensional tag vector is generated for each cluster, and the cosine similarity between adjacent clusters is calculated, thereby merging the adjacent clusters that actually have high similarity with each other.
where X and Y represent two clusters to be compared,
and
are the multidimensional tag vectors of X and Y, respectively, and
and
indicate the TF-IDF weights of tag
in
and
, respectively.
3.4. Label Annotation for Popular Tourist Attractions
The tags that have a top 10 TF-IDF weight value are assigned as semantic labels of each cluster. Then, the name attribute of the cluster is determined by the following method: a set of Points Of Interest (POI) is obtained through calling Baidu’s anti-geocoding API interface by inputting the point coordinates in the cluster, and the name of the POI with the highest number of occurrences is assigned to the cluster. Finally, if the selected POI type is a tourist attraction, the cluster is retained, otherwise the cluster is removed. As a result, the tourist attractions containing semantic information are formed.
Figure 3 illustrates two word cloud examples (the Forbidden City and the Bird’s Nest), which are generated by the user-annotated Flickr photo tags together with the corresponding TF-IDF weights. The top 10 tags are retained as the label collection of each cluster. Through the labels, we can understand the attitudes and interests of visitors to the attractions, which facilitates building up the portrait of the tourist attraction and providing decision support to the tourism management department in both tourism planning and tourism resource development.
4. Popular Tourist Attraction-Discovering Result
4.1. Result Description
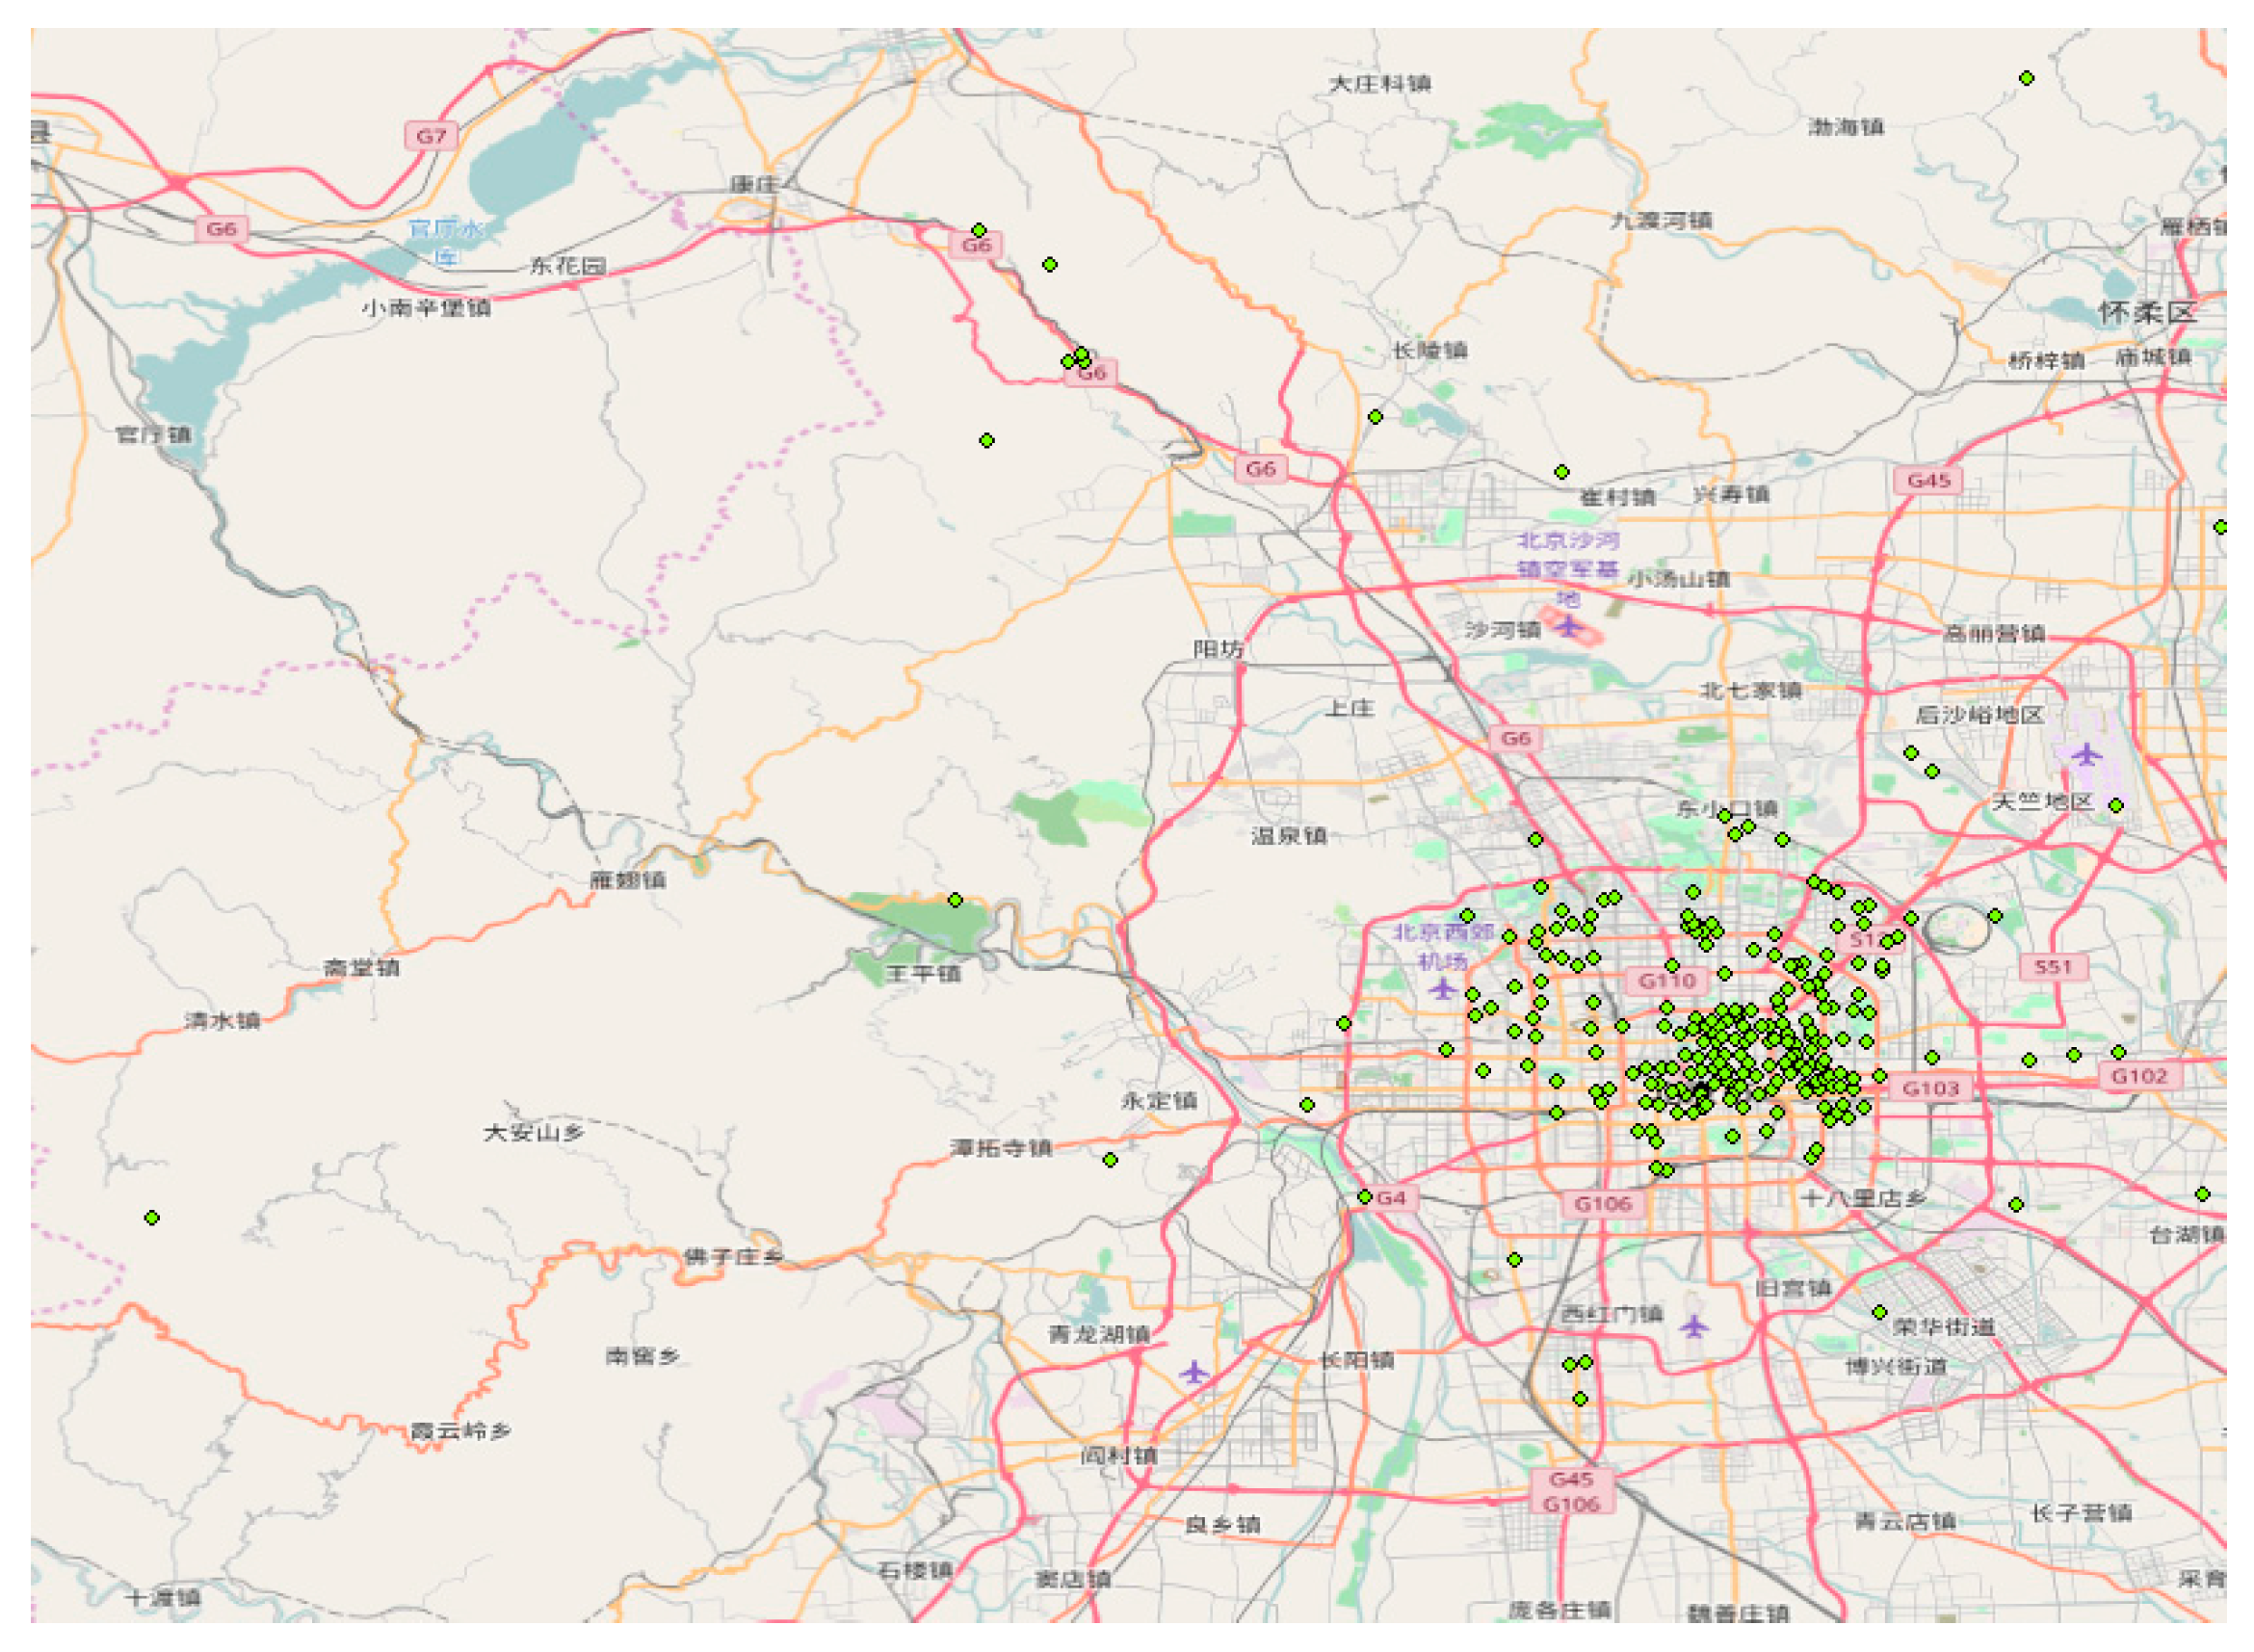
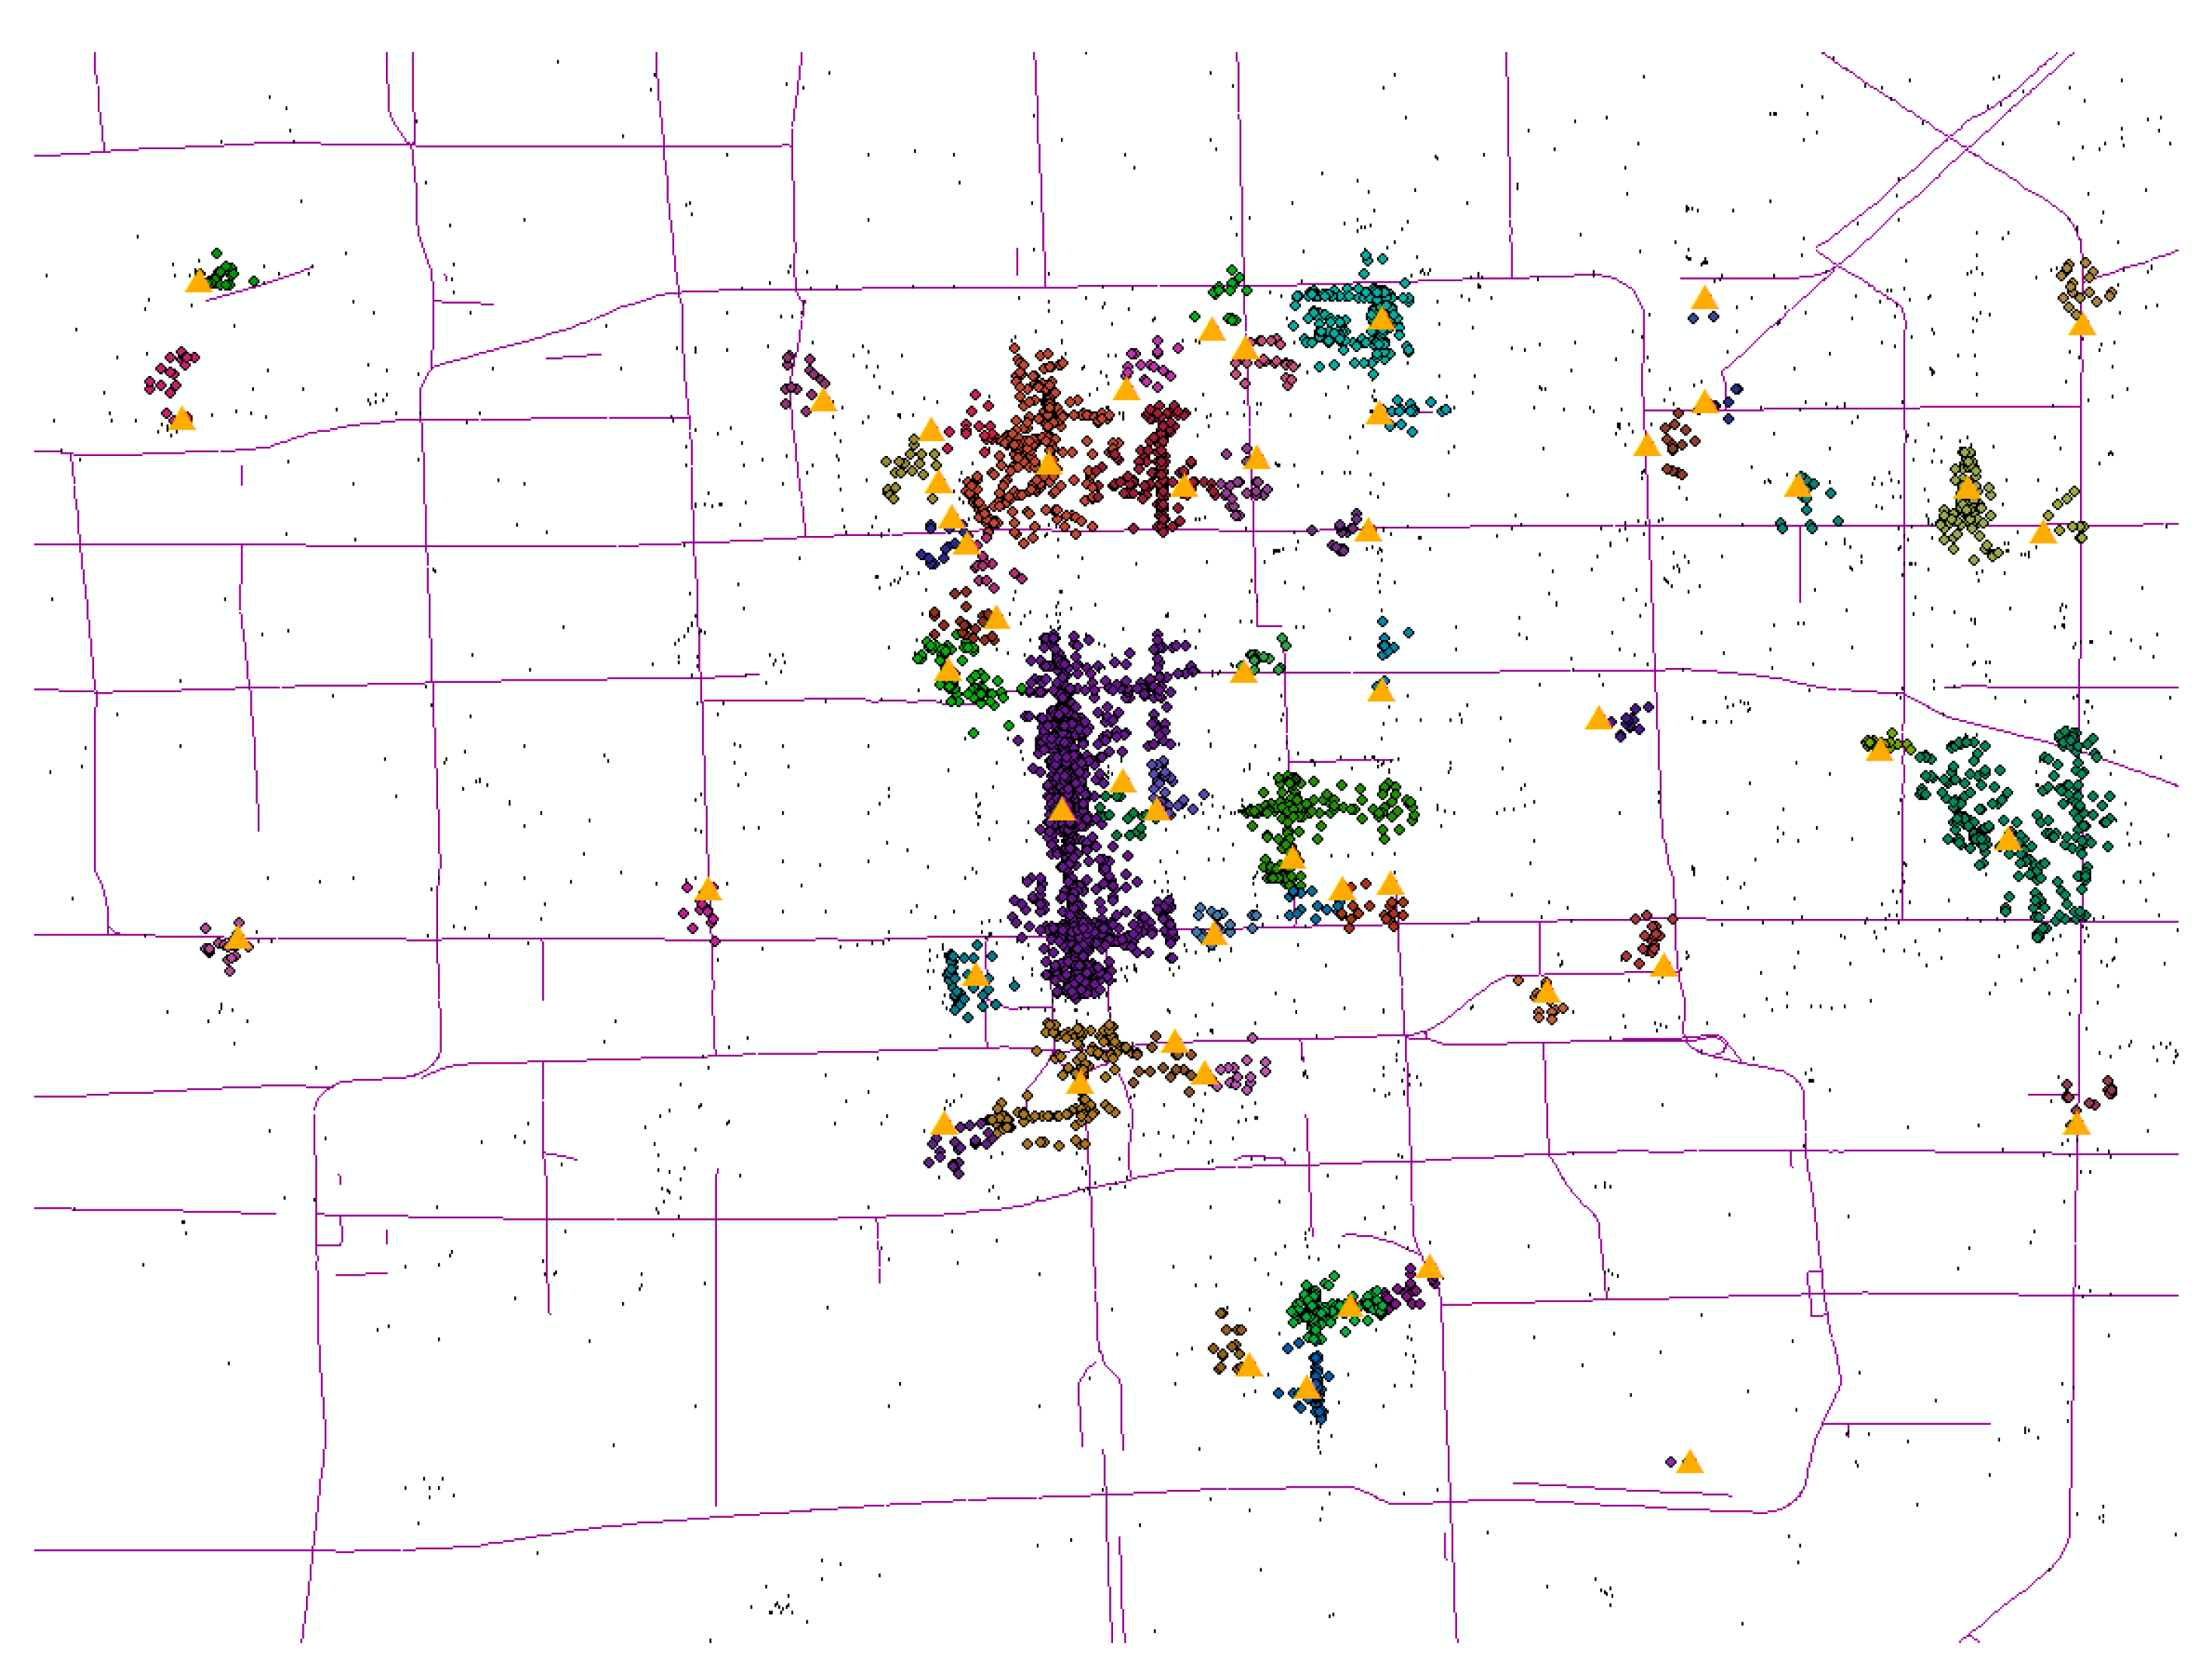
Based on the above methods, we use Java to implement a tourist attraction extraction tool. Flickr geo-tagged photo data in Beijing from 2005 to 2016 are used as the input. After spatial clustering (Step 1.2), 300 clusters are generated, and then, through the class mergence step, the number of clusters is reduced to 243; finally, after the semantic annotation, the number of clusters with the type of tourist attractions is decreased to 143.
Figure 4 illustrates the cluster center distribution map after tourist attraction discovering, and
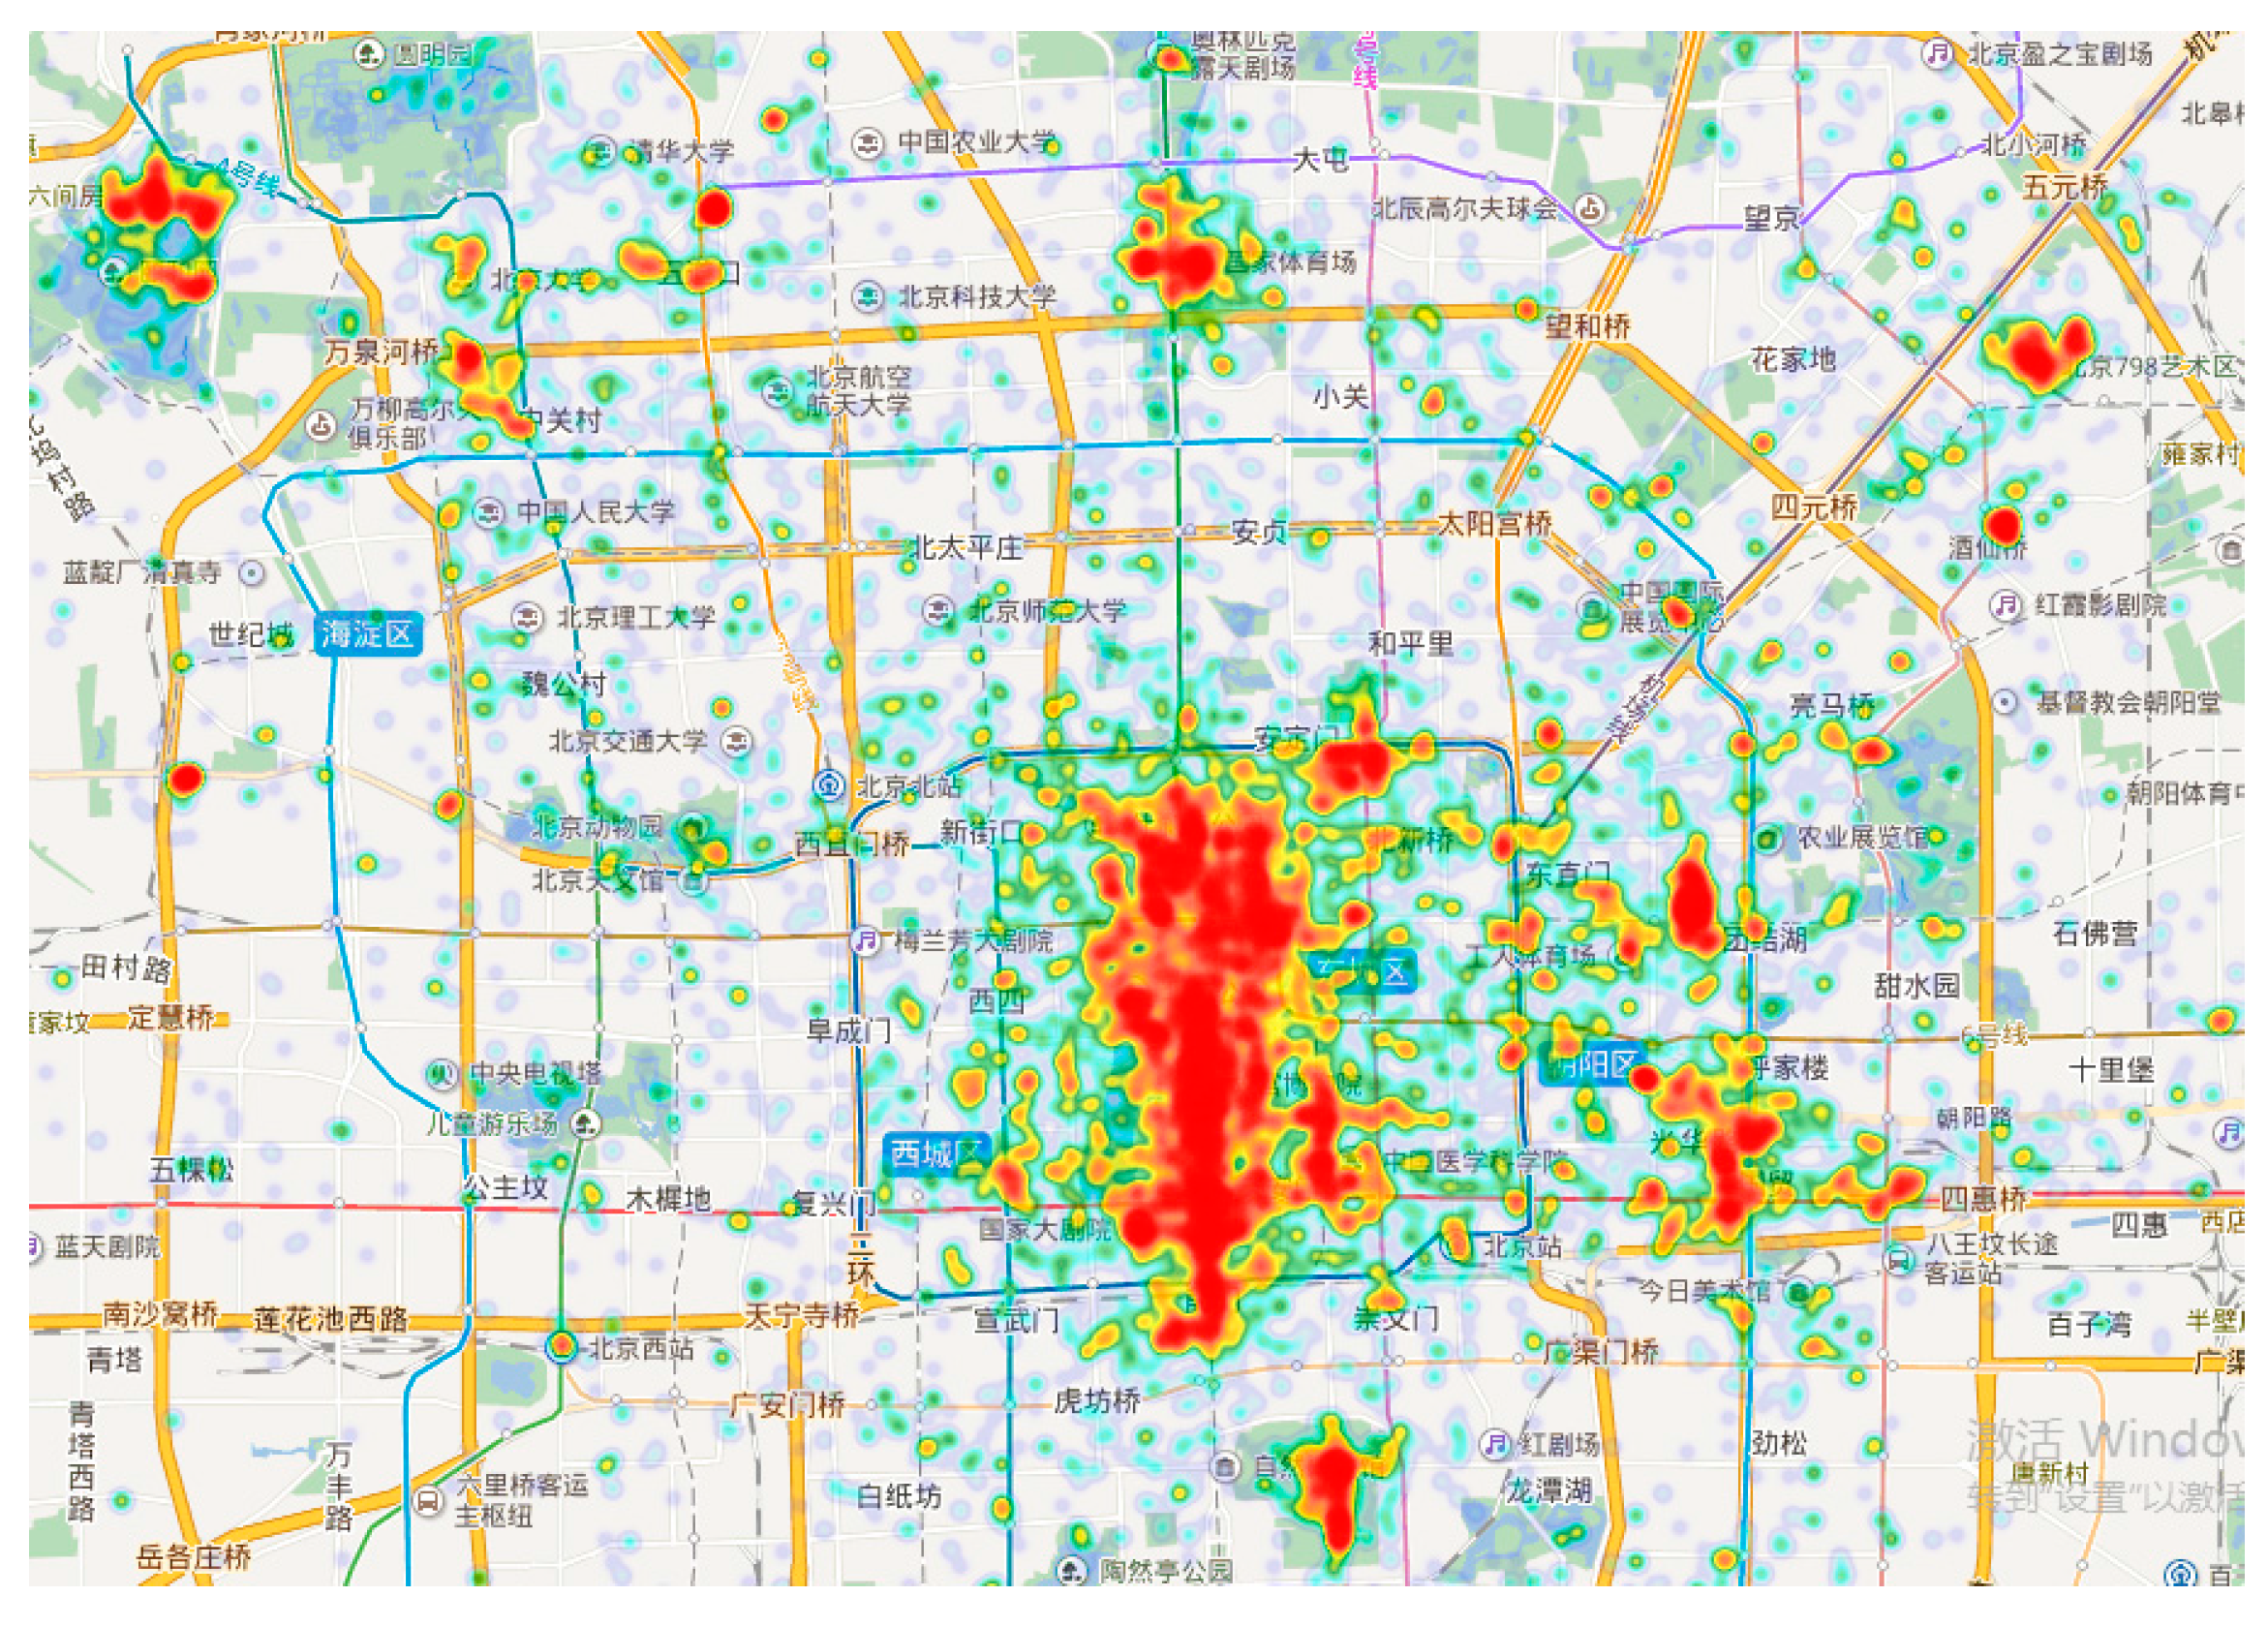
Figure 5 shows the heat map of tourist attraction-visiting activities.
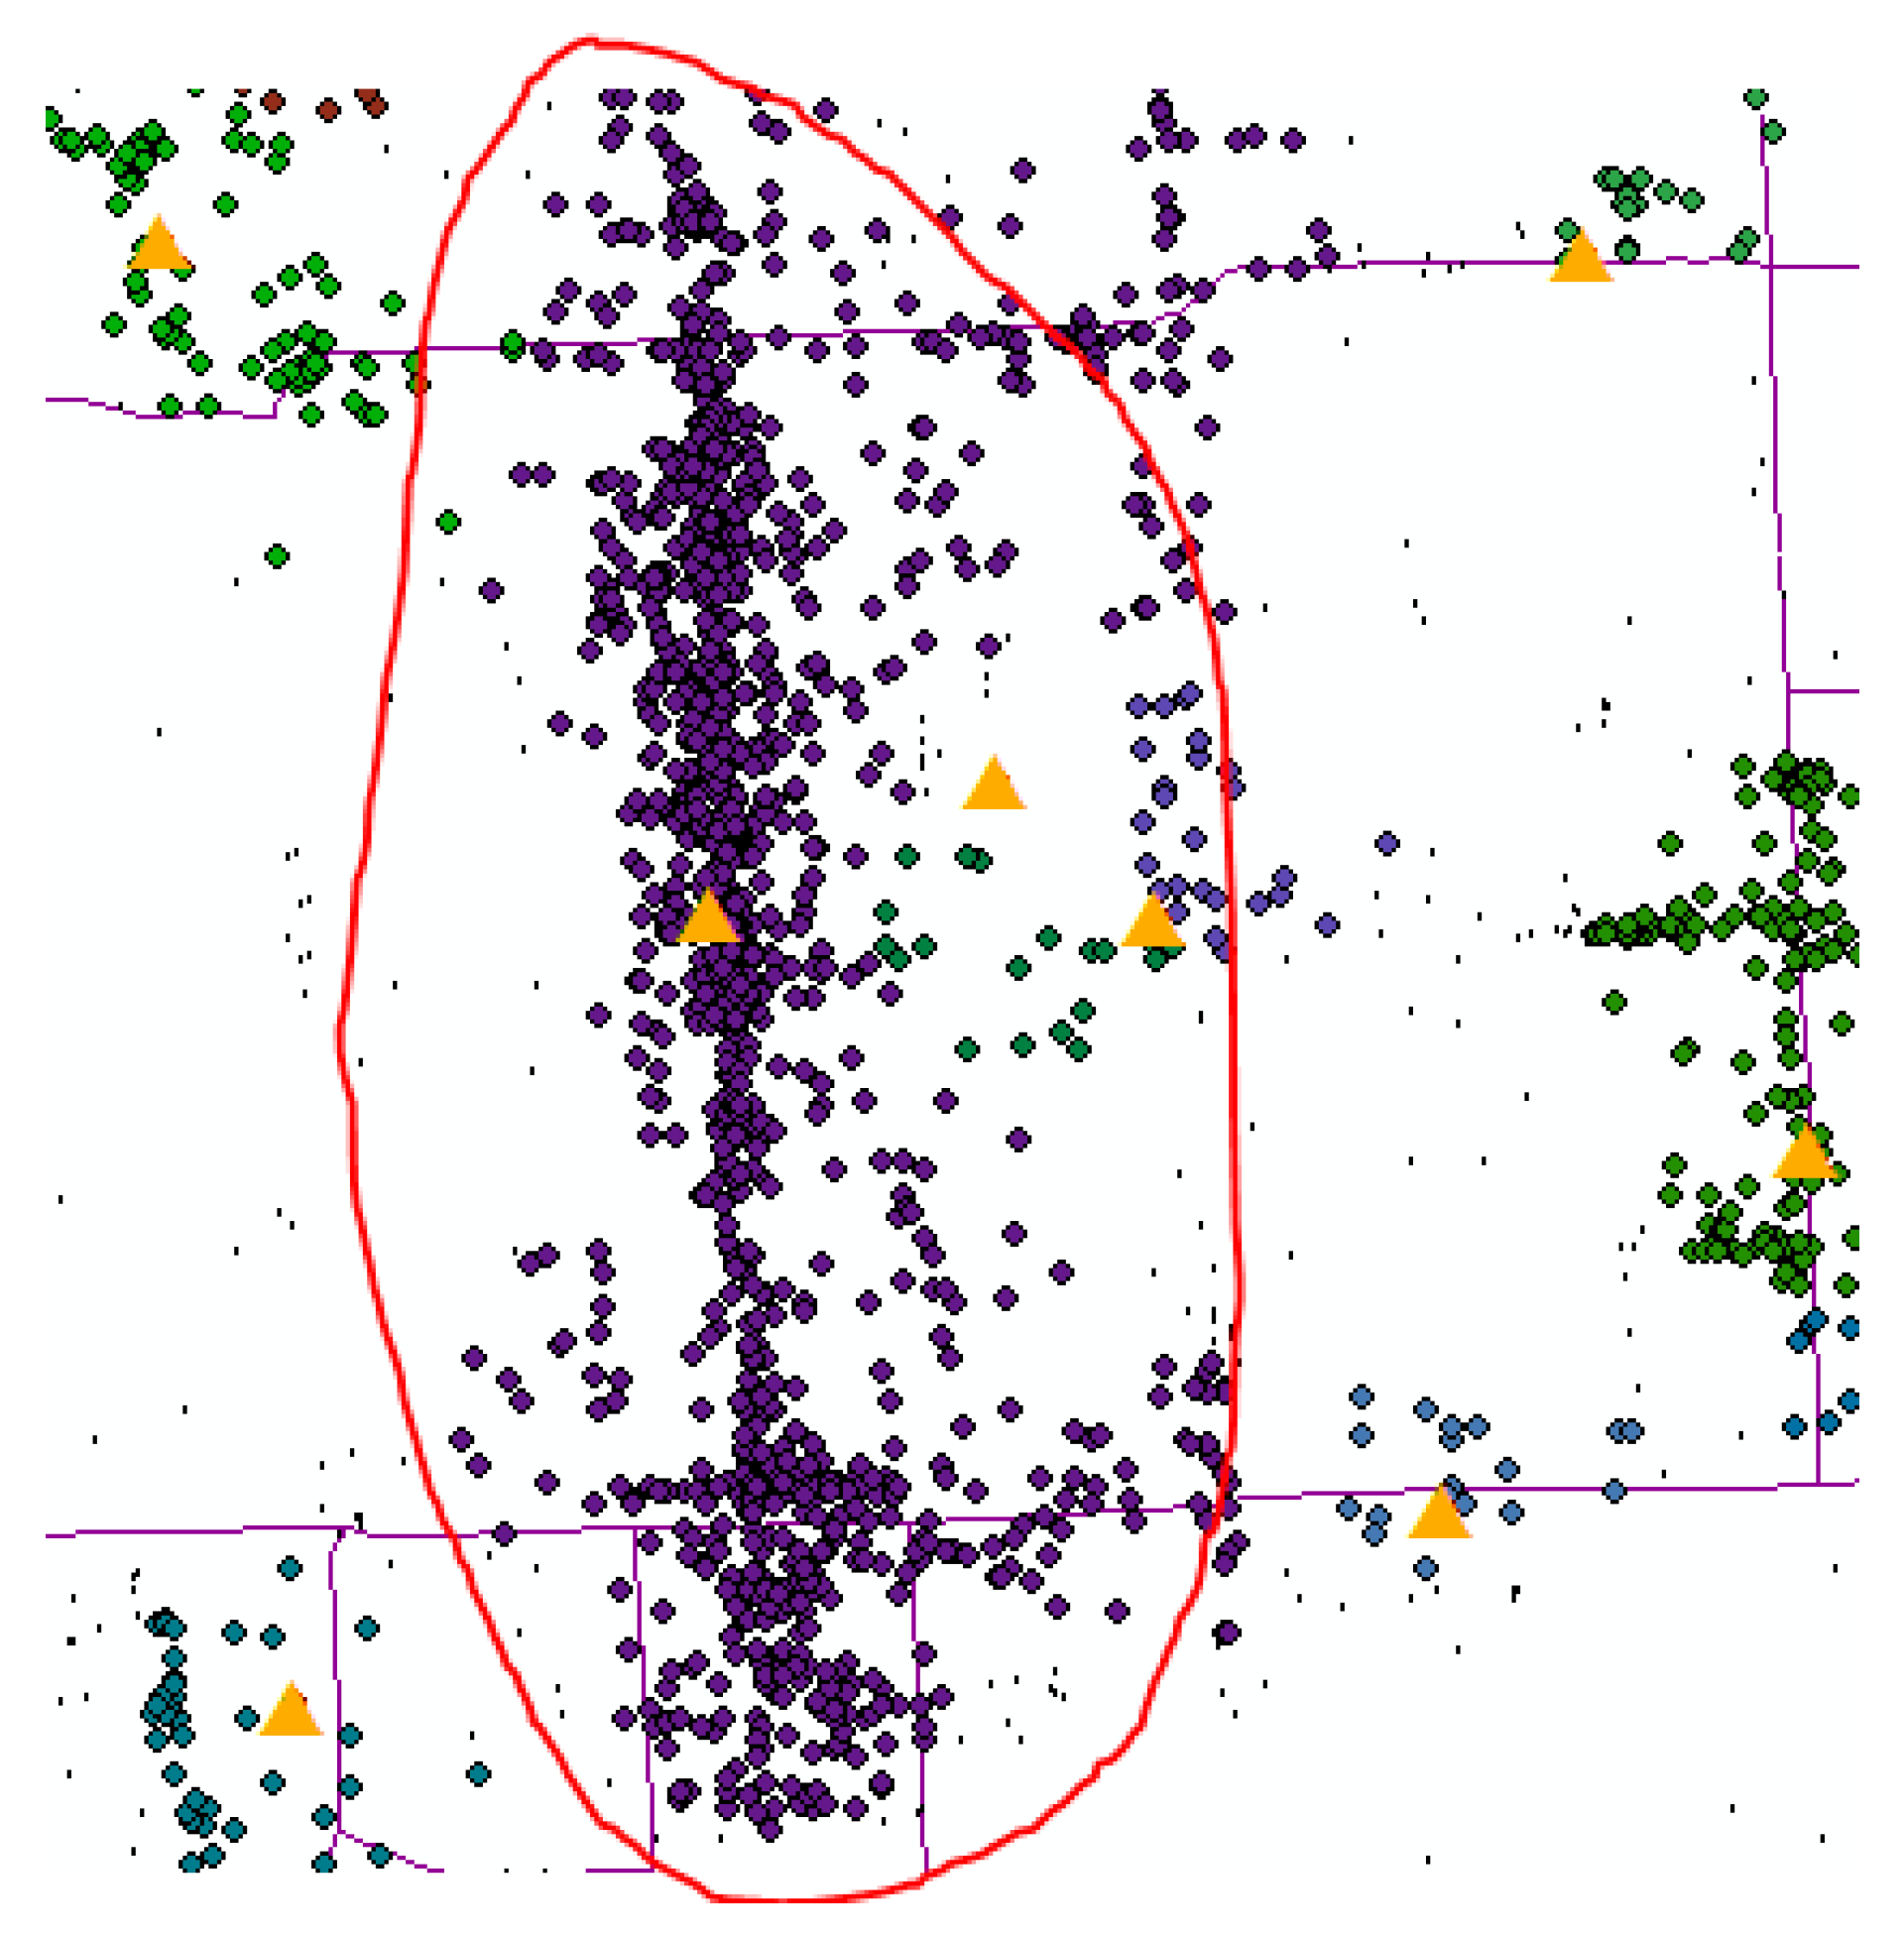
Our attraction-discovering result illustrates that the proposed approach is adaptive to the scenes of uneven density distribution in the clustering region. The extracted tourist attractions are more evenly distributed in the clustering region, whether in high or low density areas. This is due to the zoning and standardization steps. More importantly, our approach can also effectively distinguish the adjacent high-density areas. The original point coordinates of the Tiananmen area in the center of Beijing are quite intensive. Traditional spatial clustering methods make it difficult to distinguish different tourist attractions. However,
Figure 6 indicates that our approach enables good distinguishing of the high-density areas. In the Tiananmen area, the Tiananmen, Tiananmen Square and even the People’s Hero Monument are effectively separated and extracted.
Figure 7 shows the heat map of the attractions in Tiananmen Square and its surrounding area.
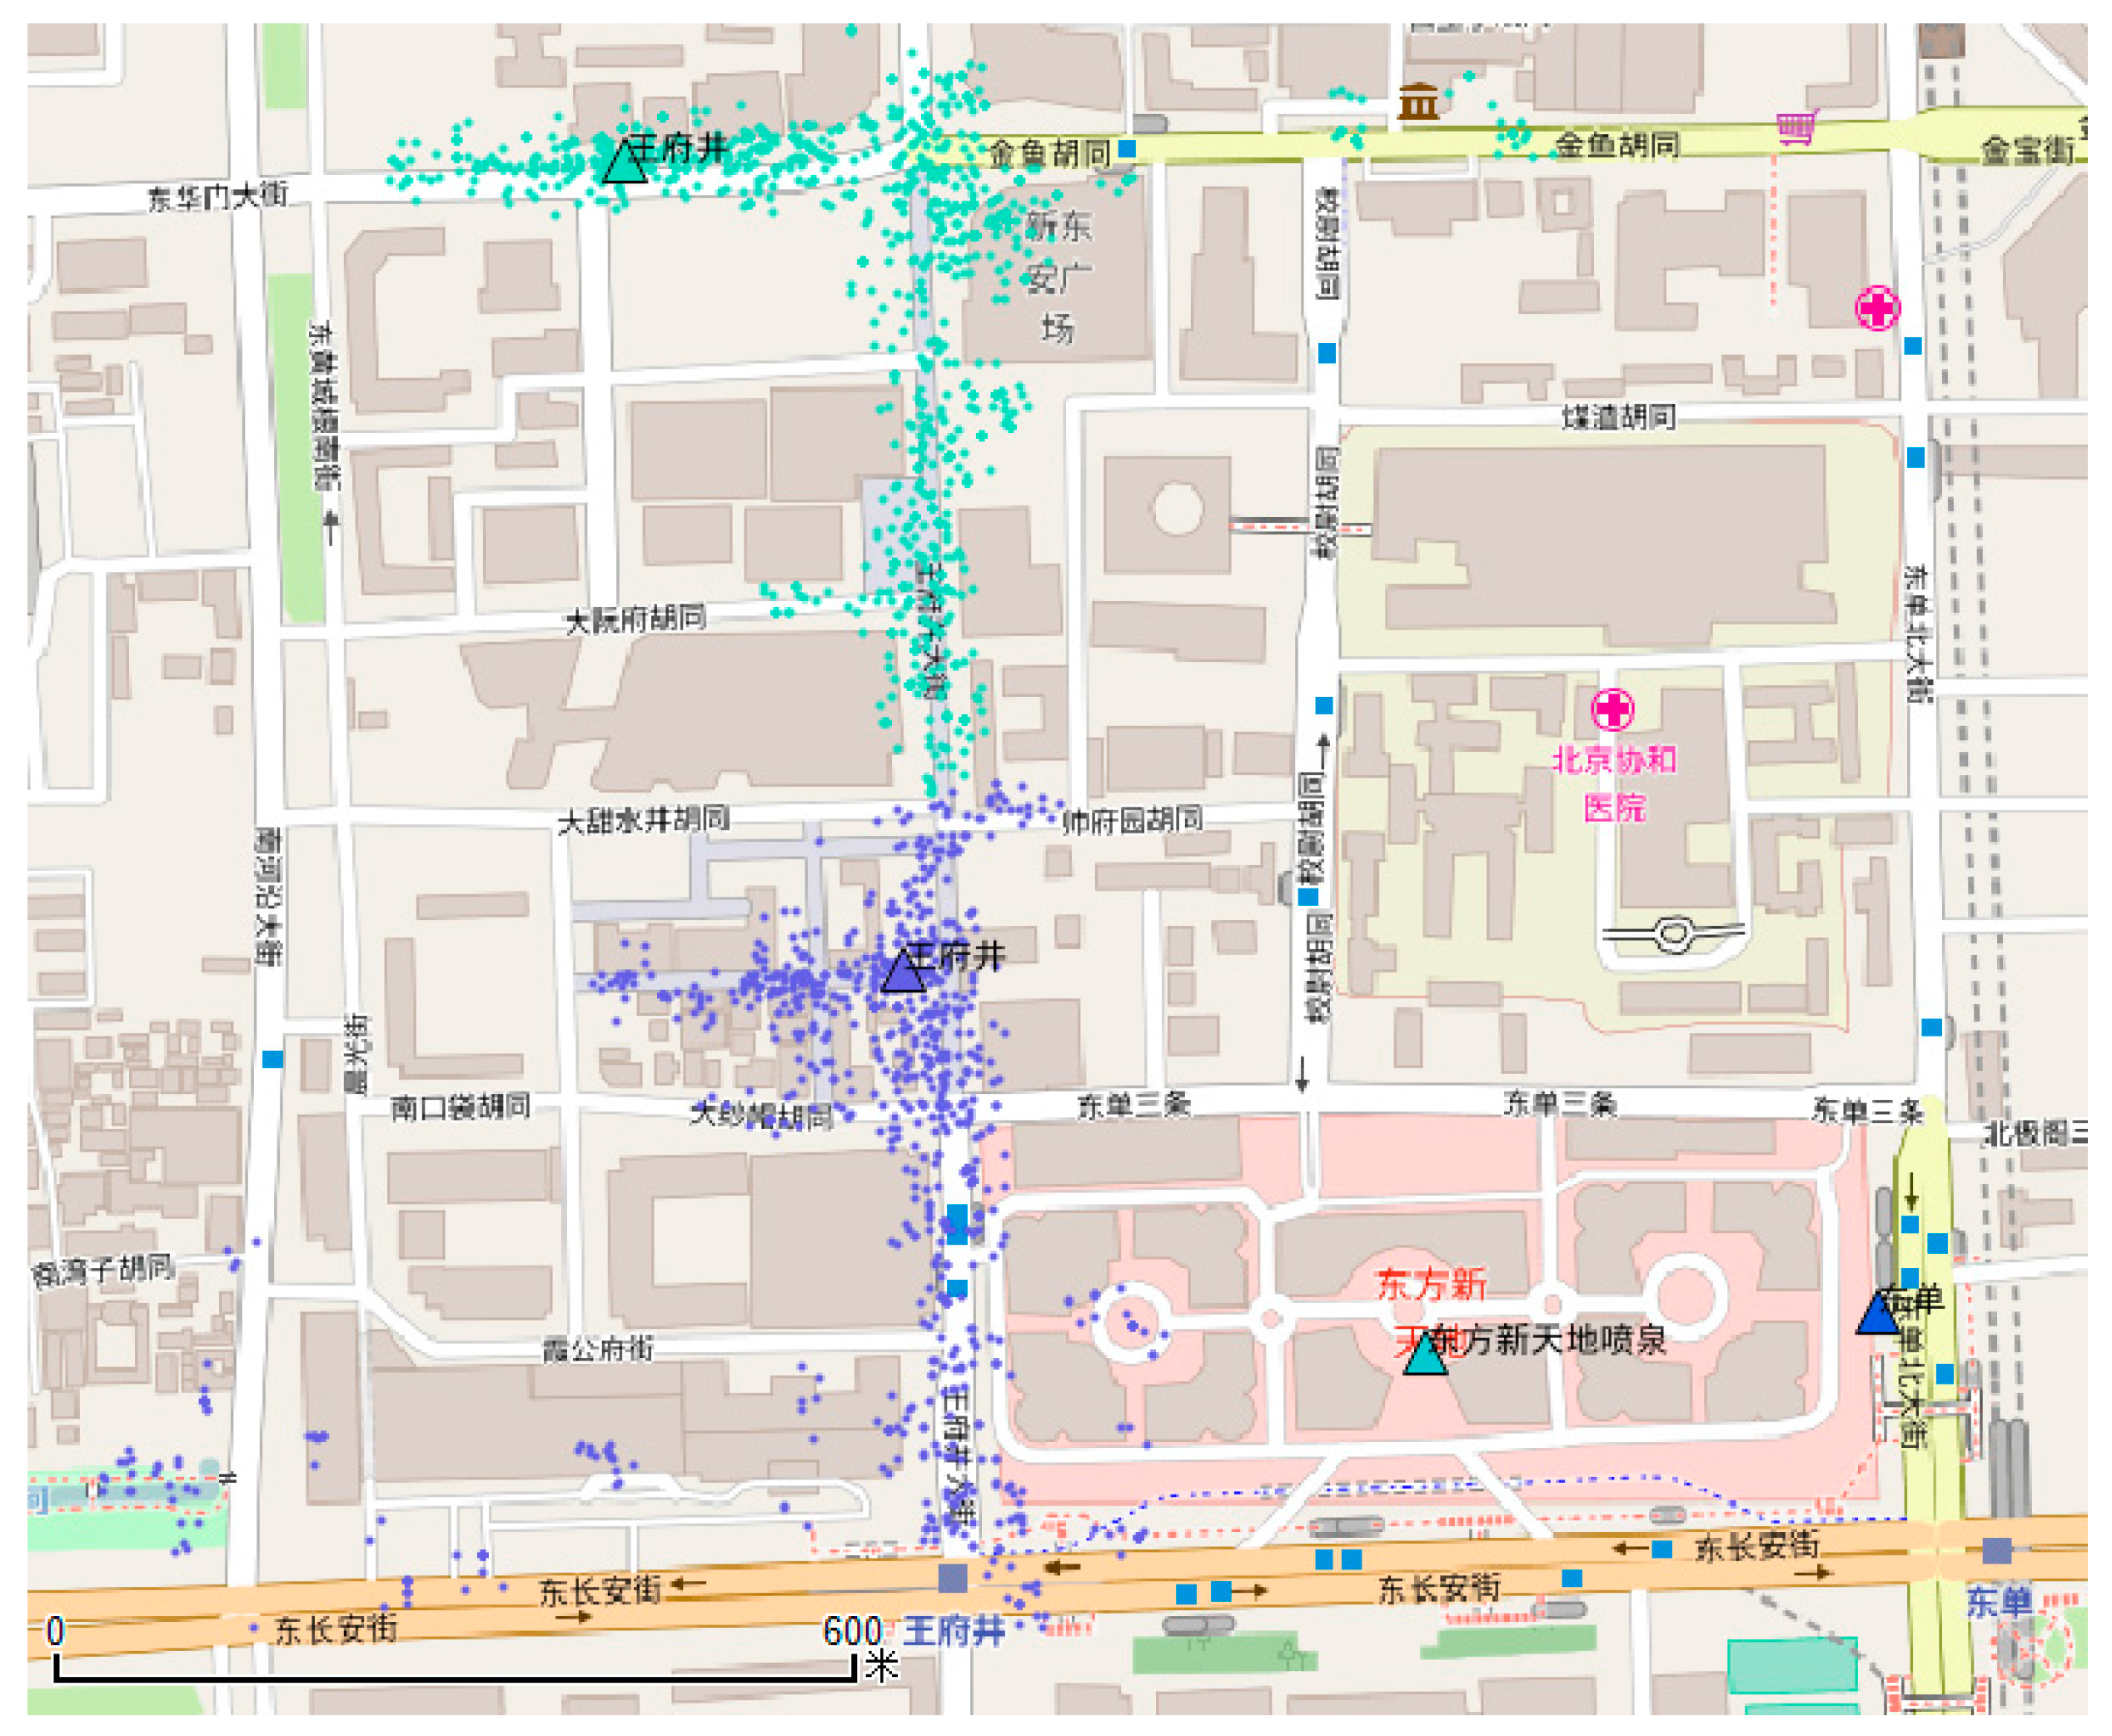
In addition, we also find that the proposed approach enables more effectively discovering the tourist attraction that has a large geographical area and an irregular shape. In the class mergence step, the TF-DIF method is used to merge adjacent semantic similar clusters to achieve this goal.
Figure 8 shows the results of the preliminary clustering of the Wangfujing area. There are two clusters, where the triangle represents the cluster center and points in different clusters are identified by different colors. Then, through TF-IDF cosine similarity calculation, these two clusters are eventually merged into one (see
Figure 9).
4.2. Result Comparison
For the sake of quantitative comparison, we also implement a DBSCAN-based program to achieve tourist attraction discovering from the Flickr geo-tagged dataset, using the widely-used machine learning package Sckitlearn. The clustering parameters are set as follows: the search radius r = 15 m, and the density threshold minPts = 20. Then, the final number of generated tourist attractions is 100, and the tourist attraction distribution map is shown in
Figure 10.
DBSCAN is a typical density-based clustering algorithm, which enables discovering the cluster consisting of a high-density connectivity area. From the figure, it is observed that the algorithm can also find clusters of arbitrary shapes in the feature space containing noisy data. However, its shortcomings are obvious, as well. First, the results of the DBSCAN method are concentrated in the high-density region, while the extracted tourist attractions by our approach are more evenly distributed in the clustering region, whether in high or low density areas (see
Figure 4). Secondly, DBSCAN cannot make an effective distinction for the adjacent high-density areas (such as Tiananmen Square and its surrounding area).
Figure 11 demonstrates that Tiananmen, Tiananmen Square and People’s Heroes Monument are merged and classified as a category after running DBSCAN clustering.
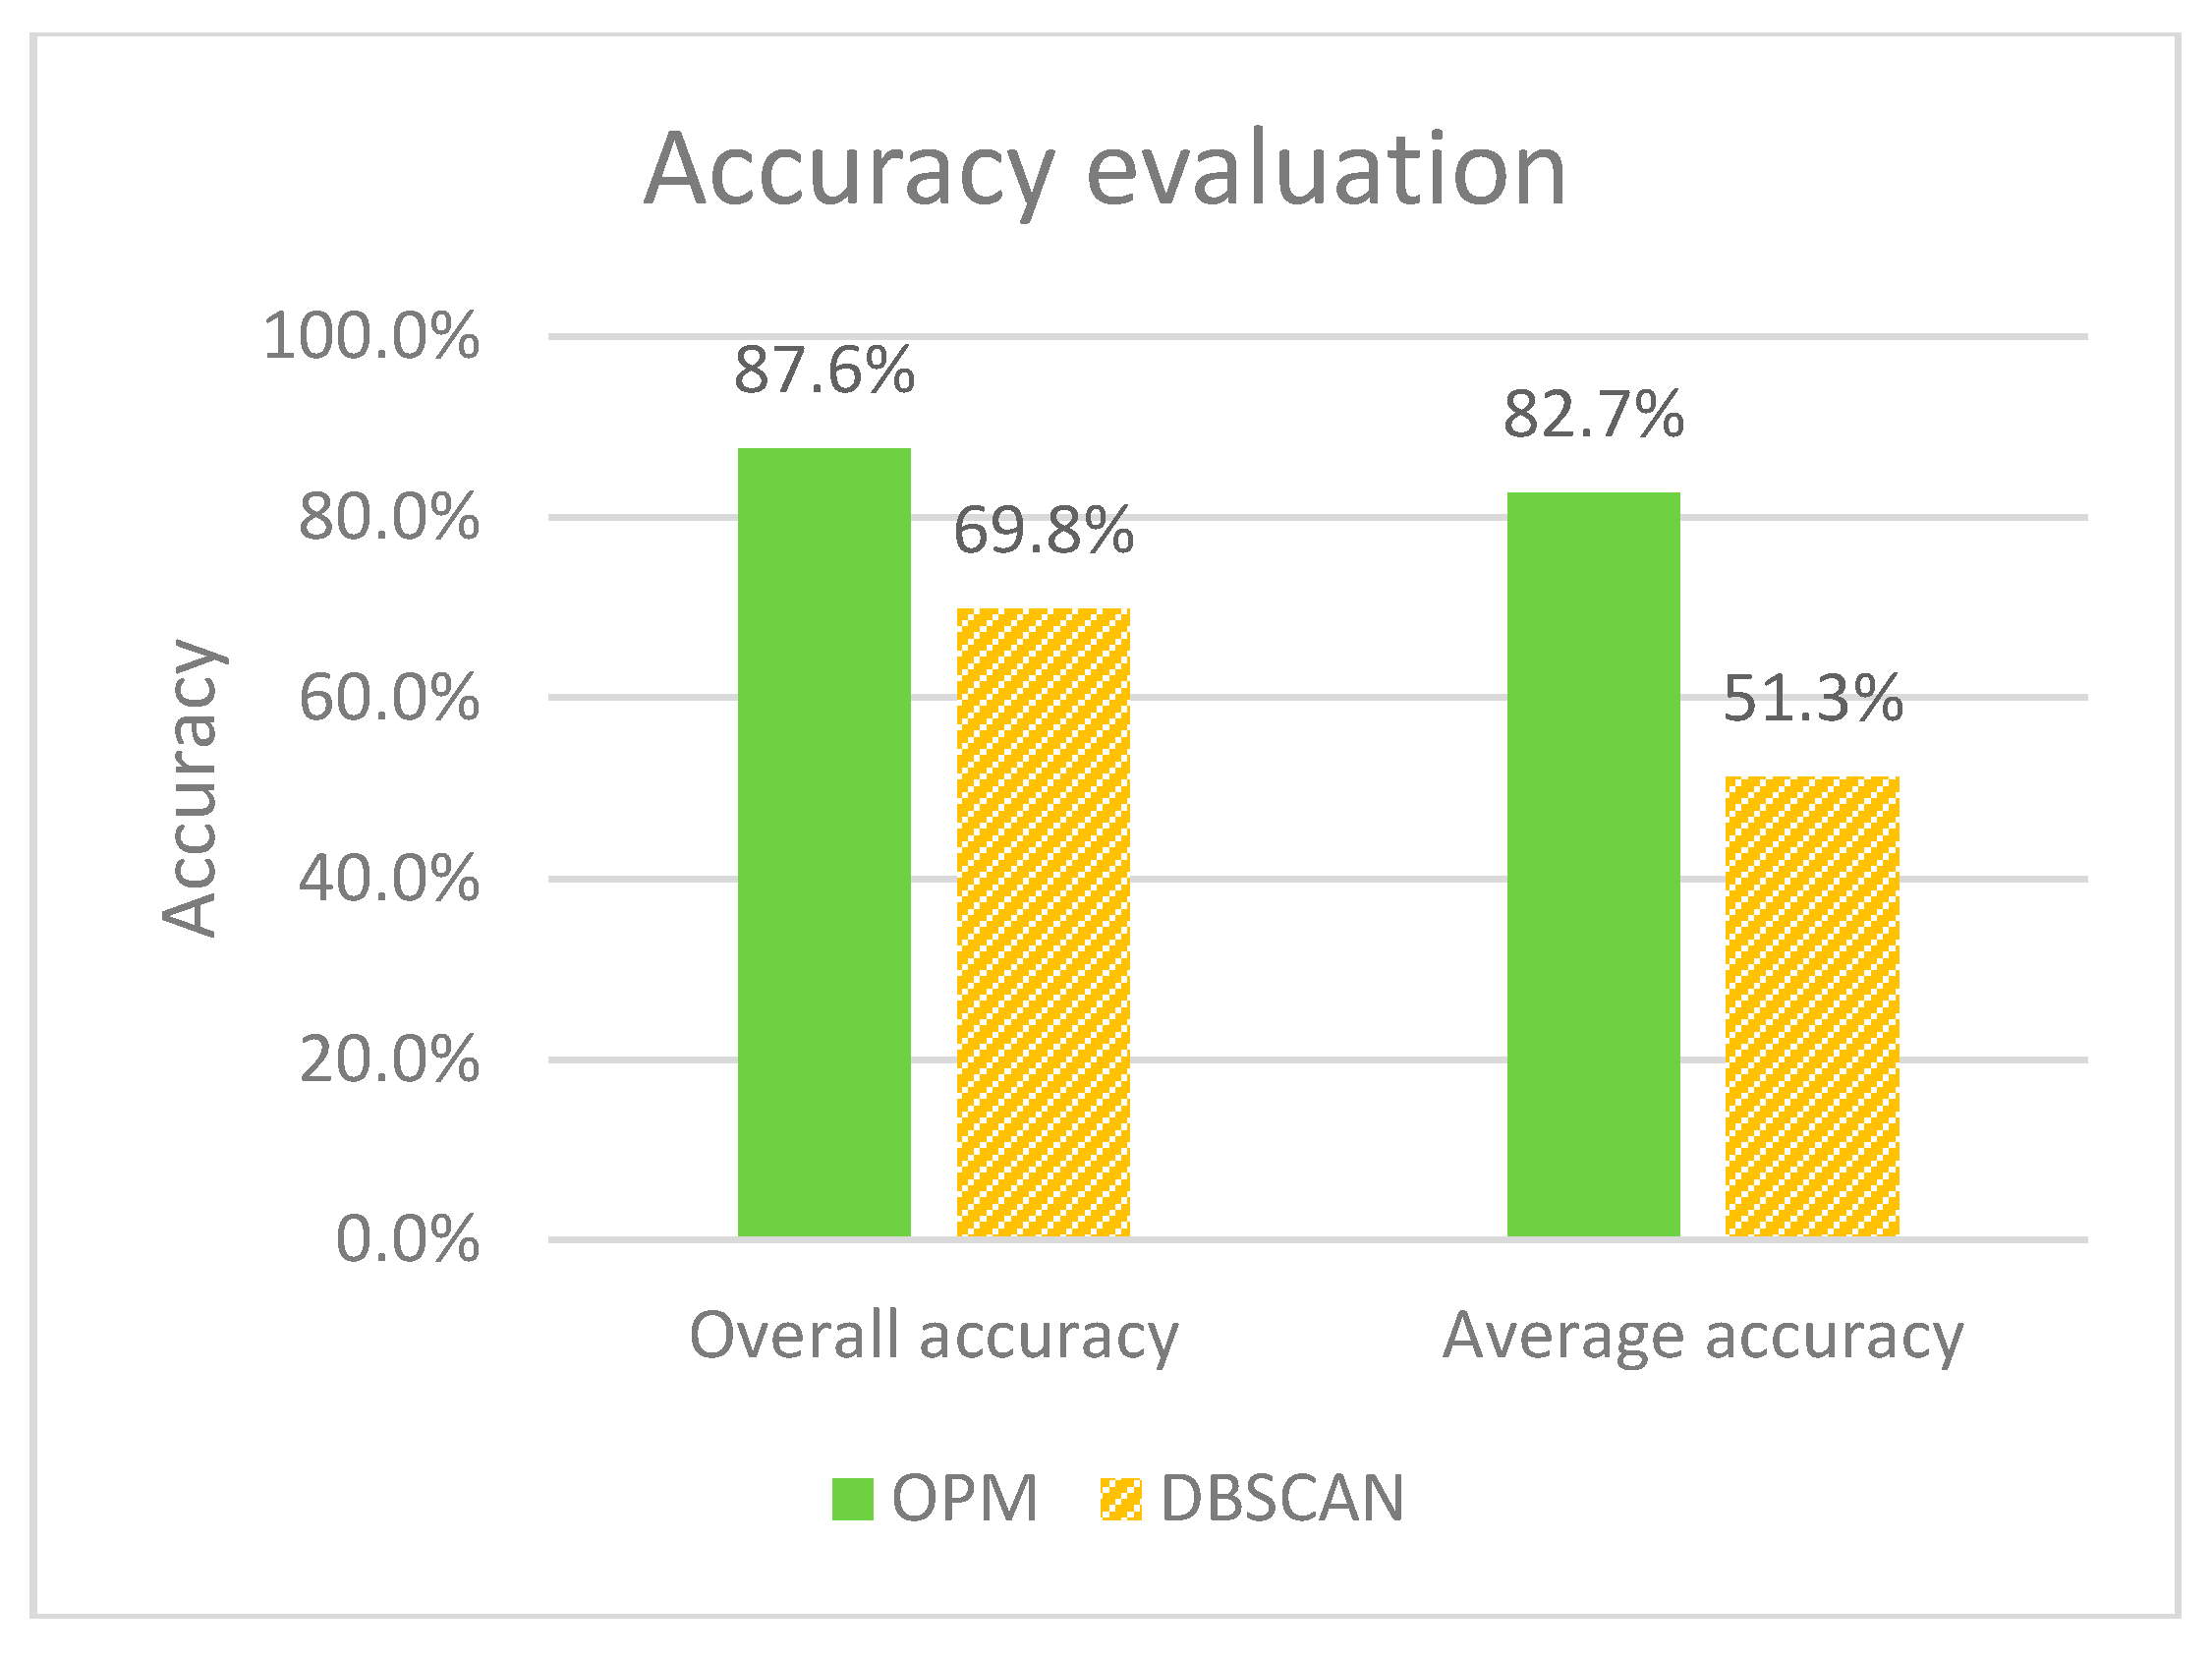
In addition, we randomly select 10,000 points from the Flickr dataset and then manually mark the attraction (i.e., class) information by overlaying the points on the Baidu map. A total of 99 categories, including 98 tourist attractions and none-attractions, are annotated onto the test points (3568 points for the non-attractions, and the other 6432 points assigned to the other 98 attractions). Thus, we calculate the Overall Accuracy (OA) and Average Accuracy (AA) of the two clustering results, which are generated by Our Proposed Method (OPM) and DBSCAN, respectively. Then, accuracy evaluation is performed to compare the two methods. OA and AA are calculated as shown in Equations (6) to (8).
where
represents the true positives of class i (i.e., the number of the points which are classified correctly in class i),
represents the class number (99 in this testing scenario),
represents the total point number (10,000 in this testing scenario),
is the accuracy rate of class i and
is the point number of class i.
Figure 12 illustrates the results of the accuracy evaluation. It is observed that our proposed method is significantly higher than the DBSCAN method in classification accuracy (87.6% vs. 69.8% in OA, and 82.7% vs. 51.3% in AA). We note that the AA gap is greater than the OA gap. Because the DBSCAN method cannot distinguish the adjacent high-density areas and cannot find the attractions in low-density areas, parts of the real attractions are lost or misclassified. This reason leads to a relatively large AA gap between the two approaches.
5. Application Scenario: Popularity Analysis of Tourist Attractions
Based on the extracted clusters, the popularity analysis of tourist attractions in Beijing is performed. On the one hand, we extracted the top 20 popular tourist attractions; on the other hand, we also use time and weather data to build different contexts to observe the popularity distribution of the tourist attractions in Beijing from multi-dimensions. In this paper, we select the Forbidden City, Bird’s Nest, Jingshan Park and the Badaling Great Wall as typical attractions to perform popularity analysis under different contexts.
5.1. Top 20 Popular Tourist Attractions
Through statistical processing of the geo-tagged points within the attraction clusters, the tourist attractions ranking in the top 20 are shown in
Figure 13. From the Flickr perspective, popular tourist attractions in Beijing include: Forbidden City, Summer Palace, Tiantan Park, Tiananmen Square, People’s Heroes Monument, Shichahai, Wangfujing, Tiananmen Square, Jingshan Park, Sanlitun, Mutianyu Great Wall, Beihai Park, Nanluoguxiang Lane, Qianmen, Lama Temple, Beijing 798 Art District, Drum Tower, Bird's Nest, National Theatre and Badaling Great Wall.
5.2. Popularity Analysis under Different Temporal Contexts
Obviously, time has an important impact on the travel choice. Observing people’s visiting behavior to tourist attractions from the temporal perspective, some laws of travelling could be found. We perform attraction popularity analysis divided by quarters, months, slack/busy seasons (for each year, the slack season is from 15 November to 15 March, and the busy season is from 16 March to 14 November) and weekend/working days.
Figure 14 represents the quarterly heat distribution map of the four typical attractions (Forbidden City, Bird’s Nest, Jingshan Park and Badaling Great Wall). From the figure, it is observed that in the second and third quarters, the visiting heat of the four typical attractions is significantly higher than the first and fourth quarters.
Figure 15 illustrates the monthly heat distribution map of the four attractions. From the figure, it can be seen that the four tourist attractions usher in their visitor peak roughly in April and August each year.
Figure 16 represents the heat distribution map of the four attractions divided by the slack season and the busy season. From the figure, it is observed that in the busy season, the visiting heat of the four tourist attractions is significantly higher than the slack season. In the busy season, it is about three to four times the visiting number of tourist attractions in the slack season.
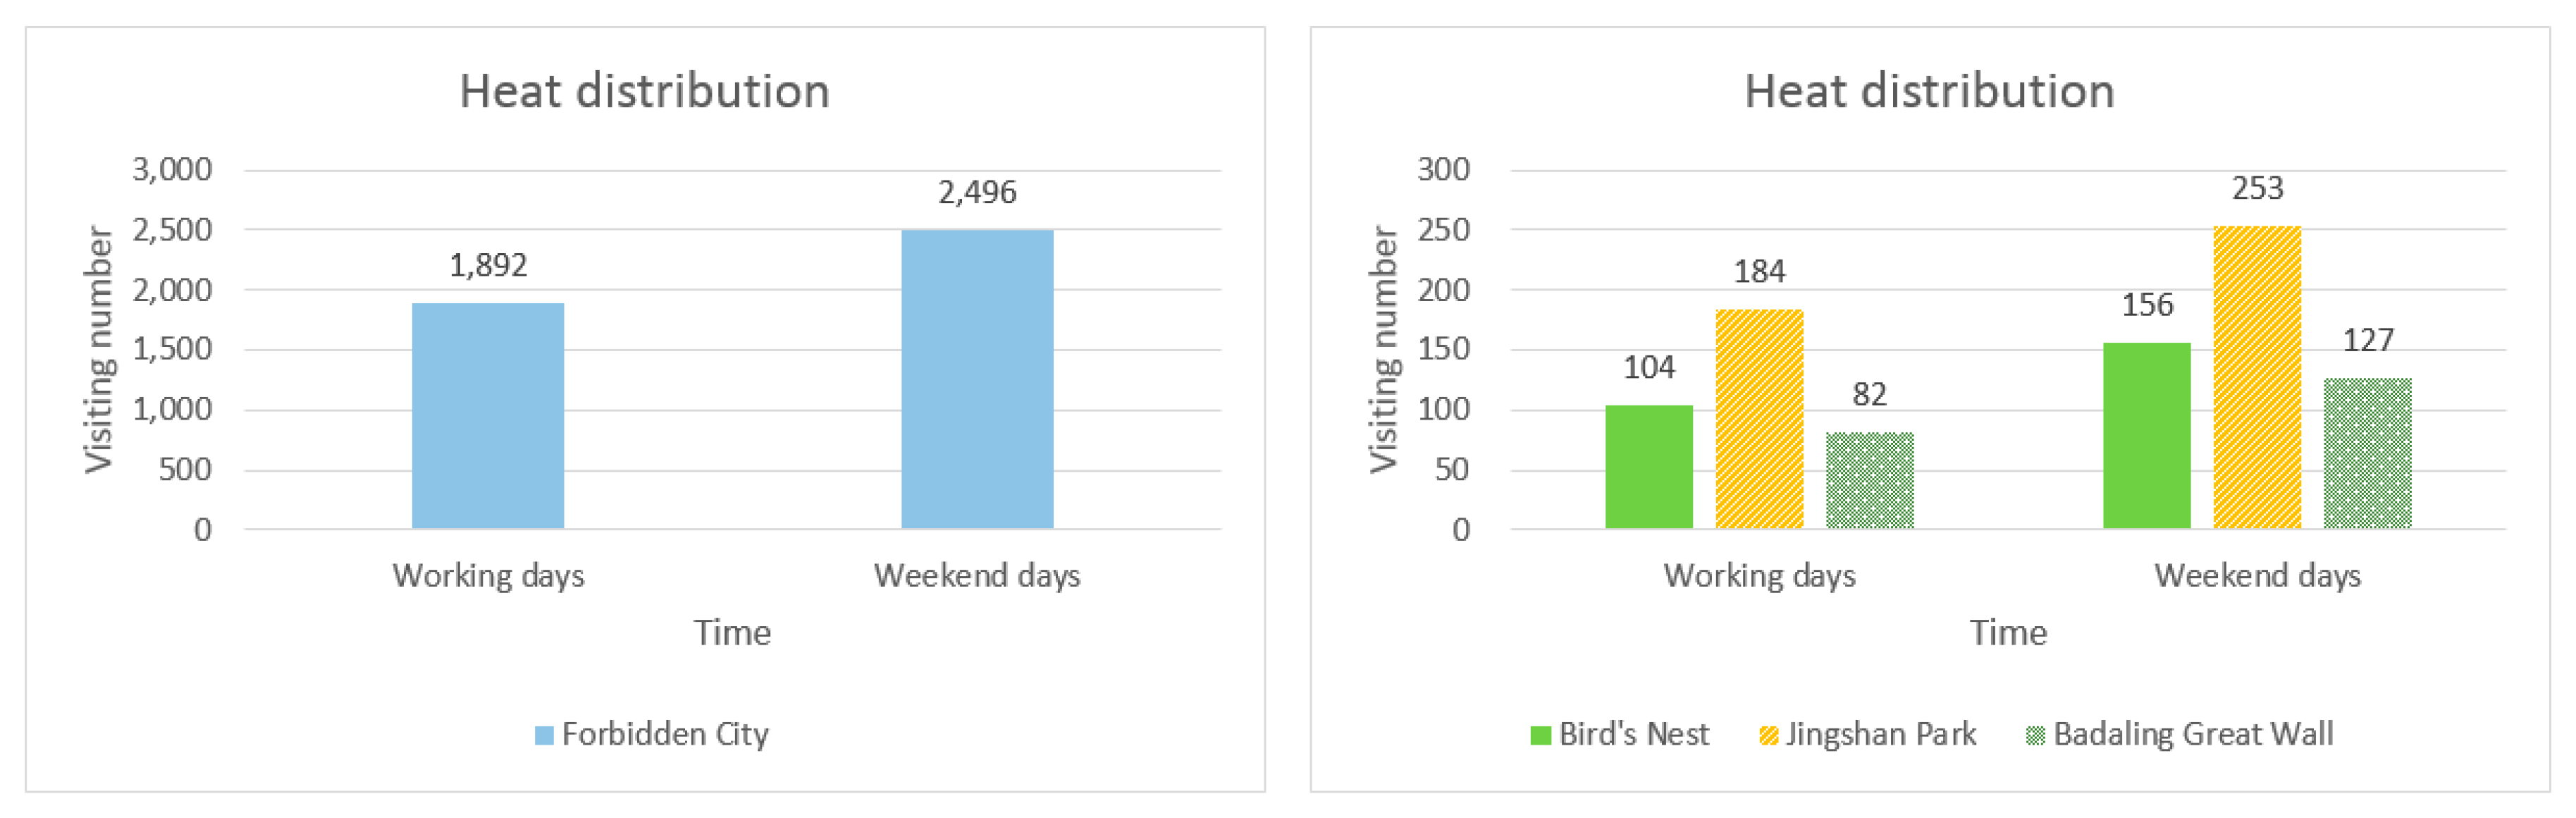
Figure 17 illustrates the heat distribution map of the four attractions divided by working days and weekend days. From the figure, it is observed that in the weekend day, the visiting heat of the four tourist attractions is slightly higher than the working day. The reason why the gap of working days and weekend days is not obvious might be that Flickr users mostly come from the outside of China, and as for foreign passengers, their travelling behaviors are not limited by the working/weekend day.
5.3. Popularity Analysis under Different Weather Contexts
In addition to time, the weather has an important impact on the choice of travel. Observing the people’s visiting behavior to tourist attractions from the weather perspective, some laws of travelling could be found, as well. We perform attraction popularity analysis from the two aspects of temperature ranges and weather conditions.
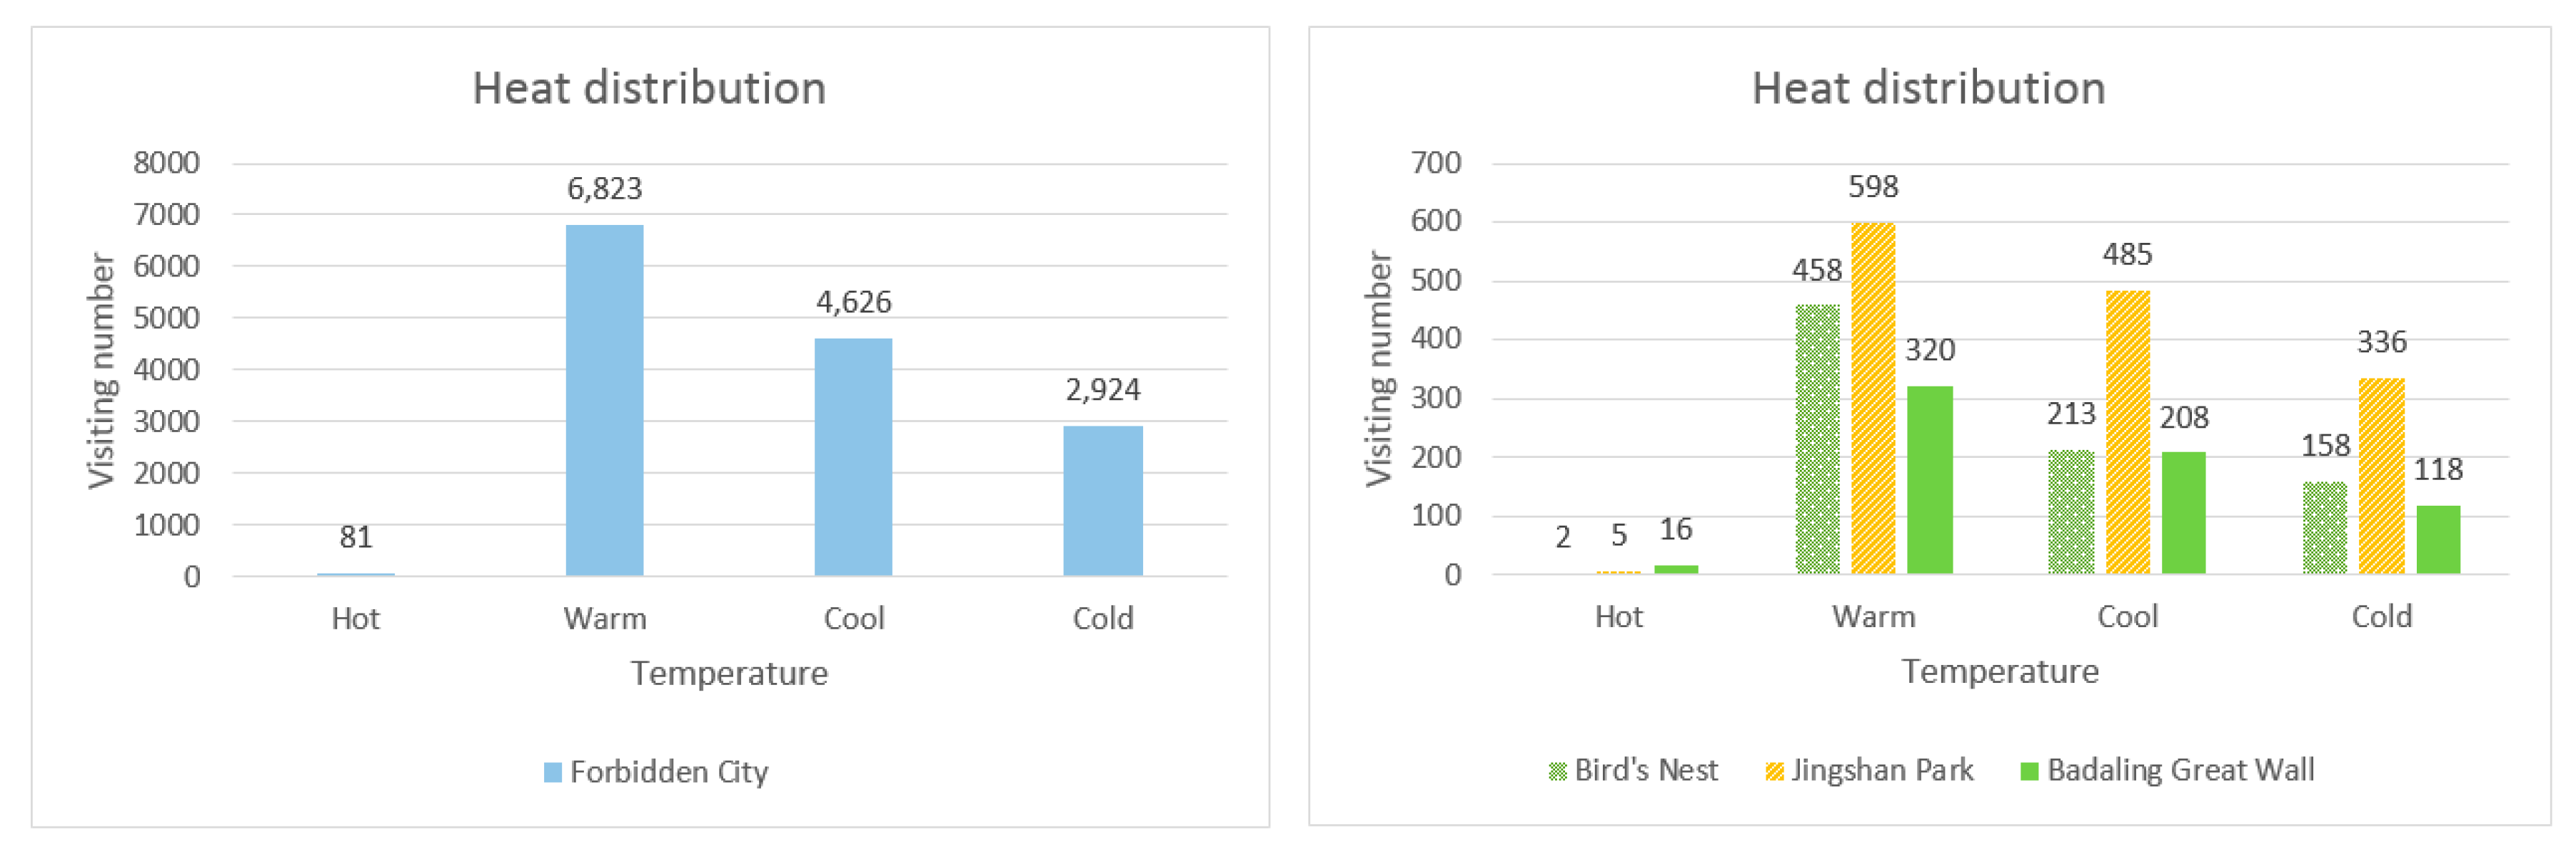
Figure 18 represents the heat distribution map of the four attractions divided by temperature ranges (where hot is above 30 degrees Celsius, warm is between 18 and 30 degrees Celsius, cool is between 5 and 18 degrees Celsius and cold is below 5 degrees Celsius). From the figure, it is observed that visitors usually visit the tourist attractions when the temperature is moderate (such as warm or cool), and people are particularly reluctant to travel under the hot weather context.
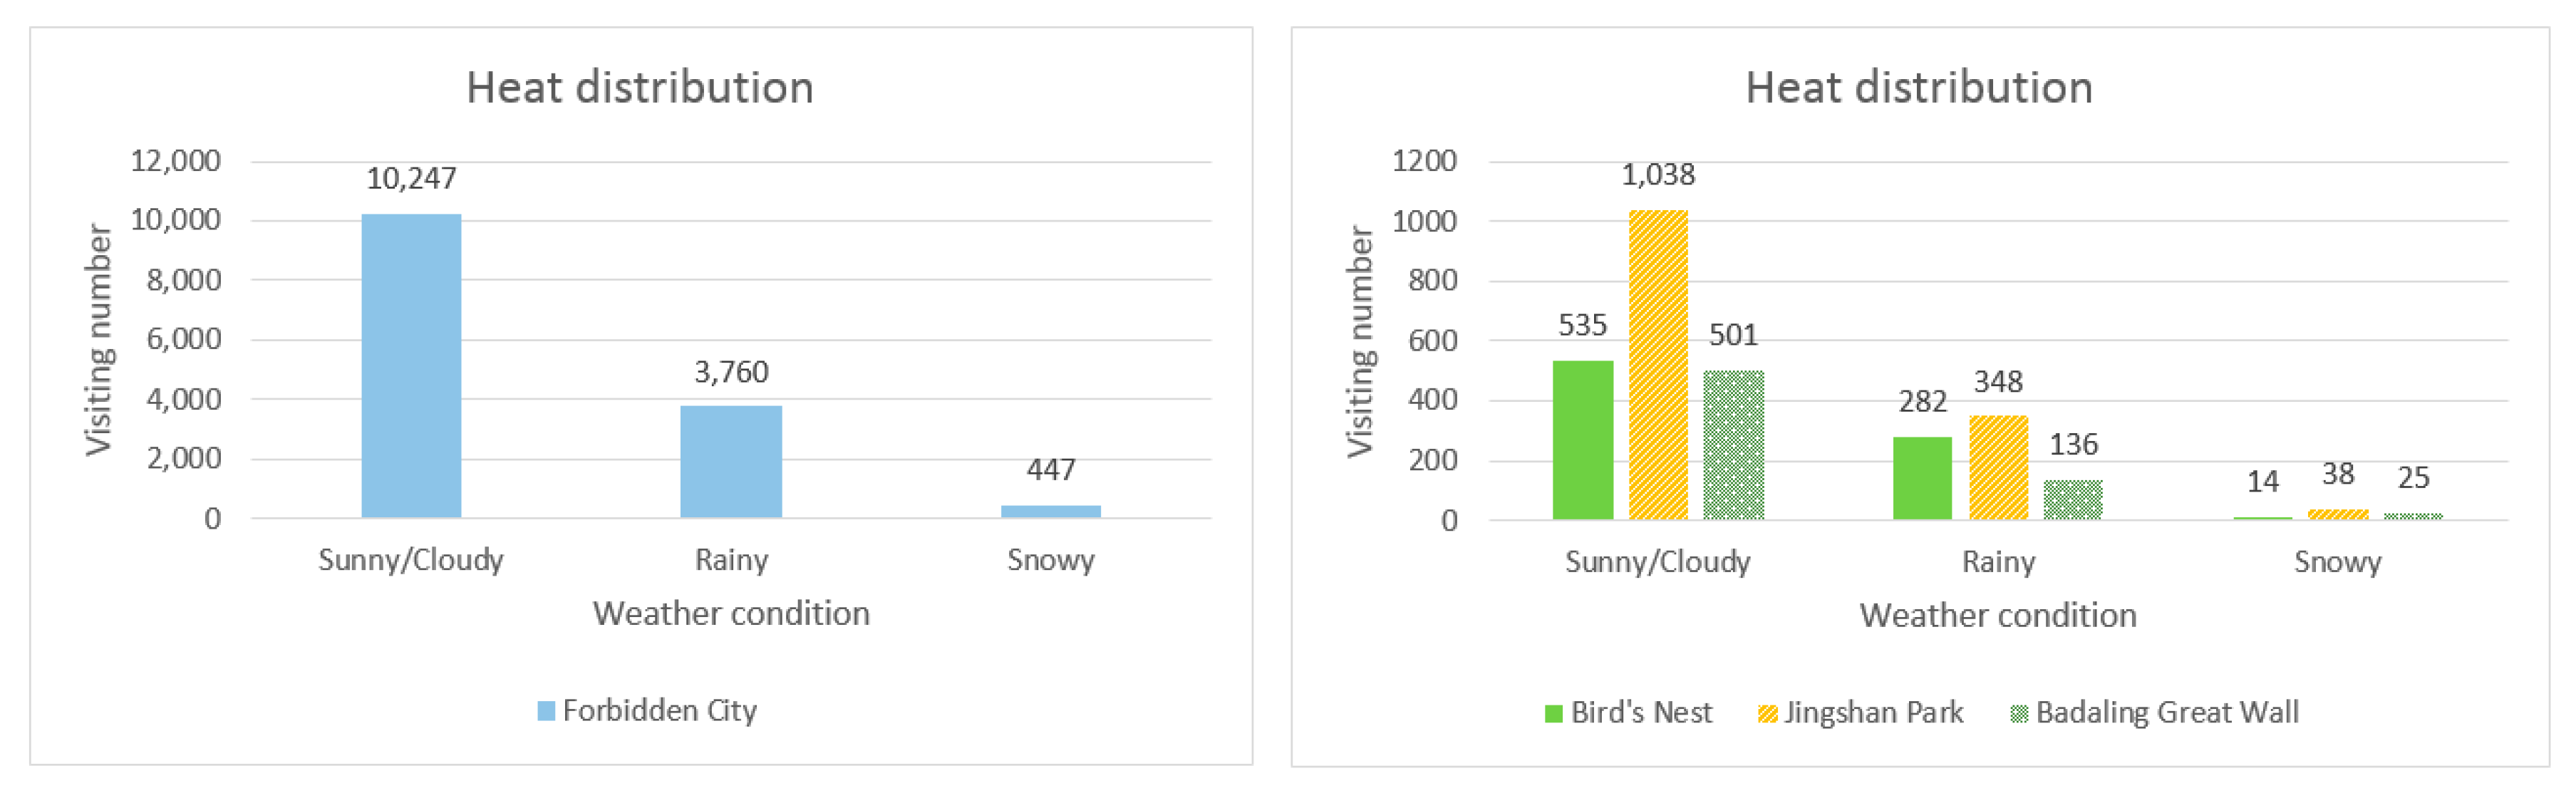
Figure 19 illustrates the heat distribution map of the four attractions divided by weather conditions (i.e., sunny/cloudy days, rainy days and snowy days). From the figure, it is observed that in the sunny/cloudy day, the visiting heat of the four tourist attractions is significantly higher than the rainy/snowy day, and people are particularly reluctant to travel under the snowy weather context.
6. Conclusions
Through spatial clustering of the original user locations, both the ‘natural’ boundaries and the human activity information of the tourist attractions are generated, which facilitate performing popularity analysis of tourist attractions and extracting the travelers’ spatio-temporal patterns or travel laws. In this paper, we propose a new method for discovering popular tourist attractions, which extracts hotspots through integrating spatial clustering and text mining approaches. Attraction discovery experiments are performed based on the Flickr geotagged images within the urban area of Beijing from 2005 to 2016. In addition, based on the finding results of scenic hotspots, this paper analyzes the popularity distribution laws of Beijing’s tourist attractions under different temporal and weather contexts.
Our proposed tourist attraction-discovering approach includes three major stages: spatial clustering, class mergence and label annotation. The innovations of this approach include: (1) We first apply the new clustering method CFSFDP in tourist attraction discovering, and in the process of spatial clustering, the zoning and standardization step is added to make our approach more adaptive to the clustering scenes when the regional density has large difference. Therefore, in the clustering stage, our approach is completely different from the traditional attraction-discovering methods, among which DBSCAN is the most popular clustering algorithm. (2) In addition to the new clustering method, we also use the TF-IDF method to generate the tag vector for each initial cluster and then perform vector similarity calculation to merge adjacent semantically similar clusters, which enables more effective discovering of the tourist attraction that has a large geographical area and an irregular shape. This is the benefit of the class mergence stage, and traditional attraction-discovering methods never used the combination of spatial clustering and class mergence. On the whole, we propose a unique approach for discovering popular tourist attractions, which totally differs from the traditional DBSCAN-based discovery method. The experimental results show that compared with the traditional DBSCAN method, this novel approach is significantly higher in classification accuracy, enables distinguishing adjacent high-density areas and has better adaptability in the case of an uneven density distribution.
Moreover, through observing the behaviors of tourists from the social media geo-tagged big data, many travelling laws can be effectively found, thus providing evidence and support for applications such as tourism planning and intelligent travel recommendations. In the future, on the one hand, we hope to explore the optimization methods of tourist attraction discovering based on the massive geo-tagged dataset; on the other hand, tourism recommendation research based on existing attractions and laws is expected to be performed.


