1. Introduction
The number of accommodation businesses has experienced a significant rise in Extremadura, one of the landlocked regions of Spain, typically characterized by its peripheric, borderland status. In addition, transport infrastructure is based on roadways, whereas other means of transportation are limited and cannot structure the region efficiently [
1,
2]. Extremadura, a region that chose to implement expansive tourist plans—Sometimes incoherent and lacking in planning—Also paid no attention to its limitations. For example, its rich heritage has often been overrated, as it is very difficult to make it a profitable tourist resource by configuring it into a manageable product [
3].
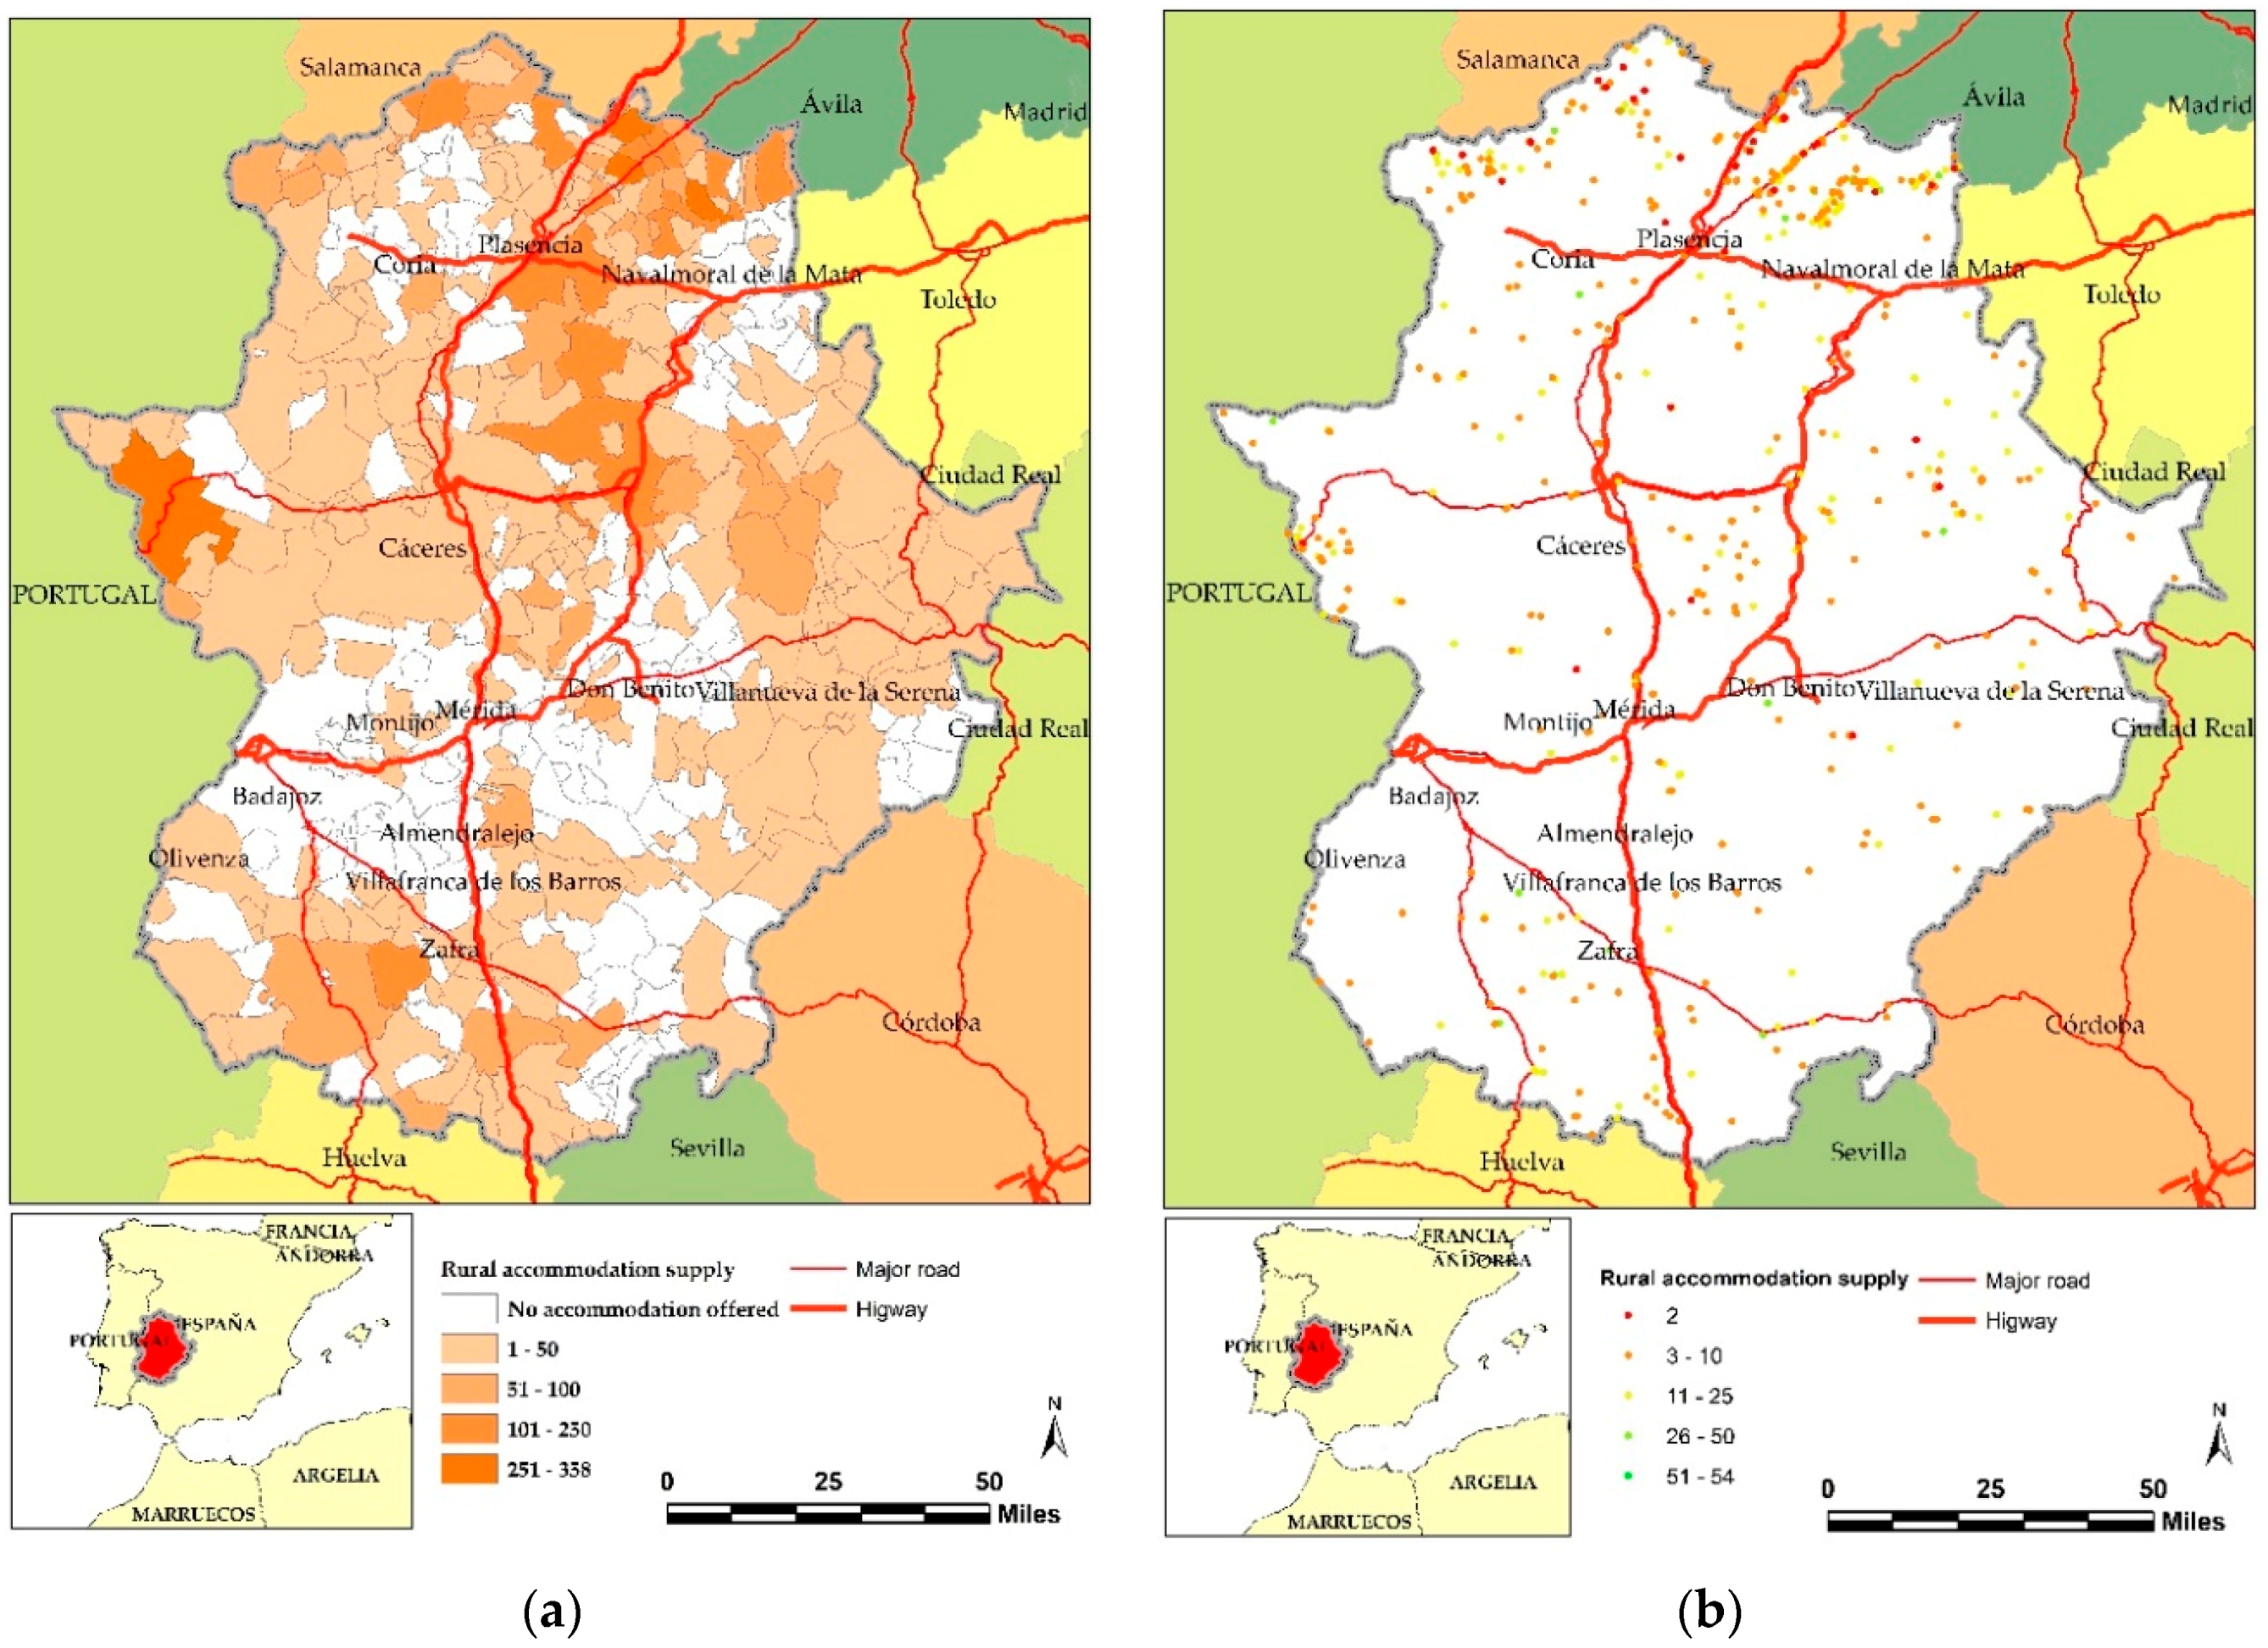
Despite the above, political leaders of the administration strive to point out the development of the tourist industry by highlighting the rise in the region’s lodging capacity. However, they fail to mention that the occupancy rate is very low, especially among rural accommodation businesses. Of course, they also overlook the fact that tourists and visitors have not grown at the same pace as available accommodation, which has resulted in a critical imbalance during the recent economic crisis. Also, it is not uncommon to see general analyses made about the whole region, thus neglecting the diverse situations that different towns may specifically have. Furthermore, there have been no geographical studies where the basic unit is the accommodation business; at best, previous analyses have been based on the municipality as a unit of measurement, which is enough to have a rough idea at the regional level, but obviously necessitates further investigation (
Figure 1a). In this regard, it is worth mentioning that municipalities involve a high degree of variation, since they contain a varying number of accommodation businesses and, consequently, a varying lodging capacity. This is the justification of a territorial analysis that takes into consideration the location of the rural accommodation businesses, as well as their main features—among which the number of available beds (lodging capacity) is a significant parameter (
Figure 1b).
In line with the above, it must be noted that the overall rural accommodation network in Extremadura has been growing steadily in its two basic modalities: rural hotels and rural lodgings, the latter also comprising the specific subdivision of rural apartment hotel/lodging. According to the data from the Survey on the Occupancy of Rural Tourist Lodgings (EOTR in its Spanish initials), published by the National Statistics Institute (INE), there were approximately 104 businesses of this type in 2001, and in total 939 beds available [
4]. However, by 2018, according to the Registry of Tourist Activity of the Extremadura Regional Government, there exist 797 rural accommodation businesses and the lodging capacity amounts 8485 beds [
5].
Rural accommodation occupies 841 direct employees [
4] and indirect employees should also be added to this total. These values are very low if we take into account the numerous attractions of Extremadura and in particular if it is considered that in December 2018 there were 114,000 unemployed workers in the region [
4]. This figure represents an unemployment rate of 23.1% but the situation is made worse by the fact that the rate for men is 18.6% while that for women is as high as 28.8%. For this reason it is necessary to encourage the development of rural tourism by offering tourist products adapted to the area, although in order to do so we must understand the problems faced by accommodation establishments and contrast it with the enormously rich heritage of the area.
Yet, this increase has been more intense in some areas, which makes it necessary to carry out a geographical analysis in order to get an approximate idea of the present situation. Admittedly, there have been interesting studies that have performed territorial analyses on a local level [
6], but have failed to be precise enough to pinpoint each hotel/lodging.
The analysis area spans 4,163,400 ha—1,257,787.05 of which are protected because of their biodiversity, since they comprise ecosystems highly valuable for wildlife, especially in the case of birds. The area includes the Monfragüe National Park, one of the best preserved examples of Mediterranean forest in Europe [
7], as well as several Special Zones for Birdlife Protection (ZEPA) and Special Protection Zones (ZEC). This wealth of wildlife is complemented by a diverse cultural heritage that is epitomized by symbolic tourist destinations like Cáceres, Mérida or Guadalupe—all of them United Nations Educational, Scientific and Cultural Organization (UNESCO) World Heritage Sites—Together with other towns that have been granted Historical Grouping status, such as Trujillo, Plasencia, Badajoz, Zafra, Hervás, and so on.
However, this rich and varied heritage is often hampered by certain limitations, as is the case with communication infrastructures, the loss of population and its aging, not to mention its marginal geographic location on the periphery. In a way, Extremadura seems to have been neglected by the state government for decades as regards the modernization and diversification of communications. As a result, its progress was slowed.
In light of this, the development of the tourist industry represented a significant achievement, and it was publicized as such by the regional administration—their political discourse focusing on the enlargement of the lodging capacity, as recorded in the official publications that have been favored as planning tools for the industry. The latest Extremadura Tourist Plan that is still in force [
8], provides a general overview of the whole of the region, and is mostly quantitative; e.g., it highlights the growing trend of the lodging capacity. This is not in line with some studies that throw in relief the poor management of the data on the whole, especially when territorial heterogeneity is not factored in. Thus, even at the local level, important discrepancies in the lodging capacity are to be found [
1].
The latter research trend is also present in other distant and diverse areas, where the analysis of the tourist offer, while focusing on the available accommodation, has been carried out scrupulously. This has corroborated how important the concept of distribution is—not only over time, but also across a territory. This research trend has been replicated on different geographical scales, whether they refer to specific areas of the planet [
9,
10] or specific countries [
11,
12]. At the same time, similar studies have also narrowed their scope to investigate individual segments of the industry, such as birdwatching tourism [
13] or, in broader terms, ecotourism [
14].
In the Spanish context, the analysis of the distribution of the accommodation offer is gaining ground among tourist analyses, as can be seen in the relevant literature from different periods—Whether they focus on large areas, generally speaking on a national level [
15,
16,
17,
18] or on smaller areas [
6,
19,
20,
21] like regions and other administrative divisions.
Despite the growing number of publications to do with the distribution of the accommodation offer, more often than not these studies are circumscribed to the temporal distribution of said accommodation or to a spatial analysis that only considers territorial areas above the local level (NUTS-1 to NUTS-3) for their statistical analysis. Nevertheless, there are also notable exceptions where the focus is placed on the municipality as the axis on which the analysis pivots—the analysis of the accommodation offer and the whole of the tourist system [
3,
22,
23].
From a technical outlook, different types of analysis have been carried out in order to account for the distribution of the lodging capacity. Among these, some studies stand out because of their attempt to synthesize comparatively a particular methodology that is based on theoretical, empirical and operational models [
24]. Other instances of related research choose to use genetic algorithms to account for the present distribution and subsequent inferential analyses [
25]. Others have made use of spatial statistics such as geographically weighted regression (GWR) to account for the distribution [
26,
27] or some particular features, such as the price [
28,
29].
This brief literature overview shows how diverse the quantification techniques are, although it also points to a notable overlap in the use of a specific tool, the geographical information system (GIS), as a basic instrument to map and analyze the distribution of the accommodation offer.
Recent research tends to favor quantitative analyses, where it is not uncommon to find cluster analysis as a means to complement a factor analysis [
22] so as to define homogeneous tourist areas. In addition, it is also utilized as a fundamental technique when it comes to ascertaining its impact on local development when it depends on sustainable tourism [
30] or when multiple choice models are used in order to arrive at the tourist potential of a given destination [
31].
Despite the diversity in topics and techniques, there exist few studies that make use of grouping techniques to analyze the distribution of the accommodation offer [
2] or the degree of tourist development of an area [
32]; although its use is quite common when the focus is placed on other aspects of tourism, such as economic and environmental efficiency [
33] or the effects of the collaborative economy on urban tourism [
34]. In all, although the role of the geographical territory in the distribution of the accommodation is universally acknowledged—While at the same time the use of a spatial tool such as GIS is common practice—It comes as a surprise that the most popular geostatistical tools have been overlooked for the most part. This is especially the case with those that are implemented in the most widespread GIS software, ArcGIS.
On this basis, and given the lack of studies analyzing the distribution patterns of the accommodation offer in areas, like Extremadura, where the tourist industry has bloomed in recent times, the authors believe that it is necessary to ascertain whether those patterns actually emerge. In this regard, the basic reference unit has to be the location of the accommodation business so as to determine whether they—and their derived lodging capacity—Cluster around certain areas.
The main innovation in this study is the application of spatial grouping techniques, not only to find out patterns at a level of disintegration not previously tackled in the analysis of tourist spaces but also to apply this knowledge in the planning and diversification of the rural accommodation available in Extremadura. For this reason the study proposes the use of two techniques with the aim of discovering spatial clusters and detecting anomalies. These are hot spot analysis and cluster and outlier analysis. The main objective of both techniques is the detection of territorial patterns of the distribution of a variable although their conceptions differ. The former seeks to locate accommodation clusters which have in common their capacity of lodging either a large or small number of people. This has been one of the most frequently used techniques for determining distribution patterns [
35]. The latter enjoys widespread acceptance in the literature on spatial analysis [
36,
37,
38] and will serve as a complement to indicate the places where rural lodging or hotels appear with a very different capacity to that of the surrounding area.
This type of mapping cluster techniques has been selected because it gives specific results for each of the accommodation establishments analysed.
The use of both techniques will give rise to different results as the conception of their formulation also varies. This will serve to determine which of the two is more useful for detecting clusters based on the accommodation capacity in rural areas, owing to which we decided to use the same criteria for distance and its configuration. The conception of the criteria for considering the neighbourhood takes up part of this research as there are multiple forms of using it.
Our main hypothesis here is that there is a conspicuous distribution of the offer among rural tourist accommodation, where some areas are favored over others. Still, it is also true that the accommodation businesses in some of these areas do not have a uniform distribution, unlike in the case of their lodging capacity. This is why, if possible, specific grouping patterns must be mapped; i.e., groups of businesses with a similar lodging capacity. If this hypothesis is proven true, the regional government would be able to devise tourist policies that would lead to an improvement in the management of the destinations involved and the services they provide, since the well-defined groupings would constitute mini-clusters with their own particular features and specific needs. This working hypothesis is grounded on the basic goal to establish rural accommodation areas with specific characteristics, which necessitates analytical methods that can synthesize statistical techniques and the geographical element. Therefore, two types of geostatistical techniques are used in this study: one of them focusing on establishing similarity patterns and the other on finding similarity patterns and anomalous values; namely, hot spot (Gi* de Getis-Ord) analysis and cluster and outlier (Anselin local Moran’s I) analysis, respectively. These two techniques will not only enable us to fulfil our research objective, but also to find potential discrepancies, thus corroborating our initial hypothesis as a result.
2. Materials and Methods
The materials that have served as the basis of the present study stem from two different official sources.
On the one hand, the cartography was retrieved from the official web portal of the National Geographical Institute [
39], where these resources are freely available to researchers, in particular the National Topographic Database. The National Topographic Database for Extremadura at a 1:100,000 scale (BTN100) [
40] has been downloaded and codified.
This cartography comprises a set of referenced geographical data that can be implemented on a GIS, thus allowing a general overview of several natural and human factors in the area. This is a continuous geographical database with a resolution of 20 m where the information is stored in geographical coordinates. It uses the European Terrestrial Reference System 1989 (ETRS89) as a geodetic reference system, which is also the official geodetic system in Spain for cartographic purposes both for the Iberian Peninsula and the Balearic Islands [
41]. It brings together geographical information from different official sources and its structure is based on the geographical object classes that can be represented at the aforementioned scale. It employs simple geometry (points, lines, and areas) and it does not have explicit topology labels—although it does map precise spatial relationships between different geographical objects so that the topology can be directly derived. Data is classified into seven themes—Each comprising different geographical object classes and, in turn, each class stored in a different table [
42].
On the other hand, the alphanumeric database of the accommodation offer in Extremadura was retrieved from the Extremadura Turismo official website, which is run by the regional government (last updated on 31 December 2018) [
5]. The basic information was retrieved from this site, later to georeference each of the existing businesses that are officially recognized by the administration as specific entities.
Given the wide range of accommodation offer, it was later simplified according to the typology of each business. Thus, businesses were classified as providing hotel, extra-hotel, and rural accommodation—The latter being the relevant category for this study. Both databases enabled the authors to design and develop a GIS application through ArcGIS v. 10.5. This brings together geographical and tourist information (
Table 1).
This GIS application allows for different techniques to be implemented in order to determine the groupings that can be found in the area under analysis. The use of these techniques has been widely documented in the relevant literature from the 1980s to the present day, often in studies that concentrate on finding synthetic [
43,
44,
45,
46,
47,
48] and local [
49,
50] indicators, as well as in comparative studies considering those geostatistical indicators [
51,
52].
There are also some relevant bibliographical references for the geographical context in this study [
6,
27,
53], although they are circumscribed to the capital of different muninicipalities. This implies a higher aggregation level than in the present study, as their functionality is based on the use of a larger unit that comprises all the existing accommodation businesses within it.
According to the relevant literature, there are several specific techniques that would reveal groupings by using a spatial autocorrelation regression at the local level. The hotspot analysis (based on Gi* de Getis-Ord) and the cluster and outlier analysis (based on Anselin local Moran’s I) have been chosen to analyze the accommodation distribution patterns. These geostatistical techniques are complementary, although they are fundamentally different in their outlook, as established in previous research [
51,
52].
The hotspot analysis seeks to identify groupings within an area. These groupings may either represent high or low values of a given variable, which correspond to hot and cold spots, respectively. In order to identify these spots, a hot spot analysis (Getis-Ord Gi*) has been carried out, which can be implemented through the Mapping Clusters tool—available in the Spatial Statistics Tools suite of ArcGIS. This method is defined according to the following mathematical formula [
54]:
where
is the attribute value for feature
j;
is the spatial weight between feature
i and
j;
n is equal to the total number of features and:
Theorem 1. Mathematical expresion used by ArcGIS to calculate the hot spot analysis.
Its use in ArcGIS, as in the case of spatial relationships, has been widely documented in the literature [
55,
56,
57]. It consists in finding each entity within its surrounding area, and therefore the neighbourhood is one of the key elements to establish the groupings. In terms of the interpretation of the results, it is worth noting that whenever a spot reaches a high value it automatically becomes relevant from the point of view of the tourist offer, although it may not be a statistically significant hotspot; i.e., if it is isolated. Such a case makes it difficult to generate mini-cluster structures that would allow for holistic products or policies to be implemented. In order for a spot to be considered a statistically significant hotspot, it must have a high value and be surrounded by others that also have a high value. The local aggregate for an entity and its surroundings is compared to the proportional aggregate for all the entities. When the local aggregate deviates significantly from what is expected, and the deviation is too large to be due to a random occurrence, it is obtained, as a result, a statistically significant
z score [
58].
The cluster and outlier analysis, by contrast, identifies groupings or anomalous values according to the criterion of proximity. This analysis identifies five types of geographical class. On the one hand, this technique identifies spots that have either high or low values in concordance with their surroundings. On the other, the analysis identifies anomalous areas where a spot has a value that is very different from the neighbours, whether much higher or lower. There are also cases where no associations can be made.
The mathematical formula for this analysis, as used by ArcGIS [
59], is as follows:
where
is an attribute for feature
i,
is the mean of the corresponding attribute,
is the spatial weight between feature
i and
j, and:
With n equating to the total number of features.
Theorem 2. Mathematical expression used by ArcGIS to calculate the cluster and outlier analysis.
Whereas the application and the theoretical framework of the techniques used is unproblematic, the same is not true for conceptualizing the spatial relationships or selecting a distance method. There are several options when using punctual geometry [
60,
61,
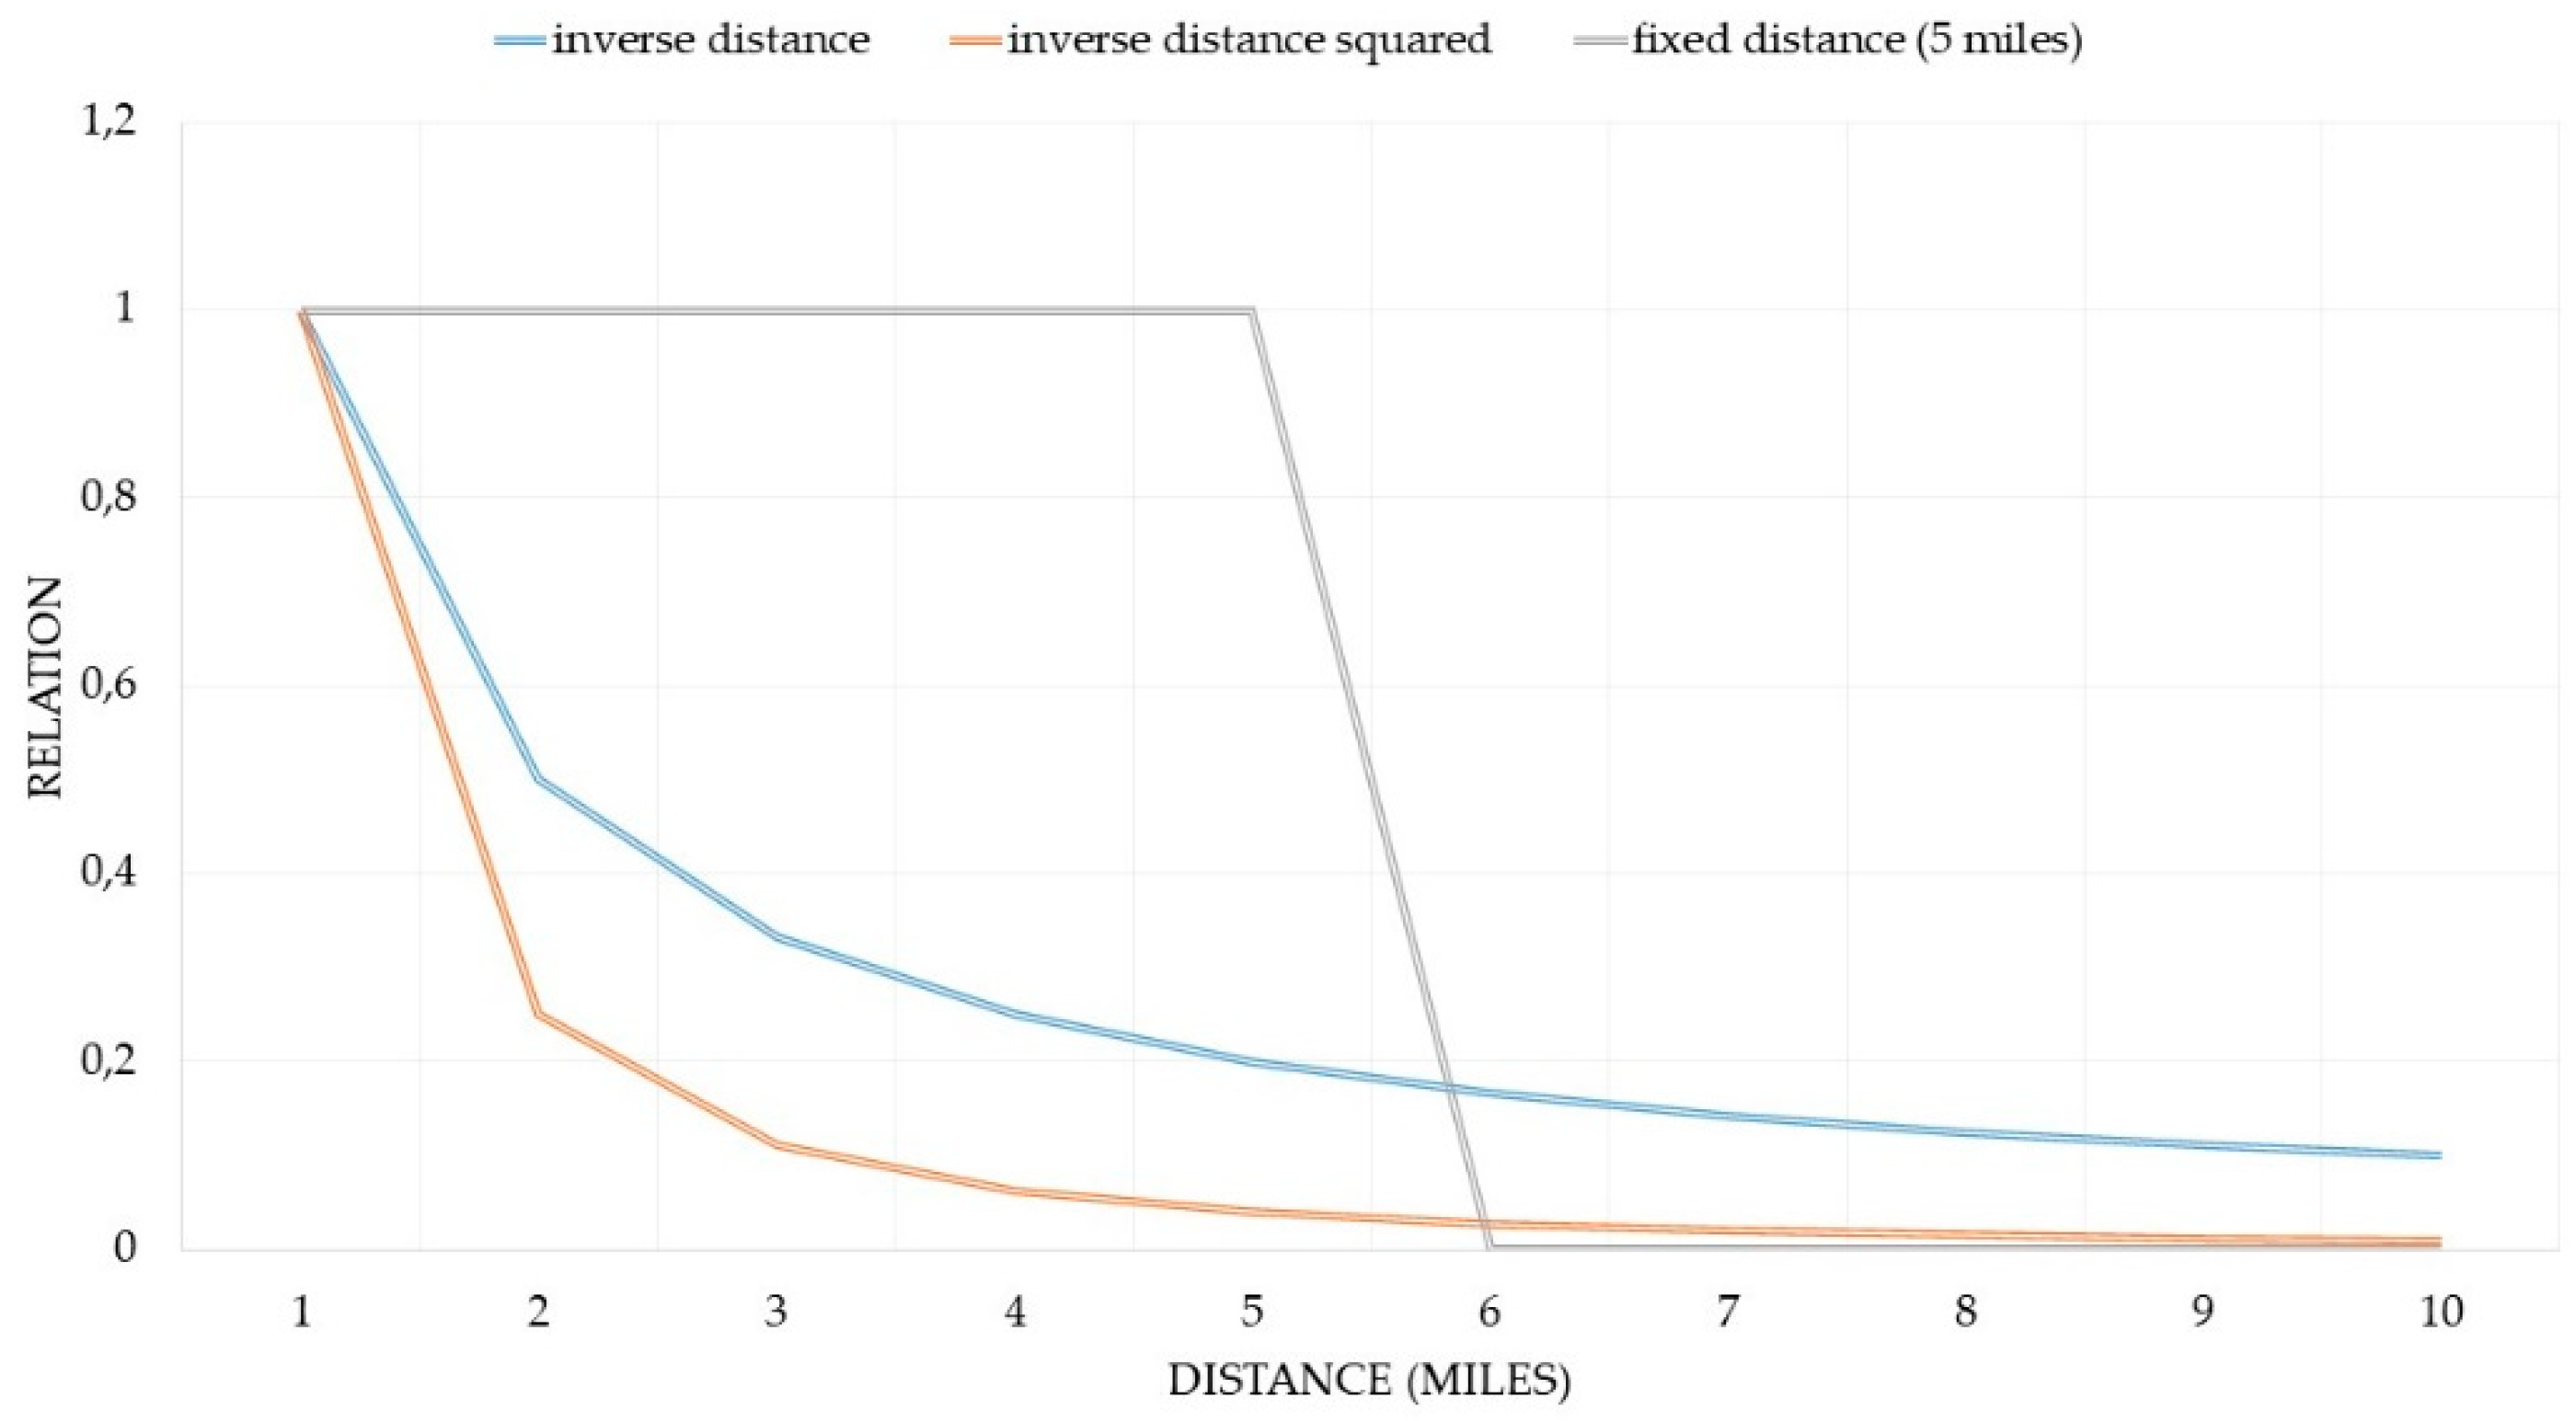
62]. Under these circumstances, the three most plausible spatial relationships are the following:
- -
inverse distance, which is based on the premise that the farther away an element is, the smaller the impact it has;
- -
inverse distance squared, that only differs from the previous one in that the slope is sharper, so neighbour influences drop off more quickly;
- -
fixed distance band, whereby the neighbouring features within a set distance of influence are weighted equally (1 in this case), whereas features outside the specified distance do not influence calculations (their weight is zero).
Among the three methods outlined above, the last is the most commonly used in the literature [
46,
59]—Even though it assumes that there is a similar relationship among all the spots within a set distance band, once beyond said distance, the relationship disappears altogether. In other words, there is no transition area, which may seem logical. By contrast, the use of the inverse distance and inverse distance squared methods does show clear transition areas (
Figure 2). Due to the differences between the first two methods and the third, it seems logical to use any of the inverse distance methods to determine the criterion of proximity, instead of using a fixed ‘bandwidth’.
As can be observed, the criterion for considering distance reflects various possibilities. A fixed distance implies the total disappearance of the neighbourhood effect as from 6 miles. In the case of inverse distance there is a sharp drop from 2 miles which is particularly noticeable in the case of inverse distance squared. Albeit in a much reduced manner, in these last two conceptions of distance the neighbourhood effect persists even at a distance of more than 10 miles.
Given the uncertainty as to the convenience of each method, both types will be tested in order to establish which one is best suited for the study area.
By contrast, the calculation methods for the distances between neighbours has been widely discussed in the literature [
63,
64]:
- -
Euclidean distance, which uses the straight-line distance between points A and B; i.e., the shortest possible distance.
- -
Manhattan distance, when the distance between two points is measured along the x and y axes; i.e., it is the distance you must travel if you are restricted to north–south and east–west travel only.
If using a criterion for distance is not without its problems, much the same happens when it comes to choosing a calculation method for that distance, because in both cases the distances are estimates, not real, as the software does not allow for that possibility. Despite this, there is a noticeable trend in the literature to favor the use of the Euclidean distance instead of the Manhattan distance, and the implications this entails. If one chooses the shortest (Euclidean) distance, the margin of error in mountainous areas will be larger—The straight-line distance is considerably shorter than the road distance. However, if one opts for the Manhattan distance, errors will be larger in flat areas, given their typical road layout.
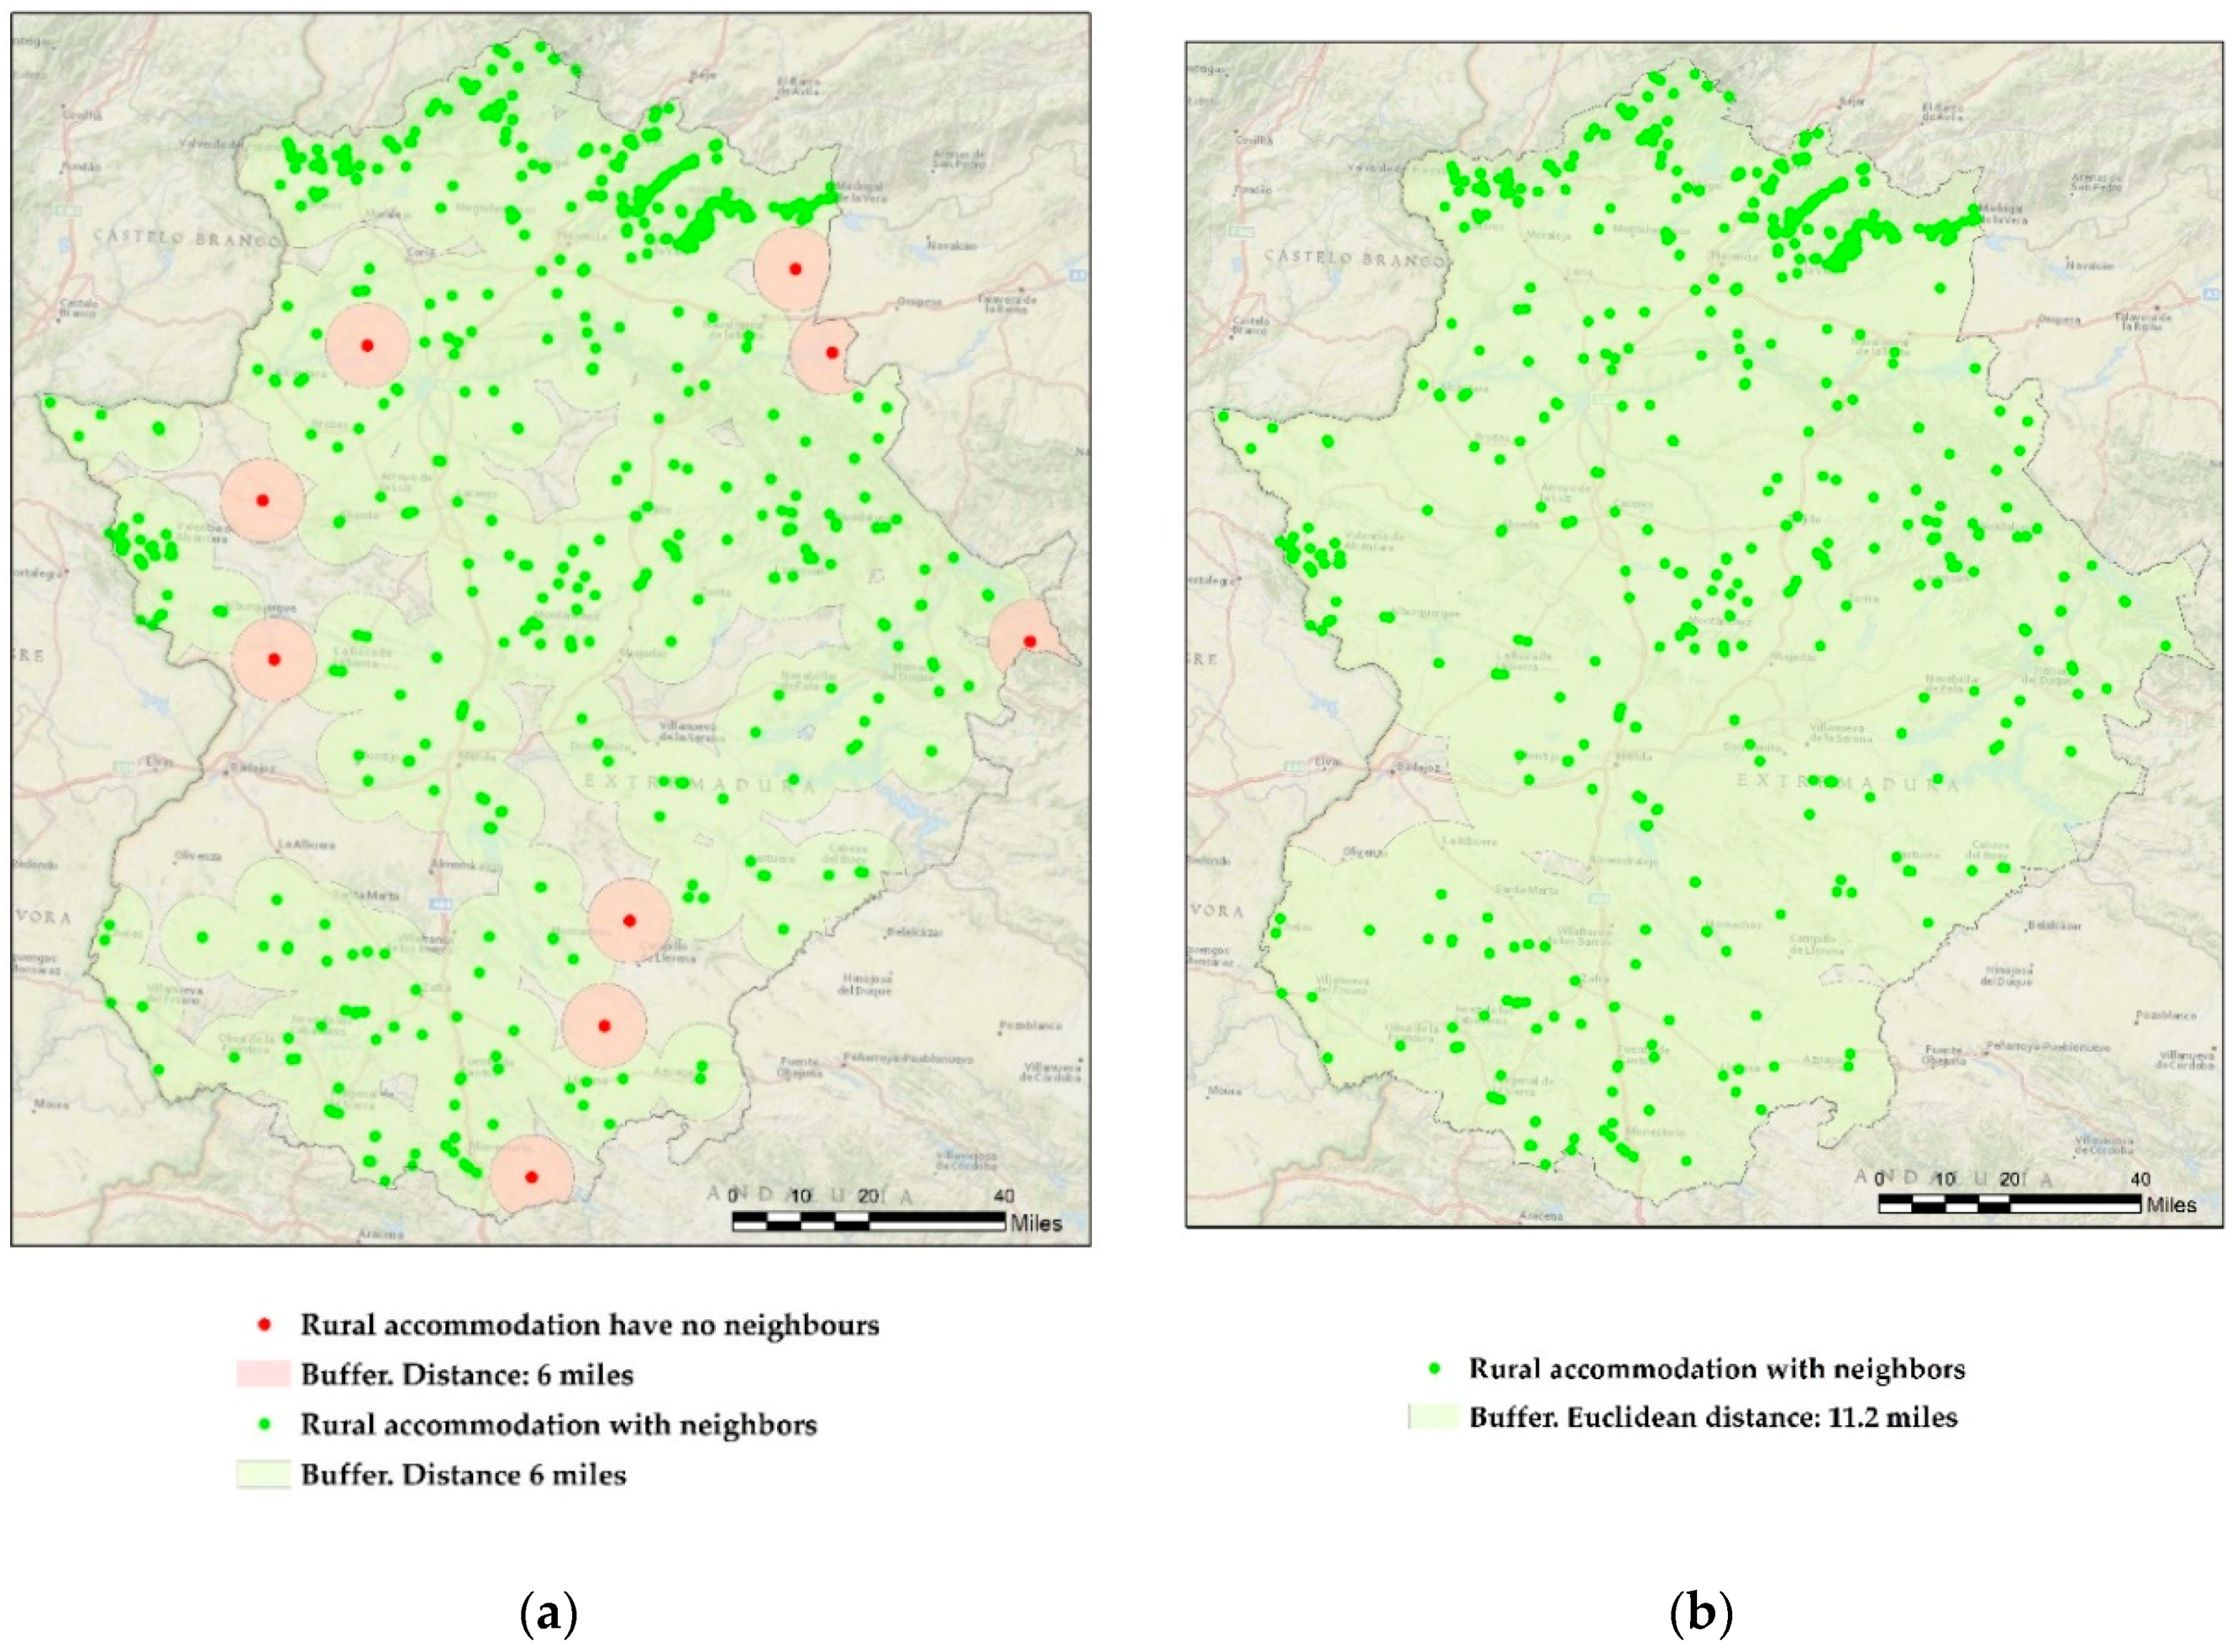
In addition to choosing the most convenient method, it is also necessary to establish the range that will be used as a boundary distance for these techniques. In view of the innumerable options available for this parameter, three critical distances have been used: the first one is a Euclidean distance of 11.2 miles, which ensures that all accommodation businesses have at least one neighbour; a Manhattan distance of 14.3 miles, which also ensures a neighbour and, finally, after several trial tests, a Euclidean distance of 6 miles (
Figure 3a). This distance is noticeably shorter and there are only 9 rural accommodation businesses that do not have a neighbour within it. Obviously, if a longer distance is chosen, all of them will have at least a neighbour (
Figure 3b).
The reason why the distance of 6 miles has been selected as a limit is because if we use bandwidth only 9 of the 797 rural accommodation establishments in the study area lack neighbours, which amounts to only 1.1% of the sample. Meanwhile, achieving the condition that all lodgings have a neighbour using the 11.2-mile criterion implies the increasing of the neighbourhood relationship in an artificial manner. It should, therefore, be emphasized that from 6 miles to 11.19 miles only 9 lodgings are omitted. For this reason the options used have been these two distances (6 and 11.2 miles), which mean the difference between including all the cases of the sample or omitting 9. To add to all this, as distance is increased the calculations consider a higher number of lodgings and the clusters are thus qualified by this parameter.
On the basis of what has been described thus far, the following options have been selected for the calculations. The suitability of each one for the actual characteristics of our object-study will be dealt with in the Discussion (
Table 2).
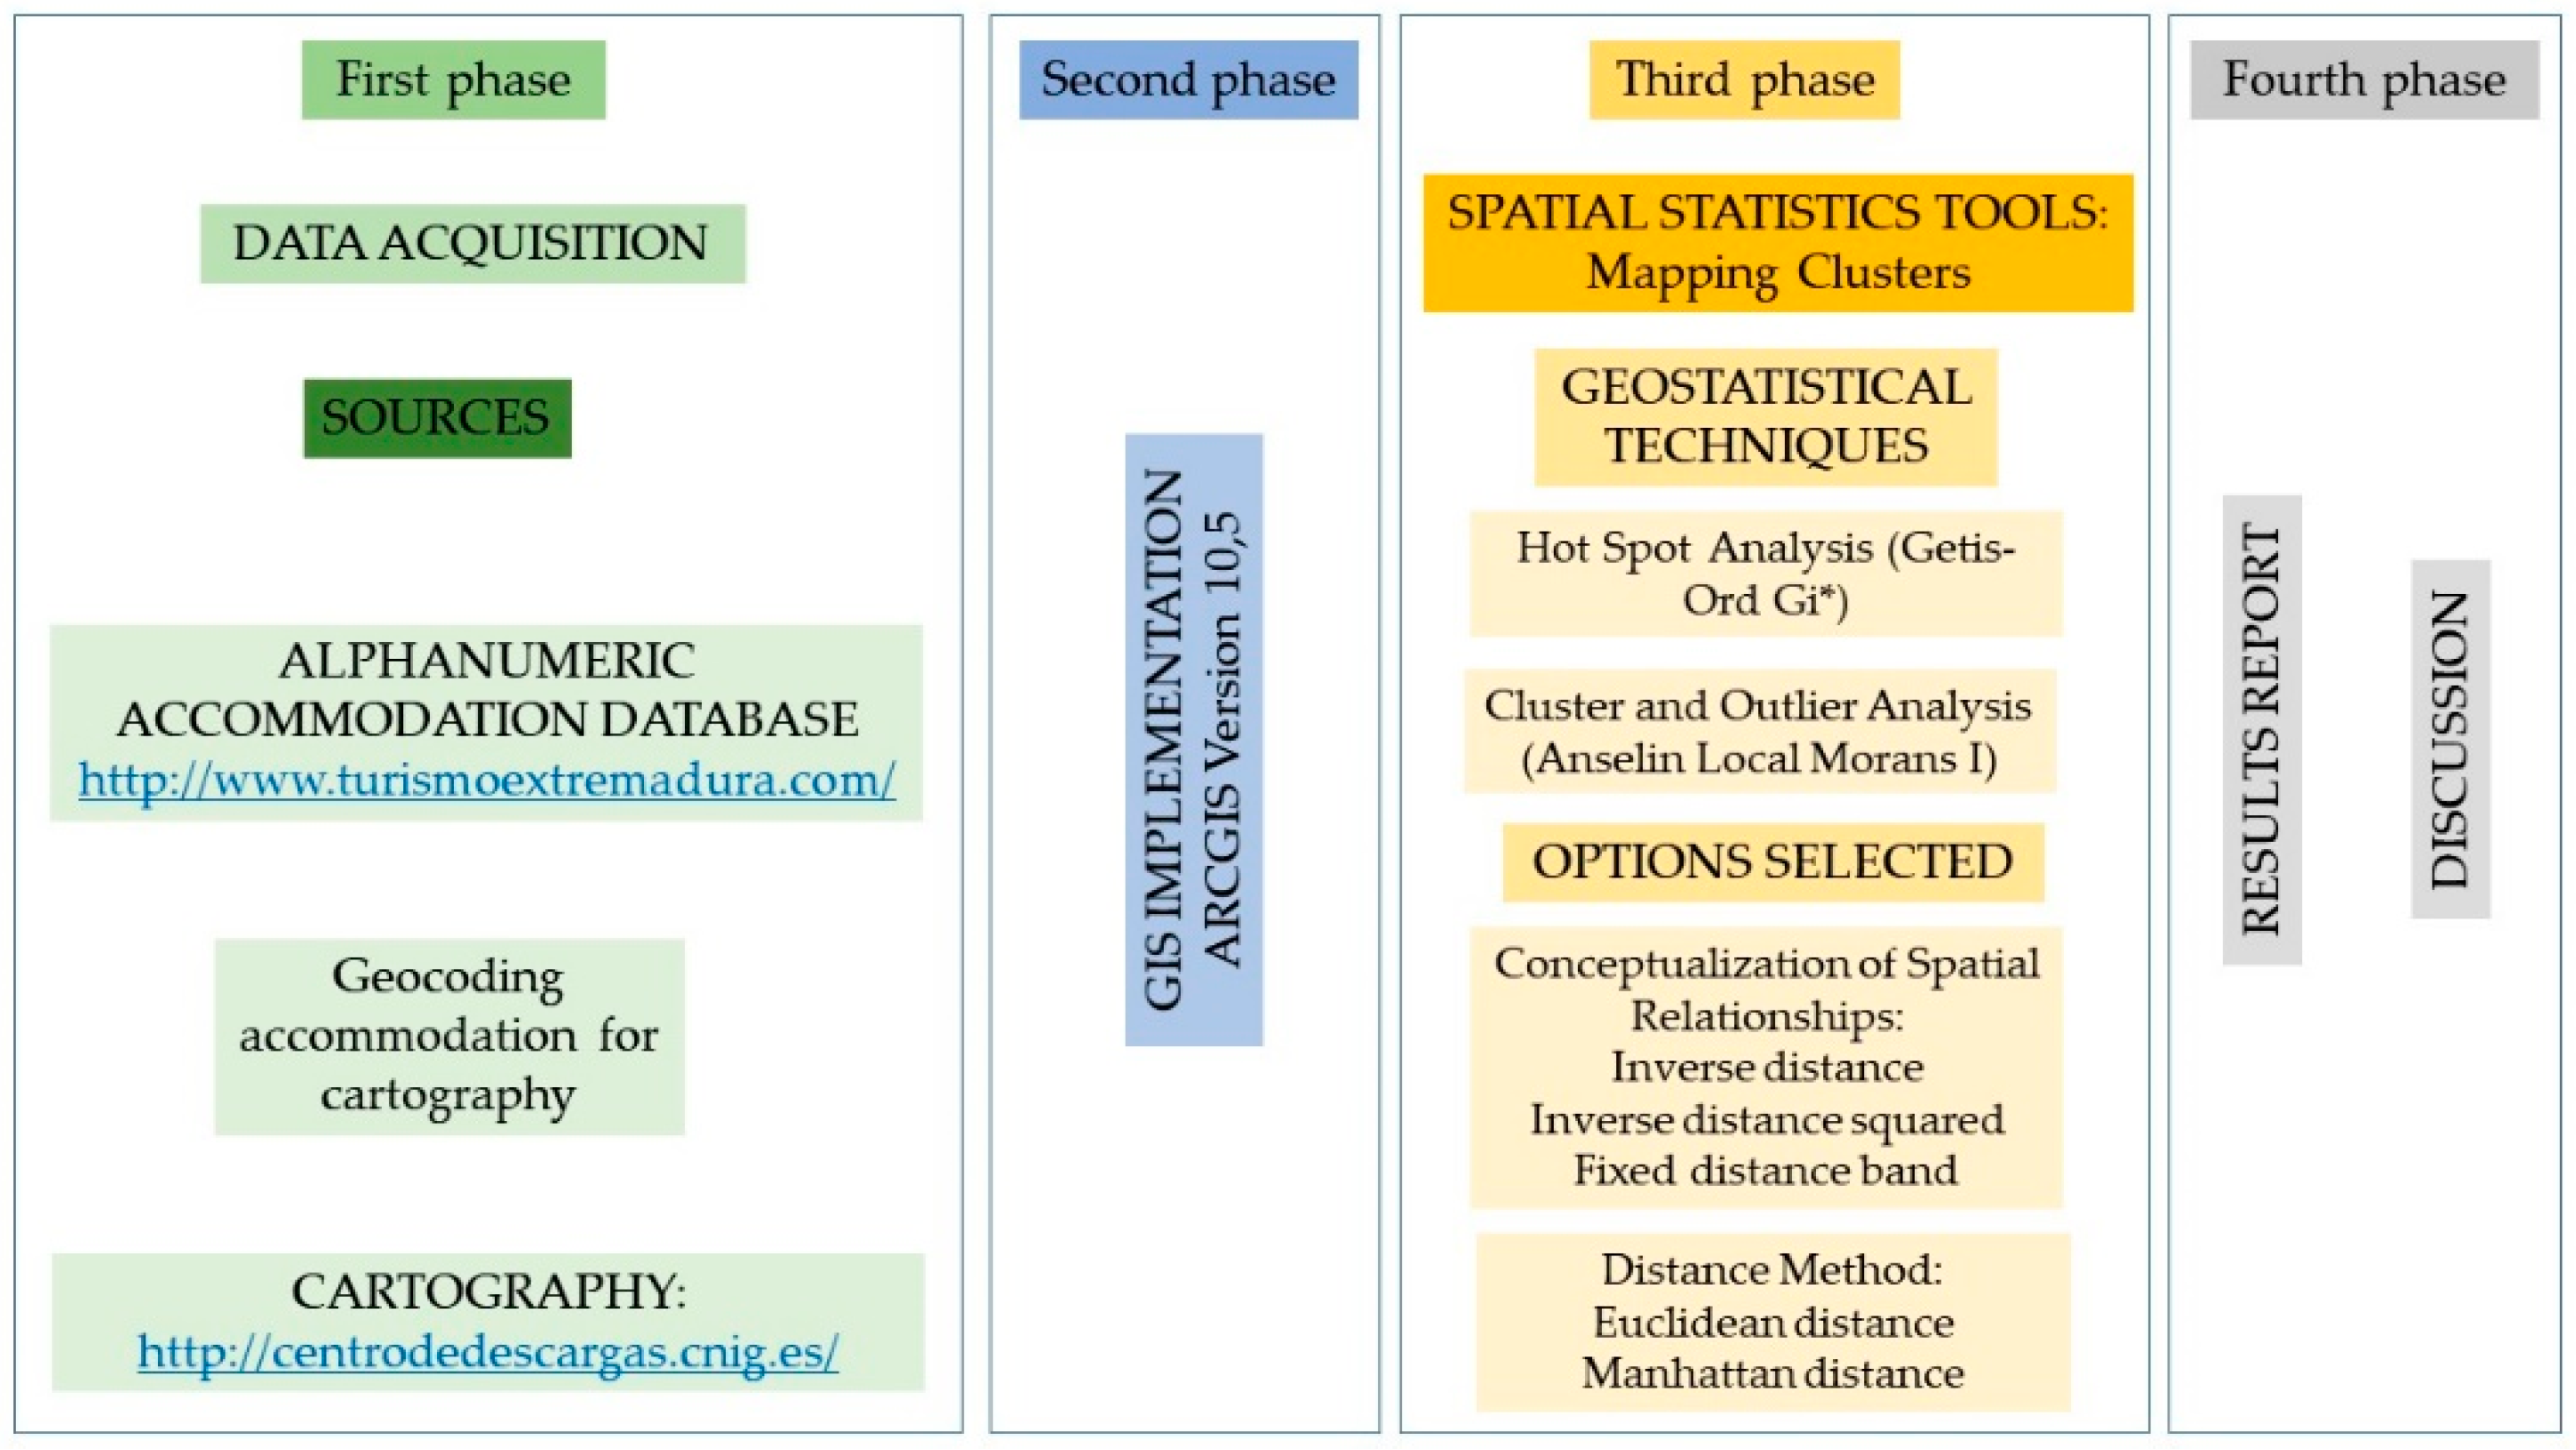
In short, the method here begins with the compilation of data, its implementation in a GIS, and the application of the two techniques described above. The results and discussion thereof will be derived from them (
Figure 4).
3. Results
3.1. Hot Spot Analysis
The results of the hot spot analysis, which considers the number of vacancies available at rural accommodation businesses as a variable, show some groupings in the study area.
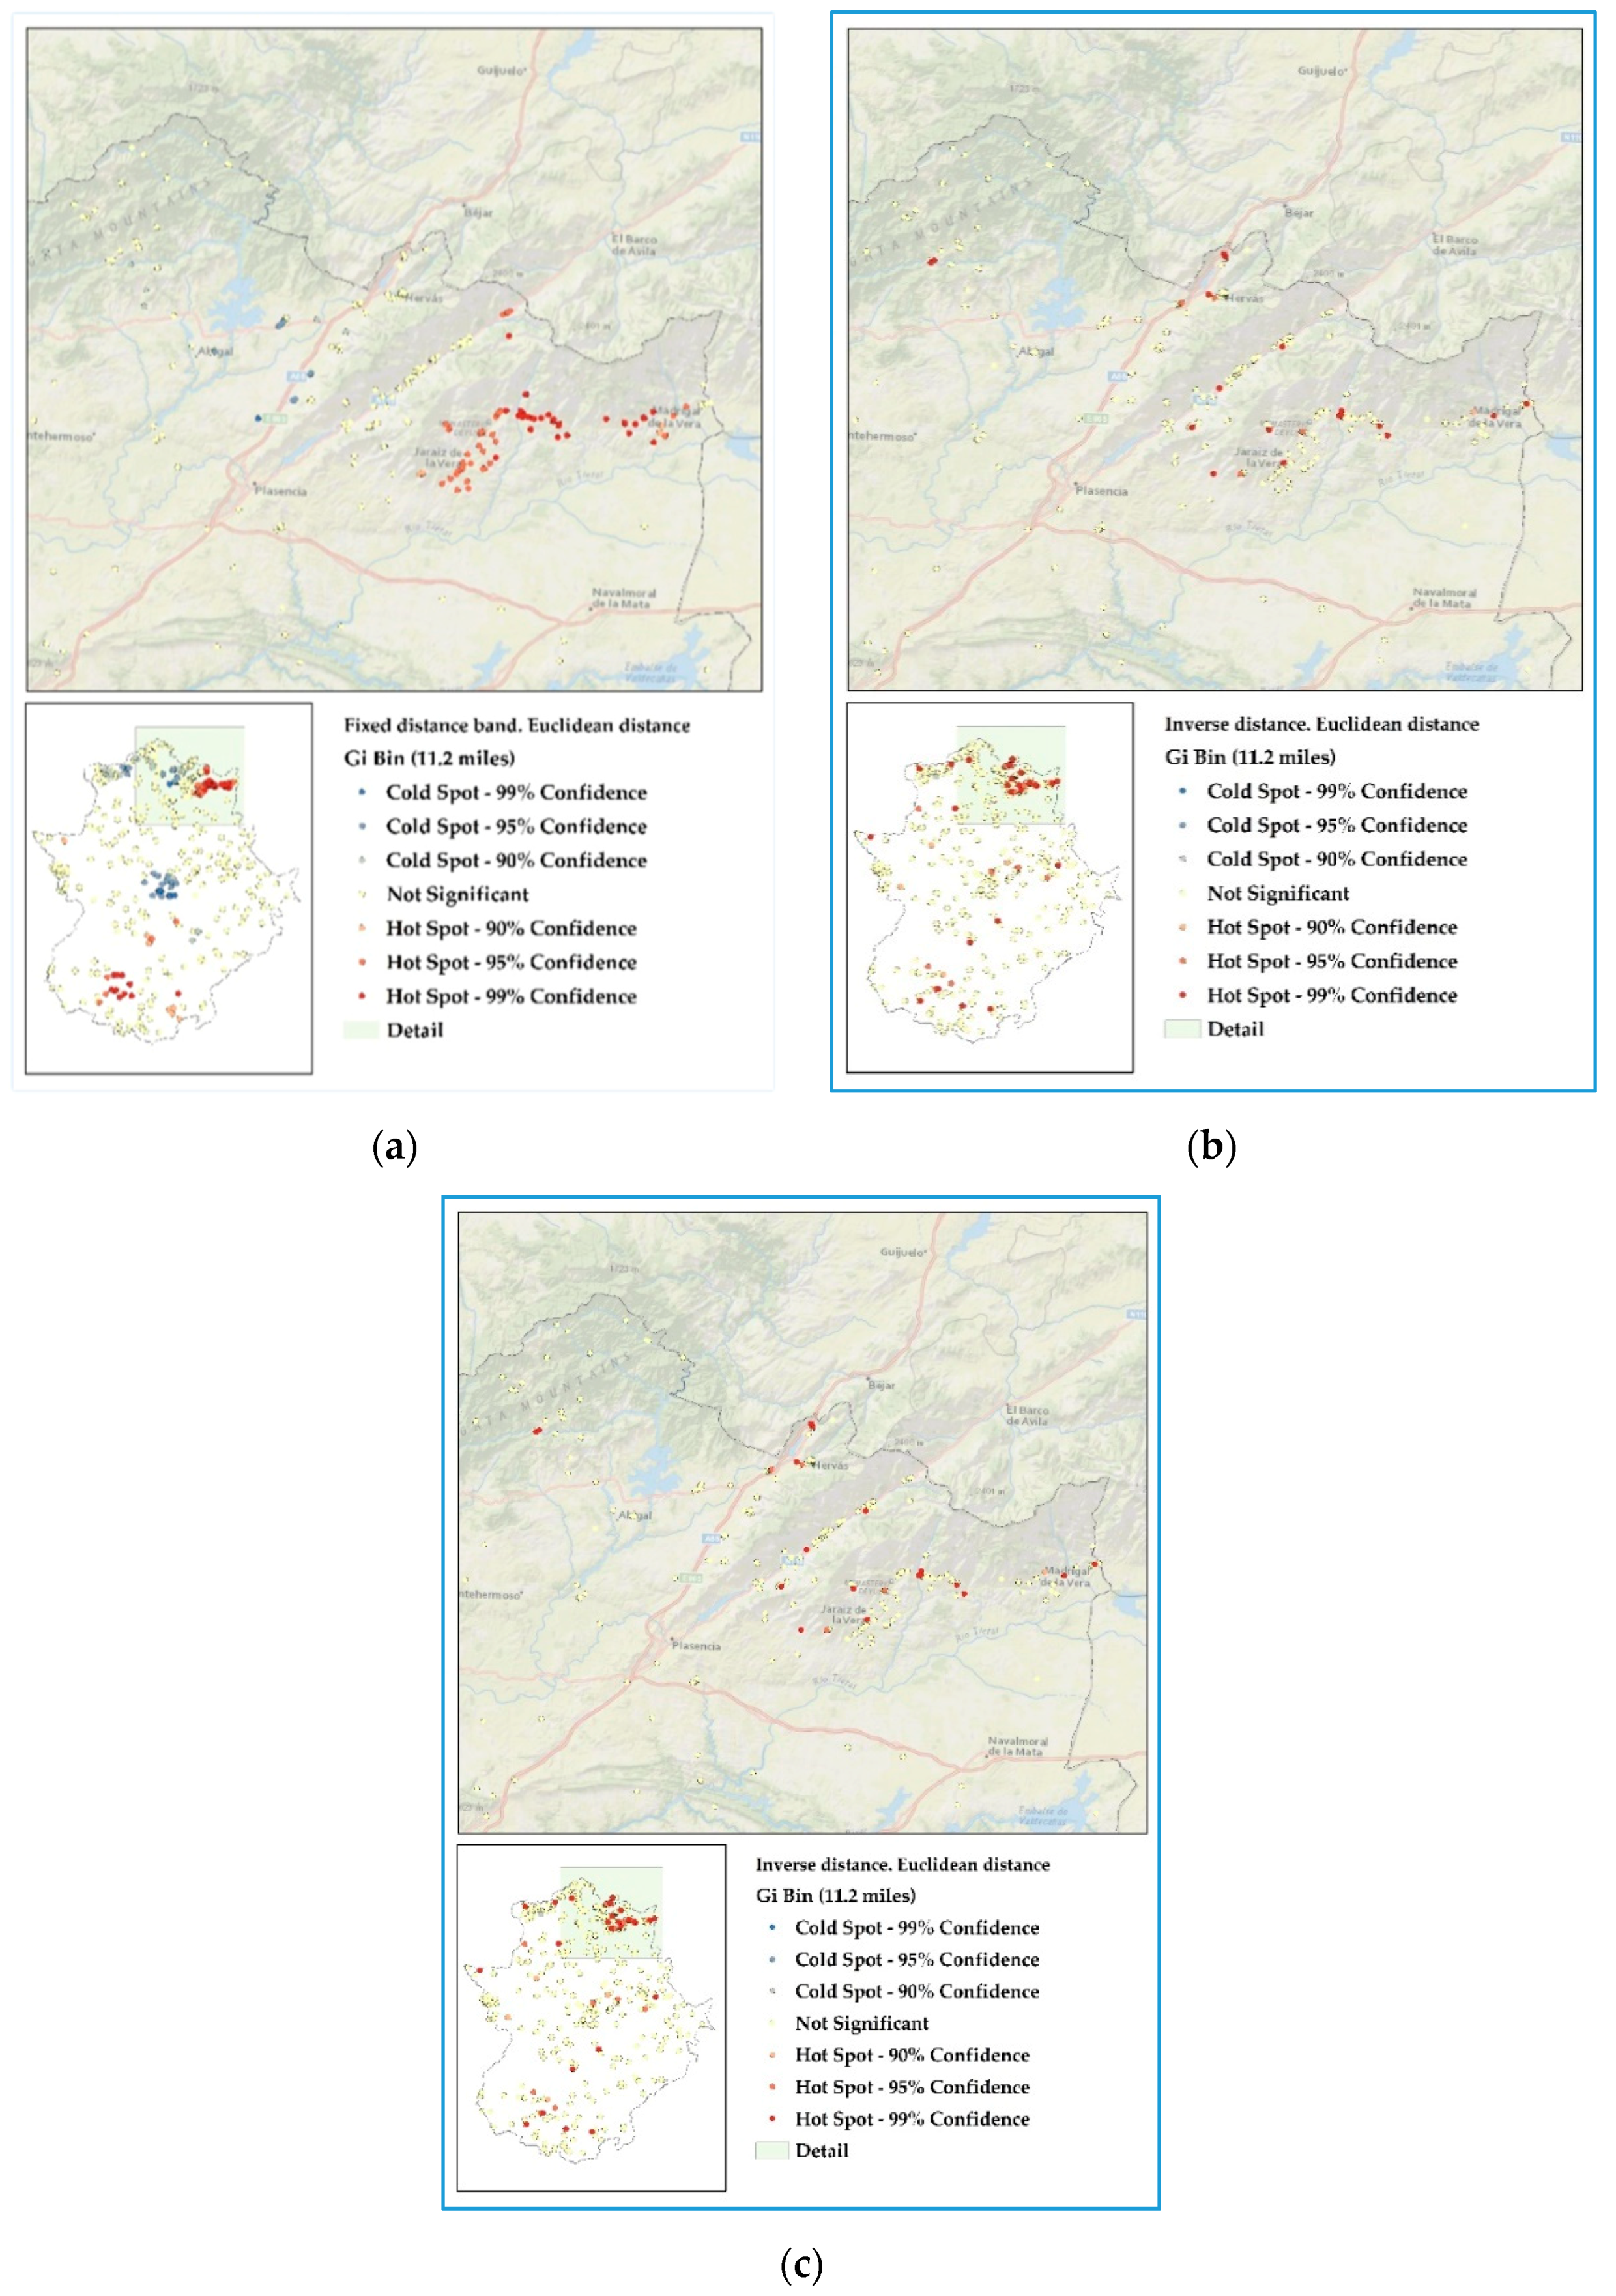
There are very specific areas that constitute hot spots, such as La Vera or the Zafra-Bodión River, whereas there is a noticeable cold spot in the vicinity of the Sierra de Montánchez—in addition to others that are not so intense in the Sierra de Gata area. However, depending on the method used to establish the boundary distance, results vary significantly. Thus, noticeable variation occurs depending on the spatial configuration, with more compact groups appearing when a fixed distance is used (
Figure 5a), whereas the use of the inverse distance (
Figure 5b) and inverse distance squared (
Figure 5c) methods yield quite similar results, making clusters with lower statistical significance.
In order to illustrate the different spatial relationships, equal distance has been used, and it has only been ensured that each lodging business has a neighbour (11.2 miles).
In light of the above comparison, the best results are obtained when a fixed distance is used as a criterion to conceptualize spatial relationships.
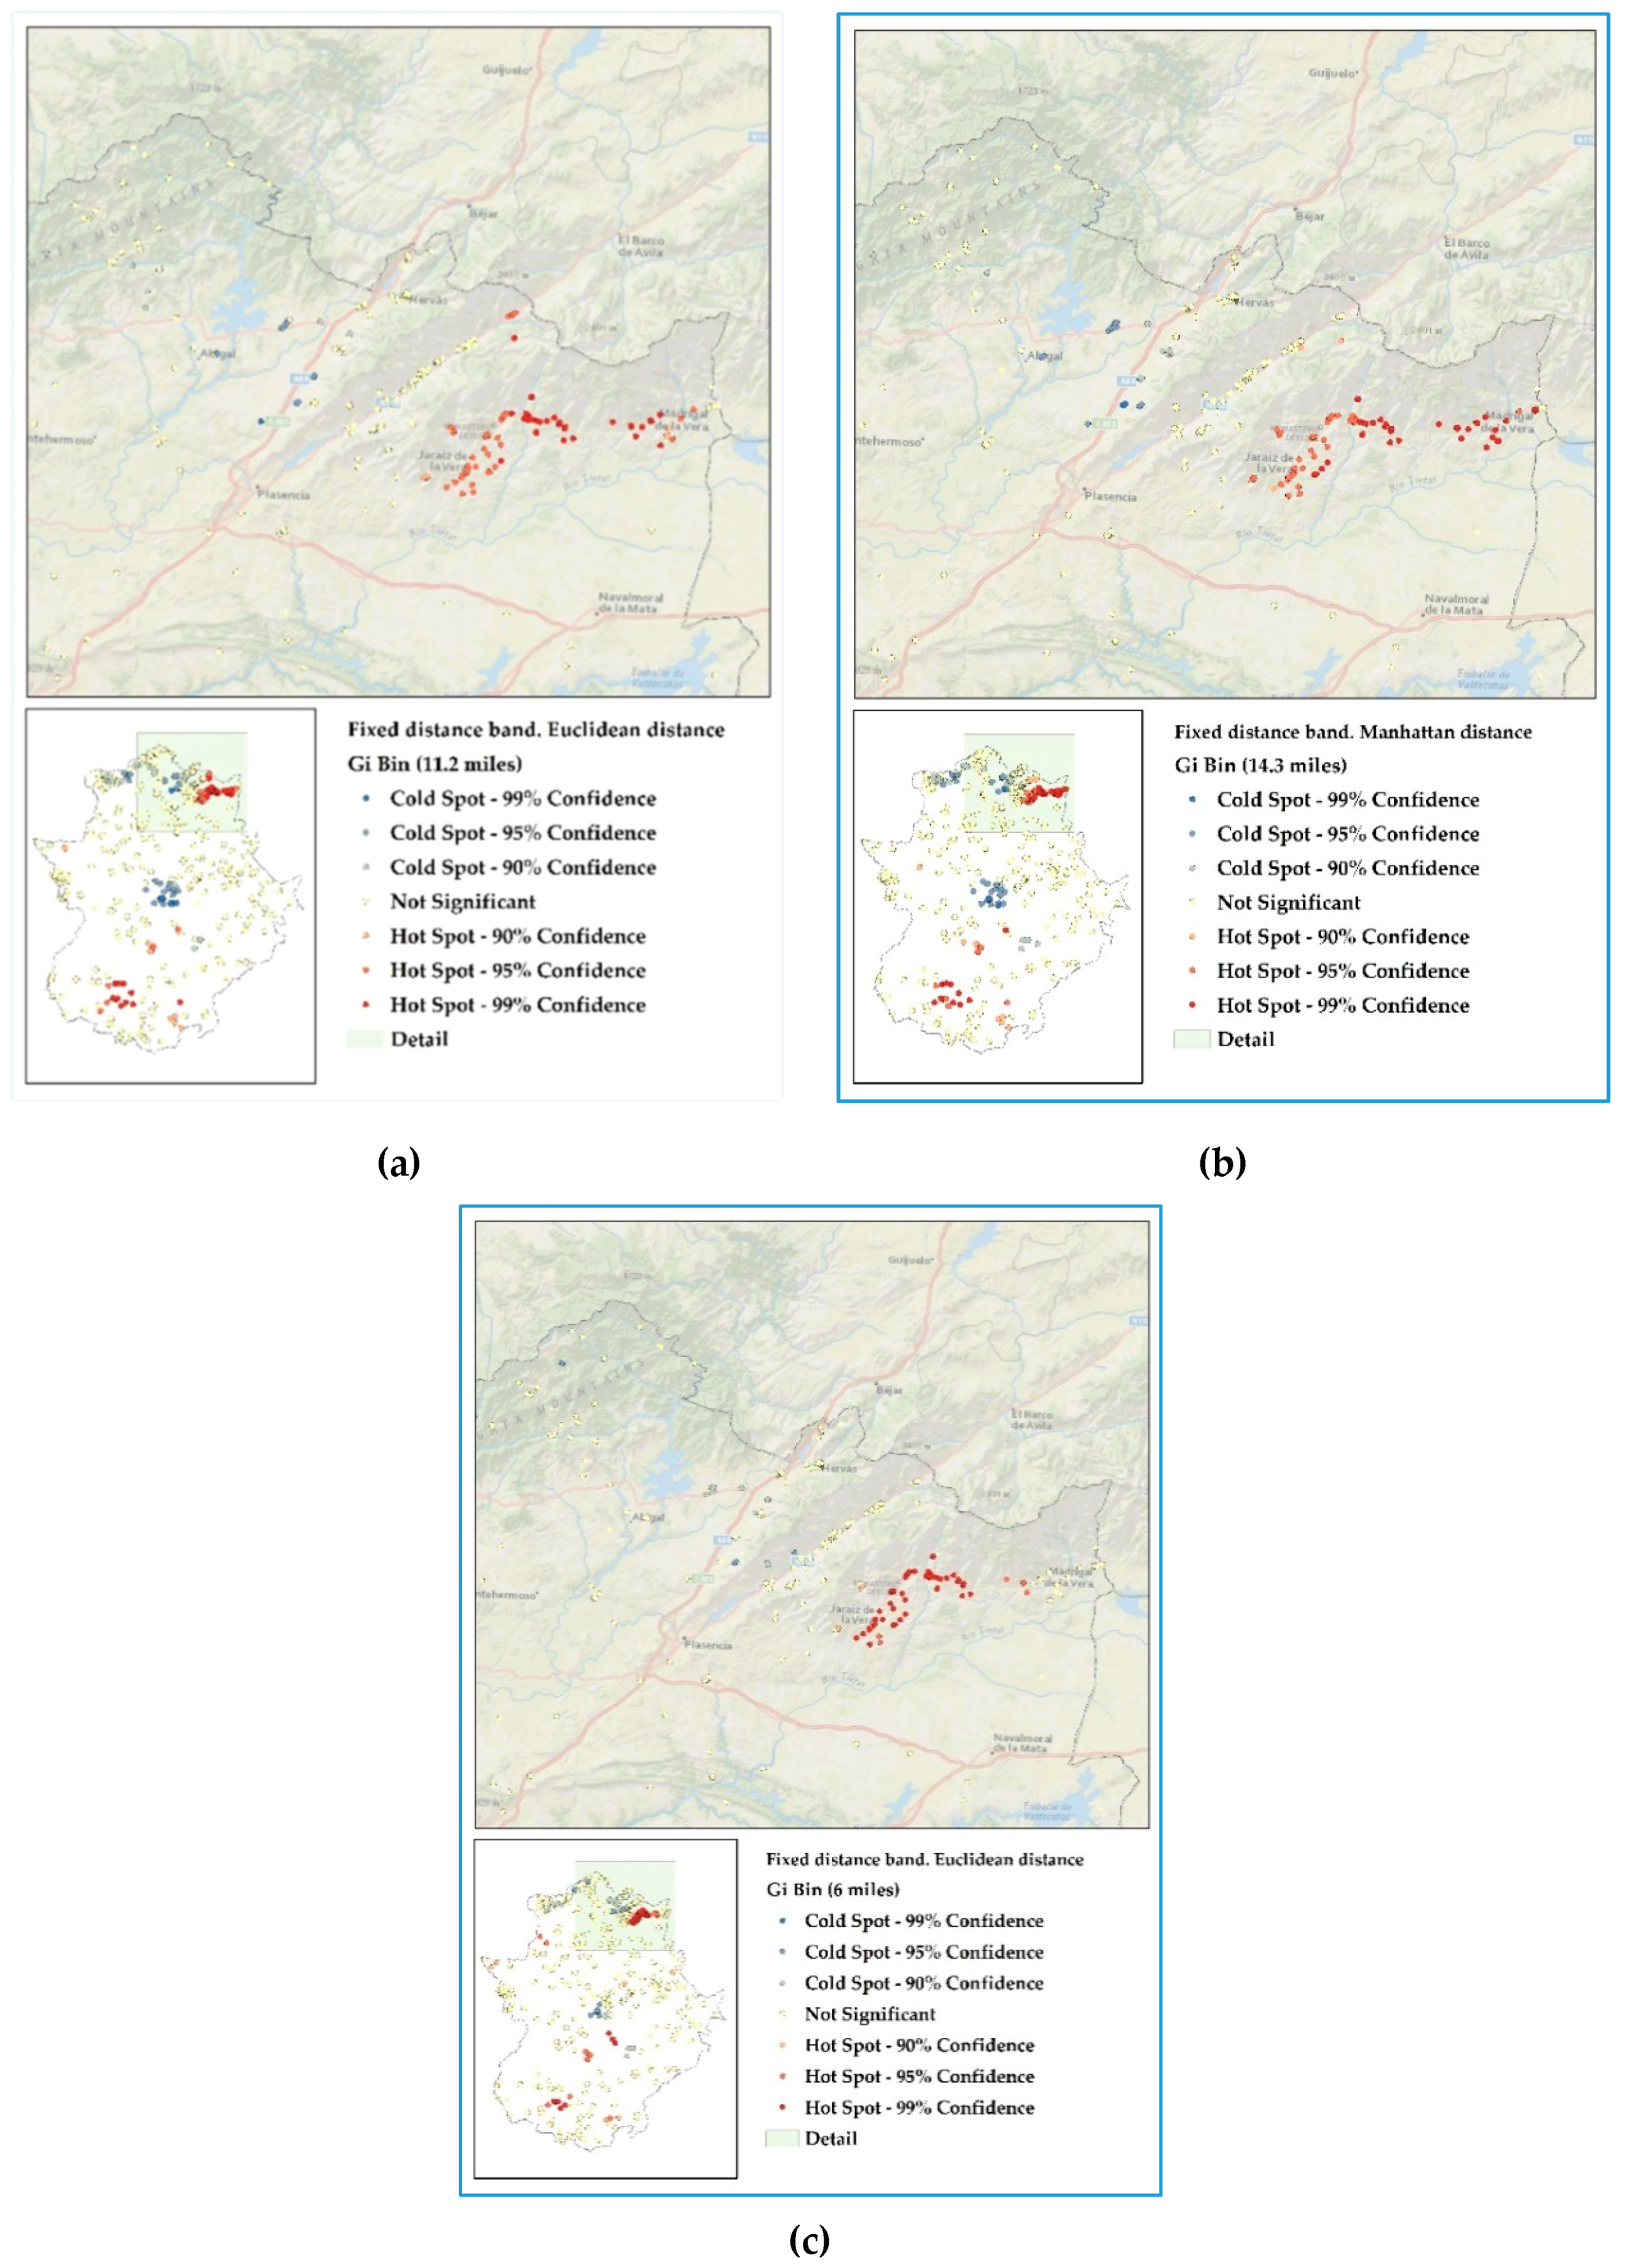
Also, when different methods are employed to calculate the distance, the results are also varied. Thus, for example, when the Euclidean distance is used, while making sure that every point has a neighbour the distance equals 11.2 miles (
Figure 6a), whereas if the Manhattan method is chosen, the figure reaches 14.3 miles (
Figure 6b). It can be observed, therefore, that the most suitable method is the Euclidean, given that it is not possible to use the real distance in our calculations. However, it may be argued that the distance used in order to ensure that each point has a neighbour is too high. This is why, after several trial tests, the boundary distance has been reduced to 6 miles (
Figure 6c). Below this distance, the criterion of proximity would disappear and, as a consequence, groupings could not be detected.
Results show notable similarities, regardless of the method used to establish the boundary distance, which led us to choose the most restrictive one for this criterion.
As shown, the best results for this technique have been obtained by conceptualizing spatial relationships through a fixed bandwdith of 6 miles, where the hot spot in La Vera has a reliability of 99%.
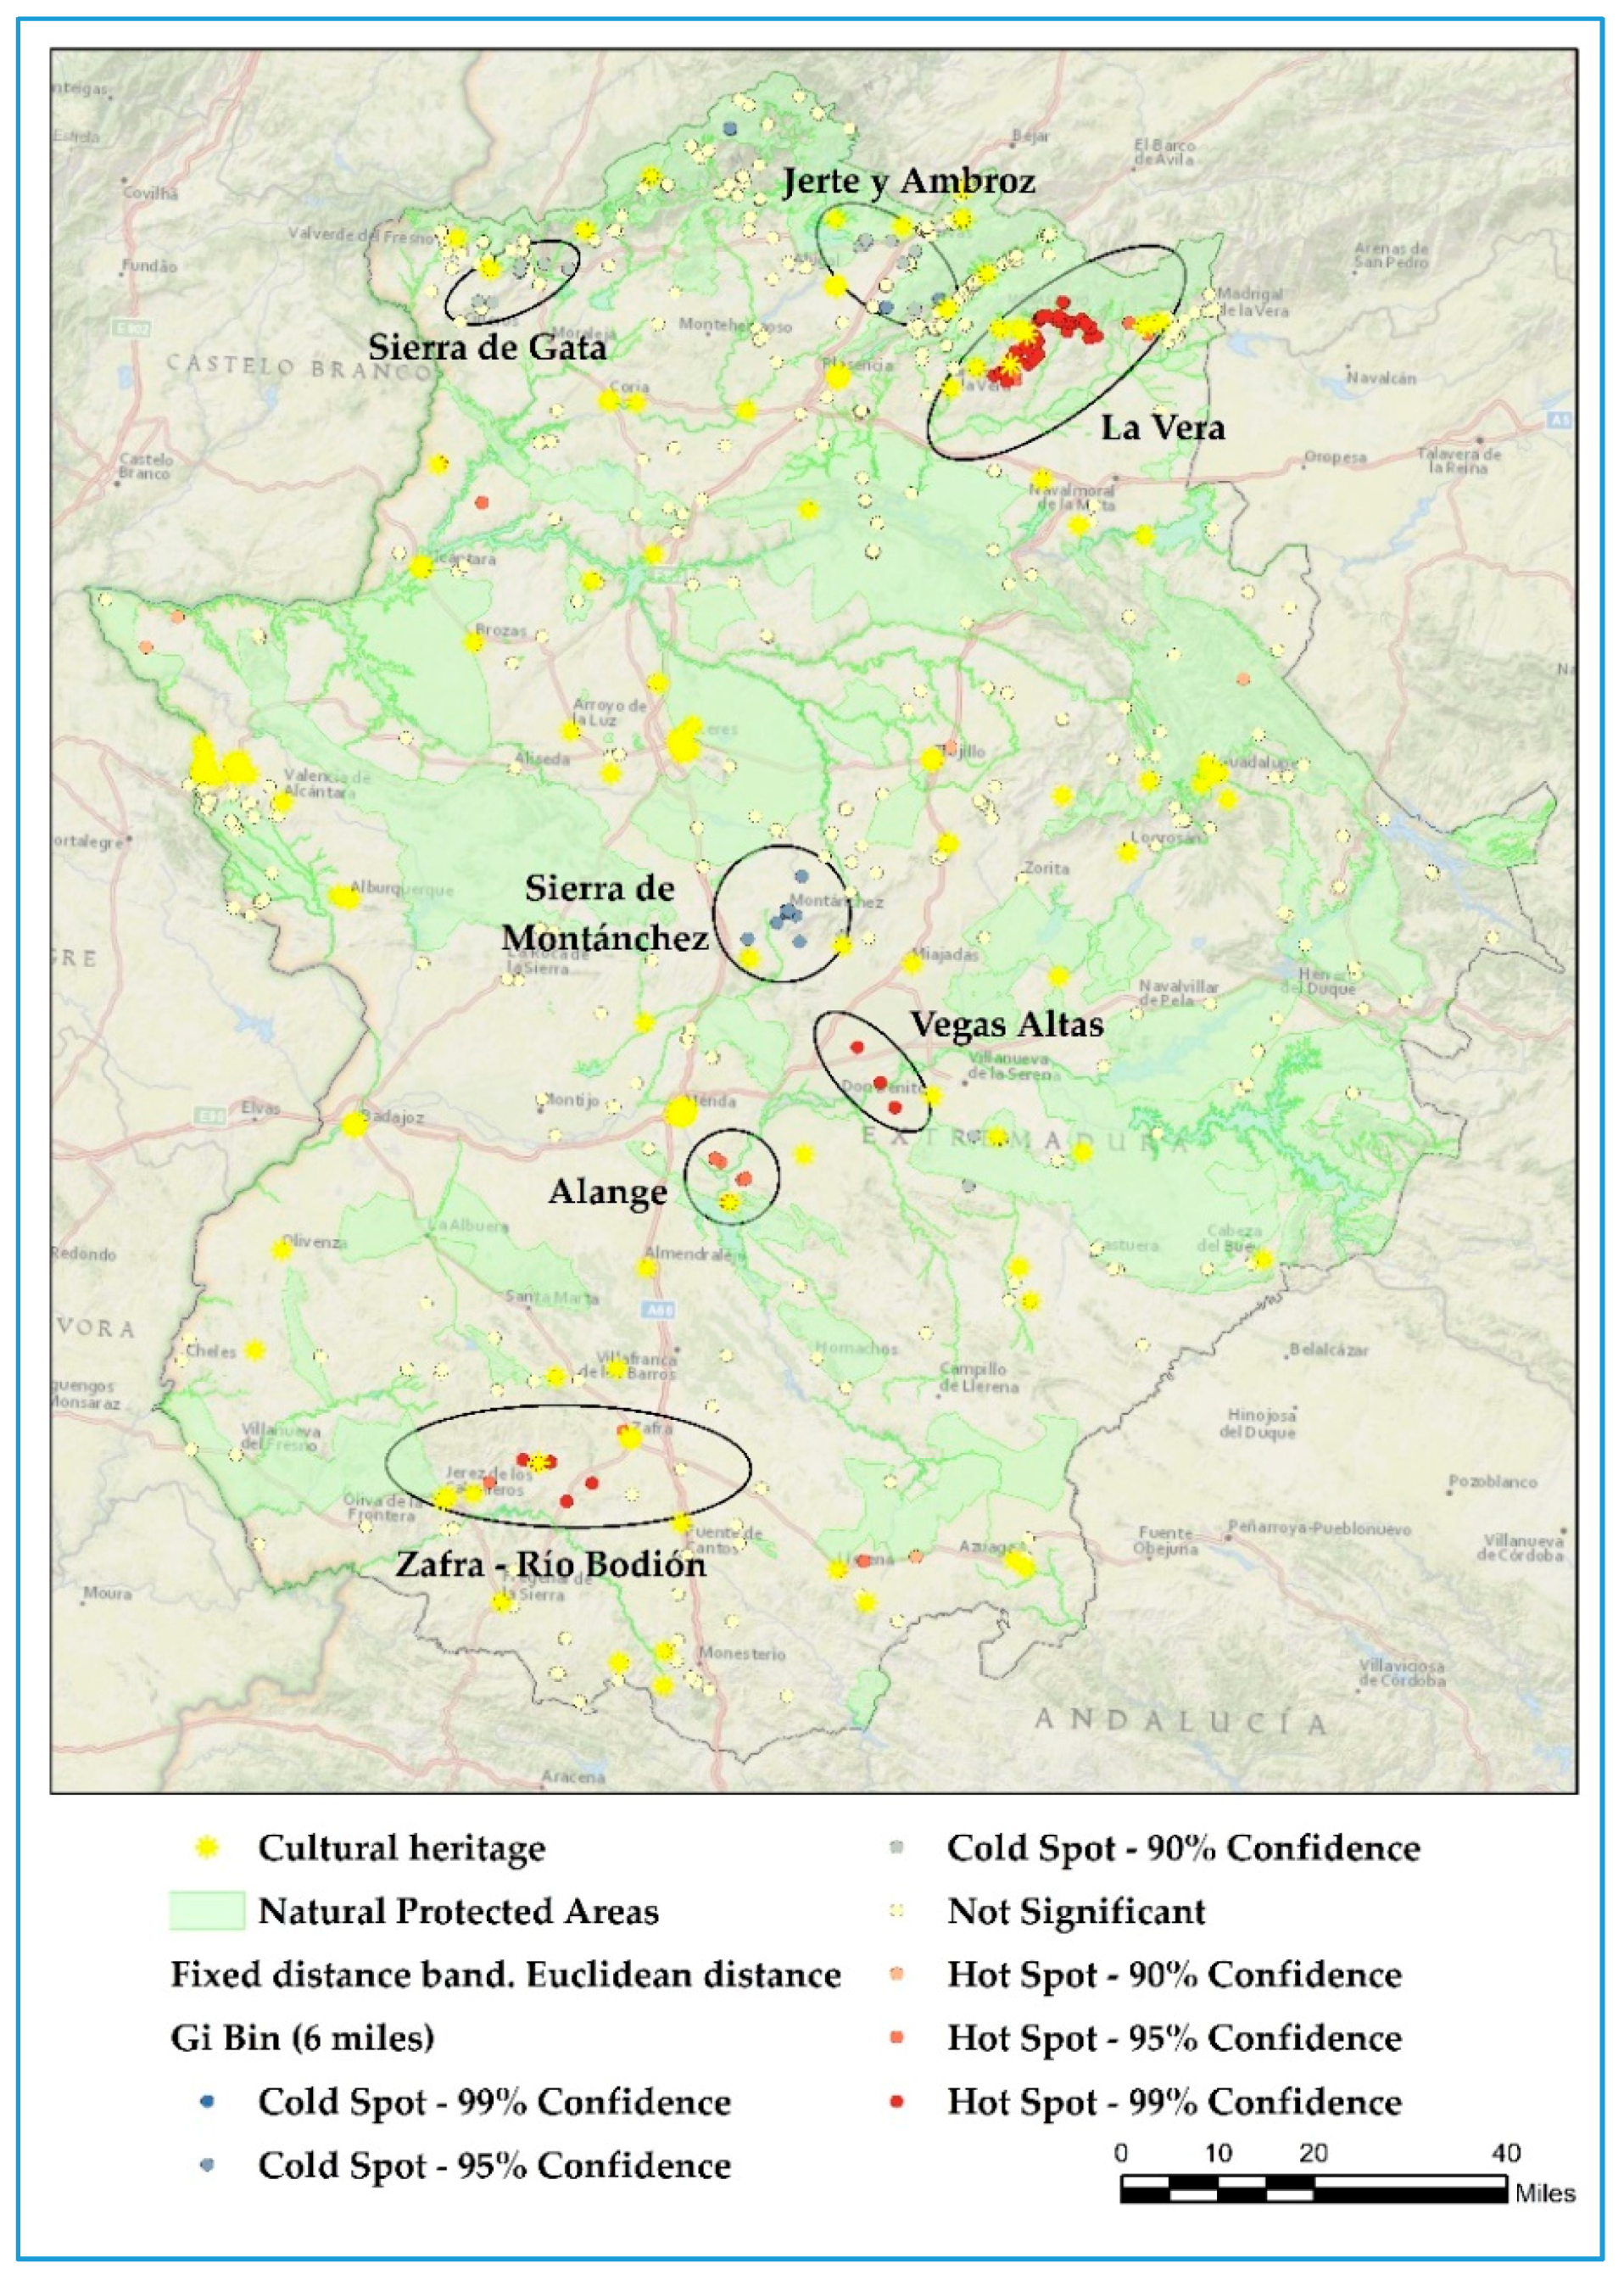
Therefore, in order to carry out a hot spot analysis on the lodging capacity of the rural accommodation businesses in Extremadura, a fixed bandwidth with a Euclidean distance of 6 miles must be used (
Figure 7).
The results that have been obtained for the lodging capacity with the final configuration for the hot spot analysis show a series of hot spot groupings. These are located in very different areas in terms of tourist structure. The largest area (and the one that deserves the most attention) is La Vera; while other, smaller areas also emerge from the data, such as the Zafra-Río Bodión area, as well as the Vegas Altas del Guadiana and the surroundings of the Alange reservoir. Likewise, there exists a significant cold spot in the Sierra de Montánchez, together with weaker, scattered ones in the north of the province of Cáceres, in the Jerte and Ambroz Valleys or Gata.
It is also worthy of note that the areas that are not significant span a vast zone, due to the heterogeneous nature of the variable under analysis and, as a result, the difficulty of making homogeneous groupings. This lack of statistical significance stems from the absence of neighbours, which makes it difficult to implement tourist policies conducive to promote rural accommodation in a specific, customized manner. This is connected both to the characteristics of the businesses and to the area itself. These two factors reveal themselves as limiting because of the large discrepancies in the lodging capacity among neighbours.
The relevant results for each of the clusters have been summarized in the table shown below (
Table 3).
To be precise, the hot spot analysis has detected 4 areas in which numerous rural accommodation establishments offering a large number of beds are concentrated (La Vera, Vegas Altas, Zafra-Río Bodión). As a consequence of this, the administration must carry out specific analyses on their viability, which is essential if we take into account that the average occupation of this kind of establishment is less than 20% for the year as a whole [
5]. This low occupation rate is made worse by the existence of a marked seasonal variation in which the months of July and August account for over 50% of the overnight stays; next come two long weekends to coincide with Easter (March or April) and the Day of the Constitution (December) [
3]. Given that the clusters share common characteristics and close proximity, it is possible to generate tourist products designed to exploit the enormous potential of the cultural and natural heritage of these spaces. It should be mentioned that the demand for the cluster detected in the district of La Vera is mainly that of the summer months as certain studies point out [
58], since the tourists travelling to this area seek lower summer temperatures and bathing areas. Notwithstanding this, the area contains a significant cultural heritage and has been declared a Historical Ensemble owing to its villages of Villanueva de la Vera, Valverde de la Vera, Pasarón de la Vera, Garganta la Olla, and Cuacos de Yuste, together with a natural heritage in the form of Special Conservation Areas (
Zonas de Especial Conservación, ZECs) such as that which connects the Sierra de Gredos, the Jerte Valley, and the Monasterio de Yuste. Both types of resource lack specific products focussing on well-organized tourist development which should be supervised by the administration. Given this lack of products, it is the tourists themselves who enjoy the area freely and without hindrance, which goes against the very sustainability of these fragile environments.
The situation described in this cluster is also to be found in the area of Alange. Despite this it is surrounded by the remains of an important Roman cultural heritage as is shown by its proximity to Mérida, which has been declared an Archaeological Historical Ensemble by UNESCO and is a World Heritage City. Moreover, the latter shares its history with Alange, the main attraction of which are its thermal baths of Roman origin together with the Alange Reservoir which is ideal for practising sailing and other water sports. As in the previous case, the activity generated in the surrounding area is limited and uncoordinated, which is no doubt conditioned by the lack of specific plans [
58]. A very similar situation can be observed in the Vegas Altas areas where 3 accommodation establishments appear.
A vey different case can be appreciated in the Zafra-Río Bodión area, which boasts an outstanding cultural heritage consisting of Historical-Artistic Ensembles and also natural areas of interest including, in particular, the pasturelands known as dehesas which are underexploited from a tourist point of view. In this space a considerable number of accommodation establishments are concentrated which would allow specific tourist products to be designed centred on the dehesa and its most emblematic product, the Iberian pig.
The technique also describes three cold spots located in the Sierra de Montánchez, the Jerte Valley, and the Ambroz Valley, and also in the Sierra de Gata. These cold spots are characterized by containing lodgings with low accommodation capacities. This circumstance contrasts with their potential as the areas hold numerous natural and cultural resources to attract tourists. Nevertheless, the situation of these areas is similar to that detected in the hot spots where there is a deficiency of tourist products sponsored by the administration.
The results show that some lodgings are concentrated in very specific areas with a low accommodation capacity and that in other areas the situation is the opposite. Despite this it can be observed that numerous tourist resources are present in each of these areas. However, no tourist policies adapted to each of these situations exist. Far from implementing them, at best the administration puts its faith in generic advertising campaigns which are little suited to the diversity of Extremadura and the varied circumstances of the availability of tourist accommodation [
27].
The results suggest that most areas contain rural accommodation businesses with a wide range of lodging capacities, except for some specific areas that have either very large or very small lodging capacities—thus becoming hot or cold spots, respectively. These areas may be the target of development plans, given that they share common characteristics. Also, it can be observed that the average lodging capacity varies noticeably among hot and cold spots.
3.2. Cluster and Outlier Analysis
The cluster and outlier analysis has been used to verify and complement the hot spot analysis, because it allows to detect both groupings and areas where anomalies exist. Therefore, its results show aspects that may have been overlooked in the hot spot analysis but are interesting highlights, especially in those areas where different types of groupings coexist.
The results of this analysis (with a fixed bandwidth with a Euclidean distance of 6 miles) are very significant, especially when considering that, for ease of reference and for comparative purposes, the criteria have been the same as in the hots spot analysis
First of all, there are several significant areas that overlap with those identified by means of the hot spot analysis, although minor differences also occur. Second, new areas emerge between which relevant relationships are established. Finally, some isolated accommodation businesses are also to be found in certain areas. Despite this, it must also be noted that there are many rural accommodation businesses that cannot be incorporated into a cluster (
Figure 8).
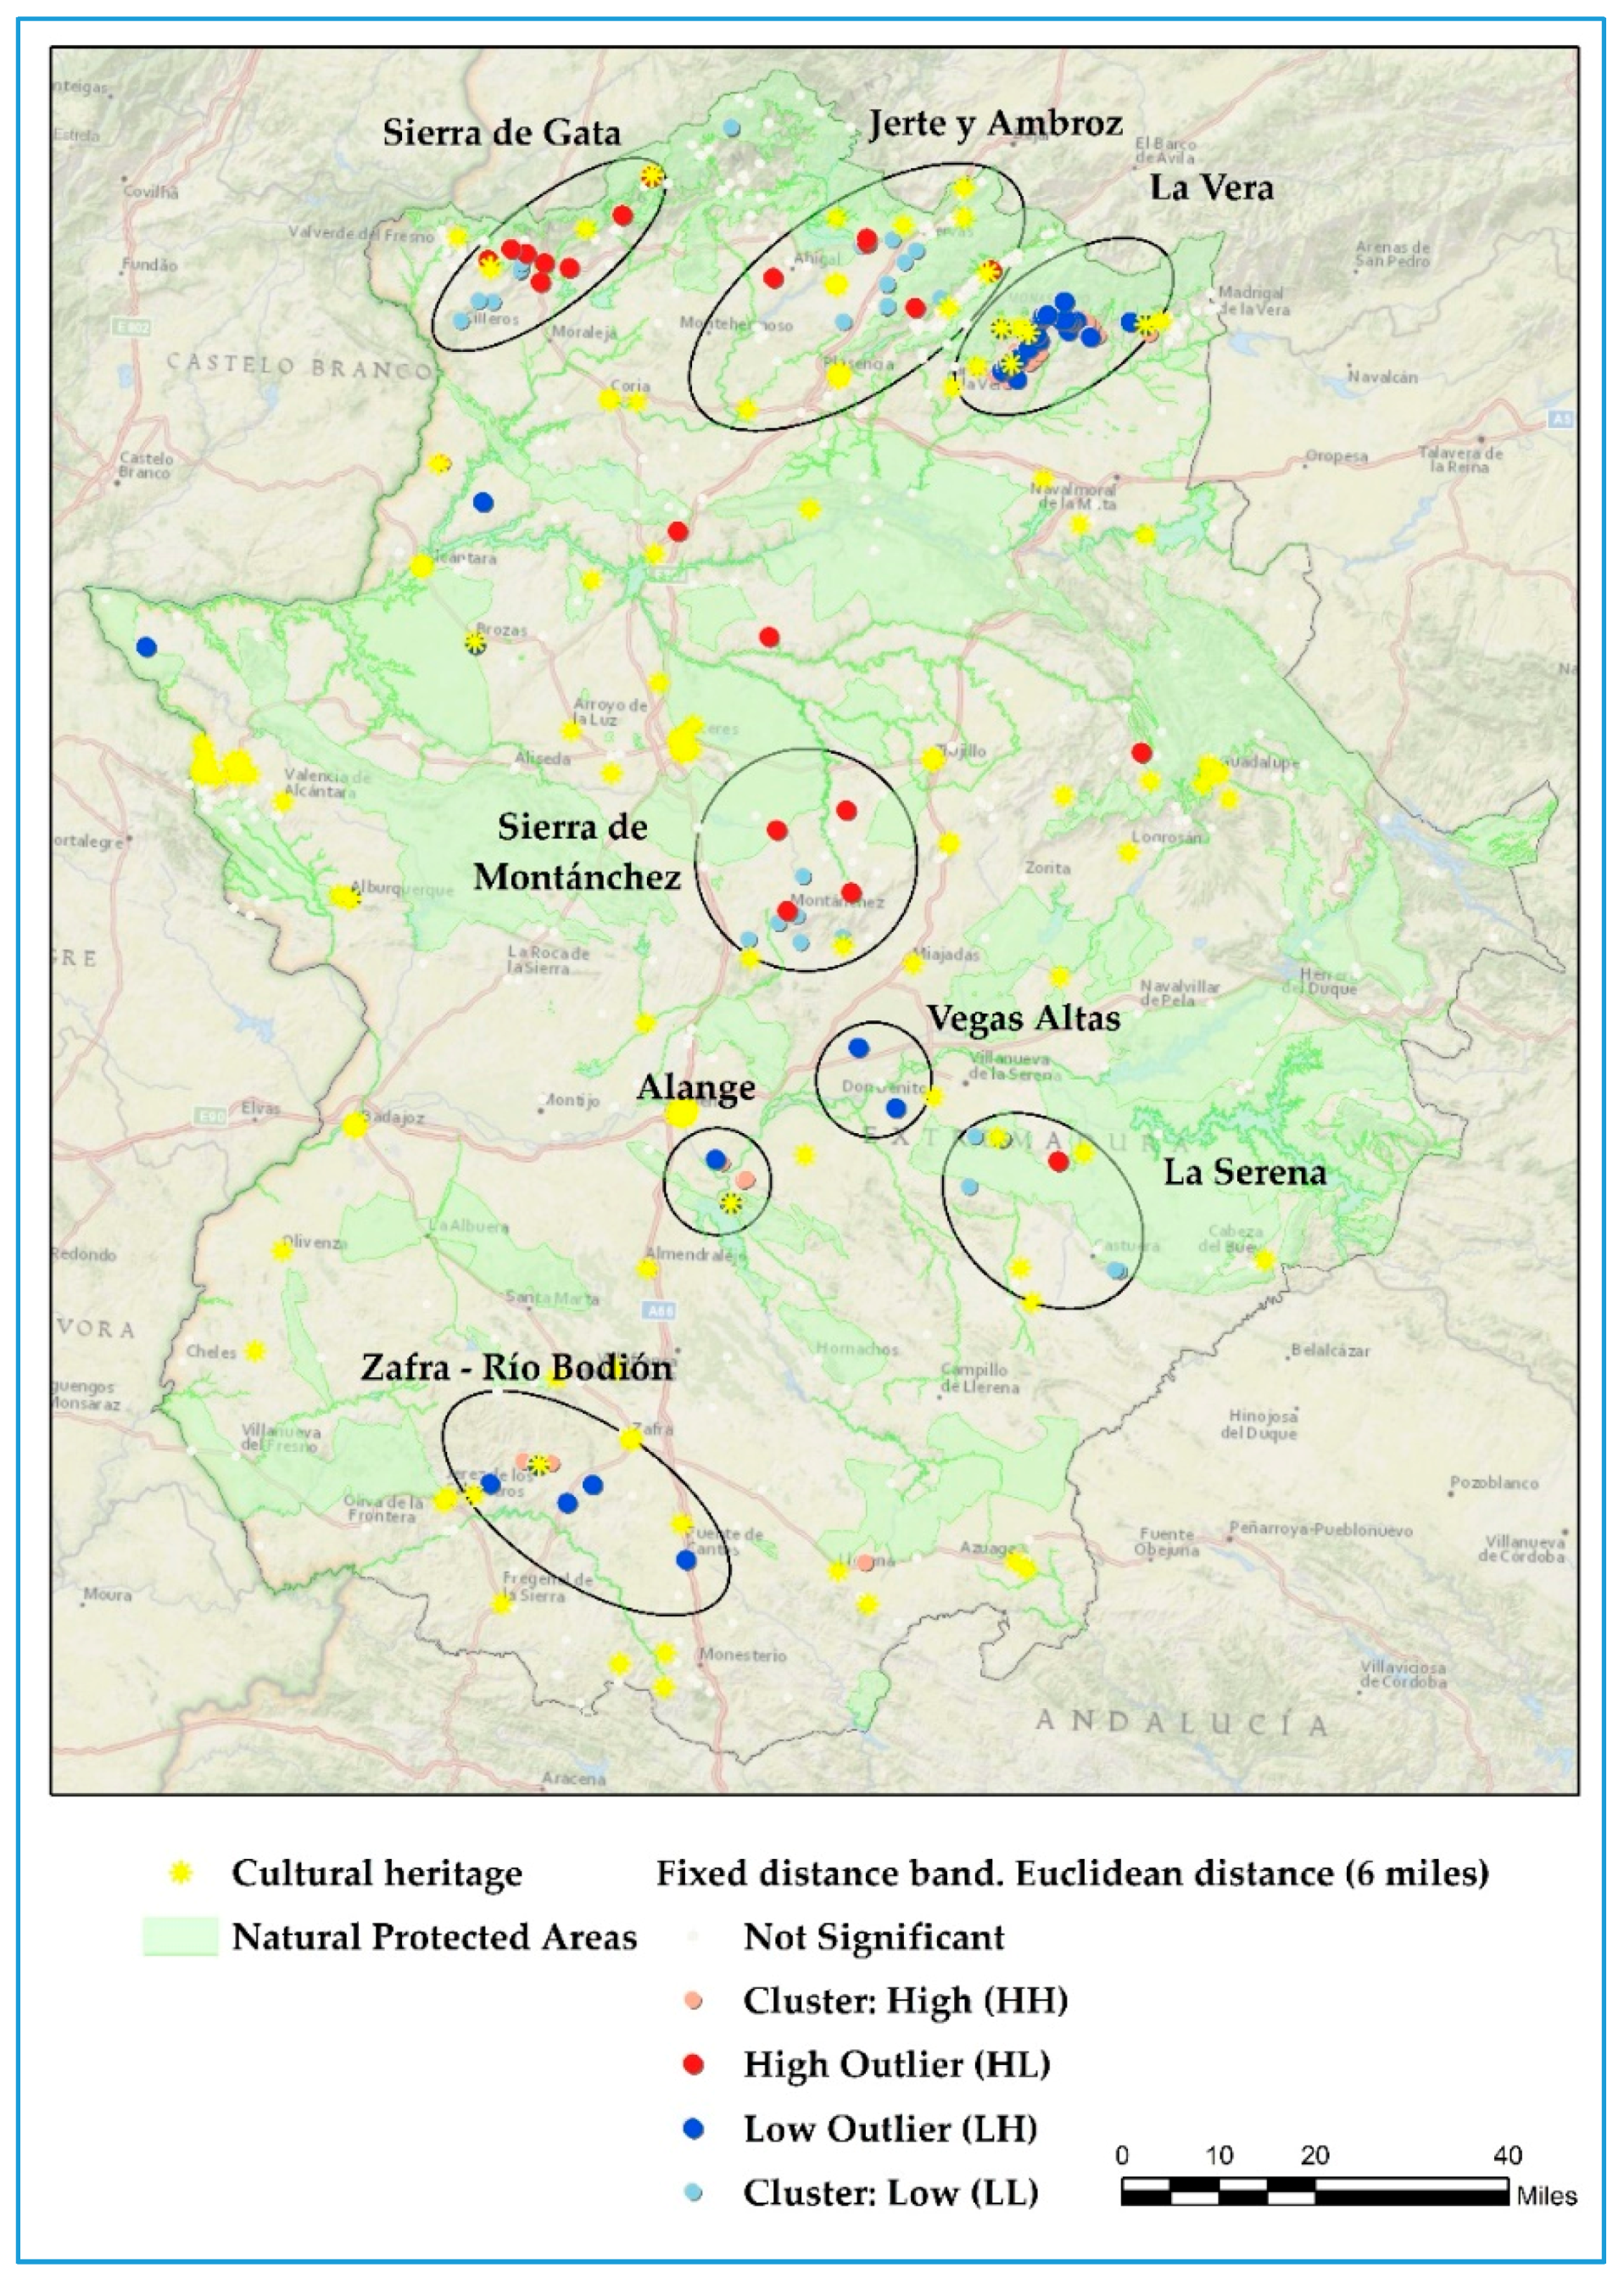
The presence of clusters (HH or LL) or outliers (HL or LH) is most conspicuous in the areas where rural tourism is particularly popular; namely, the north of Extremadura, where groupings can be found in the areas of La Vera, Valle del Jerte, Valle del Ambroz, and Sierra de Gata.
In addition to these areas, others also stand out, although they do not rank as high in this tourist modality. To wit, Sierra de Montánchez, Vegas Altas del Guadiana or Alange, plus a very specific area in the south of Extremadura, which overlaps to a great extent with the administrative division Zafra-Río Bodión.
Whereas these are the zones that comprise the majority of businesses with shared characteristics, some others scattered across certain areas must also be taken into consideration, especially in areas like the Villuercas-Ibores-La Jara Geopark or the Tajo Internacional Natural Park.
High-High (HH) clusters can be seen in greater detail (
Table 4) in the aforementioned areas of La Vera, Alange, as well as in Zafra-Río Bodión. This implies that these areas comprise accommodation businesses that have high lodging capacity, and so do their neighbours, at least to some extent. There are 47 businesses in this category, with an average of 18.06 beds. There also exist Low Outlier (LH) groupings, which indicates that two types of businesses coexist—Some with high lodging capacity and some with a much smaller one. The latter category consists of 47 businesses with an average of 8.21 beds.
By contrast, Low-Low (LL) clusters indicate that the areas they are in mostly contain accommodation businesses with little lodging capacity. Indeed, among the 39 in this category, the average is 6.9 beds. Meanwhile, the High-Low Outlier (HL) category consists of 22 businesses with an average of 15–50 beds.
As can be noted, this simple distinction allows to located specific areas where all rural accommodation businesses have a similar lodging capacity, although these groups cannot be detected in a large part of the territory due to the peculiarities of each establishment.
In a more specific manner, the territorial analysis which this technique permits corroborates the clusters detected by the analysis of hot spots, although it is much more illustrative and qualifies the clusters. The areas made up of La Vera, the Vegas Altas, Zafra-Río Bodión, and Alange (the hot spots) therefore bring together among the HH clusters some outliers of the LH type, which implies the coexistence of low-capacity lodgings mingled with other which are precisely the opposite.
Given the limitations of rural accommodation expounded by previous studies [
3,
5], the situation is even more delicate than that indicated by the analysis of hot spots, as the lower-capacity establishments have in principle more serious problems as their capacity to generate income is lower. The role of the administration in the promotion of products specifically orientated towards these areas is clearly a very passive one; it abandons to private enterprise the generation of tourist products that are poorly adapted to the circumstances of the area [
3,
27].
This disadvantage can also be appreciated in other key areas in the rural tourism sector in Extremadura, as is the case in the Jerte and Ambroz Valleys and the Sierra de Gata. These areas hold numerous Historical Ensembles such as those of San Martín de Trevejo, Trevejo, Hoyos, Gata, Robledillo de Gata, Hervás, Cabezuela del Valle, and Garganta la Olla. They are also complemented by ZECs in Granadilla, Las Hurdes, and the Sierra de Gata, which are also Special Bird Protection Areas (Zonas de Especial Protección para las Aves, ZEPAs). In these areas special tourist policies are needed so as to allow the sustainable and coherent exploitation of the delicate environment, although this is not generally done, or at least with continuity; again, the initiative lies in private hands and the products produced do not always respect the environment.
3.3. Comparison of Results
Both the analysis obtained by means of the Gi* and the LISA are capable of grouping rural establishments according to their accommodation capacity and depending on the distance specified (6 miles). Moreover there is a territorial coincidence in the groups identified. Nevertheless, when a standard deviation comparative analysis (
Figure 9) is carried out of the detailed results obtained by each technique (
Appendix A), certain differences can be observed.
As far as the analysis of the dispersal parameter is concerned (Z value), the Gi* of Getis-Ord is only capable of differentiating between hot spots and cold spots with a different level of confidence (90%, 95%, and 99%), whether owing to a concentration of lodging with a higher accommodation capacity or to the opposite. In other words, it establishes two groups with different confidence criteria. In contrast, the results of the local Anselin analysis I of Moran are more useful as it is capable of distinguishing 4 groups, which constitutes a significant improvement with regard to the first technique. These 4 accommodation clusters are the result of combining each point of lodging with its neighbours. This method determines the rural establishments which have low capacities and in their turn are surrounded by neighbours with the same characteristics (LL), which in principle would mean that the application of tourist policies common to them is viable. The situation is somewhat similar in the opposite case, i.e., when all the lodgings have a considerable number of beds (HH). However, two differentiated clusters exist in which some accommodation offers a lodging capacity that is very different to that of the neighbourhood (LH or HL).
The application of the Pearson index to the Z values of the Gi* and the LISA leaves no doubt as to their poor correlation since a value of −0.203 is obtained. This means that it is a case of two techniques providing different results, owing to which they may play a complementary role.
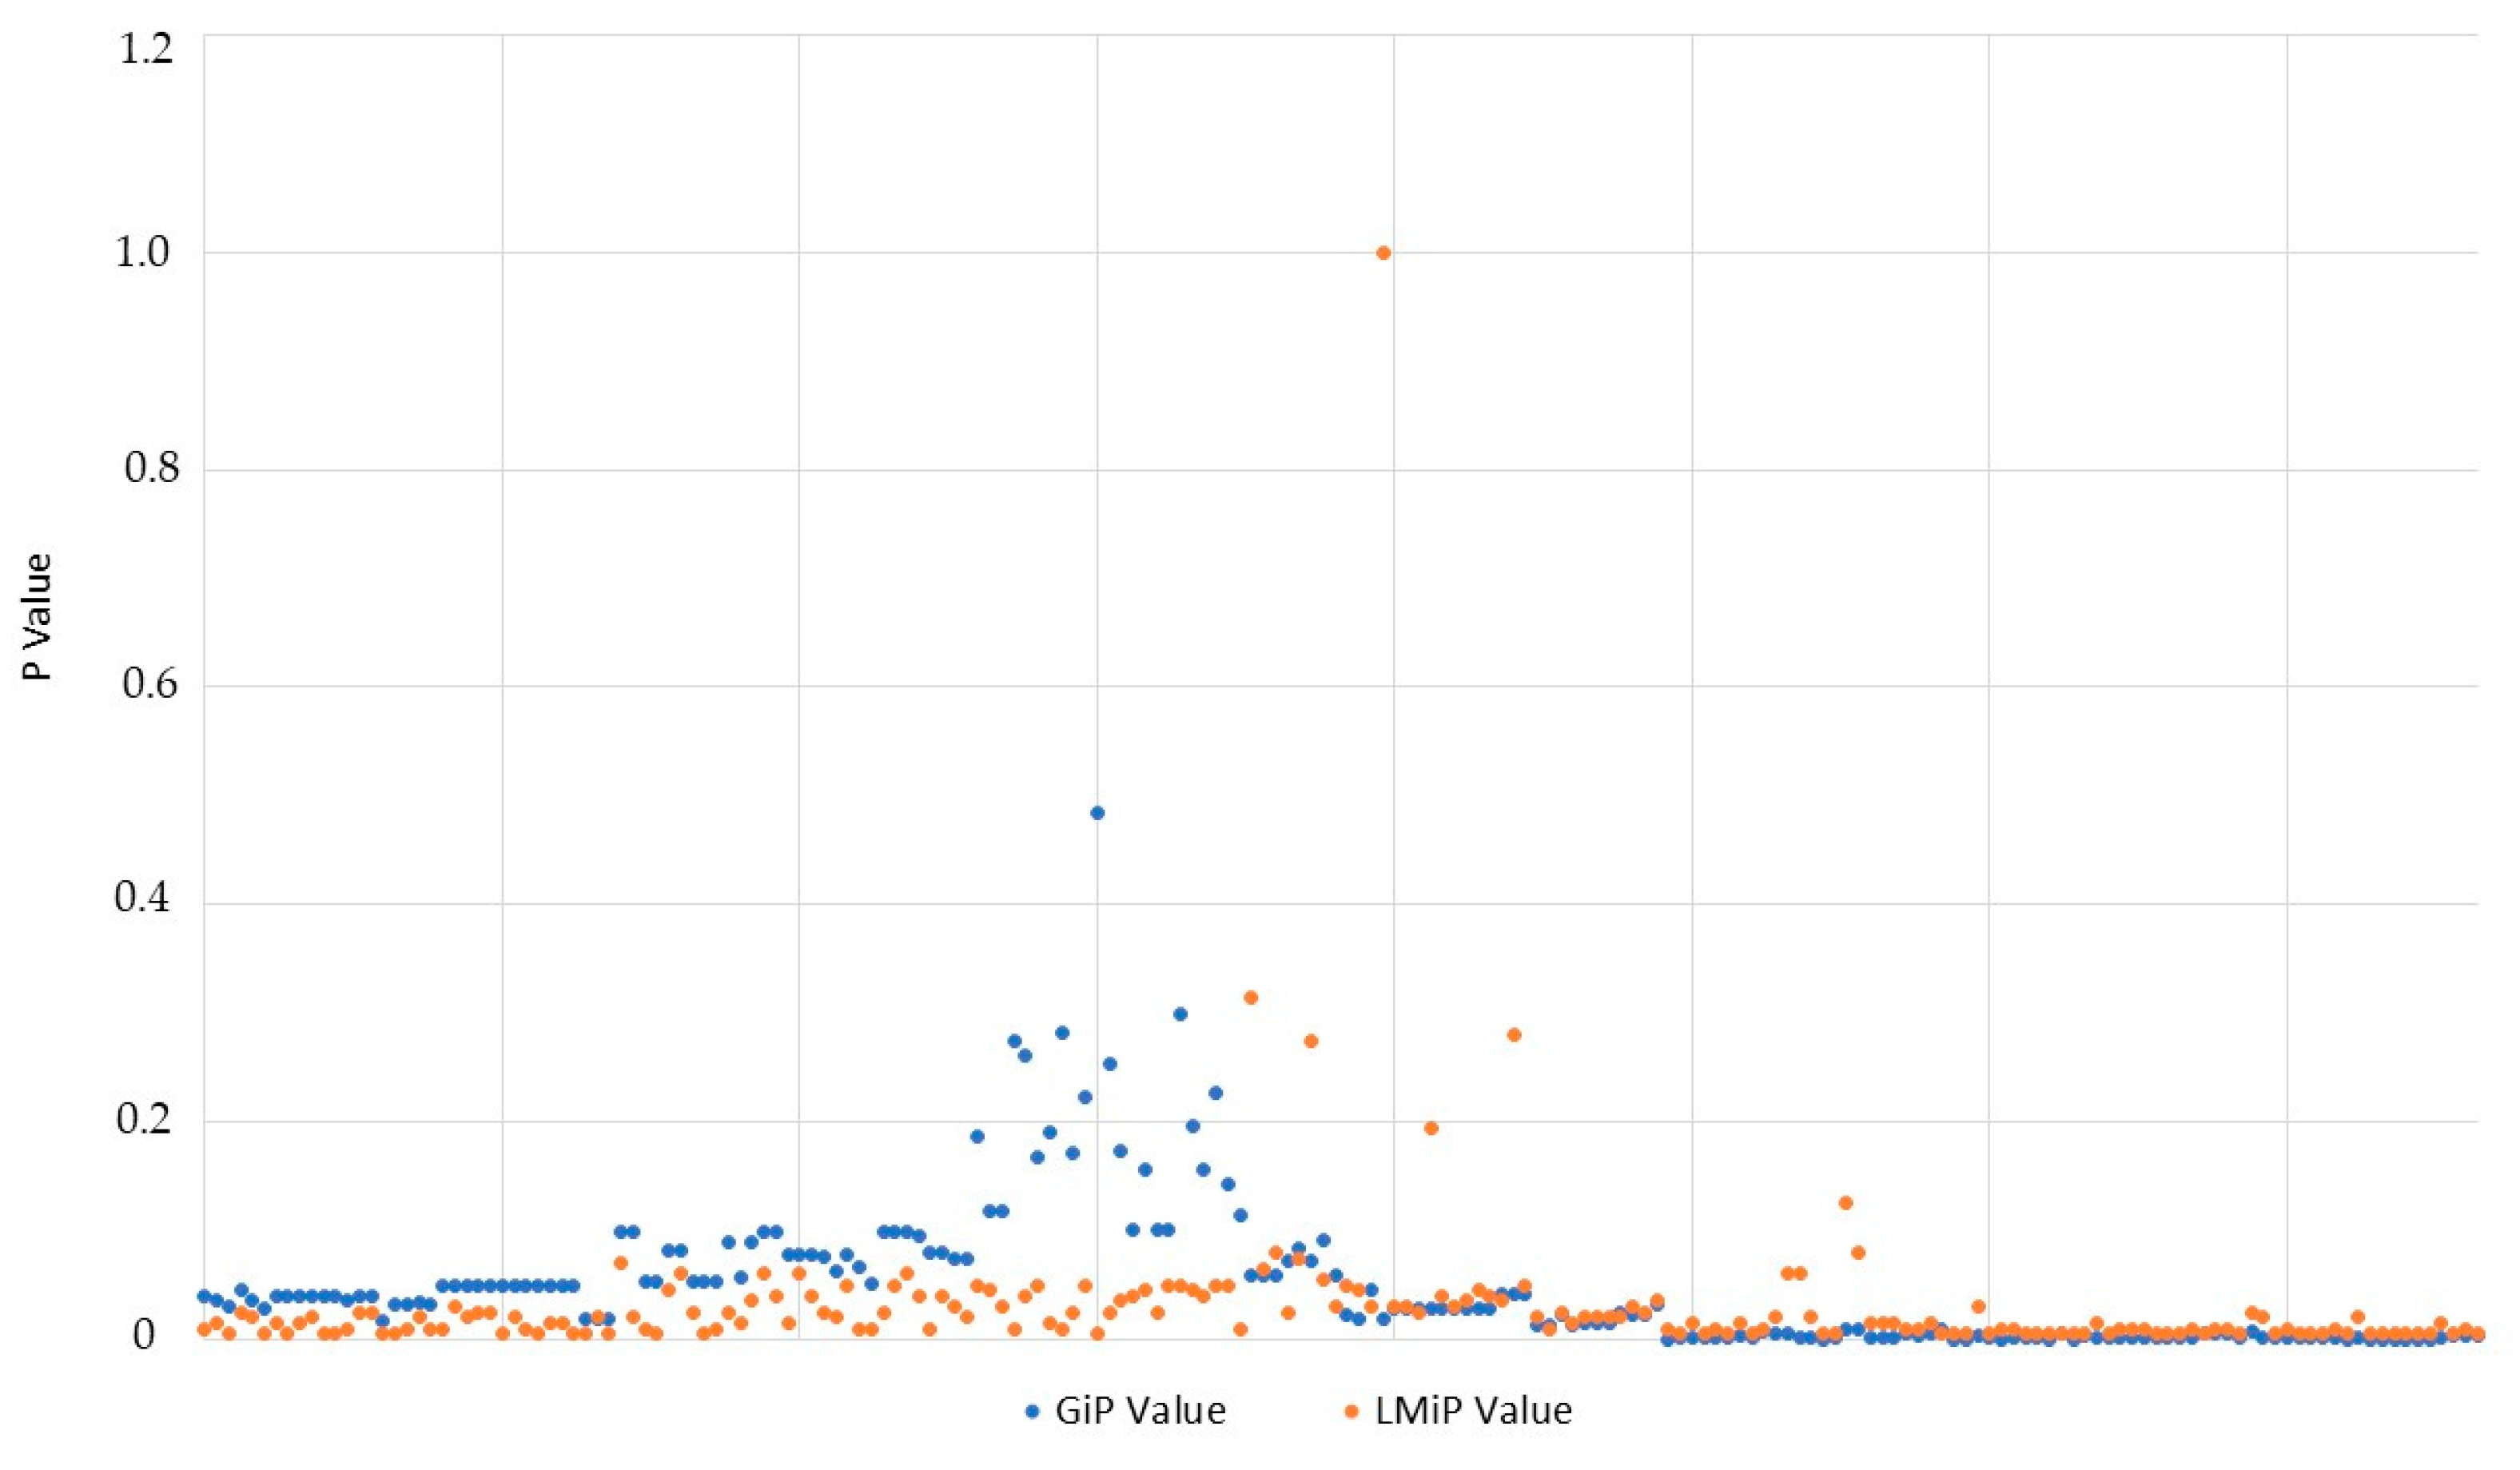
On the other hand, the analysis of the values measuring the probability that the randomness of the model (
p value) obtained by each technique can be rejected reveals fewer differences (
Figure 10), with values normally exceeding the critical value of 0.005. This probability and >1.65 or <−1.65 standard deviations imply that the null hypothesis on the randomness of the model can be rejected provided that it is taken into account that the accepted level of confidence is 90%. In other words, there is a marked crowding component.
Despite this, there are certain differences in the probability which affect above all the accommodation in the area which is more dispersed.
Once again the application of the Pearson index shows that the p values are not correlative as the index obtained is 0.049.
As can be observed in the two main parameters analysed by the techniques compared (z and p values), there are well defined clusters of rural establishments with common characteristics. Despite this and in view of the results, it is clear that the cluster and outlier analysis has more advantages than the hot spot analysis as it obtains mixed groups (outlier).
4. Discussion
Cluster mapping techniques have often been used to establish distribution patterns for a number of variables in areas like epidemiology [
65], security [
66,
67], economics [
68], etc. Tourist activity has also been part of this trend, which explains the growing interest in analyzing the distribution of different tourist elements through the use of cluster-mapping techniques. There are studies about the relationships of spatial dependency in tourist flows [
69] or the distribution of the accommodation offer [
20,
70]; however, there are few relevant bibliographical references in the objects of this study [
6,
53,
58,
71].
Many of the studies that utilize geostatistics applied to tourism agree that geographical analyses must be carried out in order to complement the qualitative and quantitative variables. In contrast, in this study the spatial criterion has been analyzed in a different way.
However, choosing the right scale is certainly problematic, especially because the most common approaches are circumscribed to urban contexts and to a specific element within the tourist industry: the lodging capacity. The urban scale simplifies the analyses because it covers a restricted area, although the analysis becomes much more problematic when larger areas like provinces or regions are studied. This is due to two main factors. First, there is an intrinsic difficulty in georeferencing accommodation businesses because the data are grouped at larger scales such as the municipality level. Second, and the most complex of the two, there exists the tough challenge of establishing the type of spatial relationship and the boundary distance that will be used to find patterns. These two criteria are different in each area, and this means that they cannot be extrapolated to another one. Therefore this implies that multiple tests have to be run in order to arrive at a suitable combination for each specific case study.
In this regard, when the methodology that led to the study results has been described, the conceptualization of spatial relationships and the way to arrive at an ideal boundary distance have been decisive. The contrastive analysis of these elements has indeed allowed to ascertain the limitations of the cluster-mapping techniques; the hot spot analysis and the cluster and outlier analysis.
All the tests that have been run throw in relief that the best results are obtained when spatial relationships are established with a fixed bandwidth—even though this implies that there is no transition area as a result. In fact, it is assumed that up to the boundary distance, the relationship still exists and, once that threshold is passed, it is no more. Therefore, the notion of a transition area is discarded. Controversial as this option may seem, if the alternatives were applied, for example, using a inverse distance, it is easy to see that the relationship of proximity wanes very quickly and, as a result, the neighbourhood effect disappears. Consequently, and in line with the literature [
46,
55], the analyses conclude that the best method to conceptualize spatial relationships is the use of a fixed bandwidth with a Euclidean distance, as suggested by previous studies [
57,
63].
Choosing a boundary distance is always a challenging task, because it must be both coherent and long enough. Thus, if too long a radius is used, the concept of proximity weakens; but if it is too short, the resulting lack of neighbours makes the results all the less reliable. Therefore, three different distances have been tested: two Euclidean distances of 6 and 11.2 miles, which ensure the existence of at least one neighbour; and a Manhattan distance of 14.3 miles, which also ensures at least one neighbour. The final choice was made after contrasting the results of all the tests, where it was found that a smaller distance resulted in greater reliability, as it turns out that greater distances (although incorporating more neighbours into the equation) do not imply working with accommodation businesses that are far apart, even though the area of study is considerably larger.
The configuration for the application of the two techniques considered has been the same, in order to arrive at complementary results that would answer our main research question. In this regard, the results show that there is an obvious distribution of the accommodation offer and that it concentrates in some particular areas. However, when the lodging capacity is analyzed, certain areas stand out. This is sometimes the case because they constitute spatial mini-clusters, either hot/cold spots or HH or LL clusters. It may also be the case that these are anomalous groupings that do not match the characteristics of their surrounding area, thus becoming HL or LH outliers. All these areas with specific characteristics are in sharp contrast with a large area where there exist no significant results—regardless of the technique used. This may corroborate what previous studies about this area claim: the accommodation offer is not always located in the ideal place and, in some cases, it stems from a personal entrepreneurial venture that made use of LEADER, PRODER or FEADER aids in different years [
6,
71]. However, most often, the lack of statistical significance in this area derives from the heterogeneity of the lodging capacity, as the businesses that coexist in a restricted space are fundamentally different in this regard (high/low lodging capacity) [
3].
The existence of subareas in which rural accommodation has both similar and divergent characteristics as to its capacity has been shown. These results reveal the need for analysing the tourist development potential of Extremadura, where cultural assets of acknowledged prestige and numerous protected natural spaces coincide and to which can be added specific features such as natural swimming pools which facilitate making full use of the territory. However, numerous references state the opposite and stress the use of the protected areas as destinations for excursions [
7] from the main tourist centres of Extremadura which include Cáceres, Mérida, Trujillo, Plasencia, and Badajoz. This combination of factors has two negative implications for rural areas; firstly rural tourism accommodation does not have a sufficient level of occupation to ensure the continuity of rural establishments, and secondly non-sustainable use is made of the natural spaces which show a poor balance between the components of the ecosystem; this circumstance is aggravated by the proliferation of illegal building [
72].
The configuration of the clusters obtained both with the Gi* and the LISA stresses the idea that in each of the areas the decision should be taken to make use of the heritage elements present in the territory in order to encourage tourist products adapted to the circumstances of each establishment. This is particularly relevant when the administration attempts to generate generic products which are on occasion insensitive to the problem of accommodation.
The detailed results (
Table A1) are meant as a technical analysis that may help the regional administration to devise tourist policies that focus on improving the management of accommodation businesses that are integrated in a cluster, as they share a similar lodging capacity and spatial proximity. This also implies the notion that tailored strategic plans may be in order; not only catering to the areas where significant groupings exist, but also to those areas that are anomalous in any respect. These plans should target specific market niches as well as specific segments of the demand. So, they should consider the possibility of integrating the tourist potential of the heritage in the areas surrounding the accommodation.
In addition, the possibility of addressing the needs of specific businesses must not be ruled out. Indeed, much can be made of the results obtained for each of them (with both techniques utilized) if tourist policies target not only particular areas but also specific accommodation businesses. This would allow owners to create adapted mini-clusters in order to promote their businesses in coordination with others in the vicinity that share similar characteristics. This may constitute an important advantage to improve the competitiveness, as it is known that the low occupancy rate of rural tourist accommodations is one of their major threats to their success [
3].
The limitations of the techniques and, therefore, the results obtained should be related to the conceptualization of the neighbourhood criterion which must be adapted to each study area. It is also necessary to take into account that the techniques used only allow the use of a variable to carry out the analysis, owing to which we decided to determine the clusters considering the accommodation capacity and not other parameters, which would have required other techniques such as GWR.
It must be noted that the present study is a baseline study along a research line that has been very active for years. The objective of the research team is to focus on using the real road distance as a basic criterion in order to conceptualize spatial relationships, which will hopefully further adjust the present results.
5. Conclusions
Carrying out this study has allowed the following conclusions to be drawn:
Firstly, it has been shown that there has been considerable growth in the availability of rural accommodation in Extremadura. The increase of the lodging capacity has not been accompanied by an increase in the number of overnight stays, which generates a low occupation rate. Moreover, this kind of establishment is characterized by a heterogeneous number of beds. All this implies that rural accommodation establishments, which are highly dispersed over the whole area, require actions to palliate these limitations; this is why we aim to determine whether accommodation clusters with similar lodging capacities exist and in this way encourage actions in these areas by the administration.
Secondly, the idea of the complexity of the use of the mapping cluster techniques is reinforced as this provides an important variety of ways of conceptualizing both the distance criteria and its extent. This difficulty has been resolved after numerous tests have pointed to the conclusion that the best results are obtained when a fixed distance is used to conceptualize spatial relations. The best results for analysing the accommodation capacity of the study area are obtained when this distance is 6 miles, despite the fact that 9 establishments have no neighbours. It is also shown that the Euclidean distance is more efficient than the Manhattan distance.
Thirdly, the application of the two cluster mapping techniques has been efficient when detecting accommodation clusters with equivalent lodging capacities, which has allowed the corroboration of the initial hypothesis which presumed that there were areas in which the available accommodation took the form of clusters, albeit not always with characteristics that can be assimilated.
Fourthly, when the results obtained by the two techniques used to determine the clusters are compared, it was found that the cluster and outlier analysis (LISA) provides greater possibilities than the hot spot analysis. This is based on the fact that the LISA detects the presence of accommodation with a lodging capacity differing from that of its neighbours, while the Gi* merely detects the areas where accommodation establishments provide a similar lodging capacity.
Finally, we corroborate that the administration must take measures designed to palliate the problems which characterize rural accommodation. The measures proposed include the creation of specific policies for implementing tourist products which exploit the extraordinary cultural and natural heritage of the rural areas of Extremadura. Such action should be adapted to the characteristics of the various clusters of establishments which have been detected by geostatistical analyses. This is a key aspect, in particular if the specific results of each of the rural accommodation establishments are known. In this way it would be possible to implement them directly in the designing and marketing of tourist products so as to encourage the appearance of small associations of entrepreneurs with a strongly defined link with the territory.


