1. Introduction
Regarding land price sustainability in cities, price maps play an undeniable role in providing essential price information about real estate for quick decision-making. Price information can therefore be used not only for private purposes but also at the policy-making level [
1]. Land price and land price sustainability are important aspects in guiding land resource allocation during urban planning and development, particularly in large cities in fast developing countries where infrastructure and populations change frequently [
2].
Many authors have addressed land price sustainability issues for these reasons. The research is broad and covers issues associated with inflation [
3], land price volatility [
4,
5], changes [
6,
7,
8], and structure [
9,
10]. The specific research field explores predictive models [
11,
12] and implementation of GIS (Geographic Information System) software [
13,
14].
Several researchers have studied the factors which affect land price (e.g., [
2,
15,
16,
17]). An estimation of the effect of environmental factors on real estate prices caused by environmental change was analyzed in research by Del Giudice and Massimo [
18,
19]. Studies where countries experience rapid change and development (such as China) tend to focus on land price changes and the driving factors behind these changes (e.g., [
20,
21,
22,
23,
24]).
According to economic theory, the land supply and demand determines its price. Focusing on land demand, it is mainly affected by market factors, location conditions, and supporting facilities [
21]. Land price is supposed to be determined by many driving factors. Driving factors include any variable that affects human behavior, such as environmental situations, local culture, economic and financial subjects, land policy, and also interactions between these variables [
25]. Some of them can be related to a local situation within the city (e.g., migration [
26], gentrification [
27], tourism [
25]), whereas others are connected with more general market factors.
Regarding land price drivers connected with the local situation, Qu et al. [
28] identify three categories of factors: location factors, environmental amenities, and land attributes. The location factors involve also the quality of public service provided by the infrastructure around a specific piece of land. A good living location may reduce the money and time costs of traveling from home to the workplace or other public service elements. In this case, people are then willing to pay more to obtain better residential locations. Focusing on market price drivers and economic factors, Yang et al. [
21] point out that the higher the economic growth rate of an area is, the greater its potential for economic development will be. The market mainly plays a role through economic development and population increases, which is connected with GDP development [
21], the income of inhabitants [
29], unemployment rate [
30], discount rate [
31], the population in the city and its structure [
21,
25,
29], or housing construction [
32].
Land price sustainability has been a significant topic studied by Czech researchers since the Velvet Revolution in 1989. After 40 years of communism, land ownership was gradually returned in restitution processes to the original owners (or their descendants), and prices began to rise rapidly [
1]. Czech studies have examined general price issues at the regional or state level regarding housing [
28,
29,
30,
33], farmland prices [
33], the segregation aspect [
34], and price bubbles [
35].
Land price map analysis in Czechia has only been done by a few authors [
32,
33,
34,
35,
36,
37,
38,
39,
40]. Researchers have compared the price maps of selected European Union (EU) countries [
40] and the technological processes for automating and improving efficiency in processing land price maps [
41,
42]. Šindelářová [
43] and Kovaříková [
44] analyzed price maps and described their changes and practical use for the cities of Brno and Olomouc. A land price map in relation to rental prices was discussed in a PhD thesis [
45].
Two sources of land price are available for Czechia: official land price maps and unofficial land price maps. An official land price map (land price map of building plots) is defined in accordance with the law [
46,
47] and created and updated by its respective municipality. An official map displays the prices of building plots and is created according to the prices in purchase contracts (managed by the regional cadastral offices) and modified according to the type of land and its other characteristics (managed by the respective municipality).
The land price map is updated at the end of each year (in some municipalities, mid-year) by adding new prices of land parcels. After the price map is processed, the municipality is obliged to submit a proposal to the Ministry of Finance of Czechia, which subsequently publishes it in the Price Bulletin. The map is valid for a year, and if prices are stable, the validity may be prolonged. Price maps are published on the web pages of municipalities (as pdf maps or web applications) and are accessible to anyone. Official land price maps serve as the basis for evaluating issues addressed by court experts, banks, and government officials.
Under Act No. 151/1997 Coll. [
47], a land price map is described as a graphical representation of land price and building plots in a municipal territory, with a scale of 1:5000 or a greater level of detail. A detailed description of map creation is given by [
1]: “Building parcels on price maps are valued according to the negotiated prices contained in purchase contracts (base price), although not all parcels can be valued.” In some cases, determining an actual price is not possible, and price is instead determined according to the prices of comparable parcels in the municipality or a similar municipality [
48]. Quoting from [
1]: “The final price of a building parcel is calculated as a multiple of the base price of the group of land to which it belongs and its total area in square meters. The price of the parcel is then increased according to the price of the building(s) located on the parcel and the price of green areas. The price map does not include the prices of agricultural or forested land or water areas. Information about the parcel is taken from the Land Register of Czechia.”
Land price maps have been created in Czechia since 1991 for 54 municipalities, but most municipalities have ceased this activity because of fluctuating prices and the need for frequent updates. Most municipalities in Czechia have created only a few maps (3–5), while only eight municipalities have created over ten price maps. Most of these were published for Ostrava (20), Prague (24), and Olomouc (23). Currently (March 2020), price maps are valid in only five municipalities in Czechia (Olomouc, Ostrava, Zlín, Praha, Most) [
49].
Besides price maps governed by law, unofficial price maps (e.g., [
50,
51,
52]) are also available. These are generally created by real estate agencies, which process them very individually. These maps are used more often, although the data sources and content vary between authors. Data sources are often recorded by real estate agencies from achieved sales or rentals [
52], or only selected prices or price estimations are shown [
51].
Two private land price maps indicating prices from real contracts also exist [
53,
54], but access to these maps requires payment, and the data are not available for downloading. The methodology of the data processing is often unknown or unclear, and historical data are not available. Finally, the validity of these maps is not guaranteed by law and depends only on the quality of processing [
47].
As published in our previous study [
1], only a few authors have performed a detailed analysis of land price at a local level (municipality) [
43,
53]. For this reason, the authors decided to perform an in-depth analysis of land prices of the city of Olomouc. Under this study, official land price maps from 1993 to 2016 were used to describe temporal and spatial relationships and the changes in land prices in Olomouc. The changes were analyzed from three aspects of sustainability: economic, environmental, and social.
The results showed that some macroeconomic indicators had a significant effect on changes in land prices. The changes in land prices were affected by a mixture of economic, demographic, and social indicators. The present authors also concluded that residential and commercial areas in the historical center had significantly higher land prices than other parts of the city. Overall price was dominated by the city’s historical core, and no significant growth in the commercial categories of land use was evident. The land prices for brownfields even showed decreases. Absolute price in residential areas, especially those located in the historical centers, were the highest in the long term. The analysis [
1] also confirmed that land price and its change over time varied according to different spatial aspects. The smallest effect was reflected in the economic aspect. However, price was significantly affected by land quality and its location within or beyond protected urban conservation areas.
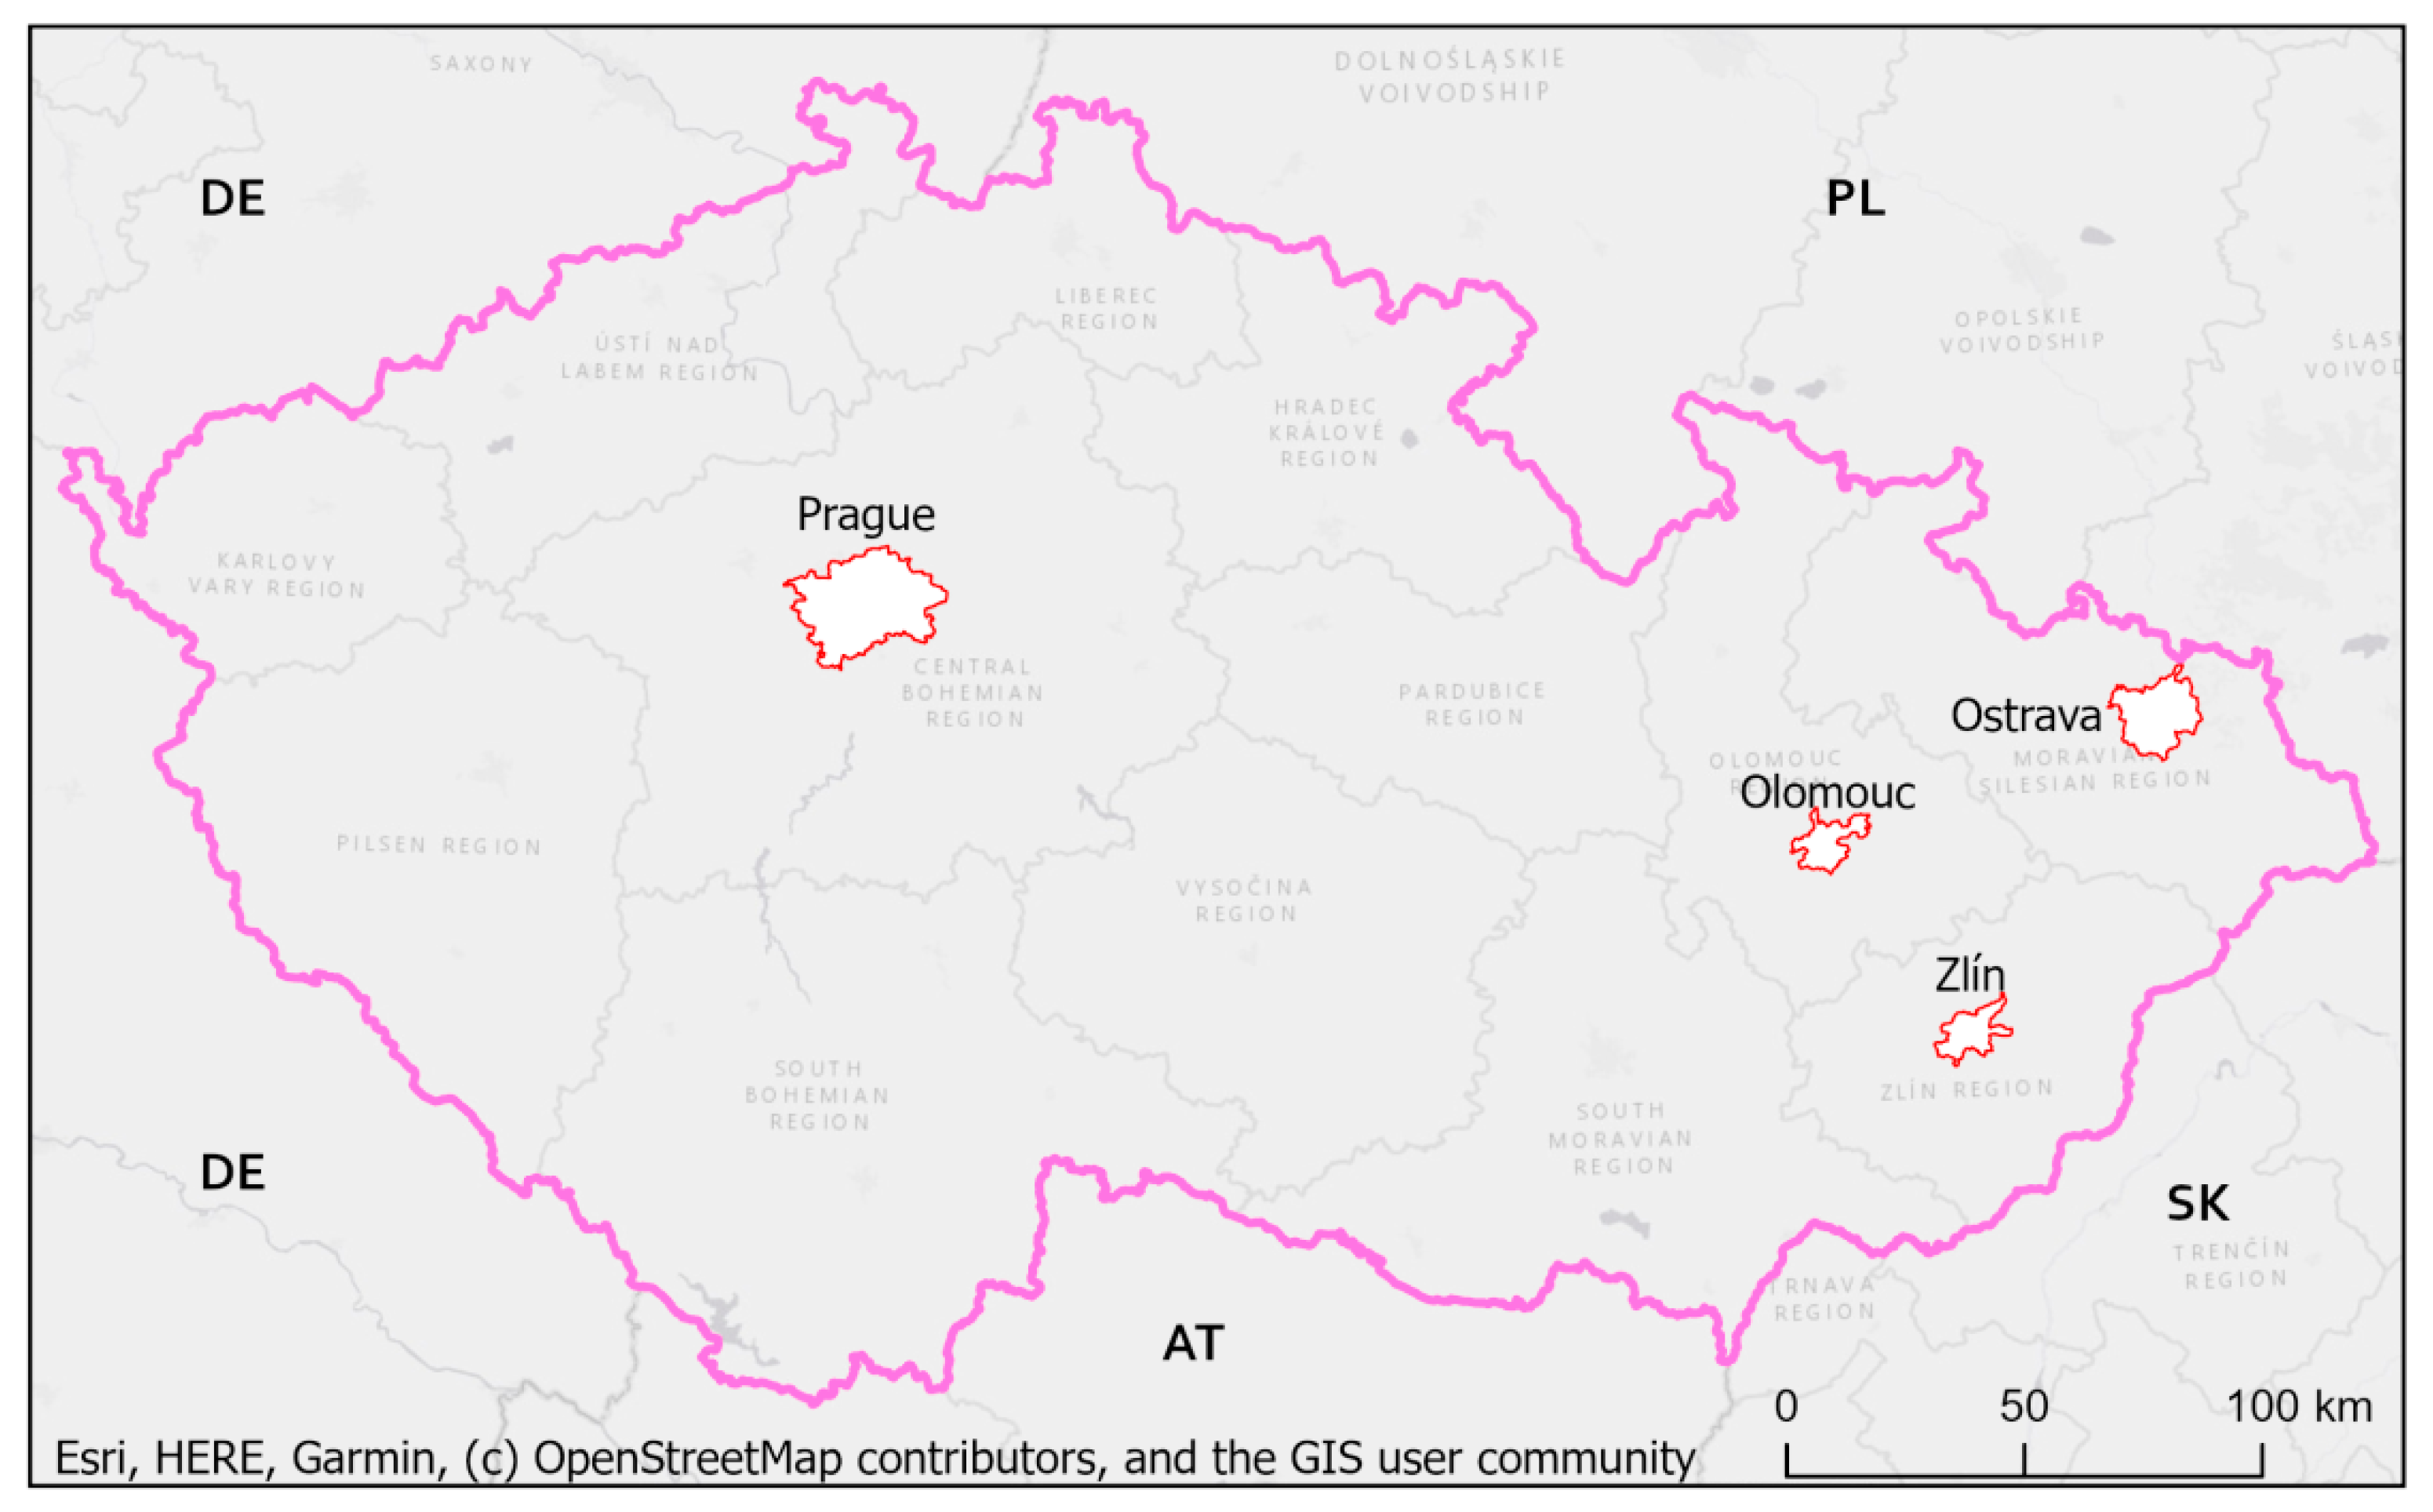
Because the conclusions only concerned an analysis of one city, the present authors extended the previous research to three other cities. The main aim of this new research was to describe the links between land price, land use types, and macroeconomic indicators, and to compare temporal changes of these links in four cities of different size, type, and structure. The main research question addressed whether the conclusions from the previous study were also valid for other cities in Czechia and whether the present authors’ conclusions were valid for cities of different size.
4. Discussion
Land maps have an important role in determining the allocation of land resources for spatial planning and development, especially in large and rapidly developing cities where changes in population and infrastructure occur frequently. In recent years, the real estate market in Czechia has fluctuated wildly, therefore studies examining price maps are topical and beneficial.
A key input aspect in meaningful analysis is the quality of the processed data. As spatial data processing demonstrated, the geometric delimitation of priced land parcels was inaccurate over specific time intervals. As a result, parcels often overlapped in the time–space evaluation. For this reason, many small parcels could not be clearly defined as to whether they were newly delimited and priced parcels or whether they were areas created by geometric inaccuracy. By overlapping layers where some of the parcels were not priced, these missing values were passed onto the output layers and increased the amount of missing data. This fact may have also contributed to the insufficient capture of real trends when the price maps were created. It is therefore necessary to take into account a degree of uncertainty and the quality of the data, which, however, cannot be verified in any way.
The present study demonstrates the importance of price map analyses which focus on the spatial component of data, and also highlights the usefulness of GIS tools. Even simple visualizations of the current state or development in a monitored interval can reveal interesting information and patterns that remain hidden with nonspatial techniques. The authors see the potential for future research in this area by deploying more sophisticated spatial methods in spatial statistics. For example, analyzing spatial autocorrelation and areas of concentration of high or low prices supported by statistical significance could be more precisely defined.
Concerning the spatial data, the research could also benefit from a dataset of selected socioeconomic indicators at a very detailed administrative level, such as basic settlement units. A very detailed spatial analysis of dependencies between land price and a set of socioeconomic indicators could then be performed using, for example, geographically weighted regression [
67]. This technique can model spatial heterogeneity and describe the variation in relationships obtained from the global model in
Section 3.2 in relation to different locations, i.e., different parts of the cities.
A significant benefit of the present study over the original study [
1] is extension of the area of interest, which now covers four cities and allows the validity of results from different types of cities to be verified. In the same manner as Yang [
17], who monitored the variability of the impact of macroeconomic indicators on land prices in Chinese cities, the present research compared the original results of the study on the city of Olomouc with other selected cities. By extending the original study to four selected cities, the authors also encountered problems in comparing the achieved results to the final, inferenced synthetic information, since the monitored cities had very different characters. This difference was most evident for the capital city of Prague, which strongly deviated from others in prices and development. More comparable and generalized results could be achieved by analyzing cities of similar character, size, historical development, and especially spatial structure. However, it should be considered that a comprehensive set of price maps is hardly ever available, and therefore limiting the range of cities that could be potentially analyzed.
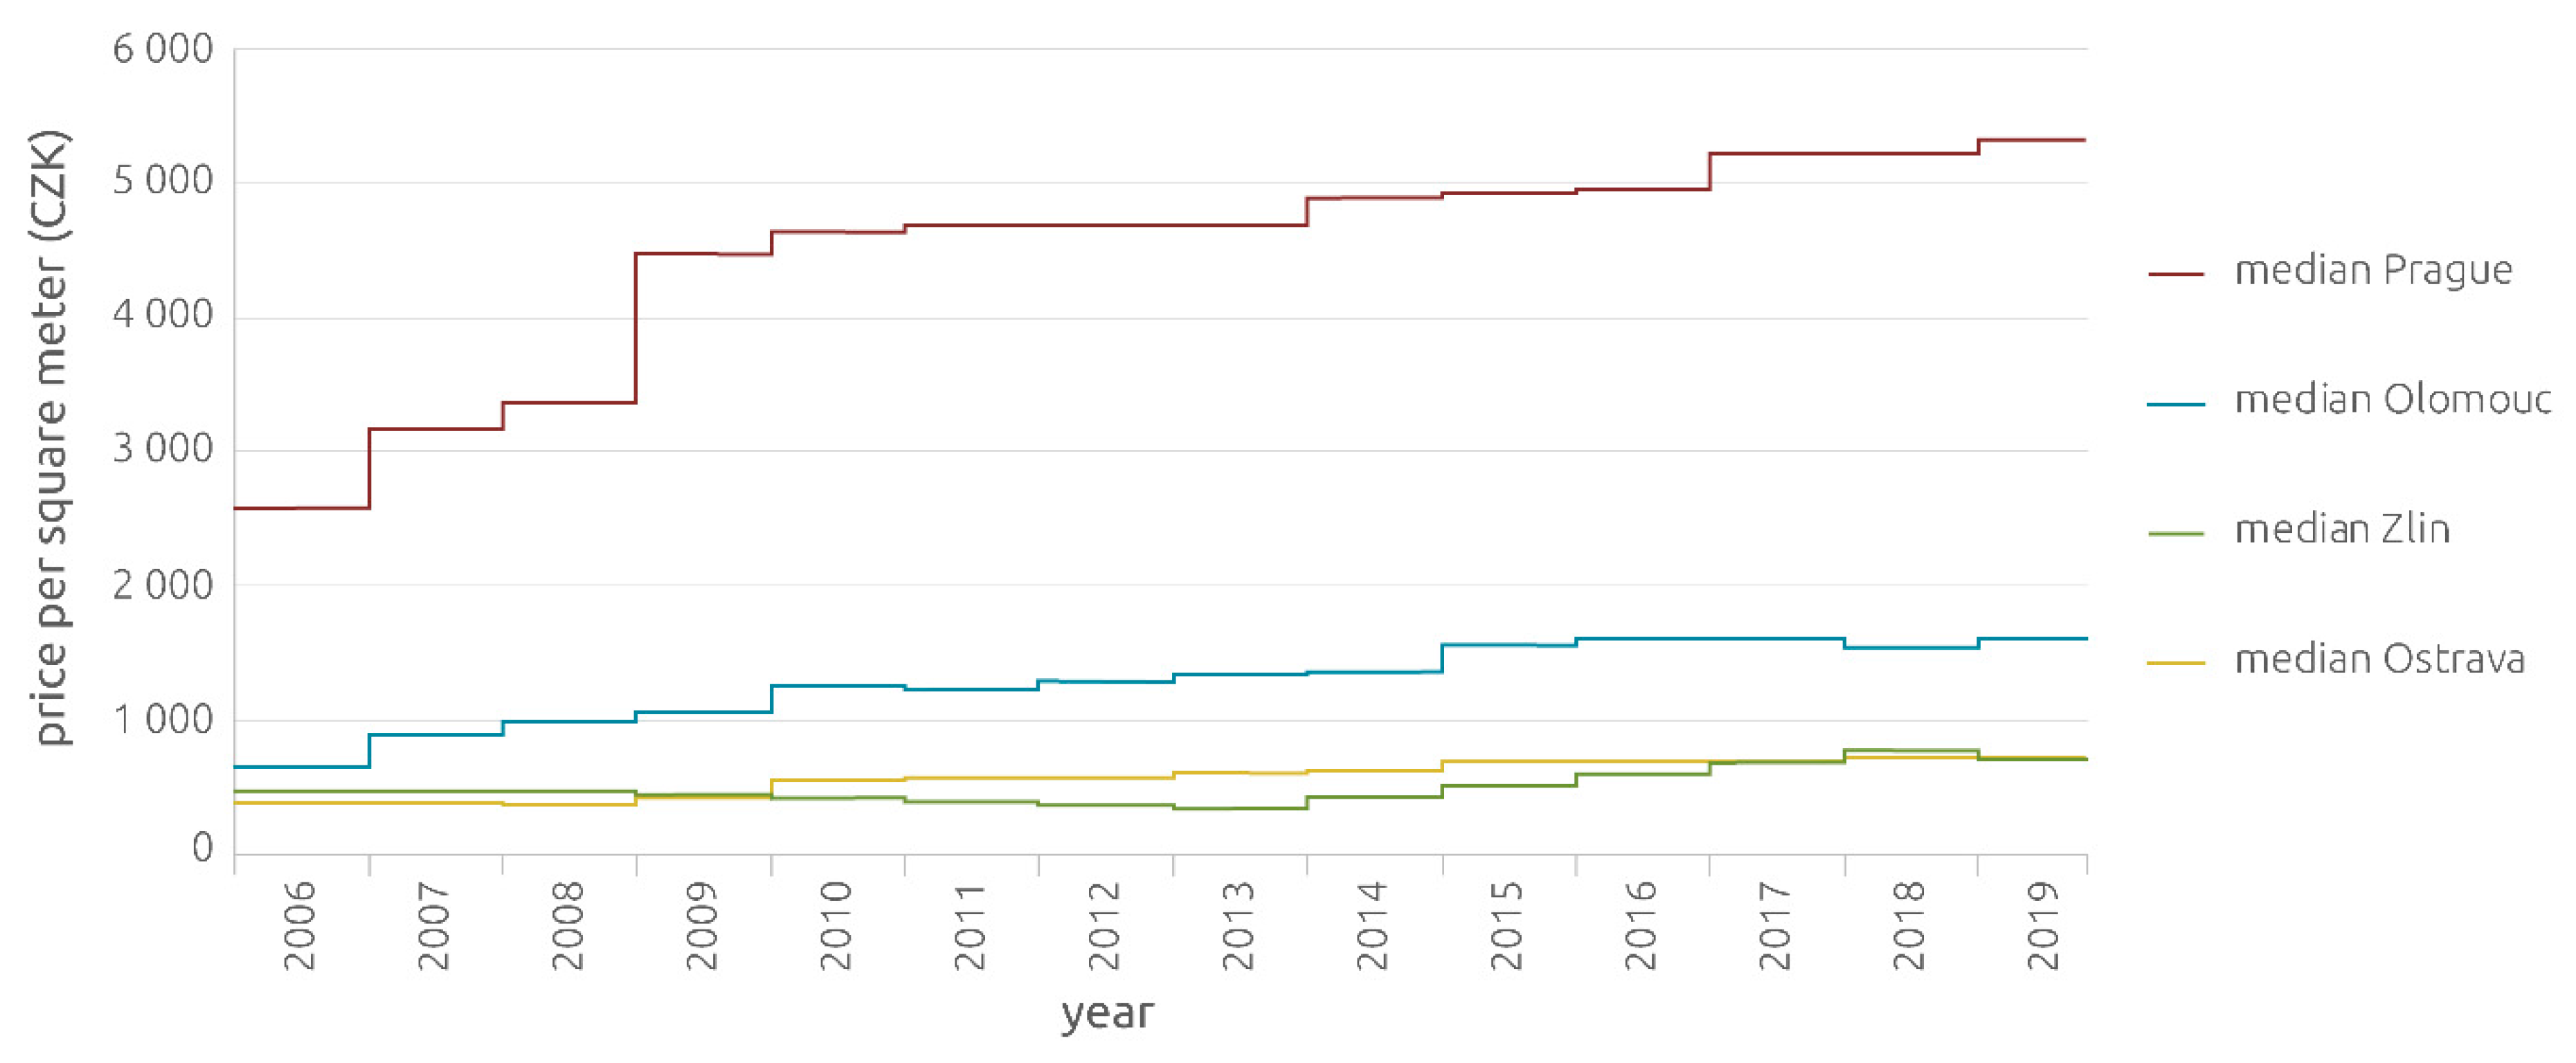
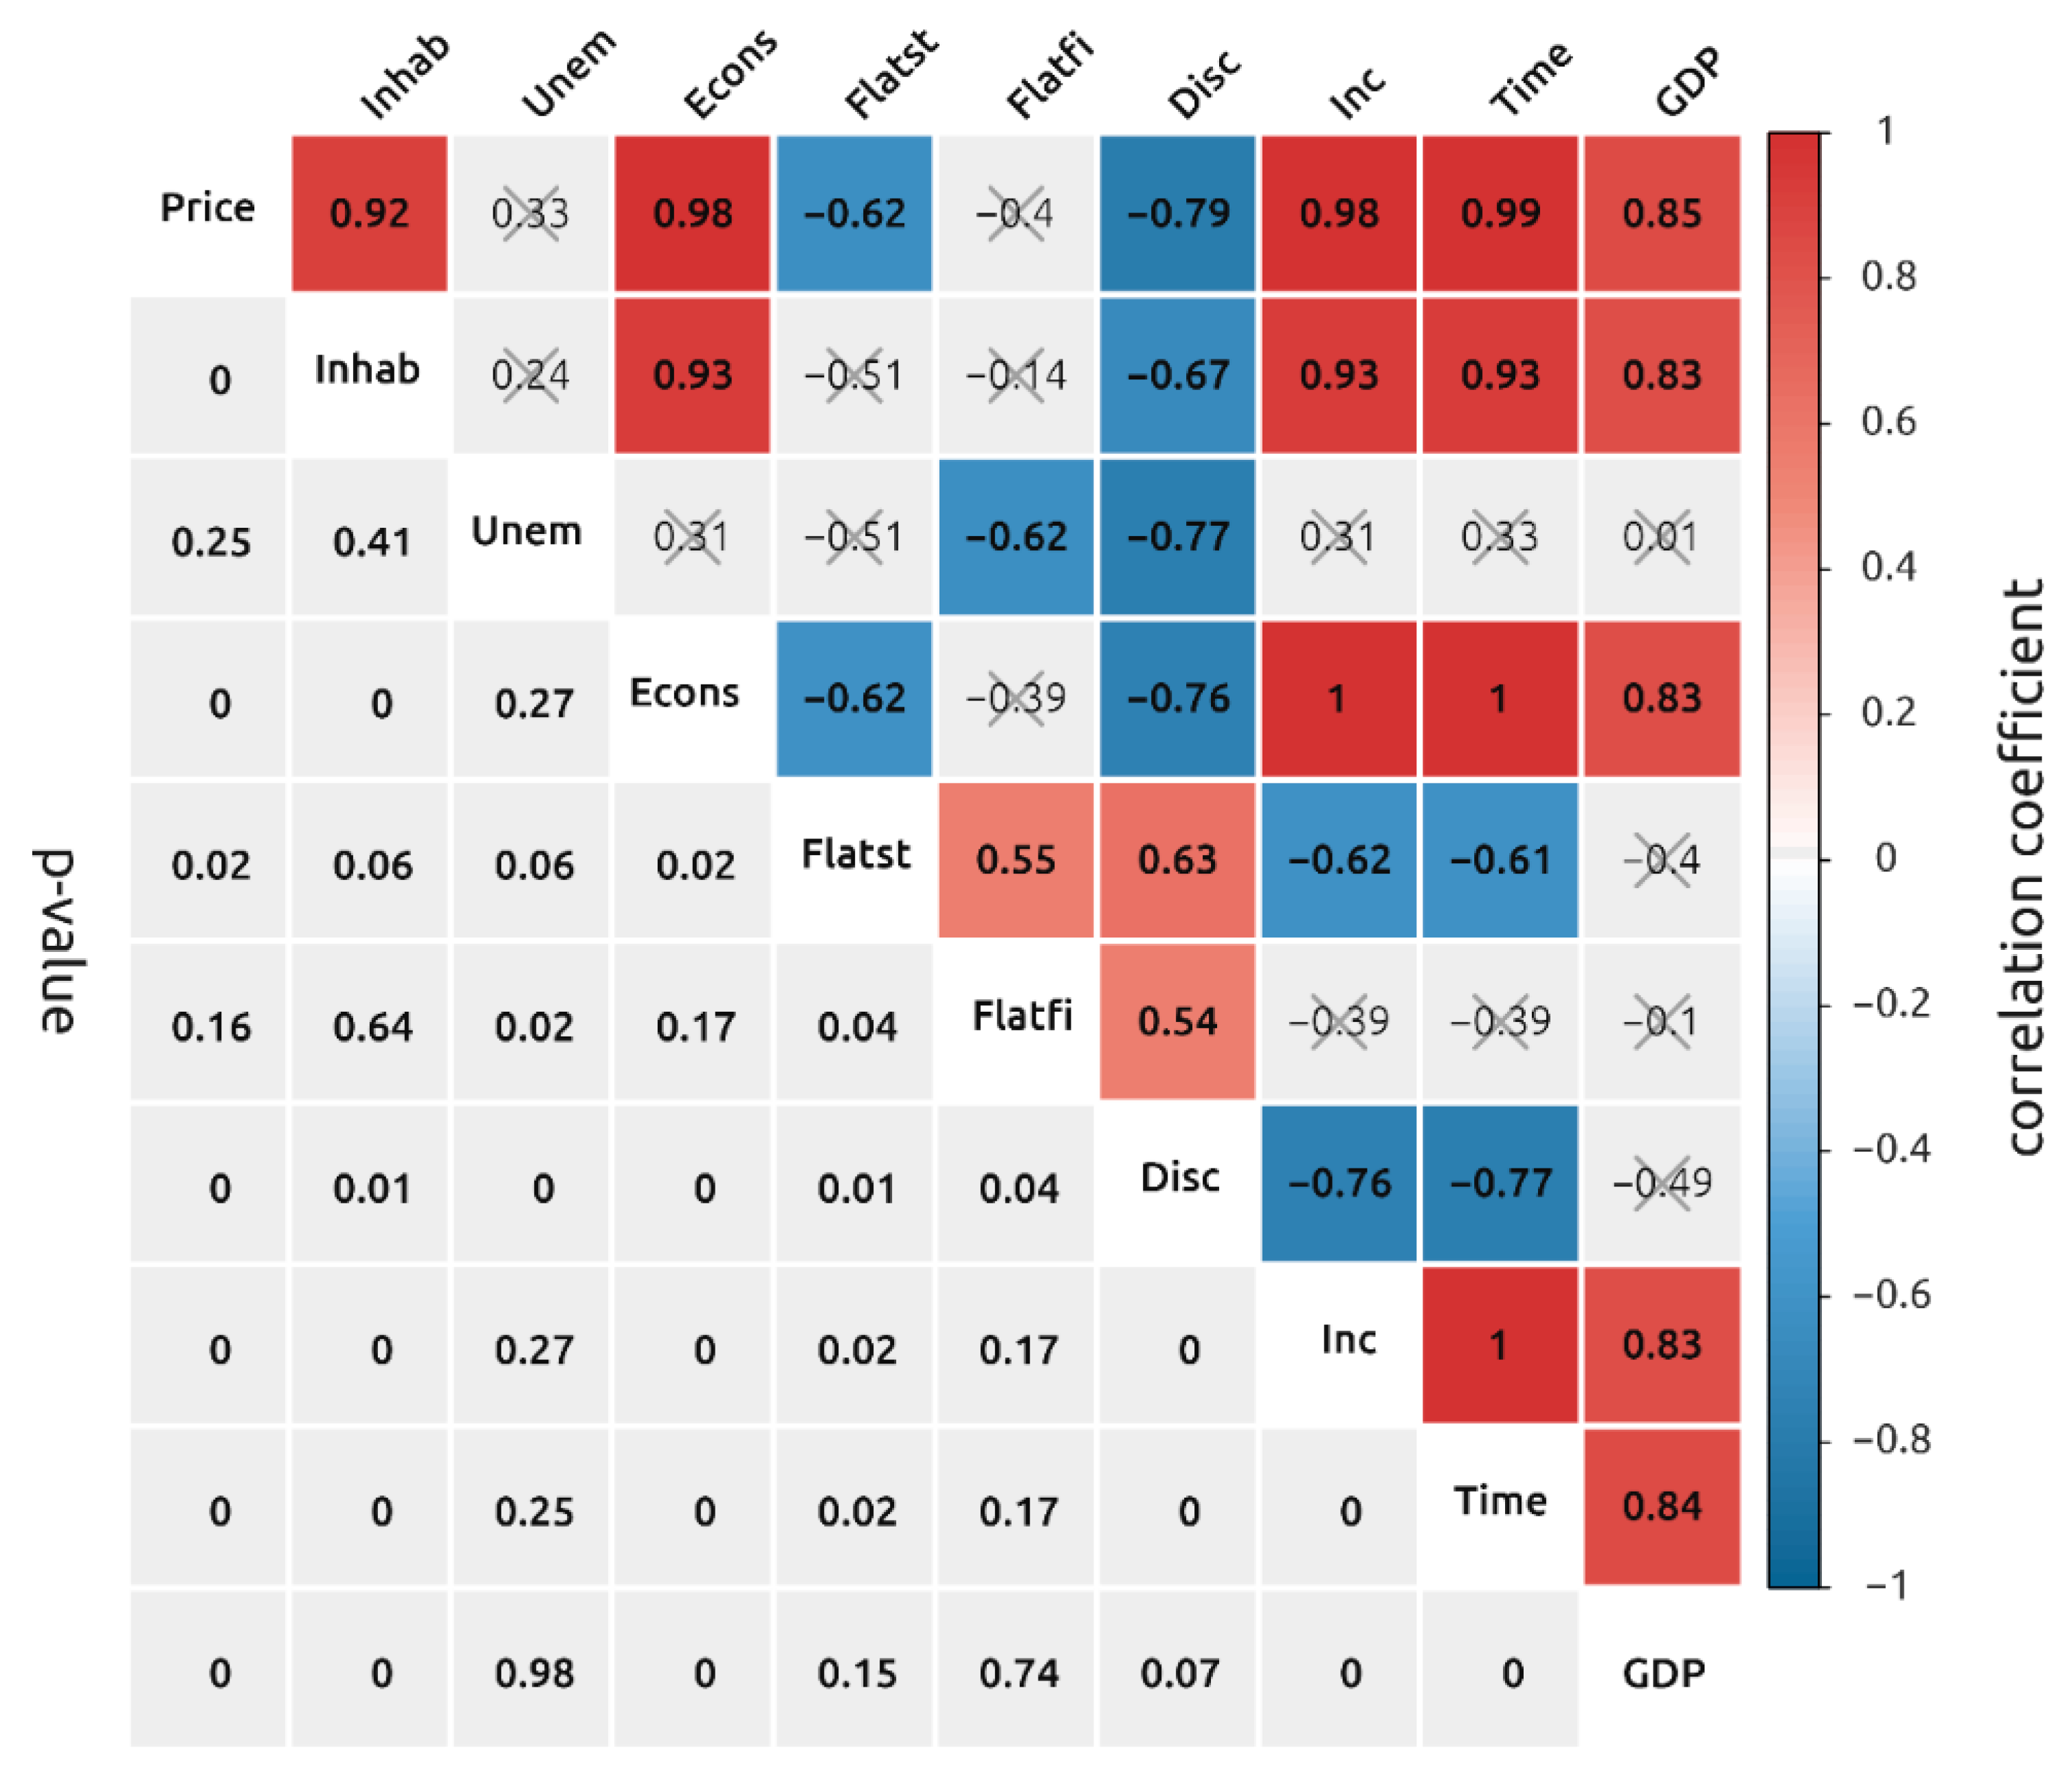
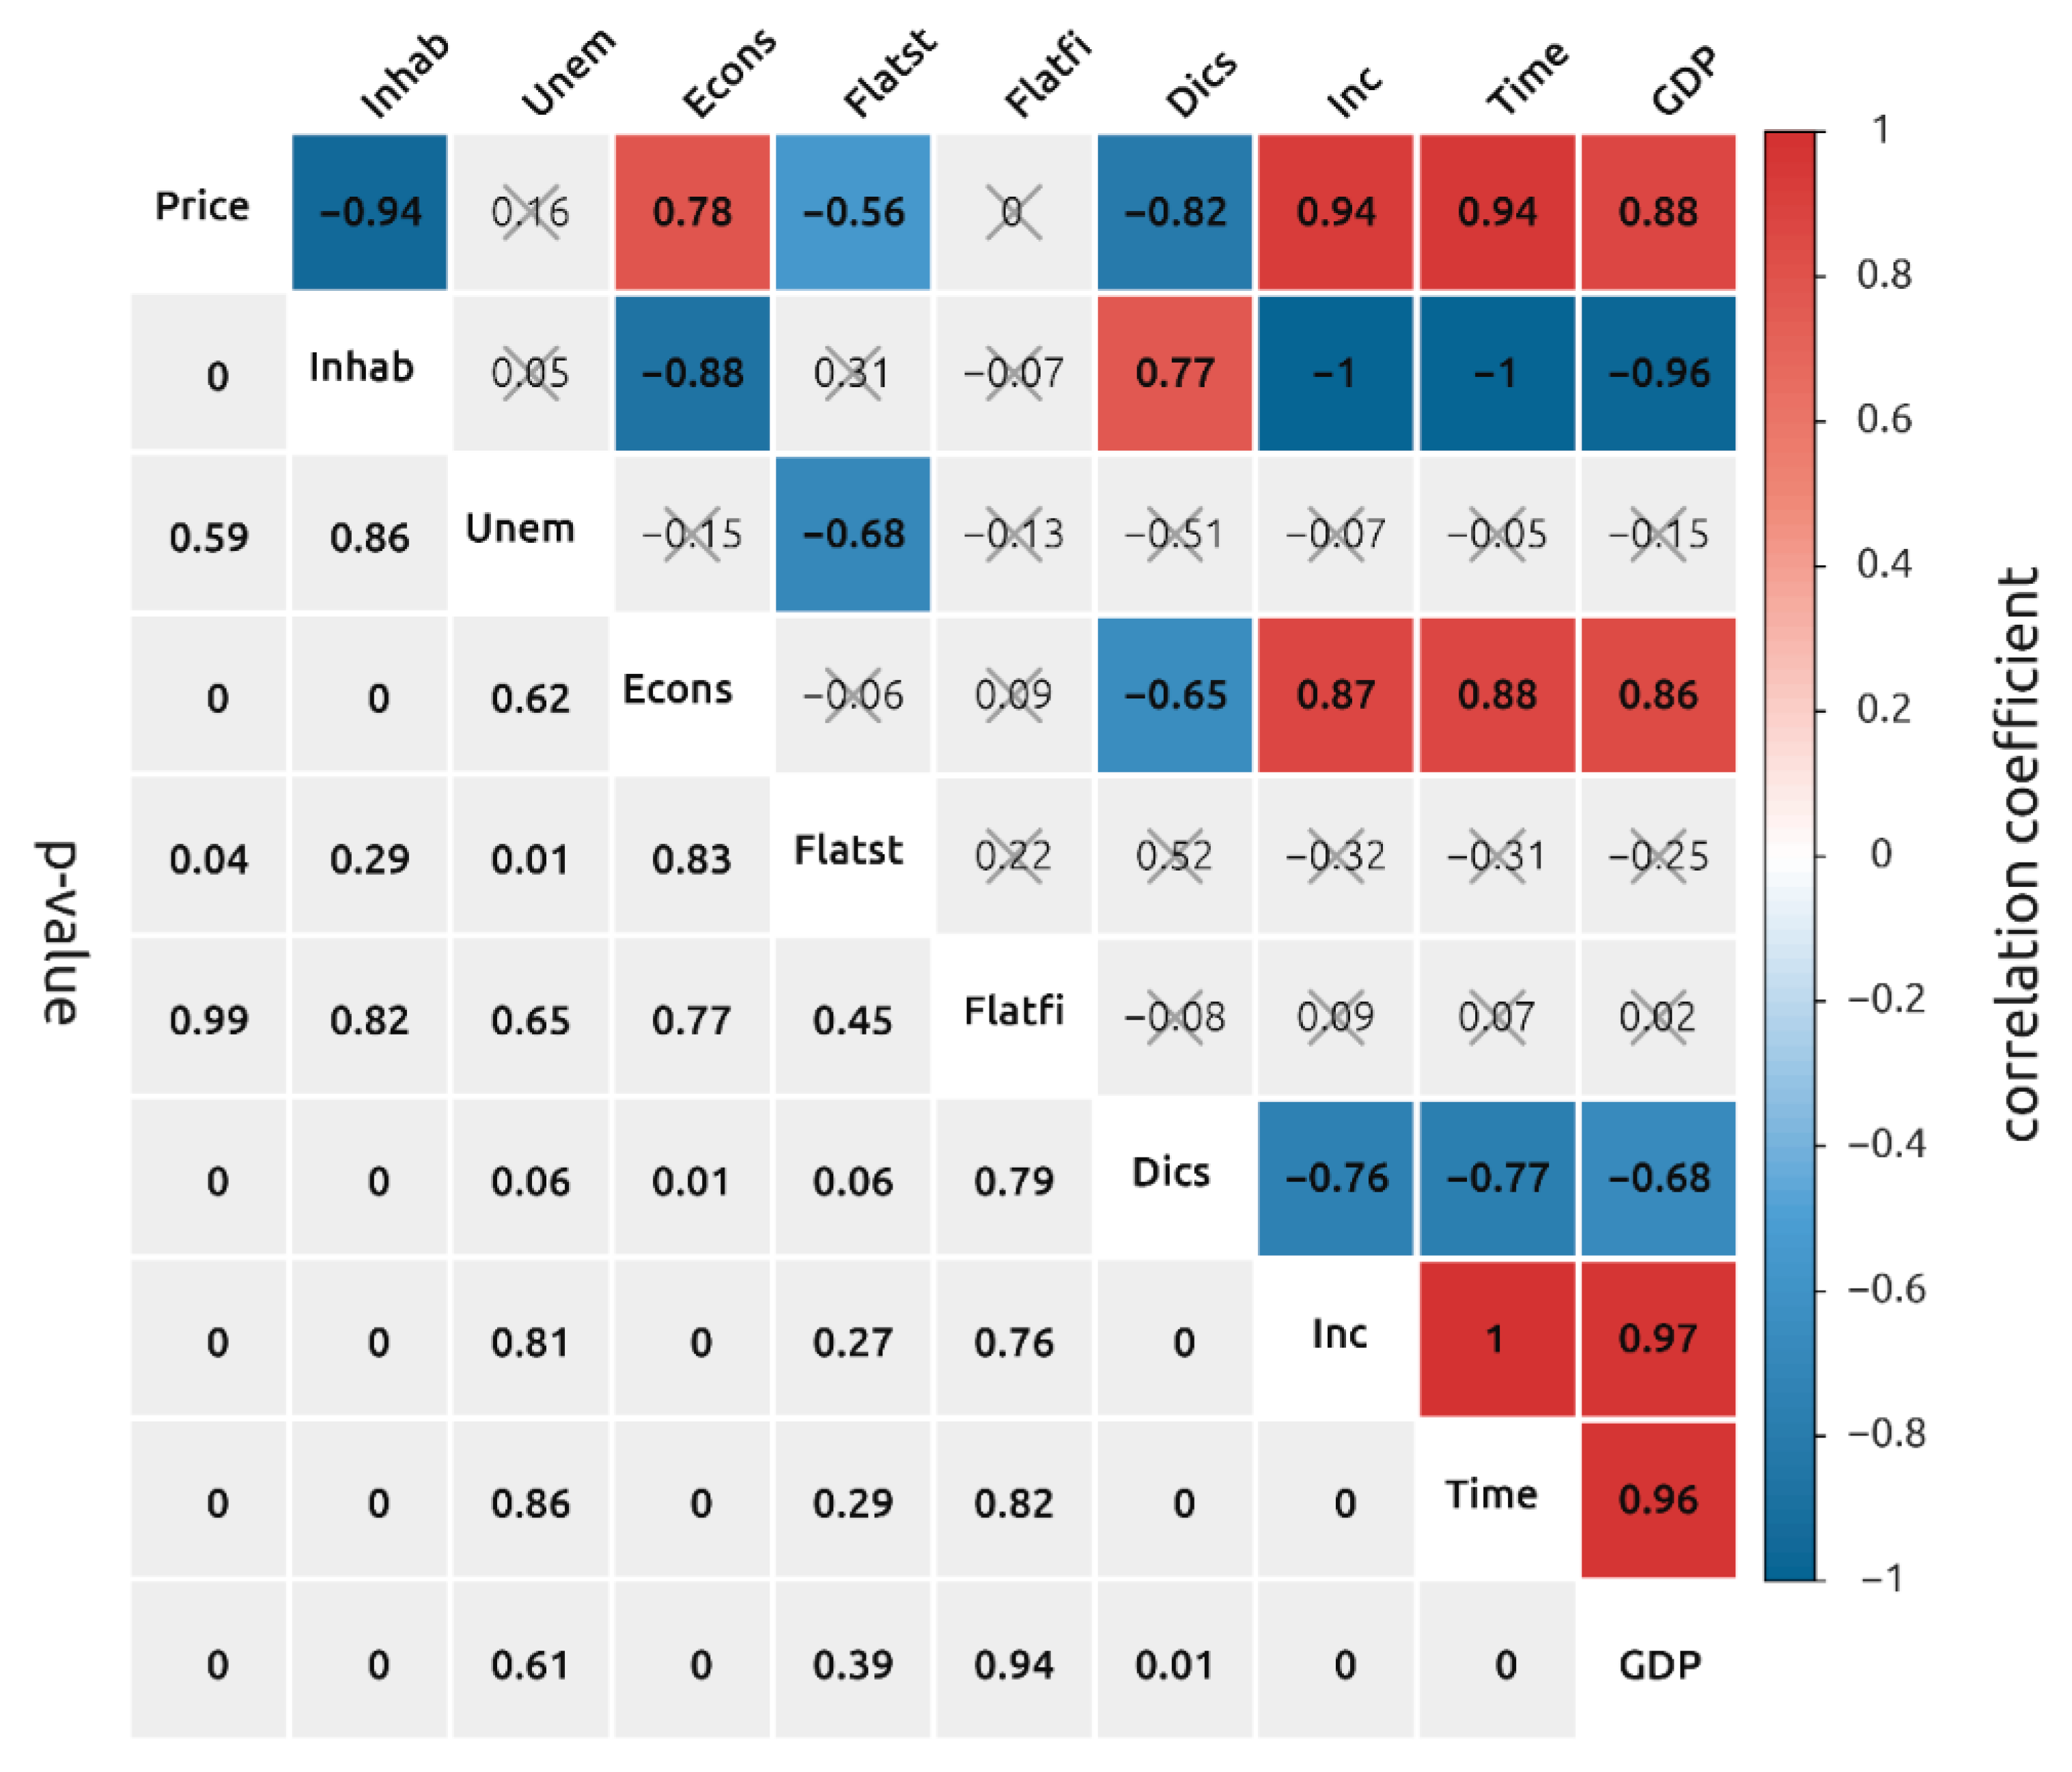
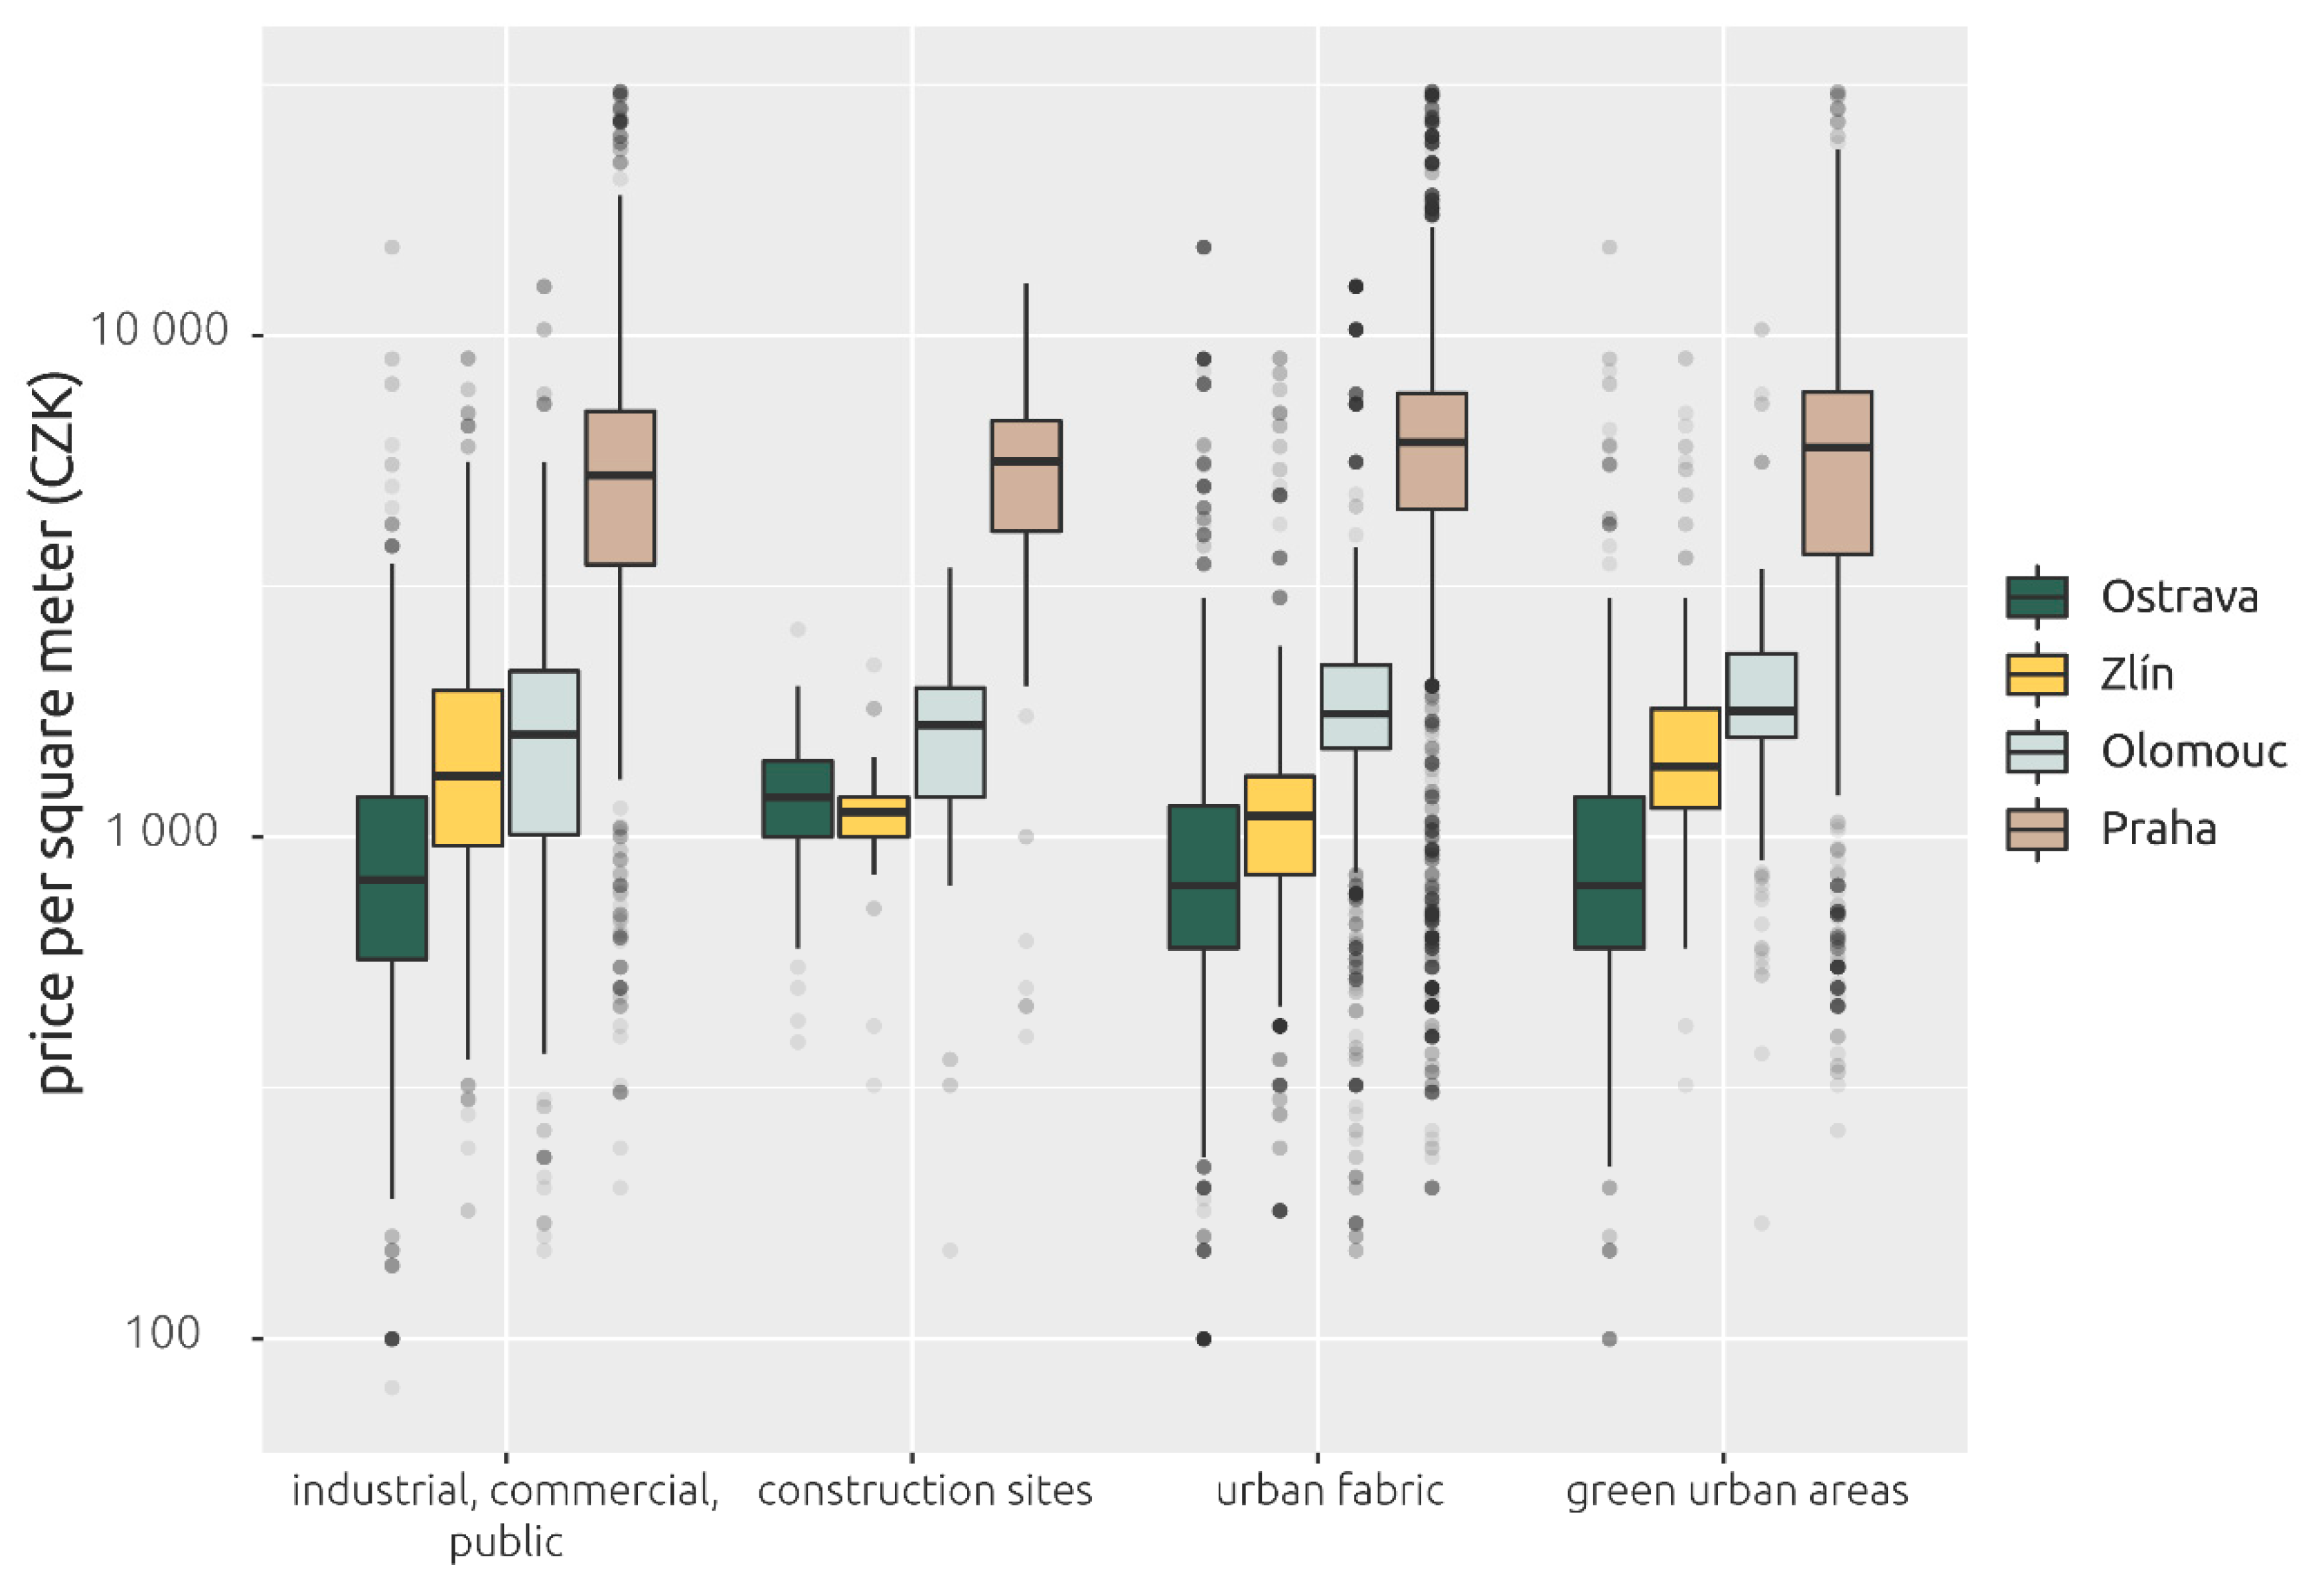
Concerning the temporal development of land prices, in long term period, the price increased in all observed cities. A conclusion from the main statistical and visualization findings is that Prague is clearly the most expensive city regarding land prices. This is unsurprising since it is the capital, and in all terms, it is always fluctuating. More unexpected are the results of a comparison of the other cities, the average prices being lower in Ostrava. Since Ostrava is the third largest city in Czechia in terms of population, higher prices would be expected. However, average salaries in this region are not high, and the unemployment rate is higher than the national average. In case of Zlín, deviating data can be observed due to a significant number of very cheap parcels that distort the static characteristics. The Zlín data are also aggregated over several years and may therefore be more difficult to compare to other data. Looking at the price variance, Olomouc appears to be the most compact, especially in 2006 and other years, and has only several price outliers. Regarding the temporal differences, the monitored time period can be divided into two stages, which have a similar pattern in each city: the first stage (approximately 2006–2010) was characterized by a more rapid price increase. Olomouc has experienced massive growth in real estate prices, along with increased construction of new residential facilities. These conditions are clearly reflected in the city’s land price data. The second stage (approximately 2010–2019) was typified by a stable but less dramatic increase, which may indicate some stabilization in the real estate market. From the economic perspective, the present study and its economic models can illuminate key periods in the economic development of a city. The results showed the differences in a developing city (currently industrial city transforming or rebuilding its center), an academic city, a commercial city, and finally, a capital city. The relationships between economic indicators and land prices differed according to the development stage of each city. From the results, it can be concluded that the number of inhabitants had a positive impact on land prices in Prague and Olomouc. By contrast, Ostrava revealed a different scenario, which may be a consequence of Ostrava’s different character as an industrial city and with industrial buildings located directly in the city’s center. For the observed period, the number of inhabitants decreased, despite new construction of flats. The city therefore appears to be in the process of transformation. Prague as the capital is the richest city in Czechia, which suggests that economic indicators have a greater effect on land price development. Olomouc had the greatest positive effect on land prices from an increasing number of inhabitants. The results of this study proved the results of the previous study [
1], which examined a shorter period.
Concerning the spatial dependencies, we observed no significant differences between the categories in the case of Prague and Olomouc. This may be explained by the vast number of Prague’s land parcels, which demonstrated strong variability in each category and smoothed any differences. An explanation for Olomouc may be the extremely high demand for building parcels over last decade, leading to price equalization in all land use categories.
Future research could explore the economic and income structure of the population in these cities, the temporal changes in this structure, and various economic entities/agents and their behavior [
68], which can influence land price development. Land price can be influenced by several driving factors [
25], including any variable that affects human behavior, such as environmental situations, migration [
26], tourism, gentrification [
27], local culture, economic and financial subjects, land policy, and also interactions between these variables. Economic entities/agents are supposed to be not only inhabitants of cities, but also tourists, investors, hospitals, universities, etc., as described in other scientific studies analyzing land price or land use changes [
21,
25,
28].
Additionally, there are more aspects of land price changes that can be elaborated. In our previous study [
1], we elaborated several environmental factors (like soil quality or floods [
69]), but the data processing for four cities is quite demanding and opens a new challenge for further research. As one of the most important factors affecting the quality of urban land, location conditions have an impact on the urban land price through traffic location and convenience of supporting facilities. The density of the road network in the area and the convenience of traffic nodes, such as main bus stations and rail transits, can affect the urban land price [
21].
5. Conclusions
Land price sustainability is a key aspect that affects city development. The authors of the present research studied four Czech cities (Prague, Ostrava, Olomouc, and Zlín), exploring their spatial and temporal development in relation to dependencies in land price. These maps are very significant documents which contribute to and monitor the real estate market in the larger cities of Czechia. According to our objectives, the authors analyzed the relations between land price and selected macroeconomic indicators, and compared temporal changes. Concerning the question of the relationship between macroeconomic indicators and land prices, the authors’ previous study [
1] concluded that the correct answer was partially affirmative. Some macroeconomic indicators had a significant impact on the changes in land prices in Olomouc in the period 2006–2016, but not in the case of all the observed macroeconomic indicators. The changes in land prices were affected by a mix of economic, demographic, and social indicators. From all the analyzed variables, the most statistically significant were the number of inhabitants (in a positive manner), the number of flats finished (in a negative manner). By comparing the previous results with the results of the current regression analysis and the regression models for Prague, Ostrava, and Olomouc, more general conclusions can be stated. First, the statistically significant variable in each city and model was the number of inhabitants. The effect of this variable was positive, except for Ostrava as an example of a developing city. Discount rate was the second statistically significant variable, and in this case, the effect was negative in each city and model. The group of variables relating to the number of flats finished/started was significant in Prague and Olomouc, with a rather negative effect. The effect and statistical significance of other economic variables varied according to each city, its characteristics, and stage of economic development. These general results supported the results of the authors’ previous case study [
1].
Certain similar patterns in temporal changes can be observed from a spatial point of view in the monitored cities. As observed in the original study of Olomouc, prices rose in most of the priced parcels. The ratio of land area with rising price was very similar in each city (85%–92%). In each city observed, the highest land prices were typically in urban centers. These areas remained the most expensive, but prices rose only gradually. A much more significant increase in prices occurred mainly in peripheral resident areas. However, no clear common pattern emerged, since all of the cities had different characters, sizes, and spatial structures.
In terms of temporal evaluation, the monitored cities experienced different developments. While the average price in the original study of Olomouc gradually increased during the observed period, this growth was not so significant in the case of Zlín and Ostrava, but rather constant and sometimes declined. Prague differed significantly since the growth rate was much faster. Each city indicated stagnation in 2010–2011, likely as a consequence of the global economic crisis in 2009.


