Article

Genetic Diversity of Tulipa alberti and T. greigii Populations from Kazakhstan Based on Application of Expressed Sequence Tag Simple Sequence Repeat Markers

by
Moldir Yermagambetova
1,
Shyryn Almerekova
1,2,
Anna Ivashchenko
3,
Yerlan Turuspekov
1,2 and
Saule Abugalieva
1,2,*
1
Institute of Plant Biology and Biotechnology, Almaty 050040, Kazakhstan
2
Faculty of Biology and Biotechnology, Al-Farabi Kazakh National University, Almaty 050038, Kazakhstan
3
Institute of Zoology, Almaty 050060, Kazakhstan
*
Author to whom correspondence should be addressed.
Plants 2024, 13(18), 2667; https://doi.org/10.3390/plants13182667
Submission received: 26 August 2024 / Revised: 17 September 2024 / Accepted: 18 September 2024 / Published: 23 September 2024
(This article belongs to the Section Plant Genetics, Genomics and Biotechnology)

Abstract

:
The genus Tulipa L., renowned for its ornamental and ecological significance, encompasses a diversity of species primarily concentrated in the Tian Shan and Pamir-Alay Mountain ranges. With its varied landscapes, Kazakhstan harbors 42 Tulipa species, including the endangered Tulipa alberti Regel and Tulipa greigii Regel, which are critical for biodiversity yet face significant threats from human activities. This study aimed to assess these two species’ genetic diversity and population structure using 15 expressed sequence tag simple sequence repeat (EST-SSR) markers. Leaf samples from 423 individuals across 23 natural populations, including 11 populations of T. alberti and 12 populations of T. greigii, were collected and genetically characterized using EST-SSR markers. The results revealed relatively high levels of genetic variation in T. greigii compared to T. alberti. The average number of alleles per locus was 1.9 for T. alberti and 2.8 for T. greigii. AMOVA indicated substantial genetic variation within populations (75% for T. alberti and 77% for T. greigii). The Bayesian analysis of the population structure of the two species indicated an optimal value of K = 3 for both species, splitting all sampled populations into three distinct genetic clusters. Populations with the highest level of genetic diversity were identified in both species. The results underscore the importance of conserving the genetic diversity of Tulipa populations, which can help develop strategies for their preservation in stressed ecological conditions.

1. Introduction

The genus Tulipa L., belonging to the family Liliaceae Juss., is globally recognized for its ornamental and economic significance [1]. Taxonomists estimate that the genus comprises between 40 and 140 species worldwide [2,3,4,5,6,7,8,9,10]. The primary centers of gene diversity for tulips are the Tian Shan and Pamir-Alay Mountain ranges in Central Asia [9,11]. Taxonomically, the genus Tulipa is divided into four subgenera and 12 sections: Clusianae (Baker) Zonn. & Veldkamp (Clusianae section), Orithyia (D. Don) Baker (Orithyia), Tulipa L. (Kolpakowskianae, Multiflorae, Lanatae, Vinistriatae, Spiranthera, Tulipanum, and Tulipa), and Eriostemones (Boiss.) Raamsd (Sylvestres, Biflores, and Saxatiles) [9]. Kazakhstan, characterized by its diverse landscapes and climates, provides a unique habitat for many endemic plant species and is home to 42 species of tulips, which belong to three subgenera: Orithyia (1 section, 3 species), Tulipa (5 sections, 23 species), and Eriostemones (3 sections, 16 species) [12].
Recently, plastid genome sequences have been extensively utilized for species identification and to elucidate molecular plant taxonomy [13,14]. The number of studies on the phylogenetic analysis of Tulipa species using nucleotide sequences of the complete plastid genome has increased considerably [15,16]. However, despite these efforts, the taxonomy of the genus remains largely unresolved [10].
Two important species from the Vinistriatae section of the Tulipa subgenus, Tulipa greigii Regel and Tulipa alberti Regel, are listed in the Red Book of Kazakhstan [17]. These species thrive in the mountainous regions of Kazakhstan, where they have adapted to specific ecological conditions. However, mass collections for bouquets, excessive grazing, plowing of land, and digging of bulbs pose significant threats to their natural populations in Kazakhstan [17]. Understanding the genetic diversity of these tulip populations is crucial for developing effective conservation strategies.
T. alberti is endemic to Kazakhstan, where it inhabits the gravelly and stony slopes found in the foothills and low dry mountains of Sirdarya Karatau, Chu-Ili mountains, Betpakdala, the southwestern spurs of the Zhetysu Alatau, and the western part of the Ili Alatau mountains with sparse vegetation [12]. According to the Red Book of Kazakhstan, this species is considered rare and is classified under category II [17]. T. greigii is native to Kazakhstan, Kyrgyzstan, Tajikistan, Uzbekistan, and Iran, usually as single specimens and occasionally in small groups [18,19]. In Kazakhstan, the species is found on the clay and gravelly slopes of the lower mountain ranges in the western and parts of the northern Tian Shan mountains [12]. T. greigii is classified as a species with declining numbers, listed under category III in the Red Book of Kazakhstan [17]. E. Regel first described the species T. alberti in 1876 and T. greigii in 1873, based on specimens collected from the Karatau Mountains [12]. T. alberti has high ornamental value and shows great potential for landscape planting and rock gardens [12,17]. T. greigii is highly valued and widely used in breeding [12]. Its petals and seed pods are used in traditional medicine, and so are its edible bulbs [12]. Despite the importance of these species, their genetic diversity has not yet been assessed.
Genetic diversity is a crucial aspect of biodiversity and is the foundation for ecosystem and species diversity [20]. Investigating genetic diversity in plant populations is vital for various scientific, ecological, and practical purposes [21]. Furthermore, understanding the genetic diversity of endangered species populations can offer valuable insights for enhancing conservation efforts and optimizing the use of plant resources [22]. Molecular markers can offer valuable insights, especially in research focused on the genetic diversity and population structure of rare and endangered plant species [23]. Among molecular markers, expressed sequence tag simple sequence repeats (EST-SSRs) are widely used markers in population genetic studies [24,25,26]. EST-SSRs are highly transferable across different plant species [27]. They are extensively employed in genetic mapping [28,29] and in evaluating genetic diversity in populations [30,31,32,33,34]. Previous molecular characterizations of the genetic diversity of Tulipa populations have employed various markers, including random amplified polymorphic DNA (RAPD) for 10 species of Tulipa [35], inter-simple sequence repeat (ISSR) for 39 Tulipa accessions [36], single nucleotide polymorphisms (SNPs) for 72 tulip accessions [37], and EST-SSRs for 36 wild and cultivated tulip accessions [38]. Despite the importance of the studied Tulipa species and advancements in molecular genetics technology, information about their genetic variation and population genetic structure remains limited.
This study used 15 EST-SSR markers [38,39] to assess the genetic diversity of T. alberti and T. greigii populations in Kazakhstan. By analyzing genetic markers across multiple populations, we elucidated the levels of genetic variation and identified populations with relatively high diversity. This research enhances our scientific understanding and supports the future preservation activities for these species in their natural habitats.

2. Results

2.1. Polymorphism of Tested EST-SSR Markers

A total of 11 populations of T. alberti and 12 populations of T. greigii were genotyped using 15 EST-SSR markers. The genotyping revealed that 9 of the 15 EST-SSRs were polymorphic in the T. alberti populations, while 13 showed polymorphism in the T. greigii populations. Fifty-two alleles were identified by analyzing 423 samples from 23 populations using 13 EST-SSR markers (Table S1). The number of alleles (Na) per marker varied between three and six, averaging four alleles per locus. The Ca-8508 marker produced the highest number of alleles (six), whereas the markers Ca-6950, Ca-7862, Ca-13333, Kn-2291, and Kn-30956 each generated the lowest number of alleles, with three alleles each. The fragment of the digital electrophoresis for the most polymorphic marker, Ca-8508, is presented in Figure S1. The effective number of alleles ranged between 1.3 (Ca-7862) and 3 (Ca-8508), averaging 1.9. The average genetic diversity (Nei) measured was 0.387. The Shannon diversity index (I) for the studied loci ranged from 0.203 (Ca-7862) to 1.182 (Ca-8508), with an average of 0.608. The average polymorphism information content (PIC) value was 0.560, ranging from 0.195 (Ca-7862) to 0.748 (Ca-8508) (Table 1).

2.2. Genetic Diversity in the Collected Populations of Tulipa alberti and Tulipa greigii

The average number of alleles (Na) identified in the 13 EST-SSR polymorphic loci in the 23 study populations was 2.4. The range was from 1.6 (populations 4 and 8 of T. alberti) to 3.4 (population 4 of T. greigii). The average number of alleles was 1.9 for T. alberti populations and 2.8 for T. greigii populations. The effective alleles (Ne) ranged from 1.4 for population 4 of T. alberti to 2.7 for population 1 of T. greigii, averaging 1.9. The polymorphic loci percentage (PPL) averaged 74.6%, varying from 59.4% in T. alberti populations to 88.5% in T. greigii populations. Nei’s genetic diversity index (h) averaged 0.387, with values ranging from 0.205 in population 8 to 0.353 in population 7 for T. alberti and from 0.318 in population 8 to 0.609 in population 1 for T. greigii. The populations of T. greigii exhibited the highest average h value of 0.487, while T. alberti populations had an average index of 0.277. The highest average values for the Ne (2.2) and PPL (88.5%) indices were observed in T. greigii populations (Table 2).

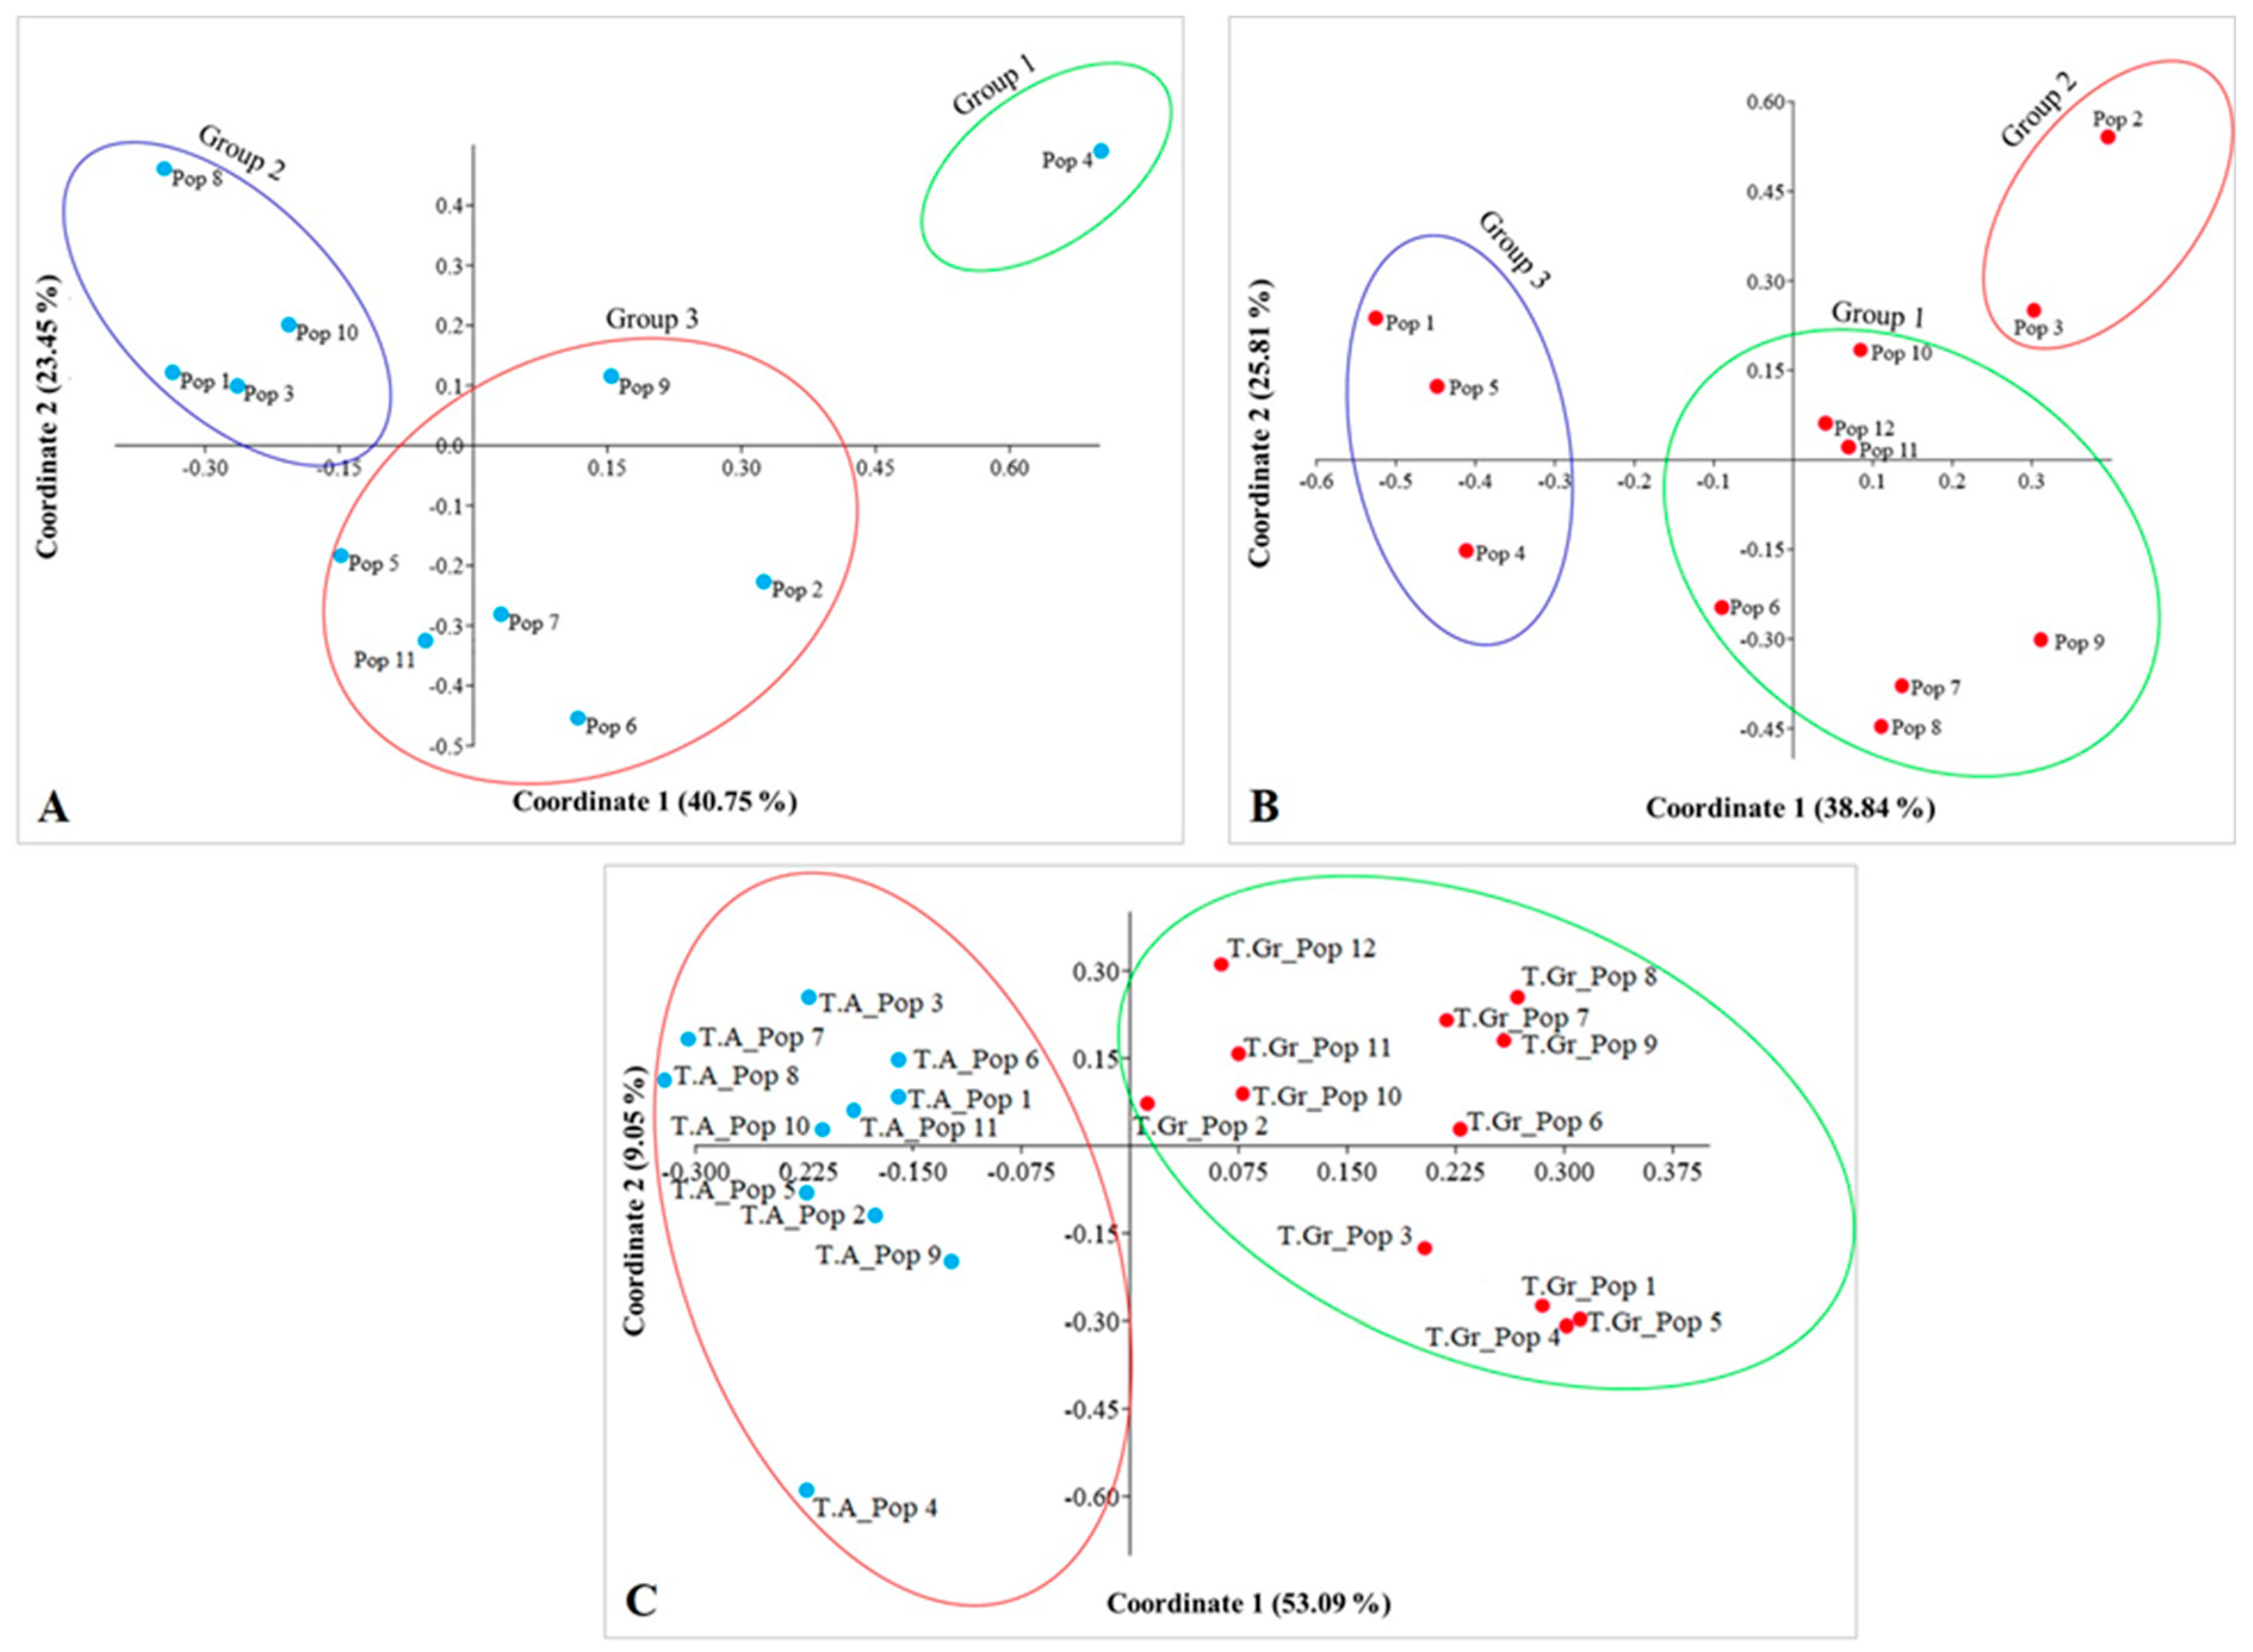
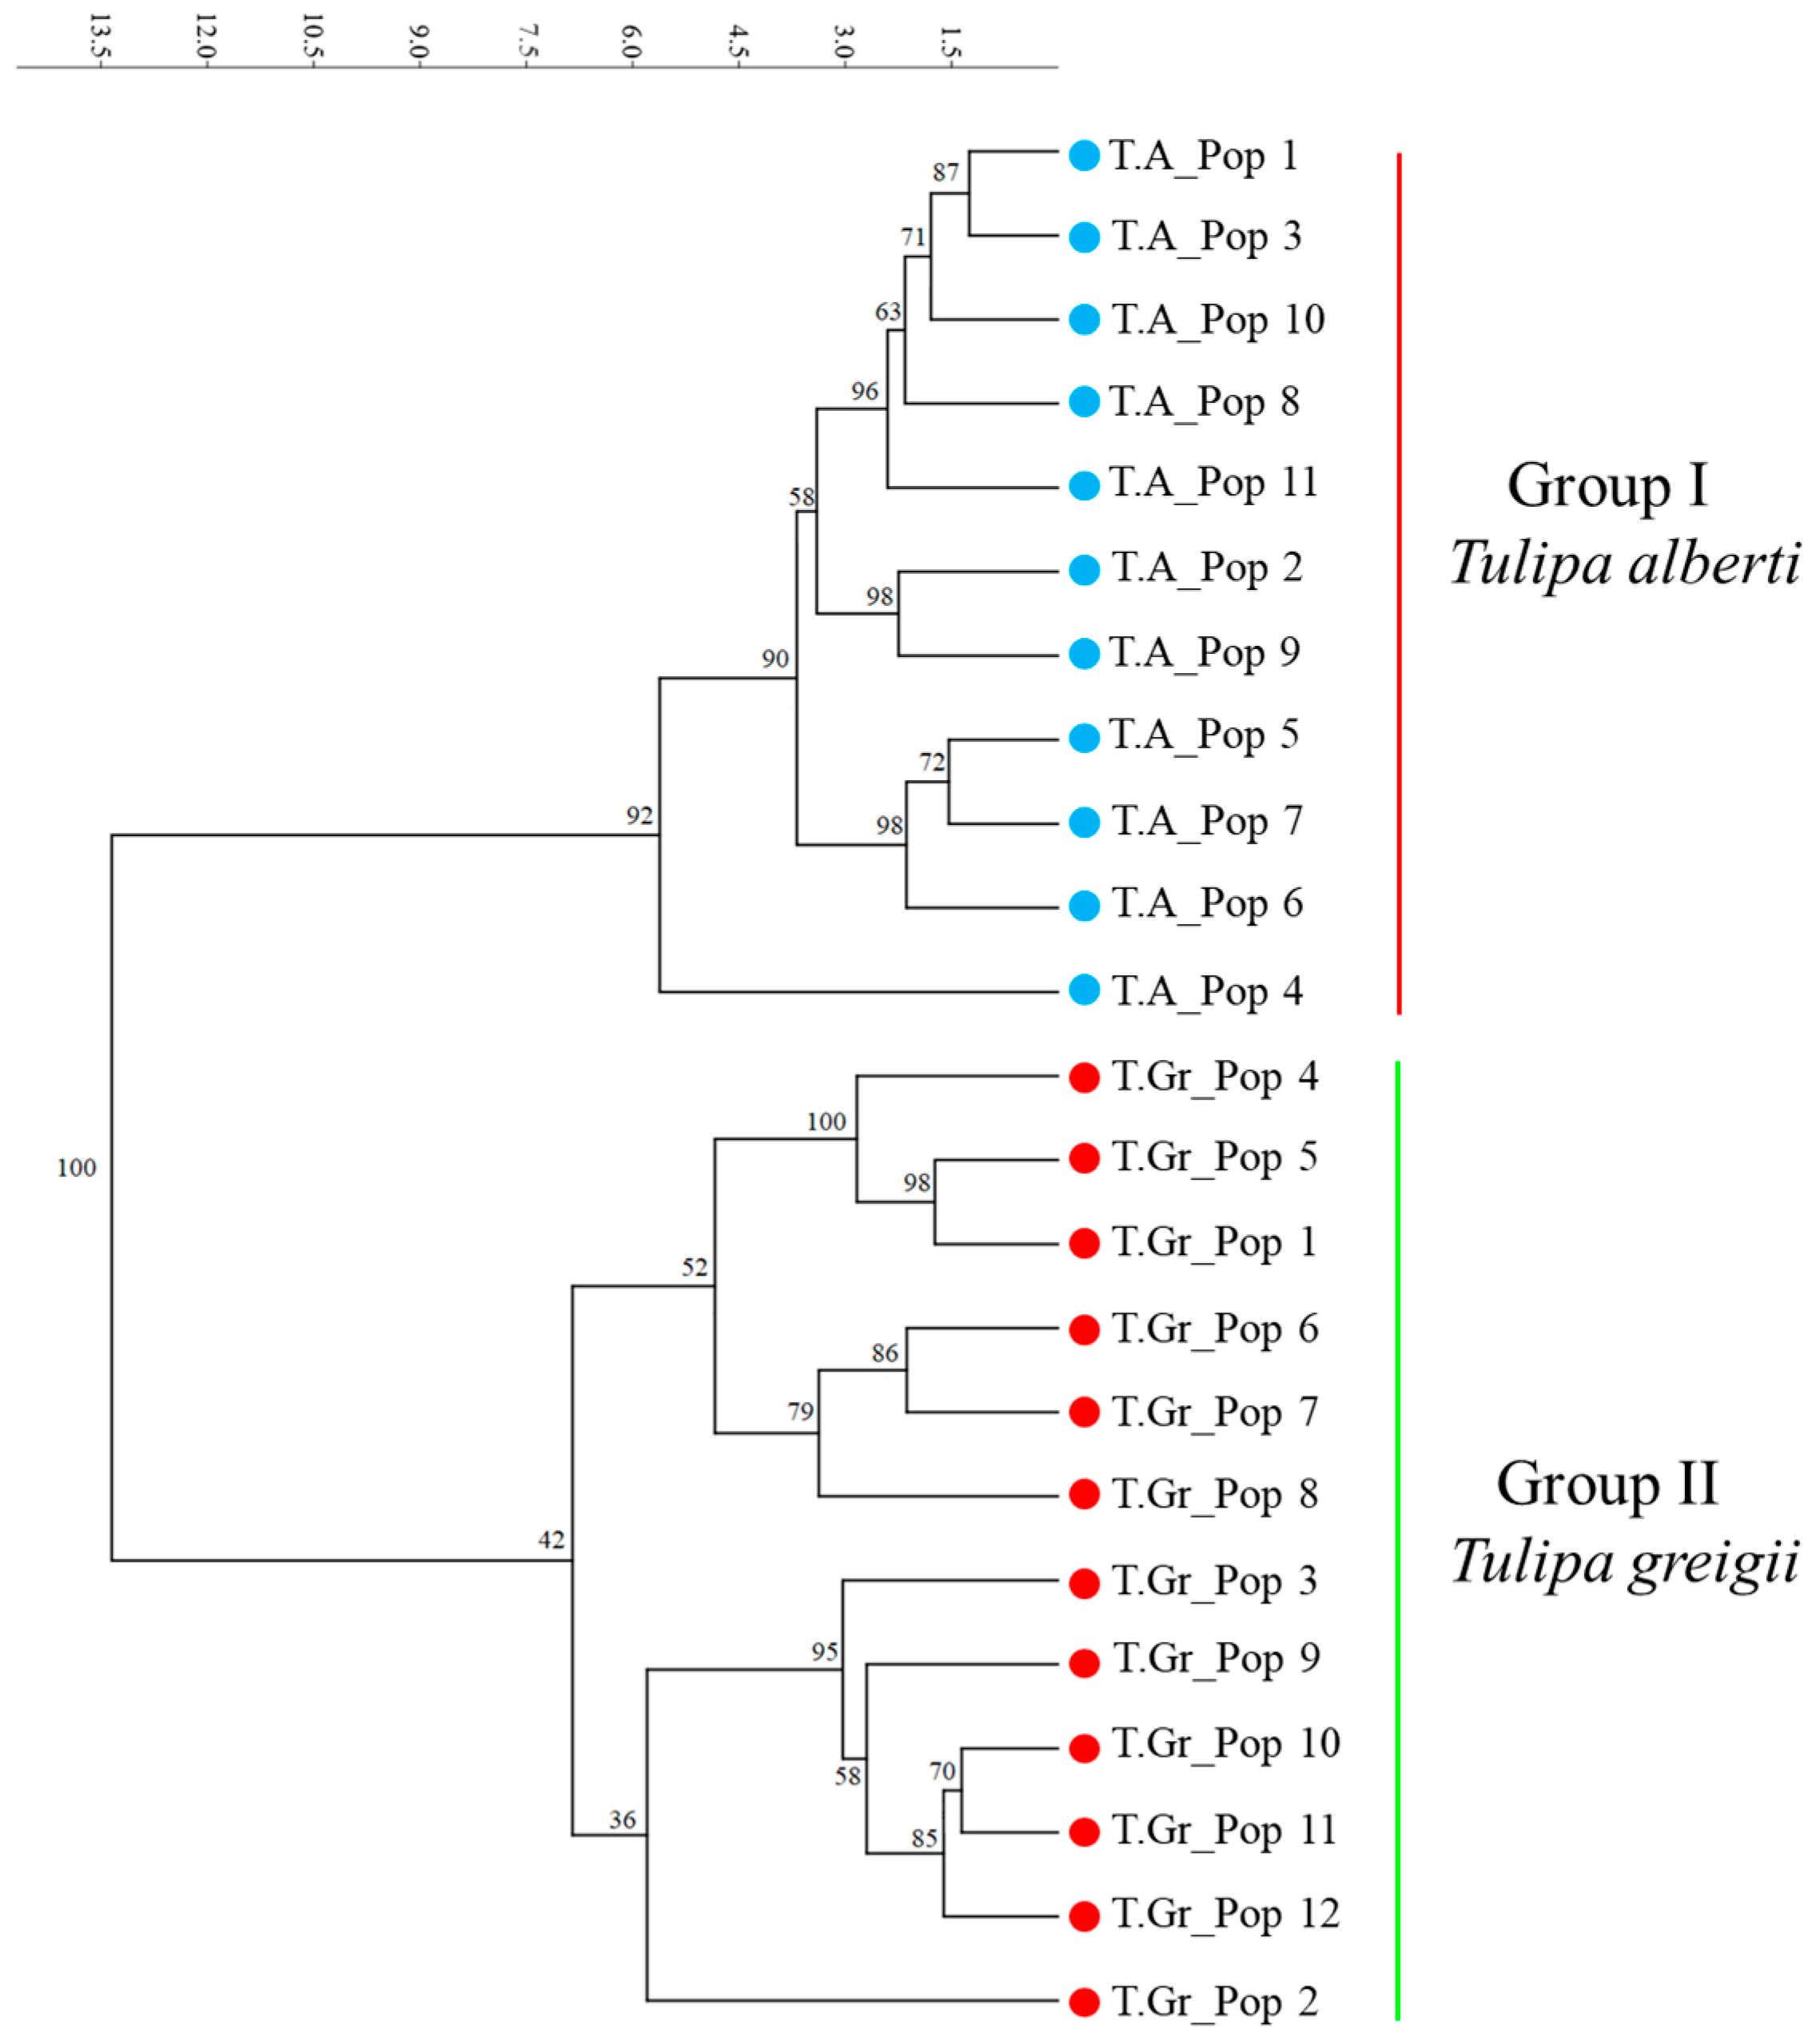
2.3. Genetic Differentiation and Gene Flow among Populations of Tulipa alberti and Tulipa greigii Species

The analysis of molecular variance (AMOVA) results for the T. alberti populations indicated 25% differentiation among populations, aligning with the PhiPT value of 0.248, and 75% of the genetic variation was found within a population. The gene flow (Nm) was calculated at 0.746 migrants per generation. Analysis was carried out using Fisher’s exact test, treating p-values ≤ 0.05 as statistically significant and producing a significant p-value (p < 0.001). The genetic diversity in T. greigii was partitioned as 77% within and 23% among populations. The Nm was 1.283 migrants per generation. The PhiPT differentiation index for T. greigii was measured at 0.234, demonstrating significant differentiation among populations (Table 3).
The AMOVA results for the total genetic diversity of the two species suggested that 26% of the total genetic variation was among populations and 74% within a population. The PhiPT differentiation index was 0.259, correlating significantly with the percentage of variation observed among the populations. The total gene flow across the two species populations amounted to 1.428 migrants per generation (Table 3).

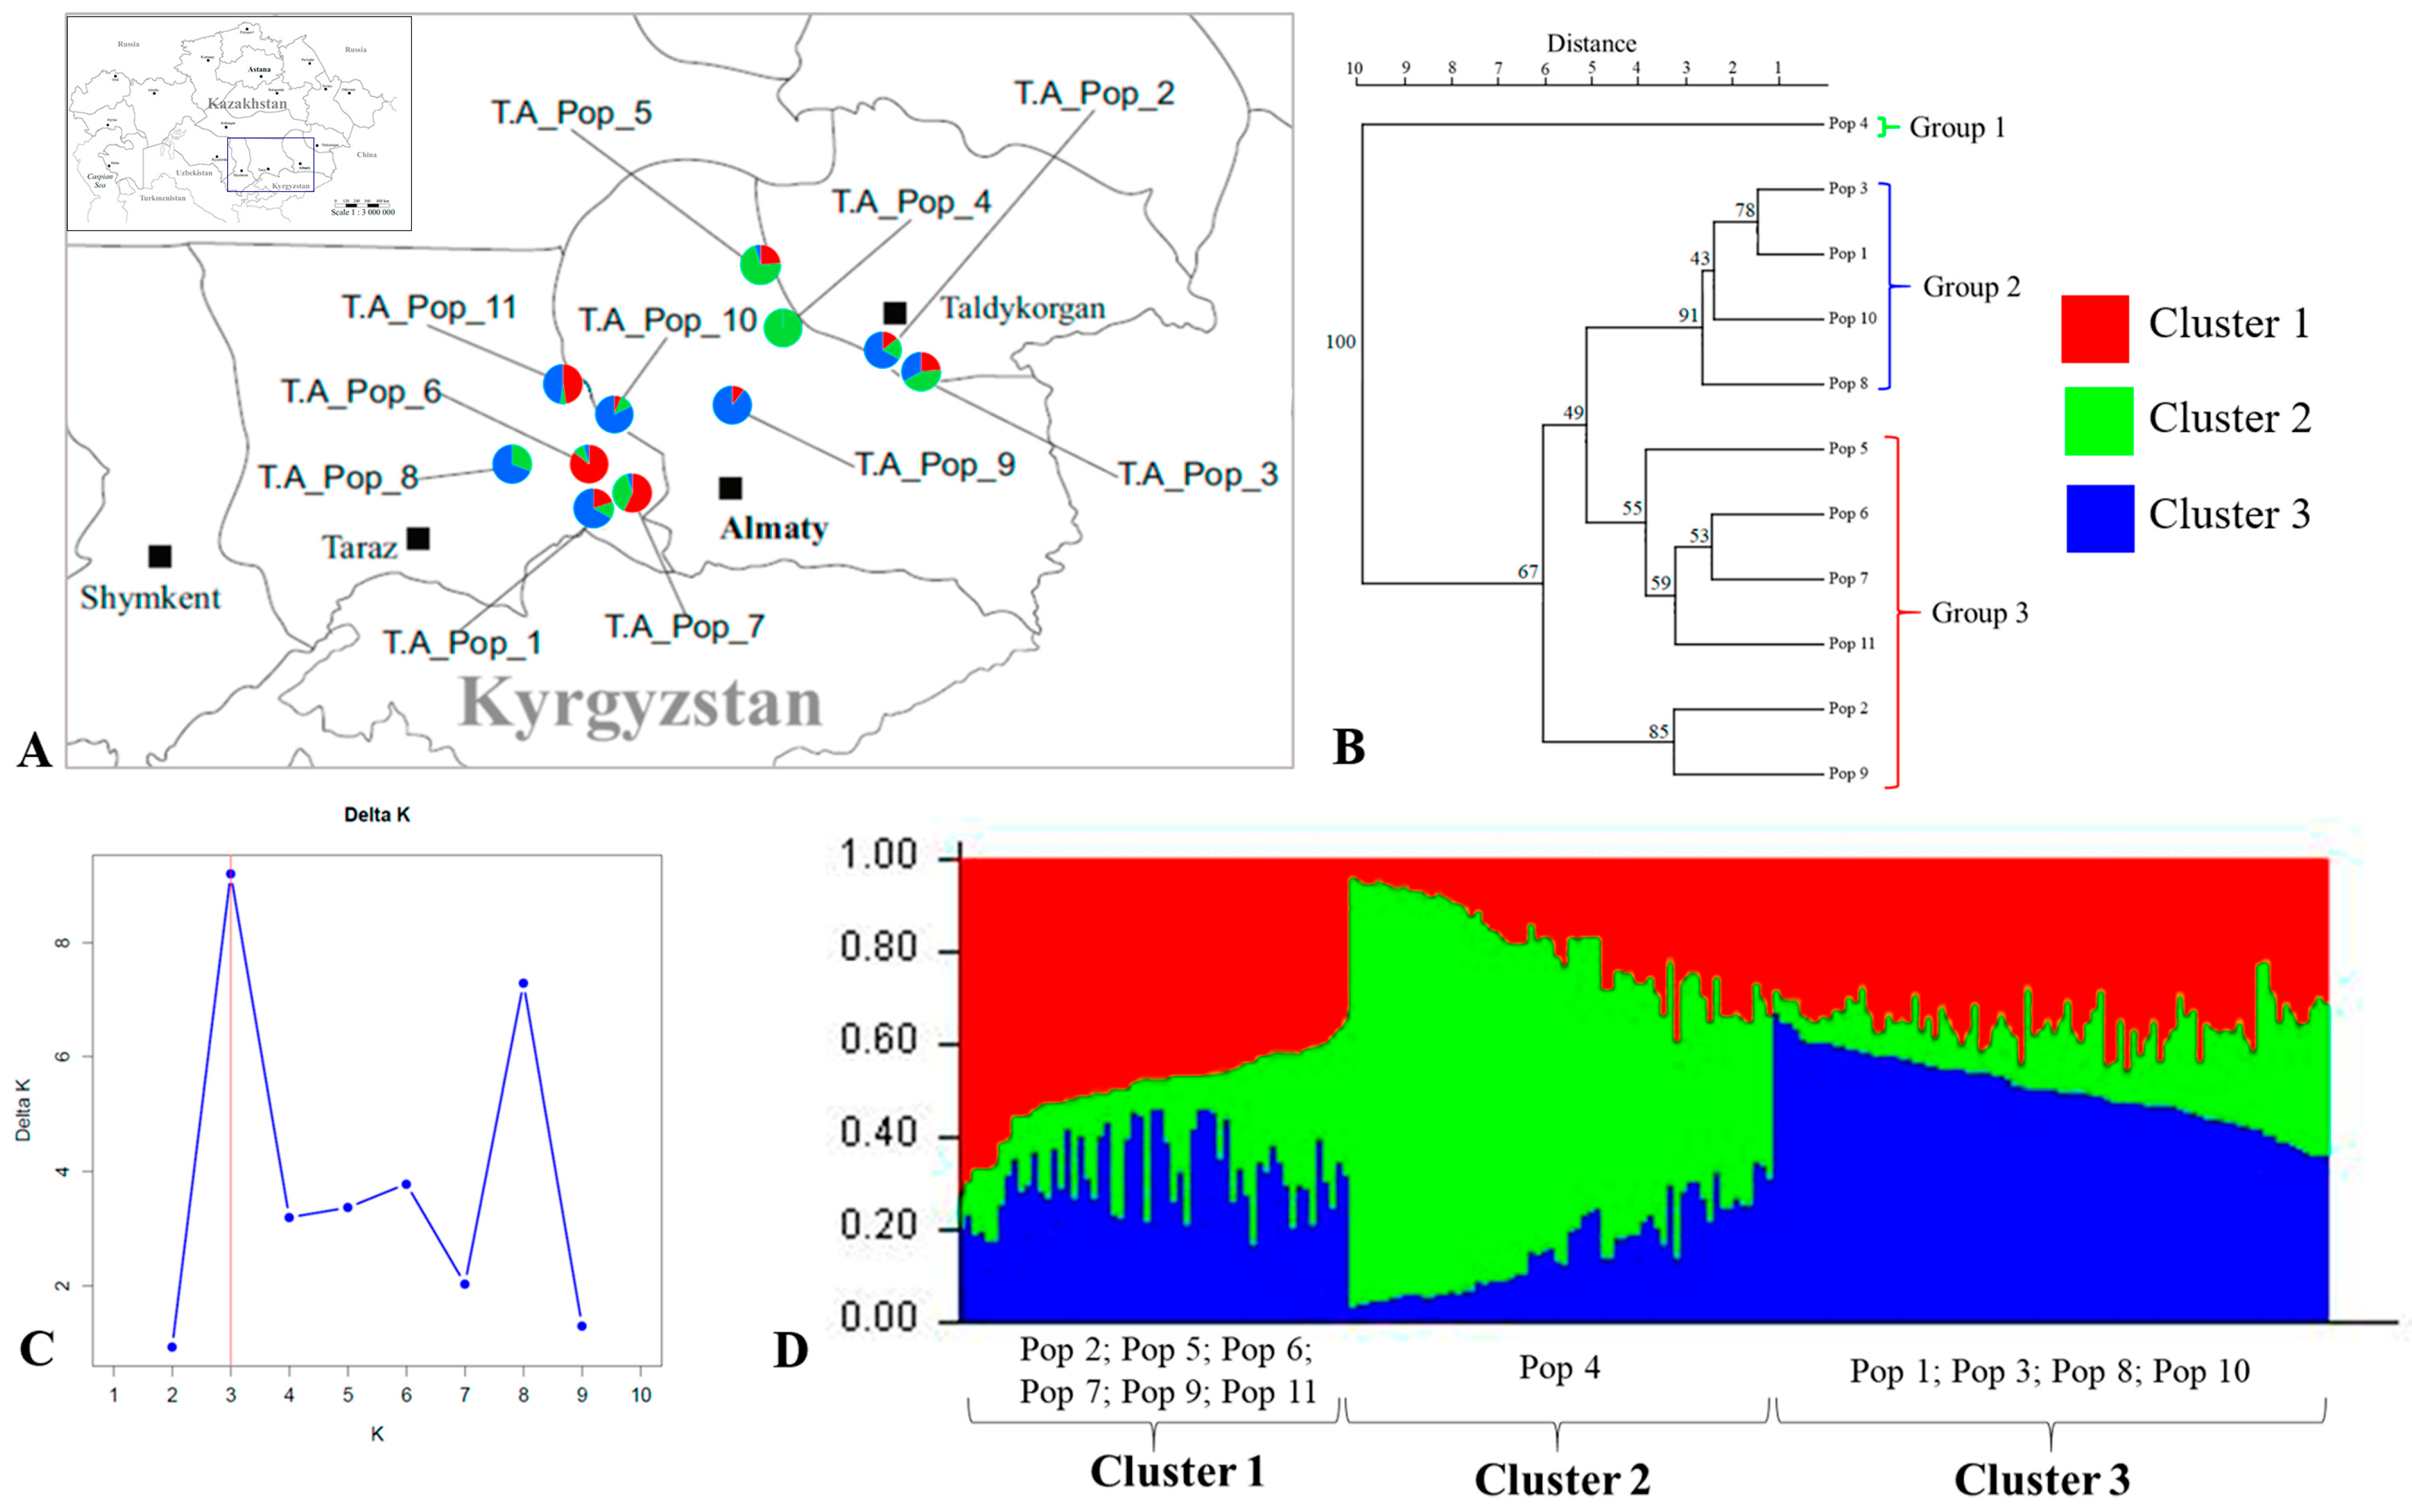
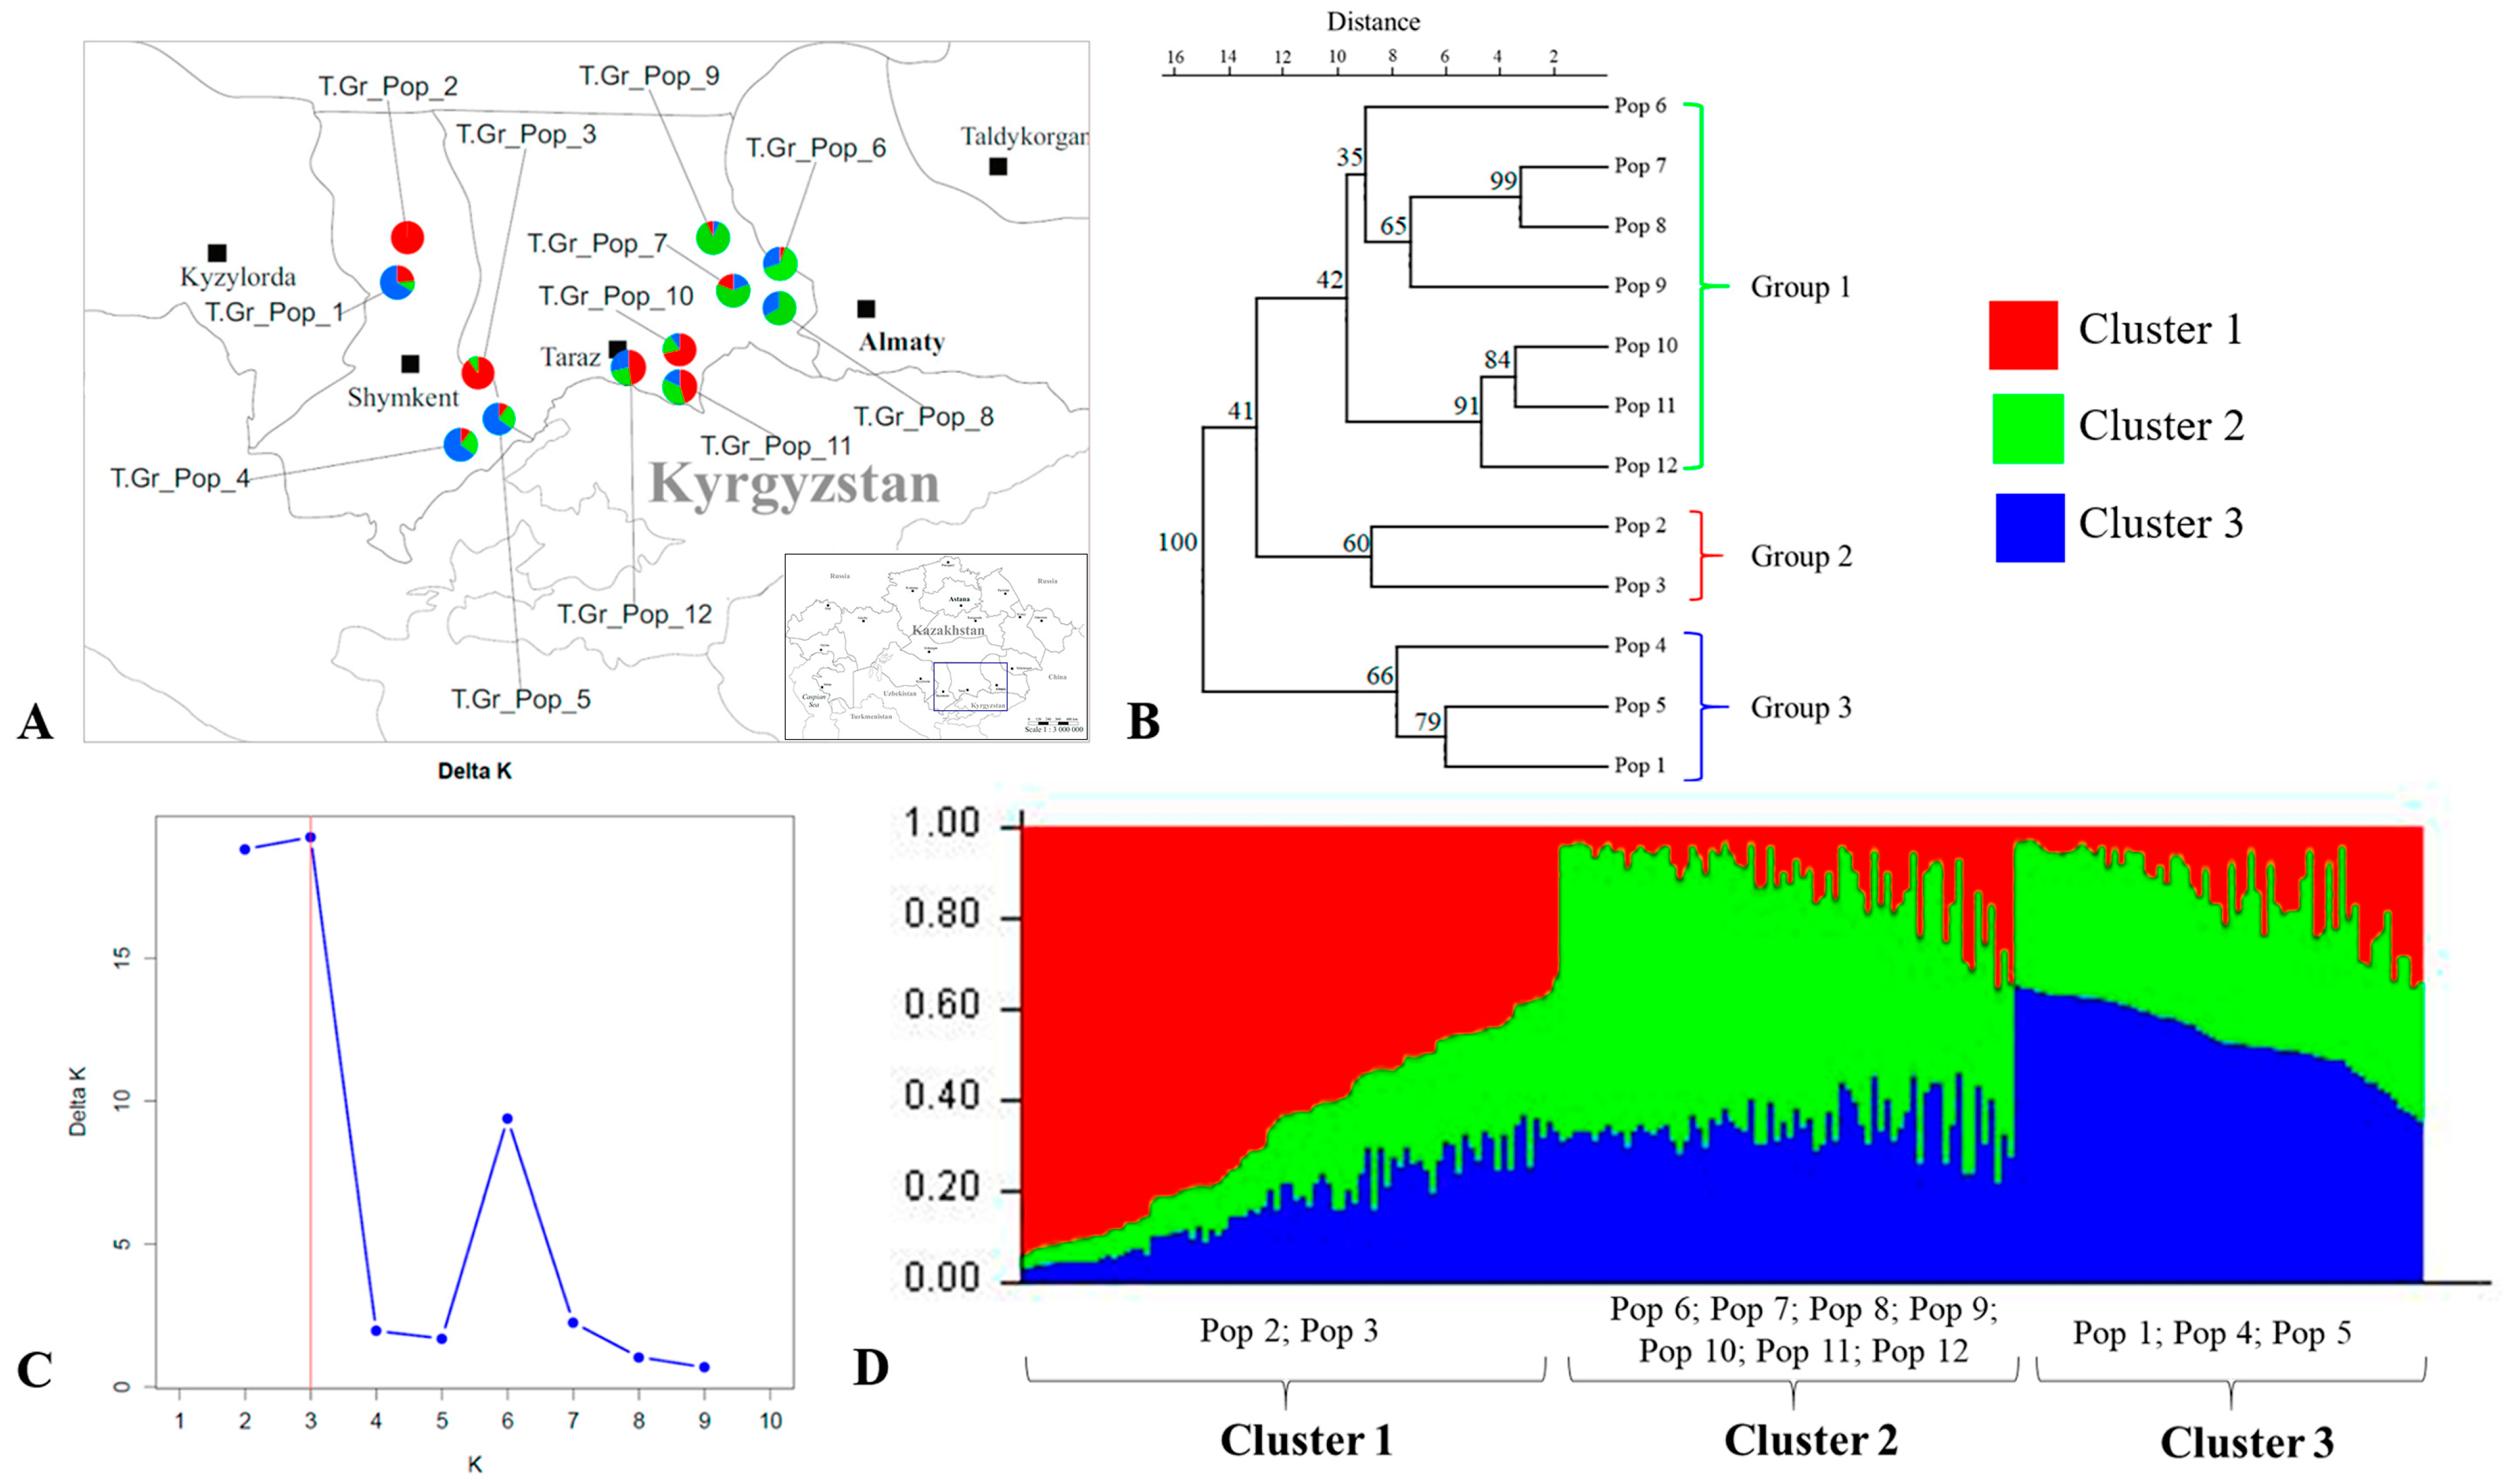
2.4. Genetic Structure of Tulipa alberti and Tulipa greigii Populations

Concerning T. alberti, principal coordinate analysis (PCoA) showed that 40.75% and 23.45% of the total genetic variation was explained by the first two coordinates (Figure 1A). For T. greigii populations, Coordinate 1 and Coordinate 2 explained 38.84% and 25.81% of the total genetic variation, respectively (Figure 1B). Additionally, the PCoA plot displayed the genetic distances between T. alberti and T. greigii populations using two principal coordinates (Figure 1C). Coordinate 1 accounted for 53.09% of the total variation among these species’ populations, while Coordinate 2 explained an additional 9.05%. The PCoA plot aids in comprehending the principal patterns of genetic differentiation among the populations under examination (see Figure 1C). Specifically, Coordinate 1 of the PCoA plot effectively differentiates populations of T. greigii from those of T. alberti, highlighting significant genetic diversity (Figure 1C). This separation indicates that the primary axis of variation captured by Coordinate 1 is crucial for understanding the genetic relationships and divergences between these groups.
Genetic diversity in 11 T. alberti and 12 T. greigii populations was assessed using an unweighted pair group method with arithmetic mean (UPGMA) method. The resulting dendrogram separated the studied populations into two distinct groups: Group I, consisting exclusively of T. alberti populations, and Group II, containing populations of T. greigii (Figure 2). The results of the UPGMA clustering analysis are consistent with the differentiation observed in the PCoA plot (Figure 1).
The Mantel correlation coefficient r2 = 0.0147 (p < 0.001) indicated a statistically significant but weak correlation between genetic distance and geographic distance matrices among populations in the entire T. alberti and T. greigii datasets. Additionally, the contribution of altitude to genetic differentiation was found to be statistically non-significant.
Genetic structure analyses grouped all T. alberti populations into three clusters. Bayesian structure analysis confirmed an optimal K value of 3, classifying 207 individuals from 11 populations into three main genetic clusters (Figure 3). Additionally, UPGMA results revealed three groups of T. alberti populations, corresponding to the three clusters identified by the STRUCTURE analysis (Figure 3B). Specifically, Group 1 included population 4, which corresponds to Cluster 2; Group 2 consisted of the larger number of individuals from populations 1, 3, 8, and 10 (Cluster 3); and Group 3 encompassed individuals from the remaining populations 2, 5, 6, 7, 9, and 11. The results indicated a moderate level of genetic structure among the T. alberti populations (Figure 3).
The Bayesian structure analysis of T. greigii populations also indicated an optimal value of K = 3 for clustering the T. greigii population into three groups (Figure 4). For the T. greigii populations, the UPGMA clustering results were consistent with the findings from the STRUCTURE analysis (Figure 4B). Group 1 includes populations 6, 7, 8, 9, 10, 11, and 12 from the southeast region of Kazakhstan (Figure 4A), corresponding to Cluster 2. Populations from the Turkestan region (Figure 4A) were divided into two groups: Group 2, comprising populations 2 and 3, corresponds to Cluster 1, while Group 3, consisting of populations 1, 4, and 5, aligns with Cluster 3.
The results from STRUCTURE and UPGMA analyses of T. alberti and T. greigii populations agreed with the findings from the PCoA analysis (Figure 1).

3. Discussion

The present study used polymorphic EST-SSR markers to elucidate the genetic diversity and population structure of Kazakhstan’s T. alberti and T. greigii species. The results provide significant perceptions of the genetic variation within and between populations of these species, contributing valuable information for their conservation and management. The polymorphism detected in 9 out of 15 EST-SSR markers for T. alberti and 13 EST-SSR markers for T. greigii highlights a relatively higher genetic variability in T. greigii populations. The average number of alleles per locus and the effective number of alleles were found to be higher in T. greigii compared to T. alberti. This suggests a greater genetic diversity within T. greigii populations. Given that T. alberti is a locally endemic species, these results align with the findings of Ferrer et al. [40] and Shen et al. [41], who reported higher genetic variation in species with broader geographical distributions and more diverse habitats. The informativeness of a marker can be quantitatively assessed using the PIC value, which is influenced by the number of detectable alleles and their frequency distribution [42]. The DNA marker is considered informative when the PIC value is ≥0.5 [43]. In this study, the mean PIC value of 0.56 (Table 1) indicates that the EST-SSR markers were nearly highly informative compared with ISSR [44], RAPD [45], and AFLP [46] markers and had sufficient discriminatory power to assess genetic diversity. The highest PIC value was observed in the Ca-8508 marker and the lowest in the Ca-5553 marker for T. alberti populations (Table 1). In contrast, for T. greigii populations, the Ca-8508 marker also exhibited the highest PIC value, while the Ca-7862 marker showed the lowest (Table 1). The average PIC for both species’ populations revealed that the markers Ca-8508, Ca-15730, and Ca-5526 exhibited the highest values. This finding aligns with previous studies, particularly noting that the Ca-15730 marker consistently demonstrated the highest PIC value in wild and cultivated tulip populations [38,47].
The AMOVA results demonstrated that a substantial proportion of the genetic variation in T. alberti (75%) and T. greigii (77%) is found within populations, with less variation observed between populations (Table 3). This intrapopulation genetic variation indicates significant gene flow and genetic exchange within populations. However, the lower gene flow in T. alberti (0.746 migrants per generation) compared to T. greigii (1.83 migrants per generation) suggests that T. alberti populations are more genetically isolated, which could be due to its more restricted habitat range and smaller population sizes. The PCoA plot (Figure 1) illustrated significant genetic differentiation between T. greigii and T. alberti populations. Coordinate 1, explaining 53.09% of the variation, effectively separates the species. This finding is supported by an SSR-based UPGMA dendrogram (Figure 2), which also clusters populations into distinct T. greigii and T. alberti groups. The congruence between PCoA and UPGMA analyses underscores robust genetic distinctions between these Tulipa species, providing insights into their evolutionary divergence and genetic structure. The distinct clustering of T. greigii and T. alberti populations in the PCoA plot and the separation observed in the UPGMA dendrogram were consistent with the significant genetic differentiation indicated by the PhiPT values. These results corroborate previous phylogenetic studies that have identified clear genetic boundaries between plant species [48,49,50]. The Mantel test revealed a weak but significant correlation between genetic and geographic distances, suggesting that geographic isolation has some influence on genetic differentiation. At the same time, the contribution of altitude to genetic differentiation was found to be non-significant, indicating that other ecological and evolutionary factors play a more crucial role in shaping the genetic structure of these populations.
The genetic structure analysis of both T. alberti and T. greigii populations revealed a moderate level of genetic differentiation among the sampled populations, with an optimal K value of 3, indicating the presence of three distinct genetic clusters within each species. The consistent results from Bayesian STRUCTURE analysis, UPGMA clustering, and PCoA provide robust evidence for genetic subdivision within these species, corroborating findings from studies on other species [51,52,53]. Various genetic diversity parameters (Ne, I, h, and %P) revealed that a population of T. greigii (population 1) collected in the mountainous areas of the Karatau ridge, located in northwestern Tian Shan in Kazakhstan, exhibited the highest levels of genetic diversity (Table 2). Consequently, the Karatau can be accepted as one of the centers of genetic diversity for T. greigii. Relatively homogeneous diversity can also be observed from the core to the periphery (from the western to the eastern populations), suggesting a relatively high gene flow (1.283), which supports Mayr’s hypothesis [54]. This finding is consistent with previous studies on different plant species [55,56]. High genetic diversity indices were found in population 7 of T. alberti (Table 2), collected in Zhetyzhol ridge (Zhambyl region), the western part of the Trans-Ili Alatau. This population might represent the origin of the species, exhibiting homogeneous genetic diversity across its range with a gene flow value of 0.746. Notably, this species is endemic to Kazakhstan [12], highlighting the importance of the location of population 7 for future conservation studies.
The genetic analysis of T. alberti and T. greigii populations revealed significant genetic diversity and differentiation between these species. The higher genetic diversity and gene flow in T. greigii suggest a more dynamic and interconnected population structure, while the lower genetic diversity and gene flow in T. alberti indicate more isolated and genetically distinct populations. Overall, these results identifying the most genetically diverse populations within these two species can be efficiently used to develop conservation strategies and manage these species in natural habitats.

4. Materials and Methods

4.1. Plant Material and DNA Extraction

During their blooming period, from early April to late May, a total of 423 individuals from 23 natural populations of two Tulipa species were sampled: 11 populations of T. alberti (Figure 5A) and 12 populations of T. greigii (Figure 5B).
These populations were located in the southern and southeastern regions of Kazakhstan (Figure 6), at altitudes ranging from 620 m (T. alberti, population 9) to 1817 m (T. greigii, population 4) above sea level. In each population, leaves were collected from 6 to 21 randomly selected mature plants spaced at least 10 m apart to minimize sampling of genetically identical individuals. The number of collected samples in each population varied according to the sizes of natural populations (Table 4).
The geographical coordinates and altitudes of the populations were documented using a handheld Garmin Etrex GPS device (Taiwan, China). Permission to collect plant leaves from the Red Book species T. alberti and T. greigii was provided by the Forestry and Wildlife Committee of the Ministry of Ecology, Geology, and Natural Resources of the Republic of Kazakhstan. Details of the populations, including collection sites and altitude, are provided in Table 4. Leaf samples for DNA analysis were immediately placed in labeled, sealed bags with silica gel to ensure desiccation.
Total genomic DNA was extracted from dried young leaves using the cetyltrimethylammonium bromide (CTAB) method described by Doyle [57]. The quality and quantity of the DNA were assessed through spectrophotometry and by visually comparing DNA dilutions run on a 1% agarose gel. The DNA sample concentrations were normalized to 100 ng/μL and stored at −20 °C for subsequent EST-SSR analysis.

4.2. EST-SSR Analysis

In this study, a total of 15 EST-SSR markers [38,39] were utilized. Details about the primer sequences, repeat motifs, and amplification conditions for the tulip microsatellites are given in Table 5.
The PCR amplification conditions were set as follows: An initial denaturation occurred at 94 °C for 5 min, followed by 30 cycles of 94 °C for 30 s, 57 °C for 45 s, and 72 °C for 35 s. This was followed by eight cycles of 94 °C for 30 s, 54 °C for 45 s, and 72 °C for 35 s, with a final extension at 72 °C for 8 min. The PCR reactions were carried out in a 20 μL mixture comprising 1× PCR buffer, 1.5 mM MgCl2, 0.5 mM of each dNTP, 0.2 μM of each primer, 1 unit of Taq DNA polymerase, and 100 ng of DNA template. Separation of PCR products was achieved using the QIAxcel Connect System capillary electrophoresis (QIAGEN, Hilden, Germany) equipped with the QIAxcel DNA High Resolution Kit (QIAGEN, Hilden, Germany) and QX Alignment Marker (QIAGEN, Hilden, Germany) (15 bp/3 kb).

4.3. Statistical Analysis

The genetic diversity and structure parameters, including the number of alleles (Na), the effective number of alleles (Ne), Shannon’s information index (I), percentage of polymorphic loci (PPL), Nei’s genetic diversity index (Nei), principal coordinate analysis (PCoA), and the analysis of molecular variance (AMOVA) were assessed using the GenAlEx 6.5 software [58]. Additionally, the amount of gene flow (Nm) between gene pools was determined based on FST estimates using the formula Nm = [(1/FST) − 1]/4. The polymorphism information content (PIC) was computed using iMEC software (https://irscope.shinyapps.io/iMEC/, accessed on 22 May 2024) [59].
The dendrogram of a total of 23 populations of T. alberti (11 populations) and T. greigii (12 populations) was reconstructed using the unweighted pair group method with arithmetic means (UPGMA) based on genetic distance matrices, employing the PAST 4.03 software [60] with 1000 bootstrap replications. The correlations between genetic and geographic distance (Mantel test) were estimated for all populations by GenAlEx 6.5 software [58]. For analyzing the genetic structure of the populations of Tulipa greigii and Tulipa alberti, the STRUCTURE v2.3.4 software was utilized, applying the Bayesian clustering method [61]. The settings for the burn-in period and the Markov chain Monte Carlo (MCMC) replications were established at 100,000, with the number of iterations set to 3. The results from the STRUCTURE analysis were assessed using the web-based program Structure Harvester, which utilizes the methods of Evanno et al. [62] and Jakobsson and Rosenberg [63] to determine the optimal number of genetic clusters (K).

5. Conclusions

Using the application of 15 EST-SSR markers, this study provided valuable insights into the genetic diversity and population structure of Red Book species T. greigii and T. alberti in Kazakhstan. The relatively high genetic diversity and gene flow in T. greigii populations suggested a more dynamic population structure. In contrast, low genetic diversity and gene flow in T. alberti indicated more isolated and genetically distinct populations. The populations of T. greigii in the Karatau ridge and T. alberti in the Zhambyl region exhibited relatively high genetic diversity compared to other studied populations within these two species. The results of this study can provide valuable insights for the development of conservation strategies aimed at preserving the genetic diversity of these endangered species.

Supplementary Materials

The following supporting information can be downloaded at https://www.mdpi.com/article/10.3390/plants13182667/s1: Figure S1: The fragment of the digital electrophoresis for the most polymorphic Ca-8508 marker; Table S1: Allelic status in fifteen SSR markers for Tulipa greigii and Tulipa alberti populations (bp).

Author Contributions

Conceptualization, S.A. (Saule Abugalieva), Y.T.; methodology, S.A. (Shyryn Almerekova) and A.I.; software, S.A. (Shyryn Almerekova) and M.Y.; validation, S.A. (Saule Abugalieva), M.Y. and A.I.; formal analysis, M.Y. and S.A. (Shyryn Almerekova); investigation, M.Y. and S.A. (Saule Abugalieva); resources, M.Y. and A.I.; data curation, S.A. (Saule Abugalieva), Y.T.; writing—original draft preparation, S.A. (Shyryn Almerekova), M.Y. and Y.T.; writing—review and editing, S.A. (Shyryn Almerekova), M.Y., S.A. (Saule Abugalieva), and Y.T.; visualization, M.Y.; supervision, S.A. (Saule Abugalieva), Y.T.; project administration, S.A. (Saule Abugalieva) and S.A. (Shyryn Almerekova); funding acquisition, S.A. (Saule Abugalieva). All authors have read and agreed to the published version of the manuscript.

Funding

This research has been funded by the Science Committee of the Ministry of Science and Higher Education of the Republic of Kazakhstan (Grant No. AP14870612).

Data Availability Statement

Data are contained within the article and Supplementary Materials.

Acknowledgments

We thank Bibibatima Kongyr for assistance with the lab work.

Conflicts of Interest

The authors declare no conflicts of interest.

References

  1. Turktas, M.; Metin, Ö.K.; Baştuğ, B.; Ertuğrul, F.; Sarac, Y.I.; Kaya, E. Molecular phylogenetic analysis of Tulipa (Liliaceae) based on noncoding plastid and nuclear DNA sequences with an emphasis on Turkey. Bot. J. Linn. Soc. 2013, 172, 270–279. [Google Scholar] [CrossRef]
  2. Hall, A.D. The Genus Tulipa; Royal Horticultural Society: London, UK, 1940. [Google Scholar]
  3. Wendelbo, P. Tulips and Irises of Iran and Their Relatives; Ariamehr Botanical Garden: Tehran, Iran, 1977. [Google Scholar]
  4. Botschantzeva, Z. Tulips: Taxonomy, Morphology, Cytology, Phytogeogr; CRC Press: Boca Raton, FL, USA, 1982. [Google Scholar]
  5. Stork, A. Tulipes Sauvages et Cultivees (Wild and Cultivated Tulips; Serie Documentaire 13; Conservatoire et Jardin Botaniques: Geneva, Switzerland, 1984. [Google Scholar]
  6. Rechinger, K.-H. Tulipa. In Flora Iranica; Cont. No. 165; Akademische Druck- und Verlagsanstalt: Graz, Austria, 1990. [Google Scholar]
  7. Matin, F. Tulips of Iran; Agricultural Research Education and Development: Tehran, Iran, 1998. [Google Scholar]
  8. Govaerts, R. World Checklist of Selected Plant Families. Royal Botanic Gardens, Kew. 2009. Available online: http://apps.kew.org/wcsp/qsearch.do (accessed on 3 June 2024).
  9. Zonneveld, B.J. The systematic value of nuclear genome size for “all” species of Tulipa L. (Liliaceae). Plant Syst. Evol. 2009, 281, 217–245. [Google Scholar] [CrossRef]
  10. Christenhusz, M.J.; Govaerts, R.; David, J.C.; Hall, T.; Borland, K.; Roberts, P.S.; Fay, M.F. Tiptoe through the tulips–cultural history, molecular phylogenetics and classification of Tulipa (Liliaceae). Bot. J. Linn. Soc. 2013, 172, 280–328. [Google Scholar] [CrossRef]
  11. Van Raamsdonk, L.W.D.; De Vries, T. Species relationships and taxonomy in Tulipa subgenus Tulipa (Liliaceae). Plant Syst. Evol. 1995, 195, 13–44. [Google Scholar] [CrossRef]
  12. Ivashchenko, A.A.; Belyalov, O.V. Kazakhstan Is the Birthplace of Tulips; Atamura: Almaty, Kazakhstan, 2019. [Google Scholar]
  13. Yang, J.B.; Tang, M.; Li, H.T.; Zhang, Z.R.; Li, D.Z. Complete chloroplast genome of the genus Cymbidium: Lights into the species identification, phylogenetic implications and population genetic analyses. BMC Evol. Biol. 2013, 13, 84. [Google Scholar] [CrossRef]
  14. Park, I.; Song, J.H.; Yang, S.; Chae, S.; Moon, B.C. Plastid phylogenomic data offers novel insights into the taxonomic status of the Trichosanthes kirilowii complex (Cucurbitaceae) in south Korea. Front. Plant Sci. 2021, 12, 559511. [Google Scholar] [CrossRef]
  15. Li, J.; Price, M.; Su, D.M.; Zhang, Z.; Yu, Y.; Xie, D.F.; Gao, X.F. Phylogeny and comparative analysis for the plastid genomes of five Tulipa (Liliaceae). BioMed Res. Int. 2021, 2021, 6648429. [Google Scholar] [CrossRef] [PubMed]
  16. Almerekova, S.; Yermagambetova, M.; Ivaschenko, A.; Turuspekov, Y.; Abugalieva, S. Comparative Analysis of Plastome Sequences of Seven Tulipa L. (Liliaceae Juss.) Species from Section Kolpakowskianae Raamsd. Ex Zonn and Veldk. Int. J. Mol. Sci. 2024, 25, 7874. [Google Scholar] [CrossRef]
  17. Baitulin, I.O.; Sitpayeva, G.T. (Eds.) Red Book of Kazakhstan, 2nd ed.; “Art-Print XXI” Ltd.: Astana, Kazakhstan, 2014; 452p, Part 2. [Google Scholar]
  18. POWO. Plants of the World Online. Facilitated by the Royal Botanic Gardens, Kew. 2024. Available online: https://powo.science.kew.org/ (accessed on 24 August 2024).
  19. Beshko, N.Y.; Abduraimov, O.S.; Kodirov, U.K.; Madaminov, F.M.; Mahmudov, A.V. The Current State of Cenopopulations of Some Endemic and Rare Species of the Genus Tulipa L. (Liliaceae) in the Tashkent Region (Uzbekistan). Arid Ecosyst. 2023, 13, 294–304. [Google Scholar] [CrossRef]
  20. Hughes, A.R.; Inouye, B.D.; Johnson, M.T.; Underwood, N.; Vellend, M. Ecological consequences of genetic diversity. Ecol. Lett. 2008, 11, 609–623. [Google Scholar] [CrossRef]
  21. Bidyananda, N.; Jamir, I.; Nowakowska, K.; Varte, V.; Vendrame, W.A.; Devi, R.S.; Nongdam, P. Plant Genetic Diversity Studies: Insights from DNA Marker Analyses. Int. J. Plant Biol. 2024, 15, 607–640. [Google Scholar] [CrossRef]
  22. Ellstrand, N.C.; Elam, D.R. Population genetic consequences of small population size: Implications for plant conservation. Annu. Rev. Ecol. Syst. 1993, 24, 217–242. [Google Scholar] [CrossRef]
  23. Nam, V.T.; Hang, P.L.B.; Linh, N.N.; Ly, L.H.; Hue, H.T.T.; Ha, N.H.; Hien, L.T.T. Molecular markers for analysis of plant genetic diversity. Vietnam J. Biotechnol. 2020, 18, 589–608. [Google Scholar] [CrossRef]
  24. Cloutier, S.; Niu, Z.; Datla, R.; Duguid, S. Development and analysis of EST-SSRs for flax (Linum usitatissimum L.). Theor. Appl. Genet. 2009, 119, 53–63. [Google Scholar] [CrossRef]
  25. Tang, S.; Okashah, R.A.; Cordonnier-Pratt, M.M.; Pratt, L.H.; Ed Johnson, V.; Taylor, C.A.; Knapp, S.J. EST and EST-SSR marker resources for Iris. BMC Plant Biol. 2009, 9, 72. [Google Scholar] [CrossRef]
  26. Dillon, N.L.; Innes, D.J.; Bally, I.S.E.; Wright, C.L.; Devitt, L.C.; Dietzgen, R.G. Expressed Sequence Tag-Simple Sequence Repeat (EST-SSR) Marker Resources for Diversity Analysis of Mango (Mangifera indica L.). Diversity 2014, 6, 72–87. [Google Scholar] [CrossRef]
  27. Ng, K.K.; Lee, S.L.; Tsumura, Y.; Ueno, S.; Ng, C.H.; Lee, C.T. Expressed sequence tag-simple sequence repeats isolated from Shorea leprosula and their transferability to 36 species within the Dipterocarpaceae. Mol. Ecol. Resour. 2009, 9, 393–398. [Google Scholar] [CrossRef]
  28. Chen, C.; Bowman, K.D.; Choi, Y.A.; Dang, P.M.; Rao, M.N.; Huang, S.; Soneji, J.R.; McCollum, T.G.; Gmitter, F.G. EST-SSR genetic maps for Citrus sinensis and Poncirus trifoliata. Tree Genet. Genomes 2008, 4, 1–10. [Google Scholar] [CrossRef]
  29. Hwang, J.H.; Ahn, S.G.; Oh, J.Y.; Choi, Y.W.; Kang, J.S.; Park, Y.H. Functional characterization of watermelon (Citrullus lanatus L.) EST–SSR by gel electrophoresis and high-resolution melting analysis. Sci. Hortic. 2011, 130, 715–724. [Google Scholar] [CrossRef]
  30. Ellis, J.; Burke, J. EST-SSRs as a resource for population genetic analyses. Heredity 2007, 99, 125–132. [Google Scholar] [CrossRef]
  31. Ramu, P.; Billot, C.; Rami, J.F.; Senthilvel, S.; Upadhyaya, H.D.; Ananda Reddy, L.; Hash, C.T. Assessment of genetic diversity in the sorghum reference set using EST-SSR markers. Theor. Appl. Genet. 2013, 126, 2051–2064. [Google Scholar] [CrossRef] [PubMed]
  32. Zhong, Y.; Yang, A.; Li, Z.; Zhang, H.; Liu, L.; Wu, Z.; Yu, F. Genetic diversity and population genetic structure of Cinnamomum camphora in South China revealed by EST-SSR markers. Forests 2019, 10, 1019. [Google Scholar] [CrossRef]
  33. Wu, Q.; Zang, F.; Ma, Y.; Zheng, Y.; Zang, D. Analysis of genetic diversity and population structure in endangered Populus wulianensis based on 18 newly developed EST-SSR markers. Glob. Ecol. Conserv. 2020, 24, e01329. [Google Scholar] [CrossRef]
  34. Lu, J.; Zhang, Y.; Diao, X.; Yu, K.; Dai, X.; Qu, P.; Qiao, Q. Evaluation of genetic diversity and population structure of Fragaria nilgerrensis using EST-SSR markers. Gene 2021, 796, 145791. [Google Scholar] [CrossRef]
  35. Qi-fu, L.; Tong, O.; Yan-cheng, J.; Cai-xia, W. Tulip RAPD analysis of cultivars and wild species in Xinjiang. Acta Agric. Univ Jiangxiensis 2008, 30, 656–660. [Google Scholar]
  36. Kiani, M.; Memariani, F.; Zarghami, H. Molecular analysis of species of Tulipa L. from Iran based on ISSR markers. Plant Syst. Evol. 2012, 298, 1515–1522. [Google Scholar] [CrossRef]
  37. Tang, N.; Shahin, A.; Bijman, P.; Liu, J.; van Tuyl, J.; Arens, P. Genetic diversity and structure in a collection of tulip cultivars assessed by SNP markers. Sci. Hortic. 2013, 161, 286–292. [Google Scholar] [CrossRef]
  38. Pourkhaloee, A.; Khosh-Khui, M.; Arens, P.; Salehi, H.; Razi, H.; Niazi, A.; van Tuyl, J. Molecular analysis of genetic diversity, population structure, and phylogeny of wild and cultivated tulips (Tulipa L.) by genic microsatellites. Hortic. Environ. Biotechnol. 2018, 59, 875–888. [Google Scholar] [CrossRef]
  39. Shahin, A.; van Kaauwen, M.; Esselink, D.; Bargsten, J.W.; van Tuyl, J.M.; Visser, R.G.; Arens, P. Generation and analysis of expressed sequence tags in the extreme large genomes Lilium and Tulipa. BMC Genom. 2012, 13, 640. [Google Scholar] [CrossRef]
  40. Ferrer, M.M.; Eguiarte, L.E.; Montana, C. Genetic structure and outcrossing rates in Flourensia cernua (Asteraceae) growing at different densities in the South-western Chihuahuan Desert. Ann. Bot. 2004, 94, 419–426. [Google Scholar] [CrossRef]
  41. Shen, Y.; Cheng, Y.; Li, K.; Li, H. Integrating phylogeographic analysis and geospatial methods to infer historical dispersal routes and glacial refugia of Liriodendron chinense. Forests 2019, 10, 565. [Google Scholar] [CrossRef]
  42. Ghasemi Ghehsareh, M.; Salehi, H.; Khosh-Khui, M.; Niazi, A. Application of ISSR markers to analyze molecular relationships in Iranian jasmine (Jasminum spp.) accessions. Mol. Biotechnol. 2015, 57, 65–74. [Google Scholar] [CrossRef] [PubMed]
  43. Singh, A.; Sharma, V.K.; Dikshit, H.K.; Singh, D.; Aski, M.; Prakash, P.; Kaushik, S.C.; Singh, G.; Kumar, S.; Sarker, A. Microsatellite marker-based genetic diversity analysis of elite lentil lines differing in grain iron and zinc concentration. J. Plant Biochem. Biotechnol. 2017, 26, 199–207. [Google Scholar] [CrossRef]
  44. Wu, Z.H.; Shi, J.; Xi, M.L.; Jiang, F.X.; Deng, M.W.; Dayanandan, S. Inter-simple sequence repeat data reveals high genetic diversity in wild populations of the narrowly distributed endemic Lilium regale in the Minjiang River Valley of China. PLoS ONE 2015, 10, e0118831. [Google Scholar] [CrossRef] [PubMed]
  45. Wen, C.S.; Hsiao, J.Y. Altitudinal genetic differentiation and diversity of Taiwan lily (Lilium longiflorum var. formosanum; Liliaceae) using RAPD markers and morphological characters. Int. J. Plant Sci. 2001, 162, 287–295. [Google Scholar] [CrossRef]
  46. Asgari, D.; Babaei, A.; Naghavi, M.R.; Kiani, M. Biodiversity status of Tulipa (Liliaceae) in Iran inferred from molecular characterization. Hortic. Environ. Biotechnol. 2020, 61, 559–567. [Google Scholar] [CrossRef]
  47. Pourkhaloee, A.; Khosh-Khui, M.; Arens, P.; Salehi, H.; Razi, H.; Niazi, A.; Afsharifar, A.; Van Tuyl, J. Genetic Diversity and Population Structure of Iranian Tulips Revealed by EST-SSR and NBS-LRR Markers. Int. J. Hortic. Sci. Technol. 2017, 4, 167–182. [Google Scholar] [CrossRef]
  48. Trapnell, D.W.; Hamrick, J.L.; Giannasi, D.E. Genetic variation and species boundaries in Calopogon (Orchidaceae). Syst. Bot. 2004, 29, 308–315. [Google Scholar] [CrossRef]
  49. Drummond, C.S.; Hamilton, M.B. Hierarchical components of genetic variation at a species boundary: Population structure in two sympatric varieties of Lupinus microcarpus (Leguminosae). Mol. Ecol. 2007, 16, 753–769. [Google Scholar] [CrossRef]
  50. Muñiz-Castro, M.Á.; Castro-Félix, P.; Carranza-Aranda, A.S.; Vázquez-García, J.A.; Santerre, A. Population genetics, species boundaries, and conservation in the Magnolia pacifica species complex along a continentality and moisture gradient in western Mexico. Bot. Sci. 2020, 98, 500–516. [Google Scholar] [CrossRef]
  51. Yu, Z.; Fredua-Agyeman, R.; Hwang, S.-F.; Strelkov, S.E. Molecular genetic diversity and population structure analyses of rutabaga accessions from Nordic countries as revealed by single nucleotide polymorphism markers. BMC Genom. 2021, 22, 442. [Google Scholar] [CrossRef] [PubMed]
  52. Li, Z.; Yun, L.; Gao, Z.; Wang, T.; Ren, X.; Zhao, Y. EST-SSR primer development and genetic structure analysis of Psathyrostachys juncea Nevski. Front. Plant Sci. 2022, 13, 837787. [Google Scholar] [CrossRef] [PubMed]
  53. Eren, B.; Keskin, B.; Demirel, F.; Demirel, S.; Türkoğlu, A.; Yilmaz, A.; Haliloğlu, K. Assessment of genetic diversity and population structure in local alfalfa genotypes using iPBS molecular markers. Genet. Resour. Crop Evol. 2023, 70, 617–628. [Google Scholar] [CrossRef]
  54. Kark, S. Within-Population Diversity in the Distribution Range: Partridges as a Research Model; Department of Evolution, Systematics and Ecology, The Hebrew University of Jerusalem, and The Desertification and Restoration Ecology Research Center: Jerusalem, Israel, 1999. [Google Scholar]
  55. Volis, S.; Mendlinger, S.; Orlovsky, N. Variability in phenotypic traits in core and peripheral populations of wild barley Hordeum spontaneum Koch. Hereditas 2001, 133, 235–247. [Google Scholar] [CrossRef]
  56. Yermagambetova, M.; Almerekova, S.; Turginov, O.; Sultangaziev, O.; Abugalieva, S.; Turuspekov, Y. Genetic Diversity and Population Structure of Juniperus seravschanica Kom. Collected in Central Asia. Plants 2023, 12, 2961. [Google Scholar] [CrossRef]
  57. Doyle, J. DNA protocols for plants-CTAB total DNA isolation. In Molecular Techniques in Taxonomy; Hewitt, G., Johnston, A., Eds.; Springer: Berlin/Heidelberg, Germany, 1991; pp. 283–293. [Google Scholar]
  58. Peakall, R.; Smouse, P.E. GenAlEx 6.5: Genetic analysis in Excel. Population genetic software for teaching and research—An update. Bioinformatics 2012, 28, 2537–2539. [Google Scholar] [CrossRef]
  59. Amiryousefi, A.; Hyvönen, J.; Poczai, P. iMEC: Online marker efficiency calculator9. Appl. Plant Sci. 2018, 6, e01159. Available online: https://irscope.shinyapps.io/iMEC/ (accessed on 22 May 2024). [CrossRef]
  60. Hammer, Ø.; Harper, D.A.; Ryan, P.D. PAST: Paleontological statistics software package for education and data analysis. Palaeontol. Electron. 2001, 4, 4–9. [Google Scholar]
  61. Earl, D.A.; vonHoldt, B.M. Structure harvester: A website and program for visualizing STRUCTURE output and implementing the Evanno method. Conserv. Genet. Resour. 2012, 4, 359–361. [Google Scholar] [CrossRef]
  62. Evanno, G.; Regnaut, S.; Goudet, J. Detecting the number of clusters of individuals using the software structure: A simulation study. Mol. Ecol. 2005, 14, 2611–2620. [Google Scholar] [CrossRef]
  63. Jakobsson, M.; Rosenberg, N.A. CLUMPP: A cluster matching and permutation program for dealing with label switching and multimodality in analysis of population structure. Bioinformatics 2007, 23, 1801–1806. [Google Scholar] [CrossRef] [PubMed]
Figure 1. Principal coordinate analysis (PCoA) plots for Tulipa alberti populations (A); Tulipa greigii populations (B); and for Tulia alberti and Tulipa greigii populations (C). T.A.—Tulipa alberti; T.Gr.—Tulipa greigii.
Plants 13 02667 g001
Figure 2. Unweighted pair group method with arithmetic mean (UPGMA) tree constructed from polymorphic EST-SSR loci of Tulipa alberti and Tulipa greigii populations. T.A.—Tulipa alberti; T.Gr.—Tulipa greigii.
Plants 13 02667 g002
Figure 3. Genetic structure of Tulipa alberti (T.A.) populations. Distribution of Tulipa alberti populations (A); UPGMA tree of Tulipa alberti populations (B); STRUCTURE analysis graphic with the Evanno method showing optimal K = 3 (C); and Bayesian inference clustering of 207 individuals from 11 Tulipa alberti populations (D).
Plants 13 02667 g003
Figure 4. Genetic structure of Tulipa greigii (T.Gr.) populations. Distribution of T. greigii populations (A); UPGMA tree of T. greigii populations (B); STRUCTURE analysis graphic with the Evanno method showing optimal K = 3 (C); and Bayesian inference clustering of 216 individuals from 12 T. greigii populations (D).
Plants 13 02667 g004
Figure 5. Tulipa alberti (A) and Tulipa greigii (B) species in nature. Photos were taken by Oleg Belyalov.
Plants 13 02667 g005
Figure 6. Location of sampled Tulipa alberti (A) and Tulipa greigii (B) populations in Kazakhstan. Pop—population; numeration according to Table 1. T.A.—Tulipa alberti; T.Gr.—Tulipa greigii.
Plants 13 02667 g006
Table 1. Characteristics of 13 polymorphic microsatellite markers used in this study.
SpeciesEST-SSRsNNaNeIhPIC
Tulipa albertiCa-257220732.40.9590.5810.578
Ca-395220711.00.0000.0000.000
Ca-552620721.80.6430.4530.451
Ca-555320741.70.6920.4180.416
Ca-695020721.90.6730.4830.480
Ca-786220711.00.0000.0000.000
Ca-850820743.41.2860.7070.703
Ca-1333320732.30.9460.5650.562
Ca-1573020731.90.7600.4730.471
Kn-83420742.91.1180.6610.658
Kn-229120721.80.6370.4470.444
Kn-748020711.00.0000.0000.000
Kn-3095620711.00.0000.0000.000
Mean2072.41.90.5930.3680.366
SE 0.3310.2090.1260.0750.267
Tulipa greigiiCa-257221652.31.0990.5720.569
Ca-395221642.51.1180.5990.597
Ca-552621653.81.3710.7370.734
Ca-555321642.00.9170.5010.499
Ca-695021631.80.7470.4320.430
Ca-786221631.70.7030.3970.395
Ca-850821664.51.6030.7820.779
Ca-1333321622.00.6900.4990.497
Ca-1573021654.01.4710.7530.750
Kn-83421632.00.8720.5060.504
Kn-229121632.50.9970.6100.607
Kn-748021643.31.2890.7040.700
Kn-3095621632.30.9200.5670.564
Mean2163.82.71.0610.5890.586
SE 0.3170.2570.0820.0340.124
TotalCa-257242352.00.6850.4310.567
Ca-395242341.50.3680.2400.616
Ca-552642351.90.6480.4240.706
Ca-555342341.60.5130.3090.676
Ca-695042331.70.5780.3980.467
Ca-786242331.30.2030.1350.195
Ca-850842363.01.1820.6880.748
Ca-1333342331.70.5550.3790.584
Ca-1573042352.50.9410.5720.714
Kn-83442342.10.7510.4960.598
Kn-229142331.80.6470.4390.558
Kn-748042341.80.4650.2750.453
Kn-3095642331.50.3690.2450.398
Mean42341.90.6080.3870.560
SE 0.0650.0470.0260.0160.152
Notes: N—number of samples; Na—number of alleles per locus; Ne—effective number of alleles; I—Shannon’s information index; h—Nei’s genetic diversity index; PIC—polymorphism information content; SE—standard error.
Table 2. Assessment of the genetic diversity of studied Tulipa species populations.
SpeciesPopulation IDNaNeIhPPL
Tulipa albertiT.A. Pop 11.81.50.4140.27769.23%
T.A. Pop 22.01.70.4650.29961.54%
T.A. Pop 31.81.60.4390.30061.54%
T.A. Pop 41.61.40.3150.21946.15%
T.A. Pop 51.91.50.4130.27469.23%
T.A. Pop 62.11.70.4880.31261.54%
T.A. Pop 72.01.80.5290.35369.23%
T.A. Pop 81.61.40.3030.20546.15%
T.A. Pop 92.01.60.4410.27461.54%
T.A. Pop 101.81.50.3800.25853.85%
T.A. Pop 111.81.60.4290.28053.85%
Mean1.91.60.4200.27759.4%
SE0.1540.1210.0680.0410.085
Tulipa greigiiT.Gr. Pop 13.22.70.9930.609100.00%
T.Gr. Pop 22.61.90.6380.39269.23%
T.Gr. Pop 32.72.20.7310.43969.23%
T.Gr. Pop 43.42.40.9470.558100.00%
T.Gr. Pop 53.32.40.9290.558100.00%
T.Gr. Pop 62.92.30.8220.49584.62%
T.Gr. Pop 72.62.00.7470.481100.00%
T.Gr. Pop 81.81.50.4060.31869.23%
T.Gr. Pop 92.31.80.6150.41084.62%
T.Gr. Pop 102.92.20.8300.51392.31%
T.Gr. Pop 112.82.20.8040.529100.00%
T.Gr. Pop 123.22.40.9040.54892.31%
Mean2.82.20.7810.48788.5%
SE0.4660.3230.1670.0840.129
TotalMean2.41.90.6080.38774.6%
SE0.0650.0470.0260.0163.82%
Notes: T.A.—Tulipa alberti; T.Gr.—Tulipa greigii; Pop—population; Na—number of alleles per locus; Ne—effective number of alleles; I—Shannon’s information index; h—Nei’s genetic diversity index; PPL—the percentage of polymorphic loci; SE—standard error.
Table 3. The analysis of molecular variance (AMOVA) based on Nei’s genetic distance in populations of Tulipa alberti and Tulipa greigii.
SpeciesSourcedfSSMSEst.Var.%PhiPTNmp Values
Tulioa albertiAmong Pops10197.04919.7050.90425%
Within Pops196536.7962.7392.73975%
Total206733.845 3.642100%0.2480.746<0.001
Tulipa greigiiAmong Pops11512.88046.6252.20423%
Within Pops2041468.7557.2007.20077%
Total2151981.634 9.403100%0.2341.283<0.001
TotalAmong Pops1234.507234.5071.09426%
Within Pops4211316.3943.1273.12774%
Total4221550.901 4.221100%0.2591.428<0.001
Notes: df—degrees of freedom; SS—sum of squares; MS—mean squared; Est.Var.—estimates of variance; %—percentage of variation; PhiPT—genetic differentiation index among population; Nm—gene flow (Nm) value.
Table 4. The locations of populations of two tulip species collected in the southern and southeastern regions of Kazakhstan.
SpeciesPopulation IDSample SizeAltitudeCollection Sites
Tulipa albertiT.A. Pop 1151100Zhetyzhol ridge, western part of the Trans-Ili Alatau, Zhambyl region
T.A. Pop 221600Qonayev district, Trans-Ili Alatau, Almaty region
T.A. Pop 321611Chulak Mountains, Trans-Ili Alatau, Almaty region
T.A. Pop 417510The right bank of the Ili River, in the area of the Kapchagai reservoir, gravelly slopes, Trans-Ili Alatau, Almaty region
T.A. Pop 521575Malaysary pass, Trans-Ili Alatau, Almaty region
T.A. Pop 6211064Zhetyzhol ridge, eastern slope, Kenen village, western part of the Trans-Ili Alatau, Zhambyl region
T.A. Pop 7211072Zhetyzhol ridge, southwestern slope, Kenen village, western part of the Trans-Ili Alatau, Zhambyl region
T.A. Pop 813700Right bank of the Tarylgan river, Chu-Ili mountains, Zhambyl region
T.A. Pop 919620Kurtinsky district, near the Kurtinsky reservoir, Chu-Ili mountains, Almaty region
T.A. Pop 1017870Tamgaly tas, Chu-Ili mountains, Almaty region
T.A. Pop 1121880Anrakai Mountains, Chu-Ili mountains, Zhambyl region
Tulipa greigiiT.Gr. Pop 1211054Kazanbulak tract, Karatau ridge, Karatau Nature Reserve, Turkestan region
T.Gr. Pop 2201033Arpaozen, Kekliktas tract, Karatau ridge, Karatau Nature Reserve, Turkestan region
T.Gr. Pop 320932Shubaykyzyl hilly area, Tyulkubas district, Turkestan region
T.Gr. Pop 4211817Kaskasu gorge, Mailoshak ridge, Sairam-Ugam state national nature park (SNNP), Turkestan region
T.Gr. Pop 5211613Iirsu village, Aksu Valley, Aksu-Zhabagly state nature reserve SNR, Turkestan region
T.Gr. Pop 620970Kordai Pass, eastern slope, Trans-Ili Alatau, Zhambyl region
T.Gr. Pop 7211270Kordai Pass, southeast slope, right side of the road, Trans-Ili Alatau, Zhambyl region
T.Gr. Pop 861120Kordai Pass, southeast slope, left side of the road, Trans-Ili Alatau, Zhambyl region
T.Gr. Pop 9151190On the right side of the road towards Taraz, western tip of the Trans-Ili Alatau, Zhambyl region
T.Gr. Pop 10211010Merken district, Merke gorge, northern slope, Kyrgyz Alatau, Zhambyl region
T.Gr. Pop 11111260Merken district, Merke gorge, Kyrgyz Alatau, Zhambyl region
T.Gr. Pop 12211140Almalysay gorge, western tip of the Kyrgyz Alatau, Zhambyl region
Table 5. Characteristics of EST-SSR markers used for analysis of Tulipa species.
LocusRepeat MotifPrimer Sequence (5′–3′)Product Size
(bp)
1Ca-2572(GAGAAG)4F-TGCACAGAGCCAAAGAAGTA
R-TCTCCTTTCCATGTTTCCTC
213
2Ca-3952(CAG)4F-ACTCAATTCACTTGCAGCAG
R-GTCGTTGCAGTTGTTGTGAT
189
3Ca-5526(GAG)6F-TTTACGGGAATTACTTCGAG
R-ACATGGATTCCAAACAAGAG
242
4Ca-5553(TTG)9F-CCGATAATTGAGGTCAGGTT
R-CCGAACTCCTCGCATATAAC
168
5Ca-6950(GAT)4F-ATGCAATCTTGGGAACTGAT
R-CACTGTCGTCATCTTCTCCA
198
6Ca-7862(CGC)4F-AATCAACGCATCATGTCAAC
R-TACTGGAGGTACGCCTCCTT
131
7Ca-8508(GTT)10F-AGAATTTGTCTTGCGACAGT
R-TAGGGGTACCAATTTGTGTT
325
8Ca-13333(GAT)4F-ATGGTTGGAAGAGGAGACTG
R-AGTCATTCGATCCTCGAGTC
242
9Ca-15730(CGC)8F-CATCAAAACCGACAACACC
R-CGGTCAACATCATTCAAGAG
213
10Kn-834(AT)8F-TCAGAAGGCTCTTCTTTCAG
R-CTTTACATGGAGATAATGTTAACAA
221
11Kn-1412(GGA)10F-GTCCTTTGTACGGTGATGTT
R-TAGCTTCCGGAGTTCAATAG
242
12Kn-2291(GAG AAG)4F-GAAGACGAAGATGATTCGAG
R-TGGGTTTCACTTAAACAGCT
275
13Kn-7108(TTTC)4F-TTGCTGCTTCGACTACTTTG
R-GGTCATGCAACATAAACTGC
231
14Kn-7480(GAC)9F-GCAACTTAGGTCAACAGAGG
R-CTCCTACCAACAAAGCATTC
268
15Kn-30956(CTC)6F-TGAAGCTCCTCCACTCTACC
R-ACAAGGGCACTCATTCTGTT
237
Disclaimer/Publisher’s Note: The statements, opinions and data contained in all publications are solely those of the individual author(s) and contributor(s) and not of MDPI and/or the editor(s). MDPI and/or the editor(s) disclaim responsibility for any injury to people or property resulting from any ideas, methods, instructions or products referred to in the content.

