1. Introduction
Genus
Salix L. (Salicaceae) includes about 500 species worldwide, concentrated in temperate and cold regions of the Northern Hemisphere. Although it presents greater diversity in areas such as China (around 275 species; [
1]), more than 100 species are found in North America [
2]. Willow species are cultivated worldwide for the production of biomass and for environmental applications [
3] using short-rotation intensive culture (SRIC). Some willow species and cultivars have been favored due to their high biomass yield [
4,
5]. In North America, most of the cultivars used for biomass production are of exotic origins. The use of native species could represent several advantages to stimulate the deployment of bioenergy plantations. In addition to their higher level of social acceptability, it is believed that native species will be better adapted to the pedoclimatic conditions characterizing North American regions. They are also characterized by a higher genetic diversity within their geographical distribution than introduced cultivars and they could be exploited for diverse applications [
6].
The North American willow species,
Salix amygdaloides,
S. discolor,
S. eriocephala,
S. interior and
S. nigra, have morphological traits that suggest high biomass potential. These shrubs can grow rapidly to 6–8 meters and are widespread in eastern North America [
2]. Among these,
Salix eriocephala is of particular interest because of its extensive North-South distribution and adaptation to a range of climatic conditions. Knowledge of the genetic diversity of populations is a prerequisite to breeding programs aimed at improving biomass production. At a broader scale, given that half the current range of this species was once covered by Quaternary glaciers, genetic information may provide clues to the species population structure following recolonization of glaciated areas [
7]. Barker
et al. [
8] developed 46 microsatellite markers in
Salix, of which 17 were polymorphic (2–22 alleles per locus). Two studies derived microsatellite markers for
Salix from the related
Populus trichocarpa (Salicaceae) genome [
9] to evaluate genetic diversity: Puschenreiter
et al. [
10] successfully amplified 73% of the
Populus SSRs assayed in
S. caprea (only 10% were polymorphic), each of which was functional on a variable number of species among the four species assayed; Lin
et al. [
6] used eight microsatellite markers, from both
Populus and the Barker study (PMGC2709, PMGC2889, Karp_SB24, Karp_SB199, Karp_SB493, Karp_W293, Karp_W504 and Karp_W784) to compare the genetic diversity of
S. eriocephala to that of
S. purpurea (introduced willow) at a regional level.
Here, we assayed 24 microsatellite markers on five willow species and characterized 11 polymorphic microsatellite markers for S. eriocephala in widely distributed populations in eastern Canada. Our objectives were: (1) to determine whether these markers were present in the North American Salix species studied, and (2) to evaluate polymorphisms within the species S. eriocephala.
2. Results and Discussion
In total, twelve microsatellites were amplified with
Salix species of this study and five markers were shared in these willows (
Table 1). In addition, WPMS_7 amplified in
S. amygdaloides,
S. discolor,
S. interior and
S. nigra; ORPM_207 and PMGC_2658 in
S. amygdaloides,
S. eriocephala and
S. nigra; PMGC_2315 in
S. amygdaloides,
S. eriocephala and
S. interior; and WPMS_18 in
S. discolor and
S. eriocephala. Two markers (ORPM_21 and ORPM_349) were present only in
S. eriocephala.
Table 1.
Characteristics of 24 microsatellite markers used for five willow species, of which 11 successfully amplified for Salix eriocephala. Information on each primer pair includes locus name, expected size (bp) in poplar, forward and reverse sequences, repeat motif, successful amplification with populations of S. amygdaloides (Sa), S.discolor (Sd), S.eriocephala (Se), S. interior (Si) and S. nigra (Sn), and number of cycles (Ca).
| Locus a | Expected size (bp) in poplar | Primers sequences (5'–3') | Repeat motif | Successful amplification with populations of | Number of cycles Ca |
|---|
| Sa | Sd | Se | Si | Sn |
|---|
| GCPM_1011 | 221 | F: ATGAAATAATCGTTTGGTGC | (AT)11 | + | + | + | + | + | 27 |
| R: CACCCGAGTTTATCTCACTC |
| GCPM_1037 | 123 | F: ATGAAATTCGCAAAGTCAGT | (TA)11 | + | + | + | + | + | 33 |
| R: AAAAGAGGAAATTACGGTCC |
| GCPM_1043 | 154 | F: TTTCCATGTAGTATTACTCCTTTCT | (AT)21 | - | - | - | - | - | 33 |
| R: ATGCGTACCTTAGTGGAAGA |
| ORPM_16 | 238 | F: GCAGAAACCACTGCTAGATGC | (CTT)15 | - | - | - | - | - | 33 |
| R: GCTTTGAGGAGGTGTGAGGA |
| ORPM_21 | 230 | F: GGCTGCAGCACCAGAATAAT | (AG)4 | - | - | + | - | - | 25 |
| R: TGCATCCAAAATTTTCCTCTTT |
| ORPM_23 | 197 | F: ATTCCATTTGGCAATCAAGG | (AT)6(AG)6 | - | - | - | - | - | 33 |
| R: CCCTGAAAGTCACGTCTTCG |
| ORPM_29 | 206 | F: TGGTGATCCAGTTTTGGTGA | (AC)11 | - | - | - | - | - | 33 |
| R: GTCCTTGCAAGCCATGAA |
| ORPM_127 | 200 | F: TCAATGAGGGGTGCCATAAT | (TG)8 | - | - | - | - | - | 33 |
| R: CTTTCCACTTTTGGCCCTTT |
| ORPM_203 | 209 | F: CCACCAGGCATGAGATATGA | (TA)4(A/T rich region) | - | - | - | - | - | 33 |
| R: TCAAACCGAAAGGTCAACAA |
| ORPM_206 | 196 | F: CCGTGGCCATTGACTCTTTA | (GCT)7 | - | - | - | - | - | 33 |
| R: GAACCCATTTGGTGCAAGAT |
| ORPM_207 | 199 | F: TGCATATTTCACGTGCCTTT | (TC)8 | + | - | + | - | + | 25 |
| R: CAAAGTGAGGAAGCGTCAGA |
| ORPM_349 | 202 | F: GAGCATGAAGCATGAGCAGA | (AC)16 | - | - | + | - | - | 33 |
| R: TTTTCAGAACCAGGGGAAAA |
| PMGC_223 | 170 | F: CGATGAGGTTGAAGAAGTCG | (CTT)n | + | + | + | + | + | 25 |
| R: ATATATGTACCGGCACGCCAC |
| PMGC_2015 | 160 | F: TTTTGGCATTCAAAGACTTGGC | (GA)n | - | - | - | - | - | 33 |
| R: AGTTGATTCCATGTCGTGTCC |
| PMGC_2315 | 143 | F: CTGTGGTATTTGTGCAATGTG | (GA)n | + | - | + | + | - | 33 |
| R: CAACAGAGCAAACTTGAGTCG |
| PMGC_2392 | 192 | F: AAGAGAGATAGCATCACCAAG | (GA)n | - | - | - | - | - | 33 |
| R: TATGTCGAGGAAATCCTTAGC |
| PMGC_2531 | 140 | F: TAAGAGAATTGGGAGAGCAAC | (GA)n | - | - | - | - | - | 33 |
| R: TTTTATCTTTTCCAGTTGTCTAC |
| PMGC_2610 | 114 | F: AACACGCAAGAACATACATAAG | (GA)n | - | - | - | - | - | 33 |
| R: GATTAACATGTTTCGCTACGC |
| PMGC_2647 | 129 | F: CTCGTTAATTAGAGTCGAATTAG | (GA)n | - | - | - | - | - | 33 |
| R: TTGTTATCCACTGCCAGTGC |
| PMGC_2658 | 251 | F: GCCCTTGAATACCATGAGCG | (GA)n | + | - | + | - | + | 33 |
| R: ACCTTCAGTAGATCAGGTTAGTG |
| WPMS_7 | 230 | F: ACTAAGGAGAATTGTTGACTAC | (GT)24 | + | + | - | + | + | 33 |
| R: TATCTGGTTTCCTCTTATGTG |
| WPMS_15 | 193 | F: CAACAAACCATCAATGAAGAAGAC | (CCT)n | + | + | + | + | + | 25 |
| R: AGAGGGTGTTGGGGGTGACTA |
| WPMS_16 | 145 | F: CTCGTACTATTTCCGATGATGACC | (GTC)n | + | + | + | + | + | 25 |
| R: AGATTATTAGGTGGGCCAAGGACT |
| WPMS_18 | 245 | F: CTTCACATAGGACATAGCAGCATC | (GTG)13 | - | + | + | - | + | 33 |
| R: CACCAGAGTCATCACCAGTTATTG |
For
S. eriocephala, population genetic statistics are summarized in
Table 2,
Table 3, which shows the number of alleles (A), observed (
Ho) and expected (
He) heterozygosities,
p-values for the Hardy-Weinberg Expected test, and details of each population. Eleven of the 24 markers were successfully amplified in the six populations of
S. eriocephala (
Table 1) and they were single markers. The values of A varied between 1 and 9 (mean 2.95) (
Table 2). All 11 markers were polymorphic in at least one population (
Table 2). The means of
Ho and
He ranged from 0.52 to 0.68 and from 0.43 to 0.56, with mean values of 0.59 and 0.48, respectively (
Table 3). These results reveal a new set of polymorphic microsatellite markers in which the genetic diversity within the
S. eriocephala populations is expressed clearly.
Tuskan
et al. [
9] using the complete genome of
Populus trichocarpa, characterized microsatellites markers and predicted that 30–50% of these might transfer to the related
Salix. Puschenreiter
et al. [
10] successfully amplified 73% of microsatellite markers assayed, 10% of which were polymorphic. Out of 28
Populus loci assayed, Lin
et al. [
6] used four loci in their willow study that proved polymorphic (no data were available on the percentage that amplified in willow but were monomorphic). Our amplification success of
Populus microsatellites was 50% (polymorphic in at least one species), which falls within the range predicted by Tuskan
et al. [
9]; the difference in the percentage of polymorphic amplified loci in the Puschenreiter
et al. [
10] study and ours may stem from the fact that the former used less individuals per species to characterize their loci. In
Salix eriocephala, Lin
et al. [
6] obtained a higher number of alleles (8–13
vs. 1–9) for
Populus-derived loci, but their population size was much larger than that of populations in our study, which may account for some of the difference. Furthermore, some of our populations were at the extreme northern edge of the species range of
S. eriocephala and may have lost genetic diversity while migrating northward after glaciations [
7]. In all these studies, a majority of markers amplified and were polymorphic for many species, with a number being variably useful depending on the species.
Table 2.
Results of initial primer screening in six populations of Salix eriocephala. Two populations (MON and SHE) are part of a provenance trial maintained at the Montreal Botanical Garden (45°33'41'' N, 73°34'7'' W) and four were collected in nature (BEL, BLA, RAD and VDO). The localization of each population is 49°45.456' N, 77°36.921' W (BEL); 45°41.160' N, 73°51.908' W (BLA); 46°94' N, 70°60' W (MON); 53°41.441' N, 78°06.596' W (RAD); 45°71' N, 64°77' W (SHE) and 48°01.770' N, 77°45.937' W (VDO). Data on markers alleles. The range of allele sizes includes 23 bp of M13 sequence.
| Locus | Range of allele sizes (bp) | BEL | BLA | MON | RAD | SHE | VDO | Average |
|---|
| GCPM_1011 | 207–229 | 3 | 4 | 1 | 4 | 1 | 4 | 2.83 |
| GCPM_1037 | 93–188 | 3 | 3 | 5 | 3 | 5 | 5 | 4.00 |
| ORPM_21 | 201–229 | 1 | 2 | 3 | 4 | 1 | 2 | 2.17 |
| ORPM_207 | 186–221 | 4 | 1 | 1 | 7 | 1 | 4 | 3.00 |
| ORPM_349 | 127–133 | 2 | 2 | 2 | 1 | 2 | 2 | 1.83 |
| PMGC_223 | 181–219 | 3 | 2 | 2 | 2 | 2 | 5 | 2.67 |
| PMGC_2315 | 142–182 | 3 | 2 | 3 | 2 | 1 | 3 | 2.33 |
| PMGC_2658 | 205–242 | 9 | 6 | 5 | 8 | 4 | 6 | 6.33 |
| WPMS_15 | 161–229 | 4 | 2 | 2 | 5 | 1 | 2 | 2.67 |
| WPMS_16 | 137–185 | 2 | 3 | 3 | 3 | 3 | 5 | 3.17 |
| WPMS_18 | 245–248 | 1 | 1 | 2 | 1 | 2 | 2 | 1.50 |
Table 3.
Genetic diversity statistics. N = number of individuals sampled in the population.
Table 3.
Genetic diversity statistics. N = number of individuals sampled in the population.
| Population | N | A | Ho | He | p-HWE |
|---|
| BEL | 10 | 3.18 | 0.60 | 0.44 | 0.51 |
| BLA | 8 | 2.45 | 0.68 | 0.46 | 0.15 |
| MON | 7 | 2.82 | 0.64 | 0.49 | 0.40 |
| RAD | 12 | 3.64 | 0.57 | 0.43 | 0.38 |
| SHE | 8 | 2.09 | 0.54 | 0.47 | 0.46 |
| VDO | 13 | 3.55 | 0.52 | 0.56 | 0.15 |
3. Experimental Section
Six populations of
S. eriocephala were selected to reflect the wide distribution of this species (
Table 1 and
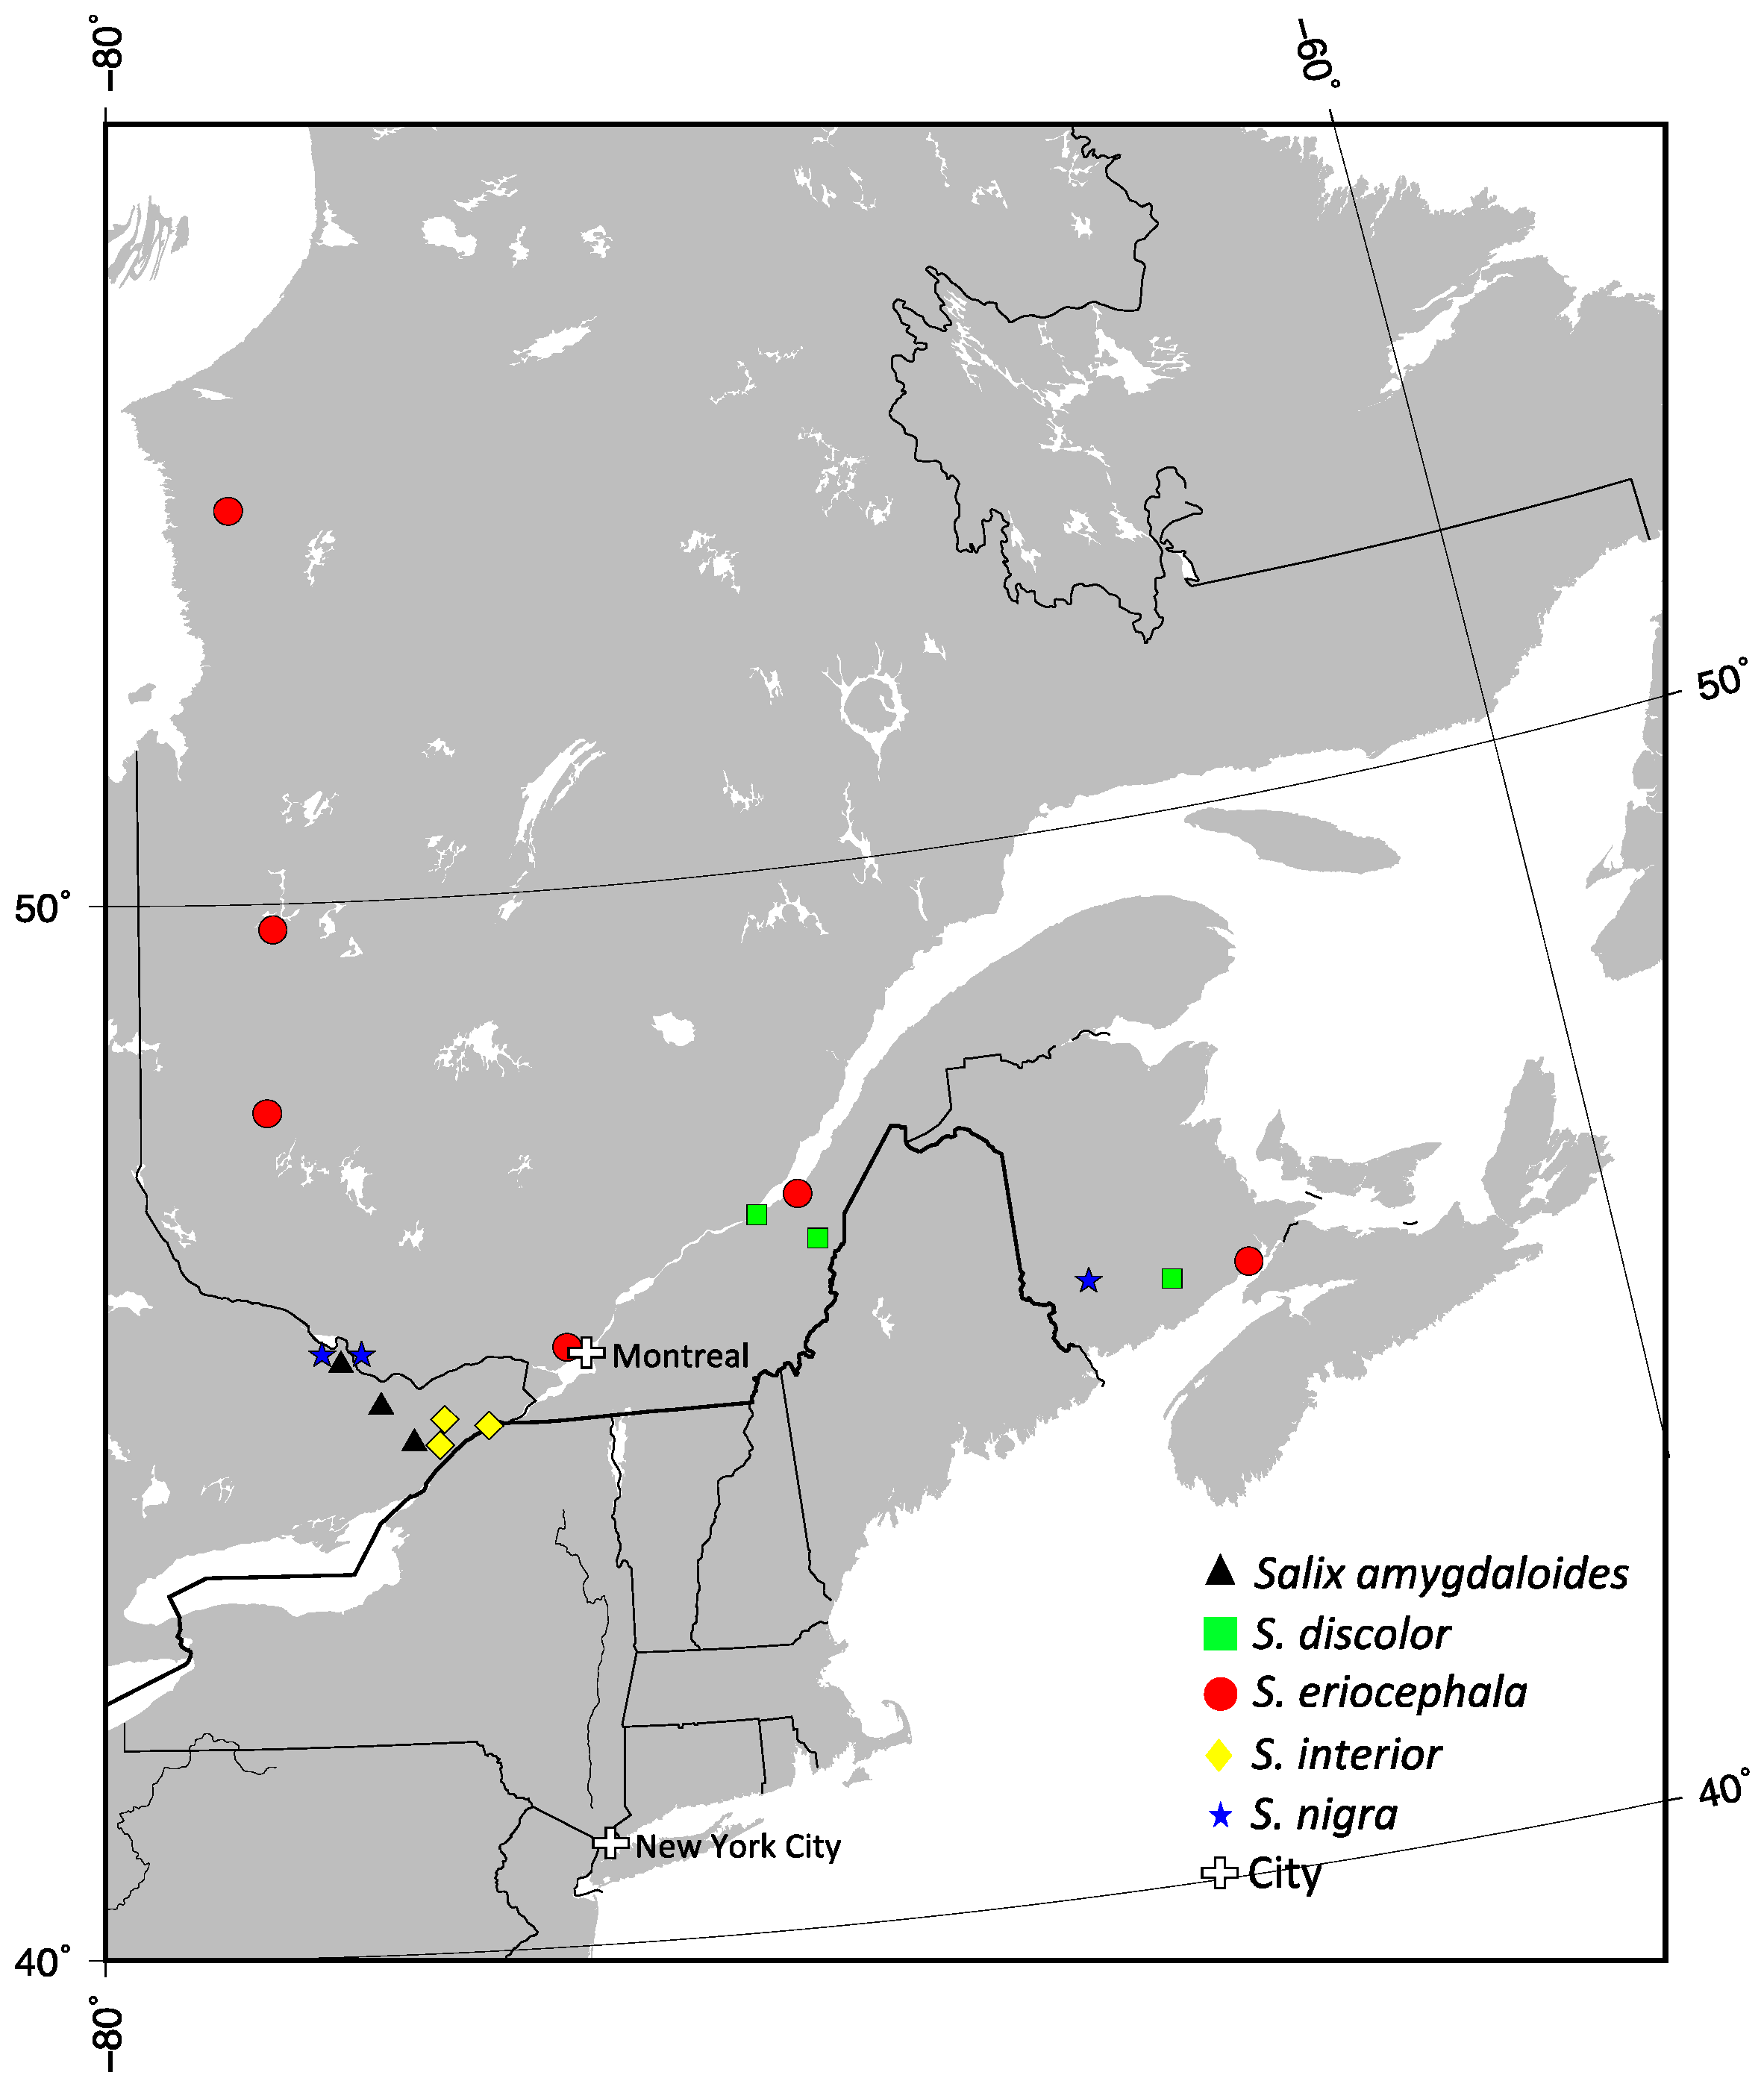
Figure 1). These populations were collected at Matagami, QC (BEL, 10 trees); Blainville, QC (BAL, 8 trees); Montmagny, QC (MON, 7 trees); Radisson, QC (RAD, 12 trees); Shepody Creek, NB (SHE, 8 trees) and Val d’Or, QC (VDO, 13 trees). Two are part of a provenance trial maintained at the Montreal Botanical Garden, and four were collected in the wild in 2010–2011. For
S. amygdaloides,
S. discolor,
S. interior and
S. nigra, we used three populations each from Eastern Canada (
Table 1 and
Figure 1). The samples of
S. amygdaloides were collected at Cobden lake, ON (4 trees); Hanlon Marsh, ON (4 trees); and Richmond Fen, ON (4 trees). The samples of
S. discolor were collected at Levis, QC (10 trees); Montmagny, QC (8 trees); and Norton, NB (10 trees). The samples of
S. interior were collected at Lafarge Pit, ON (5 trees); Limerick Forest, ON (5 trees); and Long Sault, ON (5 trees). The samples of
S. nigra were collected at Gagetown, NB (4 trees); Pembroke, ON (4 trees); and Westmeath, ON (6 trees).
Figure 1.
The localization of populations used in this study from Eastern Canada. Triangle for Salix amygdaloides, square for S. discolor, circle for S. eriocephala, lozenge for S. interior and star for S. nigra.
Figure 1.
The localization of populations used in this study from Eastern Canada. Triangle for Salix amygdaloides, square for S. discolor, circle for S. eriocephala, lozenge for S. interior and star for S. nigra.
Genomic DNA was extracted from 25 mg of leaf material using a modified CTAB method [
11]. Leaf tissue was ground for 60 s in a TissueLyser II (QIAGEN) equipped with a 3 mm tungsten ball. 400 μL of 2× CTAB (2% (w/v) hexaldecyltrimethylammonium bromide), 8 μL of mercaptoethanol and 1% (w/v) polyvinylpyrrolidone were added to the powder; the mixture was vortexed and incubated at 65 °C for 90 min. An equal volume of isoamyl alcohol:chloroform (24:1) was then added. Following centrifugation at 4,000 rpm for 30 min at 4 °C, the aqueous phase was collected and the DNA was precipitated by the addition of 2:3 volumes of isopropanol; it was conserved at −20 °C overnight. Then, after centrifugation at 4,000 rpm for 30 min at 4 °C, the pellet was washed with 500 μL of 70% ethanol and centrifuged at 4,000 rpm for 10 min at 4 °C. The DNA pellet was suspended in 100 μL TE (10 mN Tris-HCl pH 8.5, 1 mM EDTA) and stored at −20 °C until analysis.
The International
Populus Genome Consortium identified 4,200
Populus SSRs [
6,
12,
13]. A selection of 24 microsatellite markers (
Table 1) was initially assayed to visualize the amplifications. The protocol developed by Schuelke [
14] was used to amplify the microsatellite regions. This method fluoresces the PCR products at 700 nm or 800 nm for detection by laser. In this protocol, three primers are necessary: a specific forward primer with a M13 tail at its 5' end, a specific reverse primer, and the fluorescent-labeled M13 primer (5'-AGGGTTTTCCCAGTCACGACGTT-3'). PCRs were carried out in a 10 μL solution containing 0.5 μL of genomic DNA (approximately 50 ng), 0.75× of PCR buffer (BIO BASIC), 0.10 μM of forward primer, 0.25 μM of reverse primer, 0.15 μM of fluorescent-labeled M13 primer (Integrated DNA Technologies), 0.25 mM of dNTPs, 2.25 mM of MgCl
2, 1 U Taq DNA polymerase (GenScript). An Eppendorf Mastercycler
® pro Thermal Cyclers (Eppendorf) under the following cycling parameters: initial denaturation at 94 °C for 3 min followed by 25–33 cycles (
Table 1) of 30 s at 94 °C; 30 s at 52 °C, 45 s at 72 °C and followed by a final extension at 72 °C for 5 min was used. The successful amplification was visualized on agarose gel (1%); the results are summarized in
Table 1. For
S. eriocephala, amplification products were separated on a 6.5% KBPlus Gel Matrix and visualized using a 4,300 DNA Analyzer from LI-COR. The SagaGT v3.2 software was used to calculate band sizes. For each locus, we calculated standard population genetic statistics (
Ho,
He and
p-HWE) using GENEPOP v.4.2 [
15,
16].


