4.1. Morphological Diversity
Crop breeding programs produce new varieties with the aim of improving the responses of the crop to abiotic and biotic stresses. In creating salt-tolerant cultivars, breeding programs are evaluating diverse genotypes to increase their utility [
47]. Salt tolerance is a complicated trait and is caused by a plethora of interrelated mechanisms of morphological, physiological, and biochemical attributes. These attributes are closely linked to the considerable constraints of salinity on plant growth—for instance, osmotic effects, ion toxicity, limitation of CO
2 gas exchange, water stress, carbon metabolism, metabolic derangements, and oxidative damage. In addition, they operate in coordination to mitigate both the cellular hyperosmolarity and ion imbalance [
8,
9,
10]. The screening of salt-tolerant wheat genotypes is a major step towards selecting the genotypes compatible with the land salinization and poor water quality, which are associated with irrigation.
The increase in land salinization continues to negatively impact yields and has been found to create a harvest index ranging from 0.2 to 0.5, depending upon the duration of treatment and increase in the salt concentration [
48]. In addition, low levels of salinity may not reduce yields, although there is a decrease in the leaf numbers, biomass, and leaf area [
49]. A major objective of crop breeding programs is the production of new varieties with improved salt tolerance. We evaluated 18 genotypes (15 DHLs and three check cultivars), as well as the morphological, physiological, and biochemical responses after 43 days of salinity treatment, as this signified the onset of the symptoms of death in the sensitive plant. Our results show that significant variances occur among the tested traits of wheat genotypes (
Table 1). Under salinity, the SL and SDM decreased in each of the genotypes, with the highest decrease occurring in the sensitive check cultivar (Gemmeiza-9). Similar results were recorded by [
50,
51]. The decrease in plant growth traits (SL and SDM) has primarily been a result of the inhibition of cell growth and division, owing to Na accumulation [
10]. The limitation of leaf growth is the first toxicity phenomenon of salinity, partly because of the decreased hydraulic conductance in plants [
52,
53,
54]. The sensitive check cultivar (Gemmeiza-9) and some salt-sensitive lines exhibited high RN under salinity treatment (150 mM NaCl) compared with the control treatment and tolerant check cultivar (Sakha-93) (
Table 1). This may explain that the existence of salinity stress-caused damage to the roots, and plants tend to proliferate roots during periods of increased salt levels to absorb more water and protect the photosynthetic process [
9,
32].
Salinity induces the accumulation of reactive oxygen species (ROS) in the cells at the subcellular level, particularly in chloroplasts and mitochondria, important sources of ROS in plants subjected to salt stress, which can affect the photosynthetic process, resulting in growth inhibition and a low grain yield [
55]. Plants have antioxidant mechanisms, such as CAT, POD, and PPO, for scavenging the excess ROS, which prevents cellular damage. Plant genes encode different ROS-detoxifying and ROS-producing enzymes, which aid in ROS-scavenging in the cell [
56]. We found that salt tolerance correlated with higher levels of certain antioxidant enzymes. Conversely, salt-sensitive genotypes showed ineffective responses or a decline in antioxidant levels, with lower antioxidant levels than salt-tolerant genotypes, which is consistent with Acosta-Motos et al. [
9].
The highly significant differences between the 18 genotypes used in our study indicate the existence of variance due to the relative change between the control and salinity treatments for all measured traits (
Table 2). Heritability information, detailing the amount of genetic and environmental variation [
57], may be relied upon to predict the reliability of the phenotypic value as an indicator of the breeding value [
58]. However, heritability alone is insufficient for selection without also relying on the genetic gain (GG). A combination of both a h
2 < 60 and GG > 30 for all traits, shows that the variation in these traits is mainly due to genetic contributions, meaning they could be drawn upon during the selection process and suggesting that the majority of the gene effects are additive (
Table 2). Therefore, we can use the traits with a high h
2 and GG when selecting for salinity tolerance [
6]. Given the weakness of the predicted response for the selection of salinity tolerance based on the SDM alone, the identification of the relationships of the SDM with the studied traits could provide insight into the studied traits, which could be used indirectly to select for/enhance the SDM. In addition, understanding how the studied traits impact on the SDM (either positively or negatively) would help plant breeders in making the appropriate decisions for the breeding strategy, which is highly desirable if methods that are inexpensive, quick, and easily measurable became available [
17].
In optimal conditions, the plants maintain photosynthesis at an optimal level through a balance between the size of the assimilation surface, transpiration, and chlorophyll. However, in stress conditions, plants reduce in growth due to a reduction in the number and area of the leaves. Our findings, presented in
Table 2, indicate a sharp reduction in the SDM accompanied by a relative diminution of about 30% in the salt-sensitive genotypes, such as the sensitive check cultivar (Gemmeiza-9) and some DHLs that showed sensitivity, including DHL3, DHL7, DHL14, DHL15, DHL22, and DHL29. In contrast, in the salt-tolerant genotypes, such as the tolerant check cultivar (Sakha-93) and some DHLs that showed tolerance, including DHL2, DHL5, DHL21, DHL25, and DHL26, SDM reduction was considerably lower than in the salt-sensitive genotypes.
Simple correlations, without the consideration of the interactions between the SDM and related traits, may mislead plant breeders from achieving their primary objective [
59]. Therefore, we used multivariate analyses (best model regression and stepwise regression). These methods were used by [
60,
61,
62] in several studies, using all traits as independent variables so that the dependent variable allowed us to identify the relationships among traits that described salinity tolerance. Instead of considering only the SDM, other parameters, such as the RDM and RT, could be unbiased parameters and impact on the assessment of salinity tolerance (
p > 0.01,
Table 3). The stepwise regression model involves integrating as few variables as possible, because each irrelevant regressor decreases the precision of the estimated coefficients and predicted values. In addition, the presence of extra variables increases the complexity of the data collection and model maintenance. The stepwise regression model has a significant coefficient of determination (R
2) of 0.907 from 1.000. In this study, the two independent variables, RDM and RT, could be unbiased parameters for assessing the salinity tolerance, given their contribution in the production of the SDM as a dependent variable. The great contribution of the RT on the SDM supported its significance as a selective standard in wheat. Therefore, it may be used as a criterion in screening and selection to measure the optimum genotypes for salt tolerance after removing the RDM trait due to its weak contribution, measurement difficulties, and high cost [
19,
63,
64].
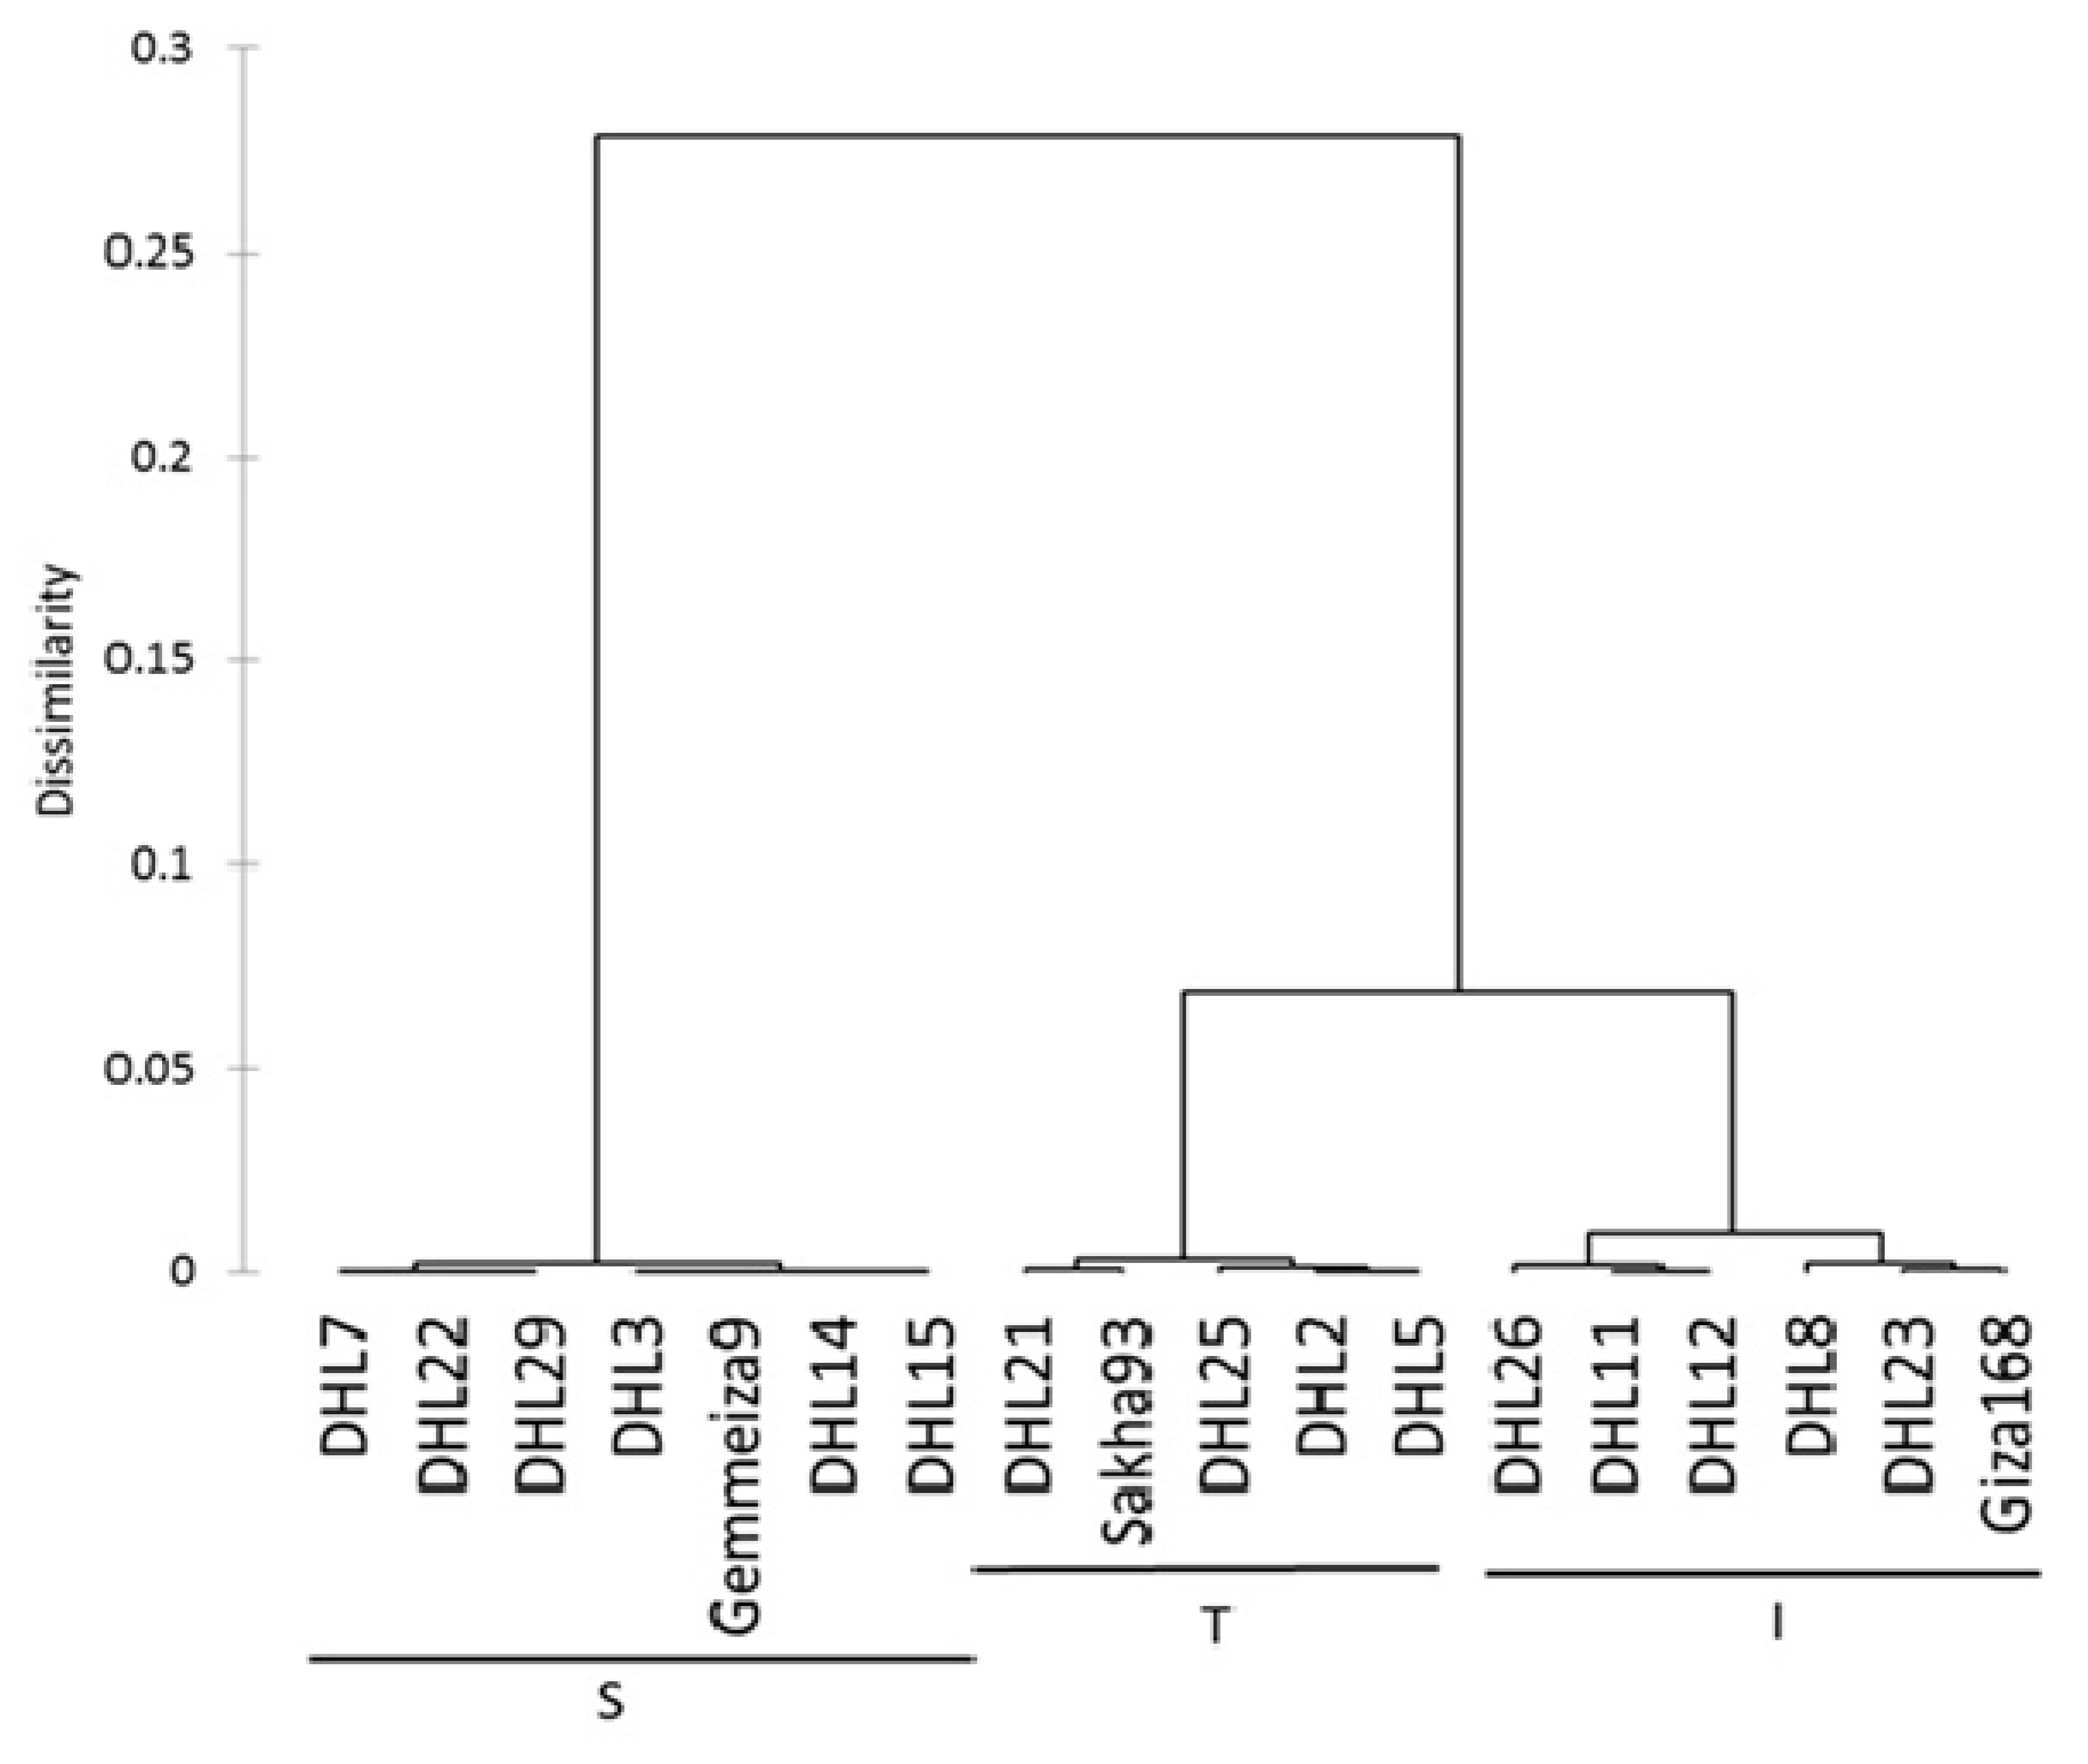
The genotypes showed natural genetic differences among themselves, given that genotypes that excel in one trait will simultaneously be inferior in other traits [
15]. A dendrogram was constructed, based on the relative change of the RT and SDM, for the classification of the 18 genotypes into three main clusters. The separation and classification according to the salinity tolerance between genotypes was clear. The highest degree of salinity tolerance was in five genotypes, including DHL2, DHL5, DHL21, DHL25, and Sakha-93 (group T,
Figure 1). The high value for the relative change of the RT indicates that the photosynthetic ability of the sensitive plants under salt stress were limited due to chlorine poisoning and a reduction in the shoot growth [
10,
65,
66]. The relative change was the highest with RT and the lowest with SDM in group T (DHL2, DHL5, DHL25, DHL21, and Sakha-93) compared to group S (DHL3, DHL7, DHL8, DHL14, DHL15, DHL22, DHL29, and Gemmeiza-9), which showed quite the reverse along the line.
RT integrates the leaf water potential with the effects of osmotic adjustment (a robust mechanism to maintain cellular hydration) as a barometer of plant water status. The tolerant genotype has the power to minimize stress through the conservation of turgid leaves under stress conditions, which will have physiological advantages, such as growth and stomatal activity, and will protect and maintain the photosystem complex [
67]. The relative difference in the water content of the leaf samples provides a quantitative measure of their infield hydration status. Trials can be rapidly screened for genotypes that maintain high leaf RT values during water deficit stress and vice-versa. Group T was less affected by salinity due to catalase activity, which can detoxify due to amendments in the leaf morphology, chlorophyll composition, and biochemical actives that inhibit the oxidative damage through photosynthesis, heat fragmentation by the xanthophyll pigments, and electron transfer to oxygen acceptors other than water [
10,
68]. The suggestion was also made that differences in the antioxidant activity between genotypes may be because of differences in the closure level of the stomata and in other responses that increase CO
2 fixation [
10].
4.2. Genetic Diversity
Another important conclusion in this study is the identification of information concerning genetic diversity. The degree of genetic variation between and within groups is the outcome of various factors, such as gene flow, hybridization, the selection effect, genetic drift, and natural and/or artificial mutagens [
69]. Knowing more about the degree of molecular variation, as well as the genetic structure of genotypes, is an important tool for its maintenance [
70]. Molecular markers play a key role in identifying the genetic variation of different species and/or varieties, and many studies searching for genetic diversity within wheat genotypes based on agro-morphological descriptions noted large phenotypic variation within genotypes [
70,
71,
72]. In our study, the morphological description of genotypes was based on their salinity tolerance and showed the diversity between groups. However, morphological descriptions are not always sufficient to conclude the presence of genetic variability, owing to their vulnerability to environmental factors. DNA markers have been proven to be a reliable and precise method to detect genetic diversity, which worked to increase the chances of survival in a saline environment.
SSRs are powerful markers used in assessing polymorphisms and the degree of genetic variation of many plant species, including wheat [
70]. In this study, 43 different SSR markers were tested and selected for their association with salt tolerance genes in wheat [
29,
32,
44]. Here, we evaluated 23 SSR markers that generated polymorphisms to decipher their discriminating capacity between the salt-tolerant genotypes through identifying allele markers that are associated with each genotype. High parameter values (TNB, NPB, PPB%, PIC, and DP%) were registered, which showed that the used SSR markers are helpful in detecting the genetic variability of wheat genotypes (
Table 4). We obtained 42 alleles in total, with an average of 2.33 alleles and a PIC value greater than 0.50, indicating the ability of these markers to analyze the genetic variability of wheat genotypes, which were consistent with the results obtained in wheat genotypes using different SSR markers by [
30,
32,
44]. These findings suggest that the tested markers are informative and capable of detecting salt-tolerant genotypes.
In our results, the salt-intermediate group (I) showed the highest genetic variability (H = 0.34; I = 0.50; PPL = 76.05%), indicating more diversity among themselves compared to the salt-sensitive group (S), which showed the lowest variability (H = 0.25; I = 0.39; PPL = 66.67%) (
Table 6). The higher degree of genetic diversity between genotypes and groups in our study may be attributed to the genotypes being either tolerant or sensitive towards salinity and a higher number of alleles associated with salt tolerance genes in wheat being located using the SSR markers.
The genetic structure analysis results showed that all genotypes were assigned to three groups or clusters based on their salinity response, as indicated by the groups in
Figure 1. The tolerant group (T) is detached from the other two groups and includes four DHLs from individuals of the intermediate group (I), which showed some deviation. This explains that it is possible that the morphological distance is not the principal factor in partitioning groups’ “genetic structures”, owing their effect to the environmental conditions or because salt tolerance mechanisms are polygenic in nature. Thus, it is possible that the markers we used were too few in number. The third cluster was composed entirely of individuals belonging to the salt-sensitive group (S). Many reports have revealed that the clustering of genotypes based on different agronomic, morphological, and/or physiological parameters have a high correlation with the analysis based on SSR marker data [
32,
73,
74]. However, this is different to that previously described by other studies, including [
12,
75,
76]. A potential explanation for this is a difference in the genotypes used and their places of origin, as well as a difference in the markers used and their types.
A comparison of genetic and morphological distances using the Mantel test is one of the most popular approaches to determine the relationship between the two. According to the Mantel test, the clustering pattern in this study is caused by both the genetic and morphological distances, as a significant positive correlation was observed (r = 0.514,
p < 0.0001, alpha = 0.05). In addition, the SSR markers were successfully used for gene tagging or used in marker-assisted selection for agronomic traits [
44,
77].
Given the importance of the markers associated with the parameters and their contribution to the tolerance, we found 17 markers associated with the phenotypic trait (R
2 ranged from 0.077 to 0.832), which could be considered as important indicators for describing the genetic diversity of salt tolerance in wheat. Given the importance of the relative change of the SDM and RT for the clustering of the phenotypic data, we found the cumulative coefficient of determination of the markers were powerful, being 0.853 and 0.826, respectively. Furthermore, the Xgwm 312 marker, which is used to detect the Nax1gene and seeks for Na exclusion as described by [
33,
34,
78], was significantly correlated with the relative change of the SDM and RT (R
2 were 0.749 and 0.628, respectively;
Table 7). This was a result of the association with DNA fragments that are closely linked to specific genes affecting salt tolerance in wheat. These results confirm that the exclusion of toxic ions (Na and/or Cl
−) from the plant cells could be used to avoid the negative effects of these ions on plant physiological processes.
As genotyping by sequencing has become increasingly more accessible, it is likely to increase the accuracy of genetic differentiation, which assists in achieving genomic selection and/or the development of markers related to the physiological parameters of salinity tolerance [
12]. The genotypes DHL2, DHL5, DHL21, DHL25, and Sakha-93 showed competitiveness, good performance, good biomass production, and high production under salt stress. Biomass production is an important indicator for evaluating salt tolerance, because it allows a direct assessment of the economic return under salt stress [
32]. Therefore, the use of tolerant genotypes will enhance the possibility of introducing new salt-tolerant genotypes of wheat through selection and hybridization of the desired genotypes, which in turn will broaden the genetic base for salt tolerance breeding.

 ,
, 

