On the Present Halting of Global Warming †

International Arctic Research Center, University of Alaska Fairbanks, USA
†
Note added by the Publisher: This paper attracts great attention. Please refer to our policy regarding possibly controversial articles.
Climate 2013, 1(1), 4-11; https://doi.org/10.3390/cli1010004
Submission received: 28 January 2013
/
Revised: 15 April 2013
/
Accepted: 15 April 2013
/
Published: 3 May 2013
Abstract
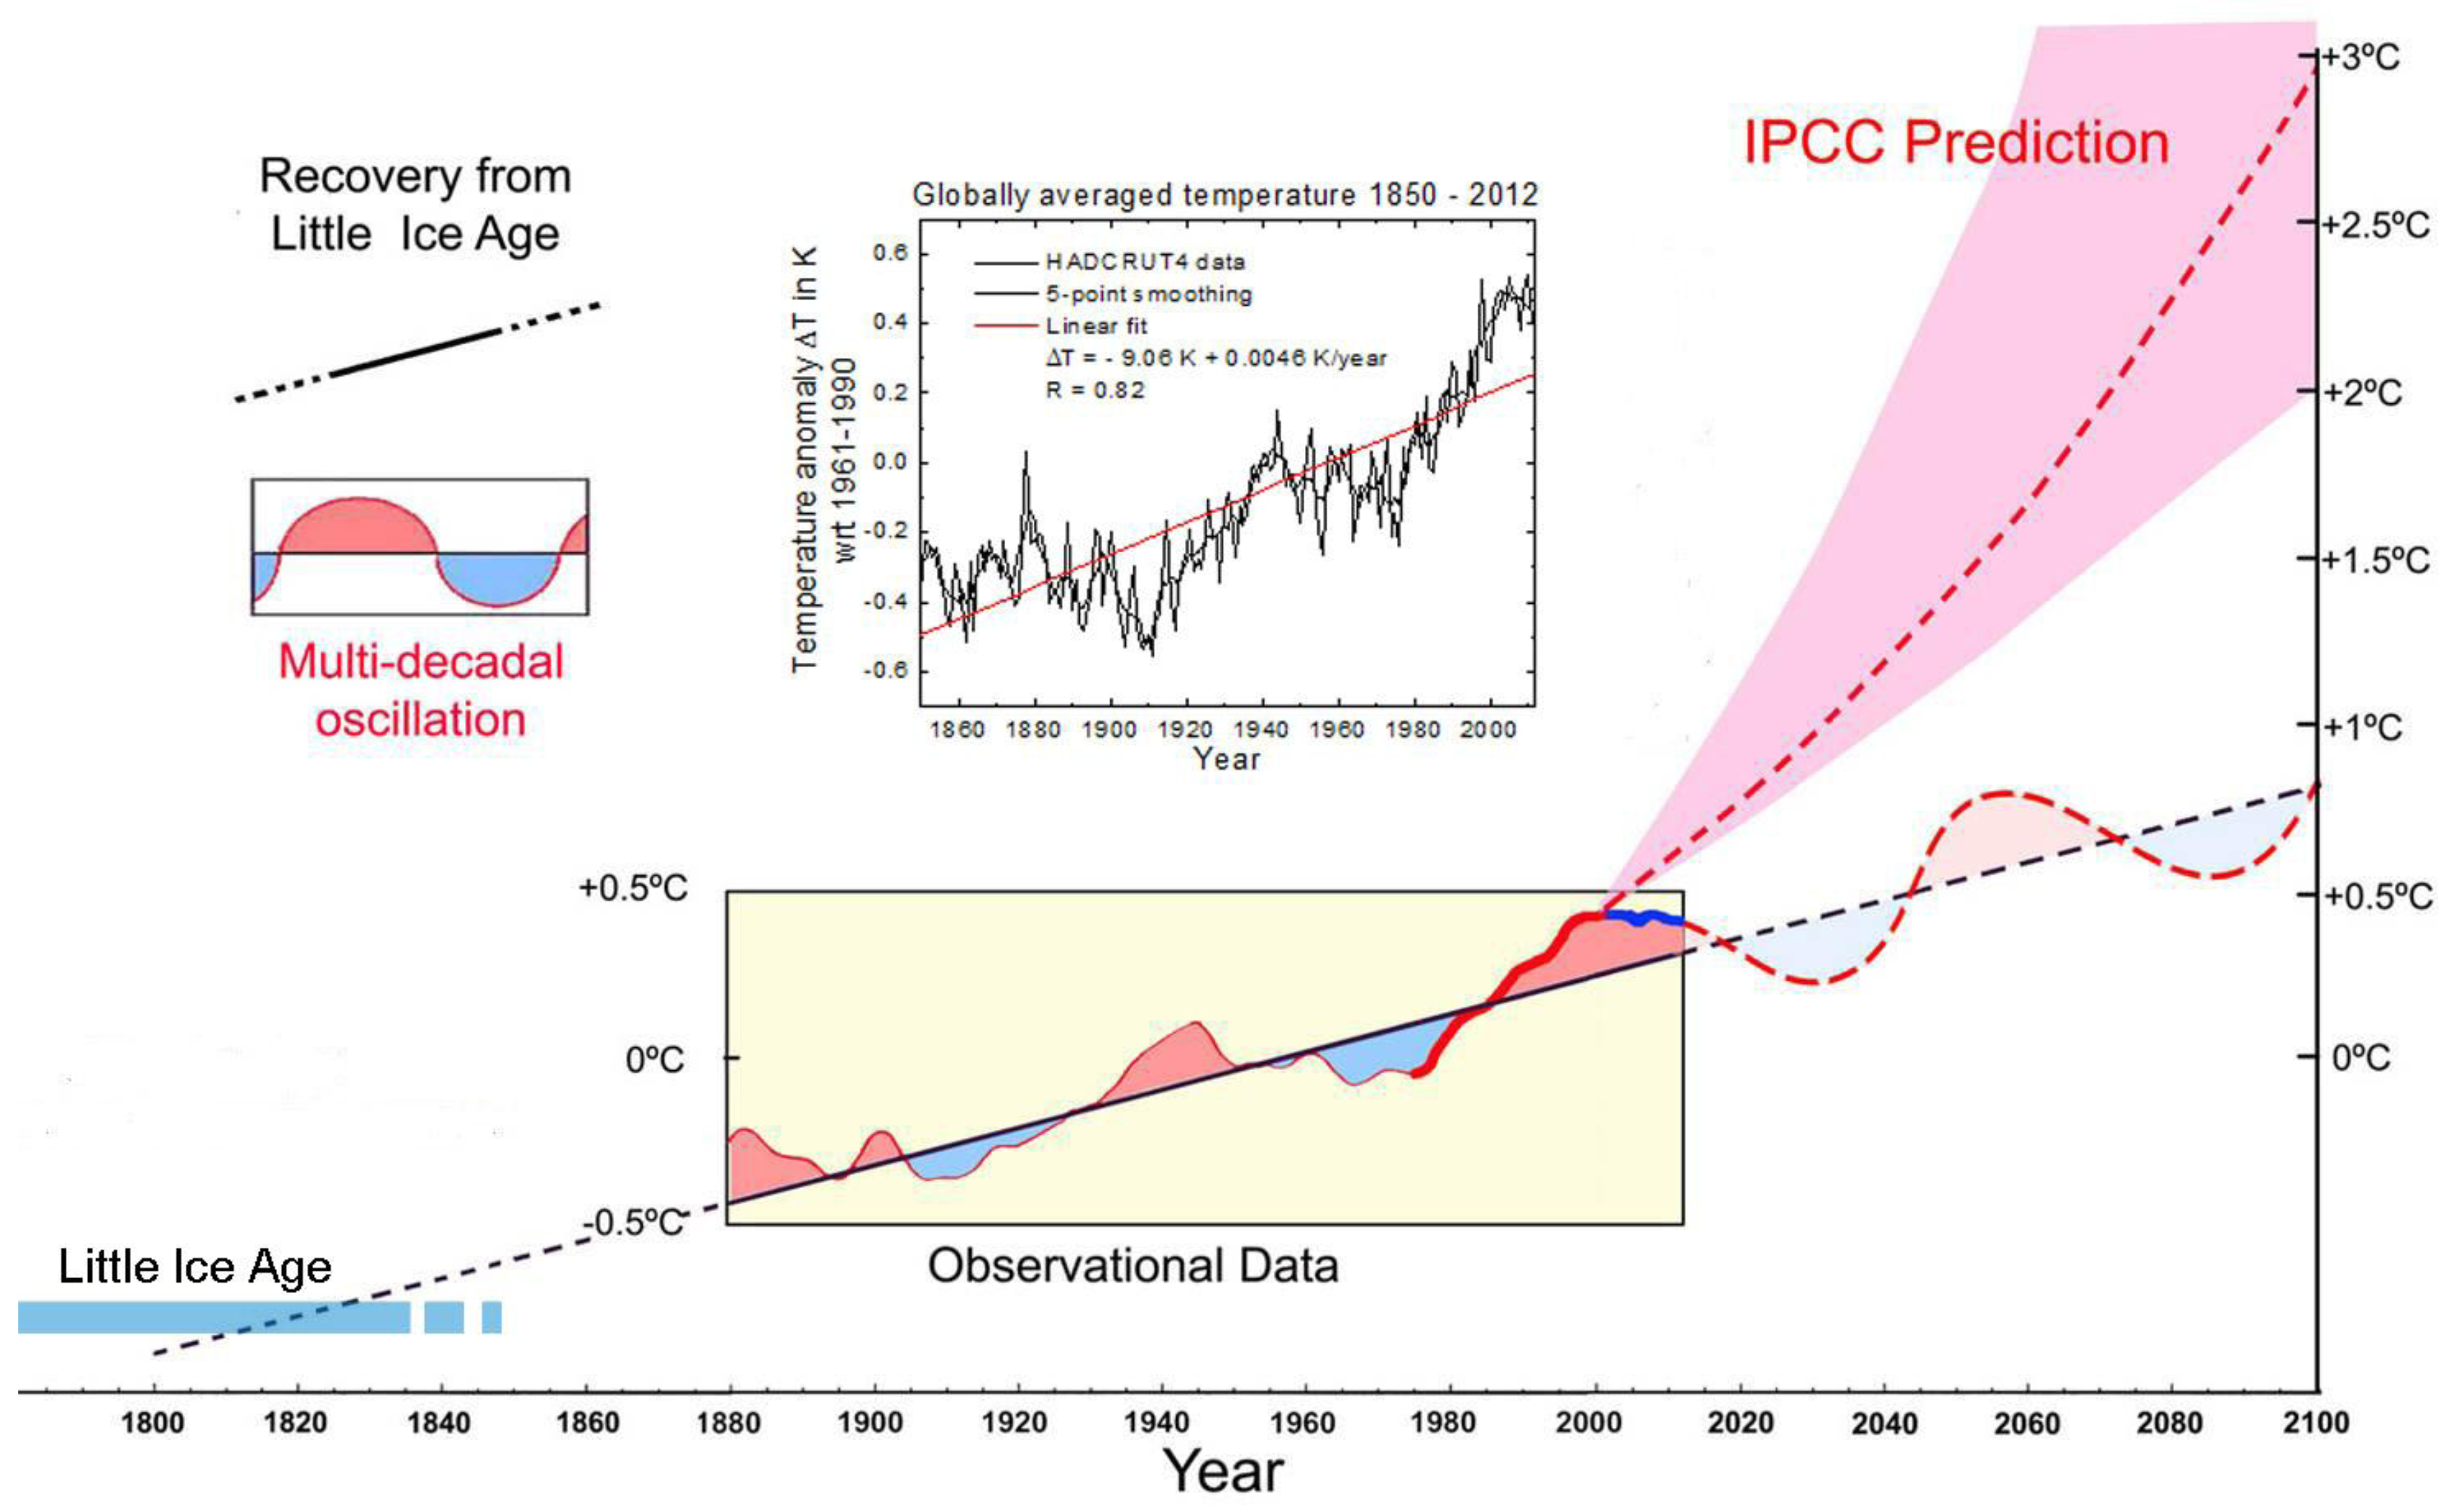
:The rise in global average temperature over the last century has halted since roughly the year 2000, despite the fact that the release of CO2 into the atmosphere is still increasing. It is suggested here that this interruption has been caused by the suspension of the near linear (+ 0.5 °C/100 years or 0.05 °C/10 years) temperature increase over the last two centuries, due to recovery from the Little Ice Age, by a superposed multi-decadal oscillation of a 0.2 °C amplitude and a 50~60 year period, which reached its positive peak in about the year 2000—a halting similar to those that occurred around 1880 and 1940. Because both the near linear change and the multi-decadal oscillation are likely to be natural changes (the recovery from the Little Ice Age (LIA) and an oscillation related to the Pacific Decadal Oscillation (PDO), respectively), they must be carefully subtracted from temperature data before estimating the effects of CO2.
1. Introduction
One of the standard processes in climatology is to construct a spectral analysis of past changes in global temperature and to try to interpret component changes. This procedure has been applied extensively to changes of the last 400 kys [1]. In this paper, we follow this process of studying changes in global average temperature over the period from 1800~1850 to 2010 to find the general trend.
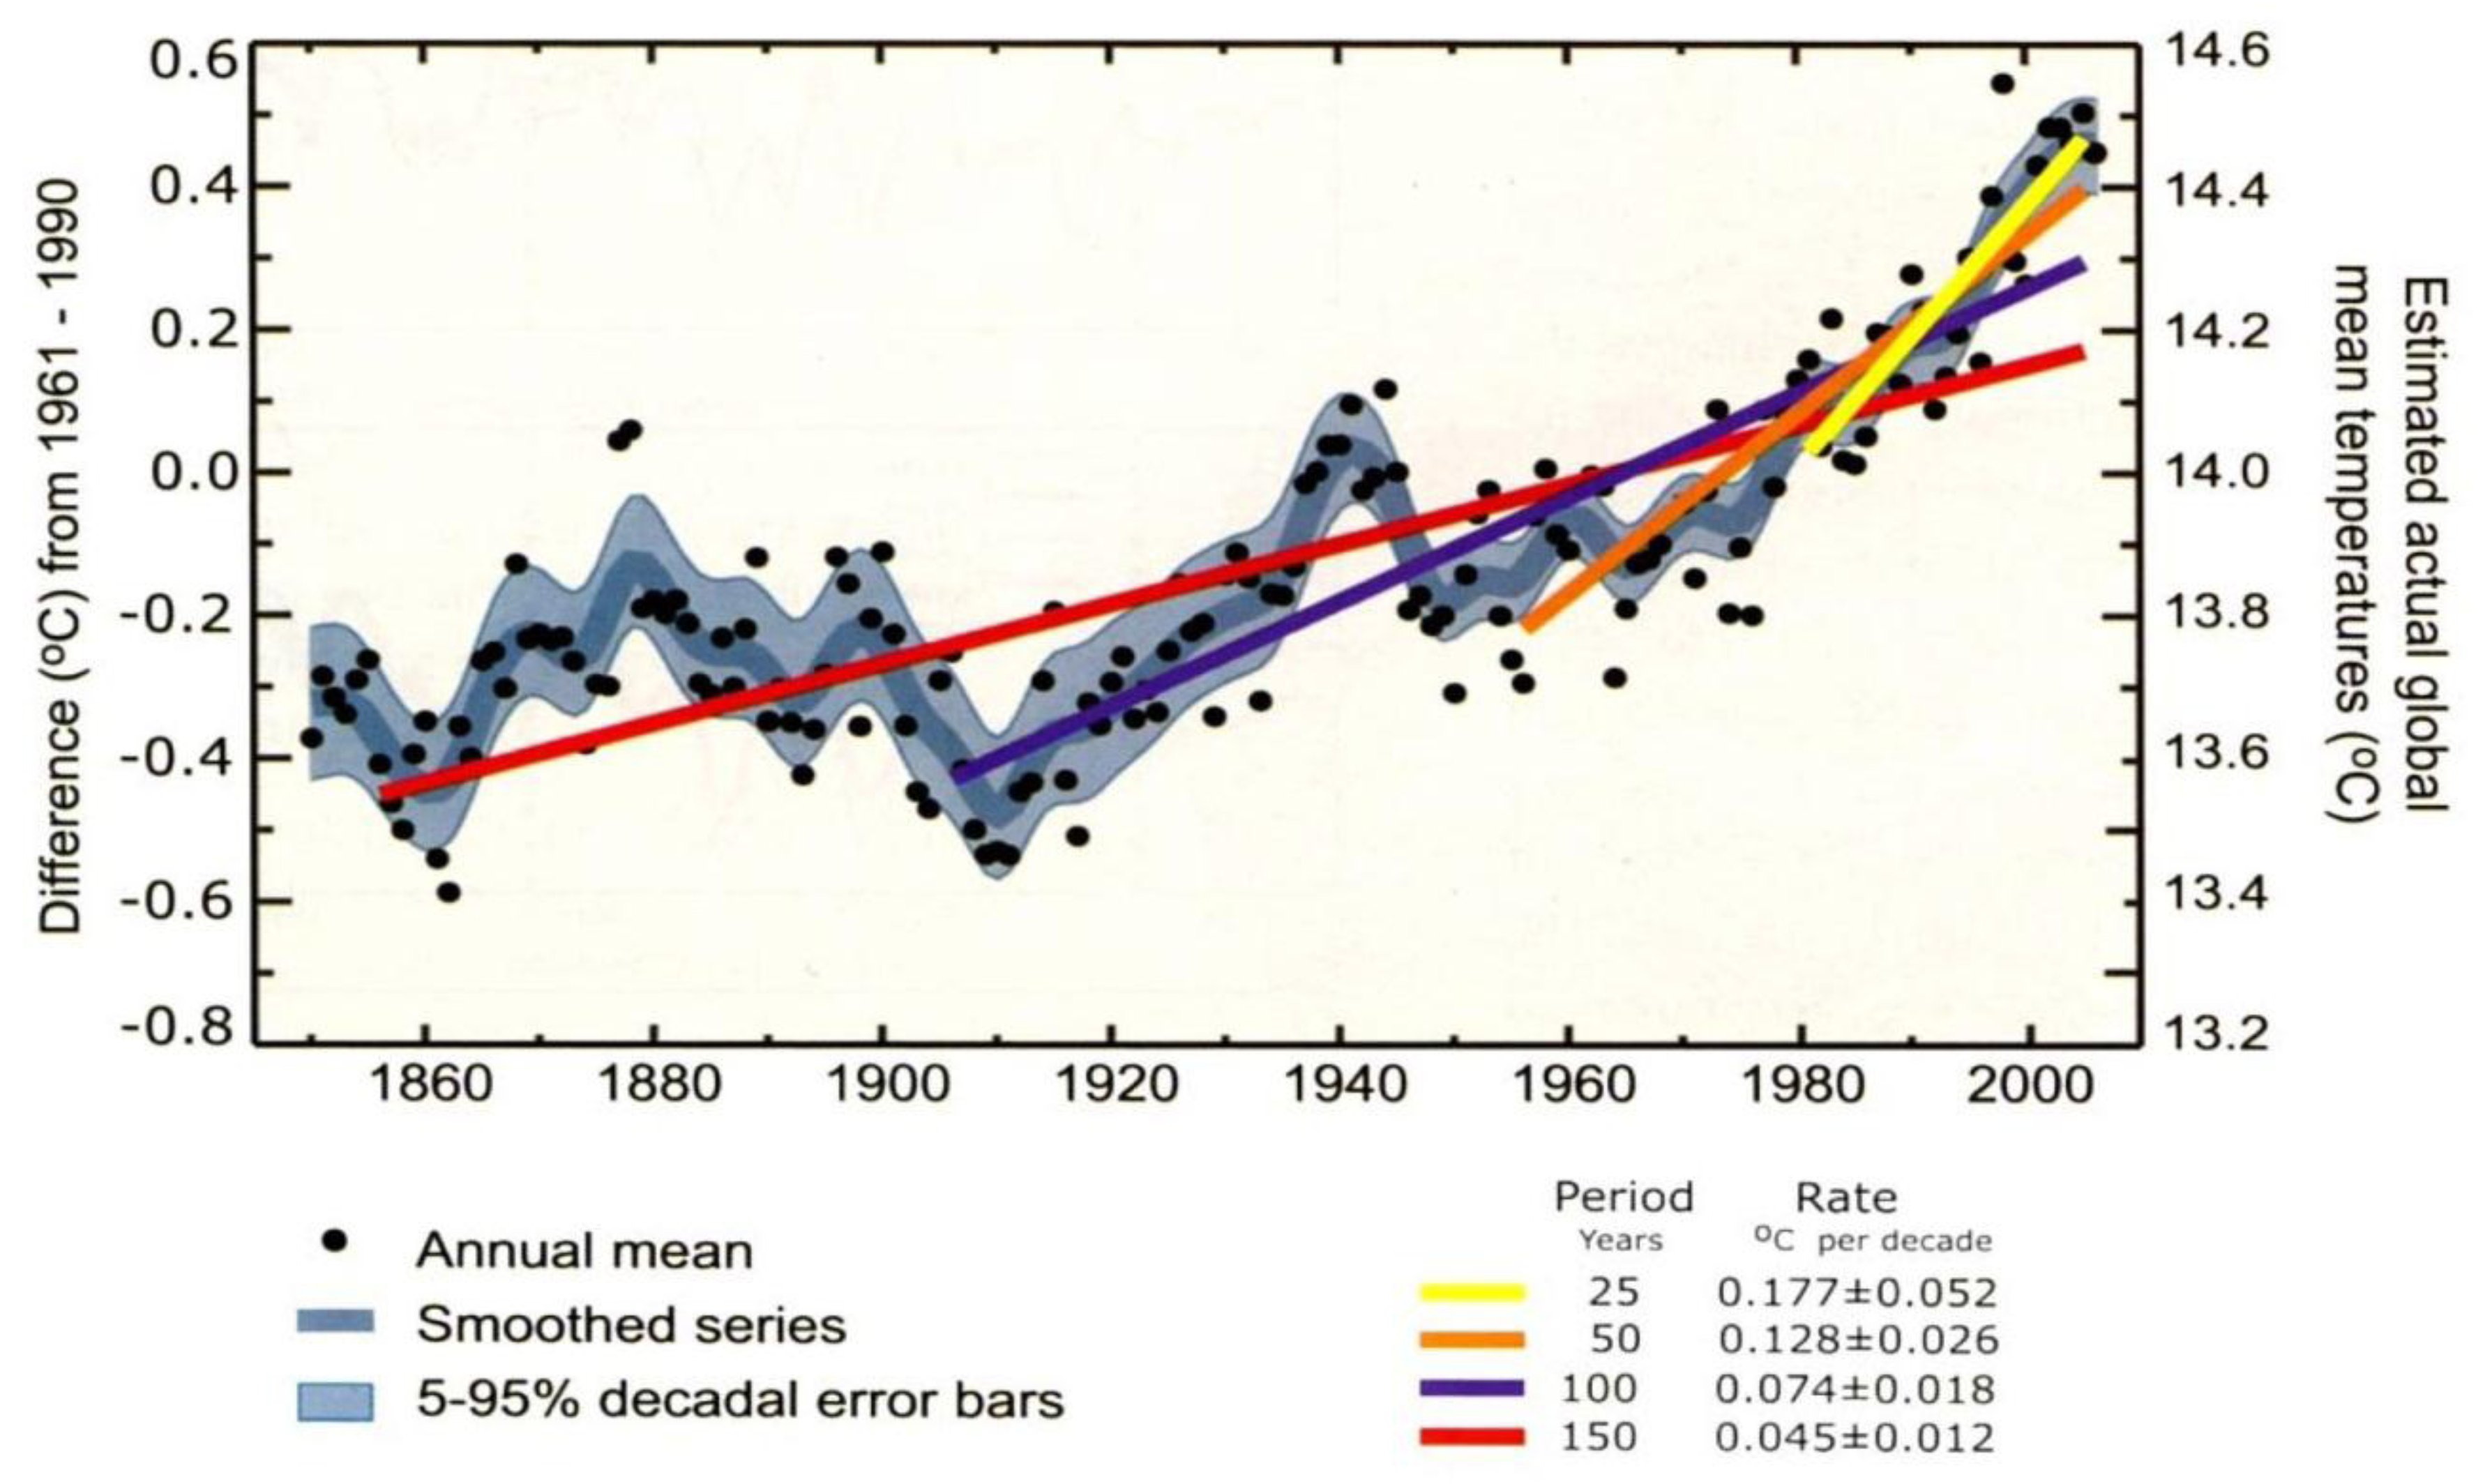
Figure 1 shows both temperature changes from 1860 to 2000 [2] and the rate of increase in temperature estimated for several different intervals. The most consistent trend is a gradual increase in temperature from 1860 to 2000, indicated here by a straight red line, with a rate of increase of 0.045 ± ° 0.012 °/10 years. Superposed on it is the most prominent change, an oscillatory change in amplitude of about 0.2 °C with a period of about 50~60 years.
Figure 1.
Global average temperature changes [2]. The rate of increase in temperature is estimated for several different time intervals.
Figure 1.
Global average temperature changes [2]. The rate of increase in temperature is estimated for several different time intervals.

2. Spectral Analysis
2.1. The Near Linear Change
Fortunately, an excellent spectral analysis of global temperature variations from 1850 to 2000 has been constructed by Wu et al. [3]. Their results further indicate that the most prominent change over this period is a near linear change represented by a rate of increase of about 0.5 °C/100 years or 0.05 °C/10 years. This near linear trend has also been noted by (Bryant, 2001) [4], who showed that there are only a few points outside the 95 % confidence limits of linear approximation.
Based on various climate change data, such as those of tree rings [5], glacial retreat [6] and river ice breakup [7], Akasofu [8] showed that global warming began as early as 1800~1850 and not after CO2 began to increase very rapidly around 1946. Further, among these factors, the sea level increase from about 1850 to 2000 was also almost linear, though with a slightly decreasing rate [9].
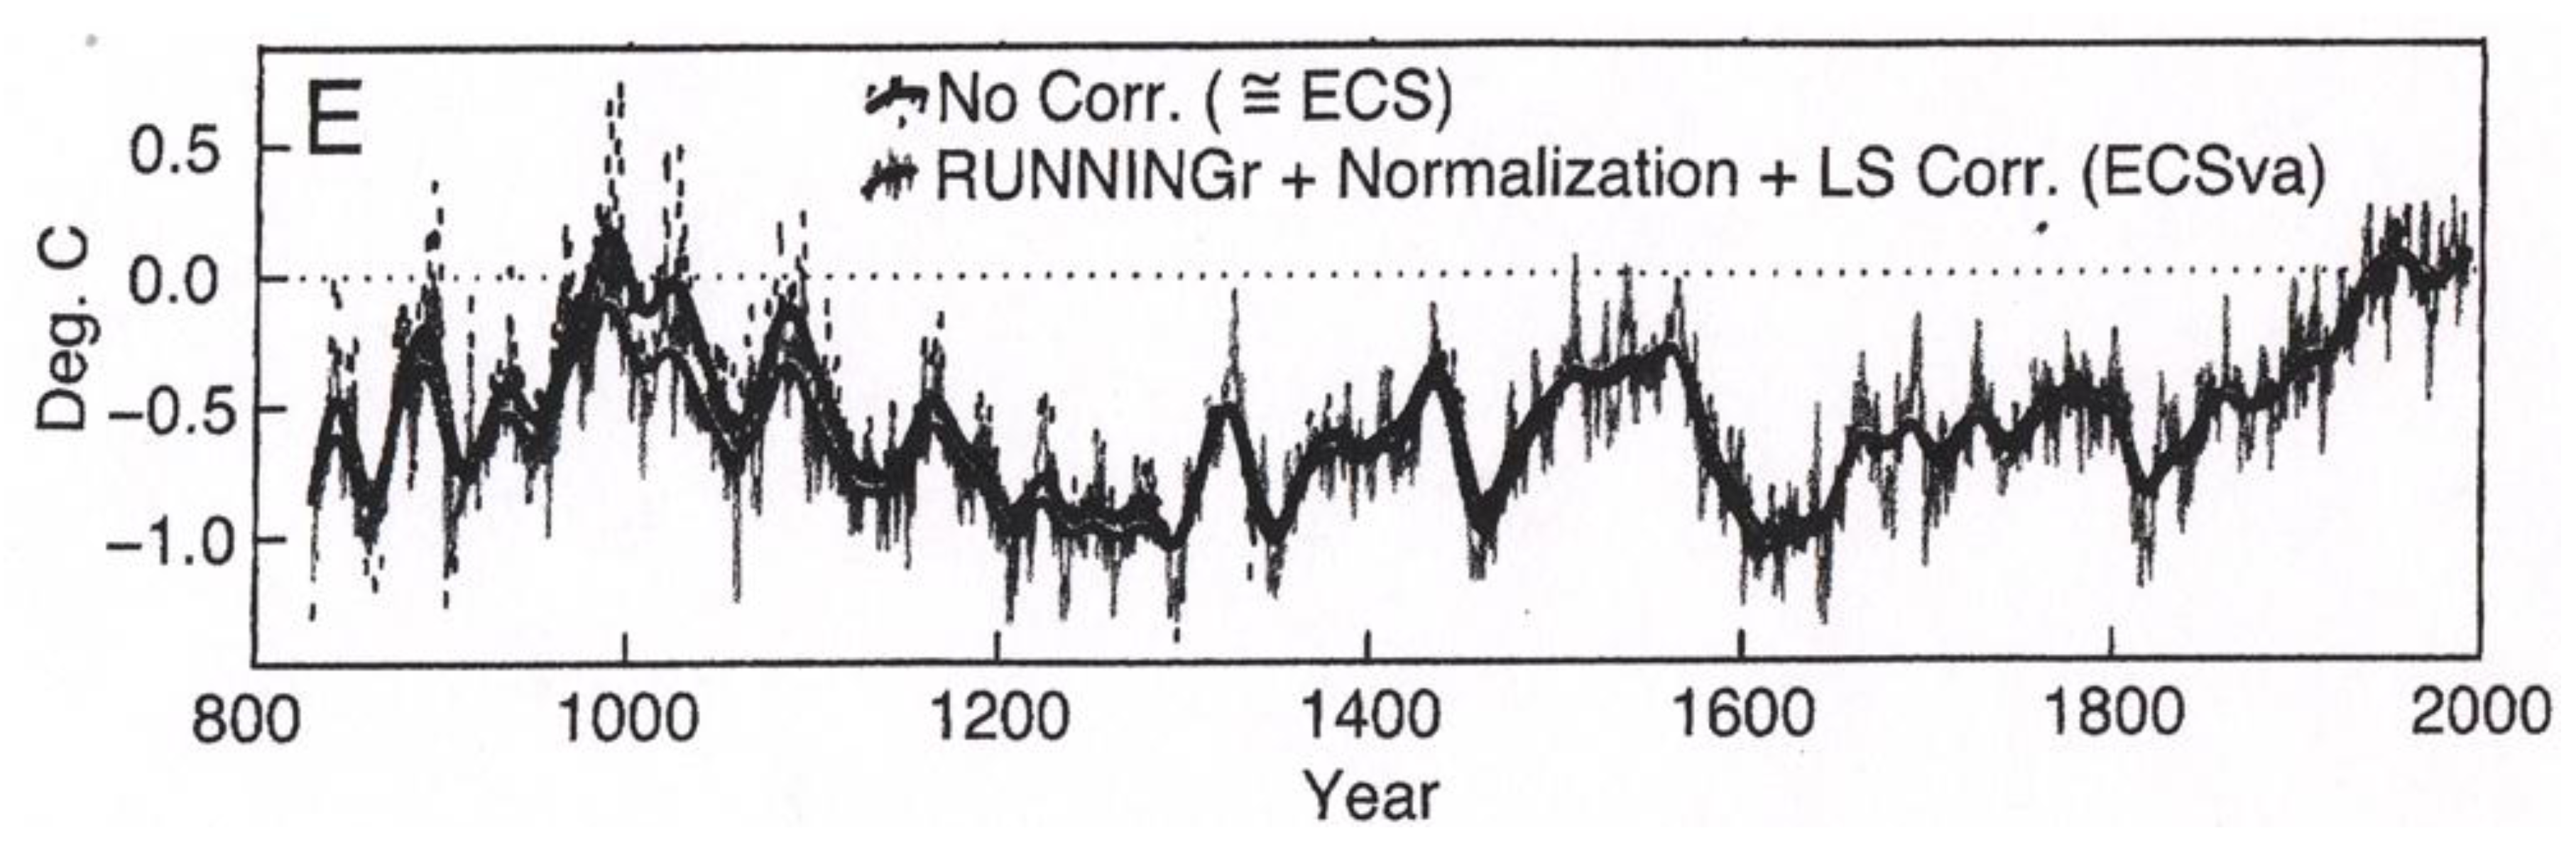
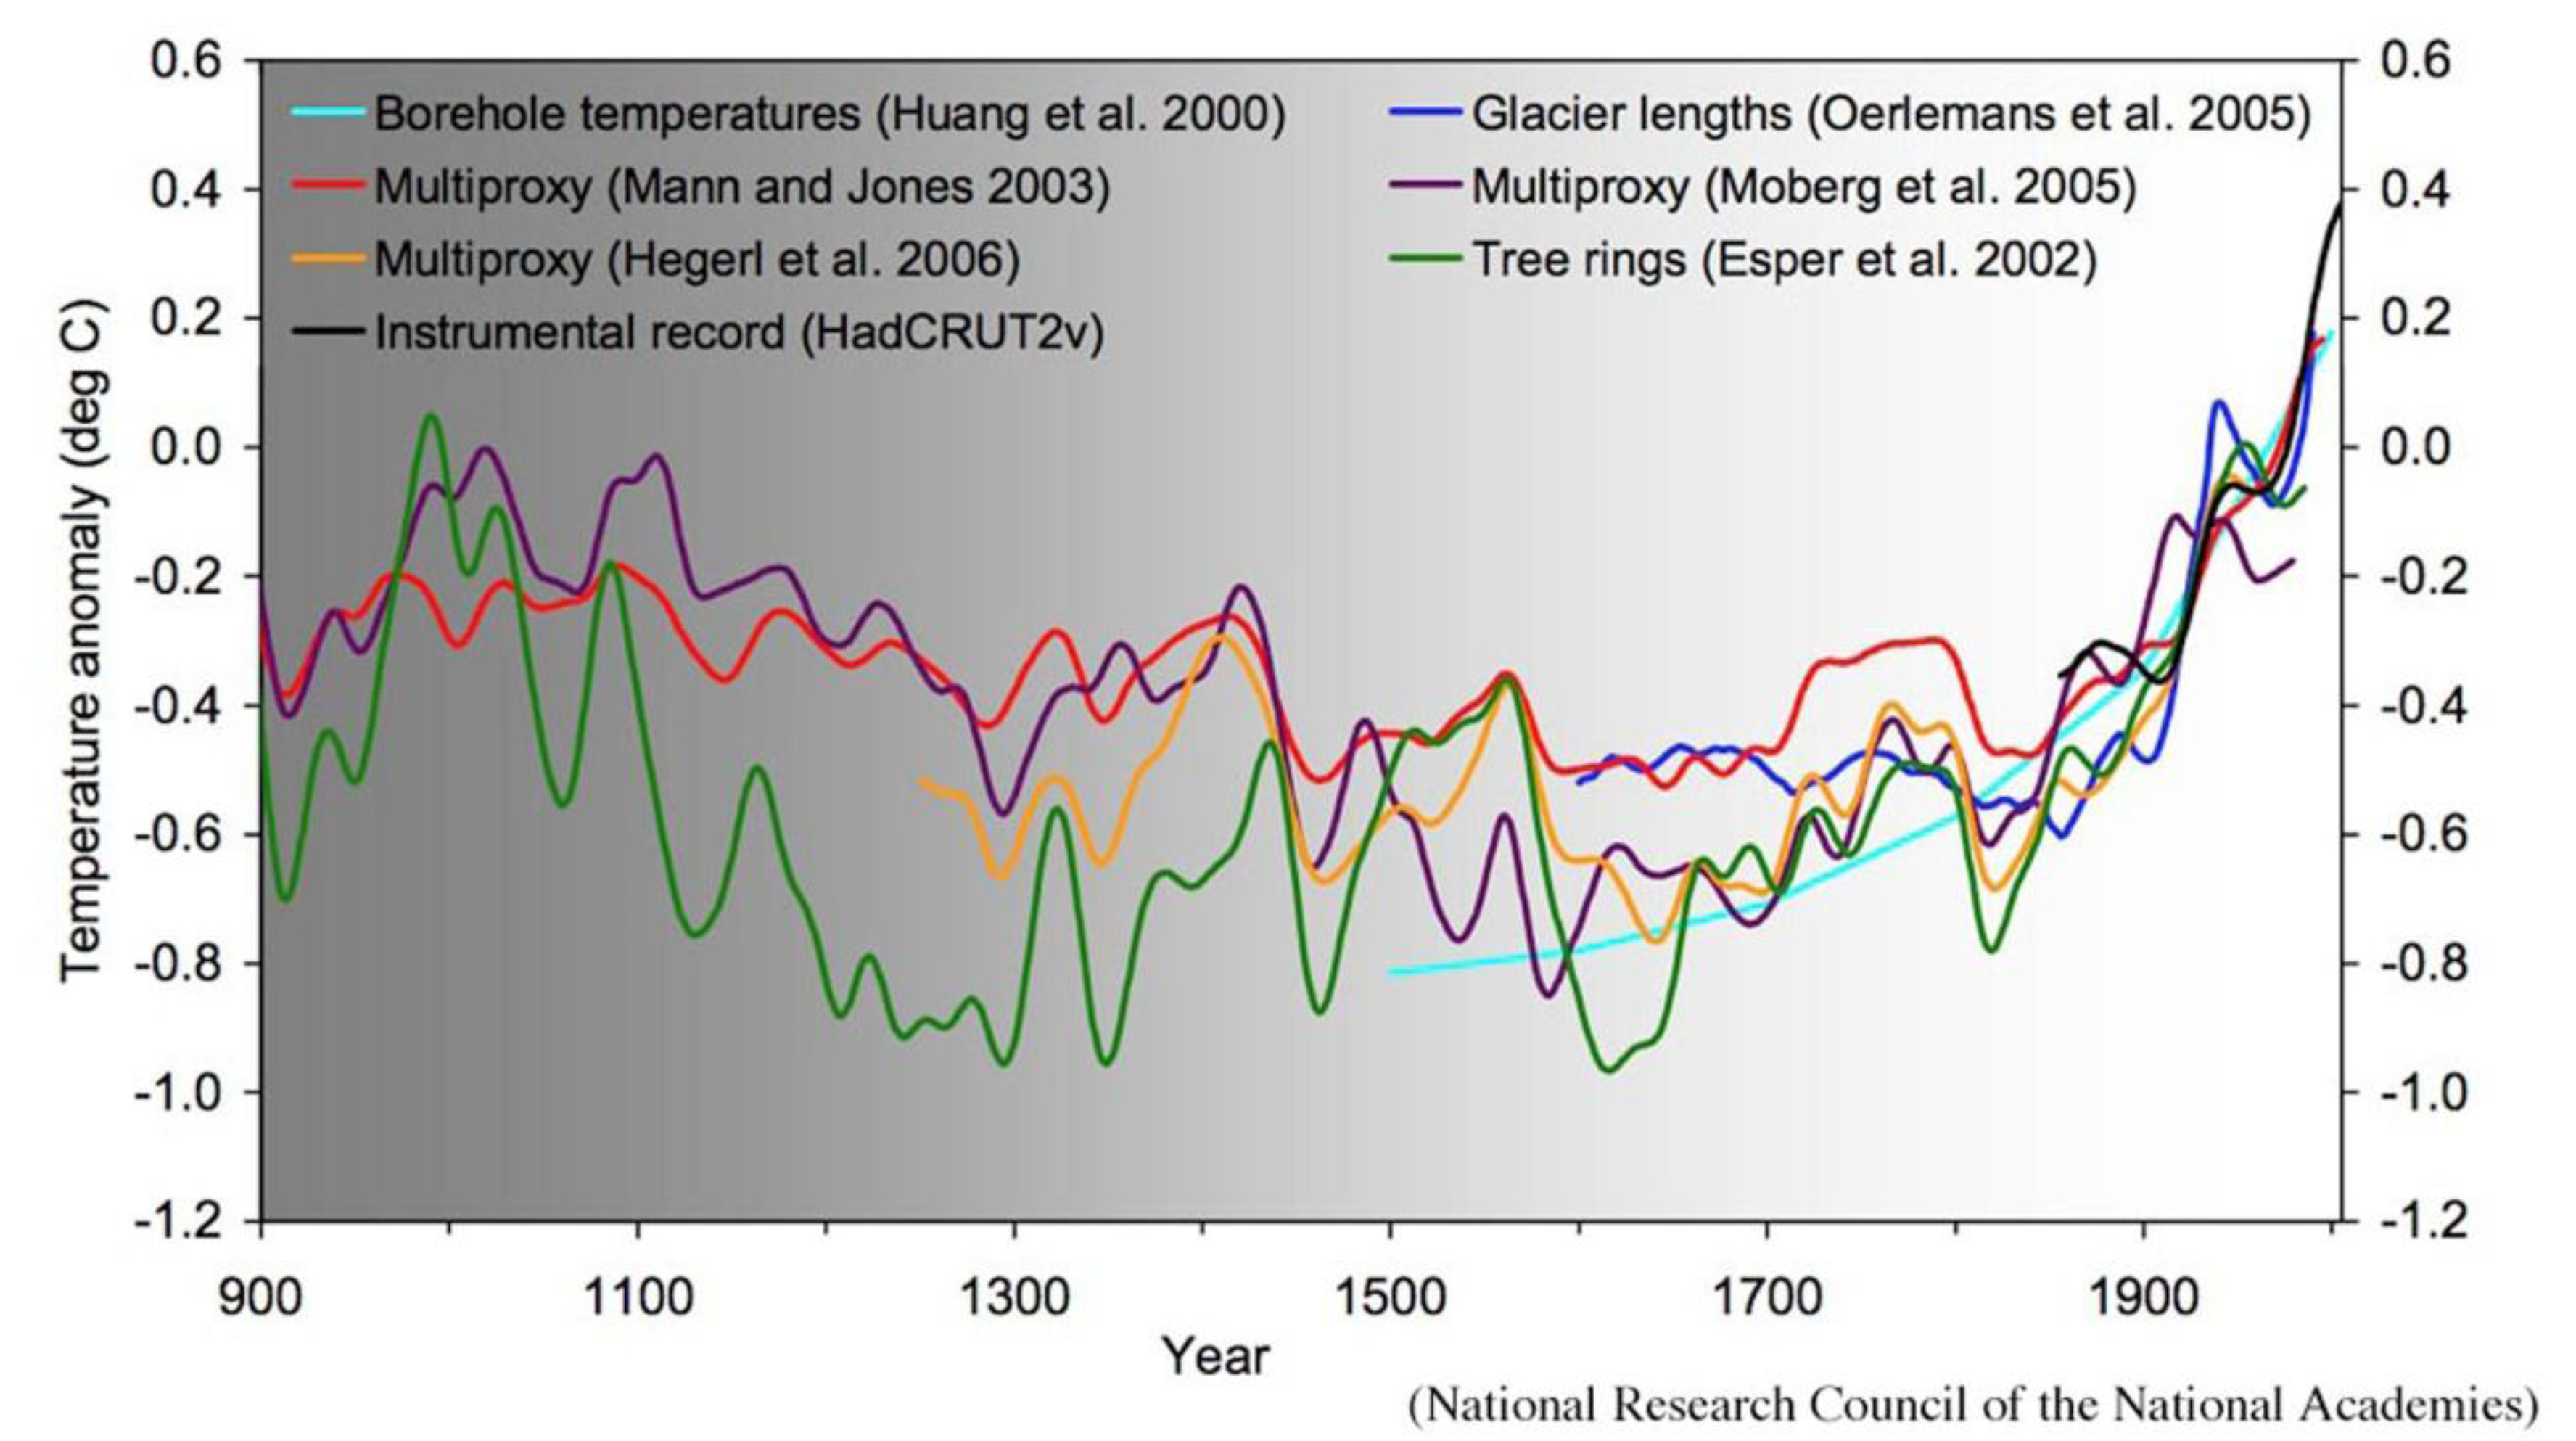
Figure 2 shows temperature variations from about the year 800 to 2000, deduced from tree ring changes; it shows the Little Ice Age (LIA) after the Medieval Warm Period circa 1000 and the near linear increase after 1800 or shortly after [5]. Figure 3 shows basically similar trends in the temperature changes obtained by several researchers (including Esper et al. [5]), indicating a near linear rise in temperature from about 1850 to 2000 [10]. All these results clearly show near linear increases temperature from about 1800~1850 to 2000, in addition to those results obtained by the IPCC (Figure 1).
One possibility, then, is that this near linear component is due to a gradual recovery from the Little Ice Age (LIA) of 1800~1850 [8], as the LIA did not end abruptly. It is generally perceived that the temperature during the LIA was about 1 °C lower than in the present (Figure 2, Figure 3). Thus, the rate of this gradual temperature increase since 1800 would be roughly 1 °C /200 years (= 0.5 °C/100 years or 0.05 °C/10 years), similar to the rate of the near linear increase of about 0.5 °C that we see over the course of the 20th century.
Figure 2.
Temperature variations deduced from tree ring records [5].
Figure 2.
Temperature variations deduced from tree ring records [5].

Figure 3.
Temperature changes from 900 to 2000, compiled by the National Research Council [10].
Figure 3.
Temperature changes from 900 to 2000, compiled by the National Research Council [10].

As the increase in temperature since 1800~1850 is nearly linear, the trend is quite different from the increase in CO2, which has shown a near quadratic increase over the same period—rapidly increasing after 1946, after a gradual increase that began around 1900. It is at least problematic, therefore, to consider this near linear increase in temperature during the 19th and 20th centuries as mainly due to CO2.
It may also be noted that the solar modulation function derived from C14 and Be10 [11]; Muscheler et al. [12] displays a trend inversely proportional to the temperature trend shown in Figure 2, Figure 3, and it may be speculated that the LIA and its recovery is perhaps related to changes in solar activity, even though changes in solar output during a sunspot cycle (11 years) are known to be small, at ~ 0.1 %.
2.2. The Multi-Decadal Oscillation
Superposed upon the near linear increase in temperature are various changes. The most predominant of these is the multi-decadal oscillation, with an amplitude of about 0.2 °C and a period of about 50–60 years; from Figure 1, we can see three major increases beginning in 1860, 1910 and 1970. These increases peaked in 1880, 1940 and 2000, respectively. Jevrejeva et al. [9] has shown that the sea level also superposed similar changes onto the otherwise near linear increase.
Further, the increases in 1860 and 1910 were each followed by a significant decrease lasting about 30 years. A halt and even a slight decrease in the rising trend after 2000 can therefore be expected, on the basis of this spectral analysis.
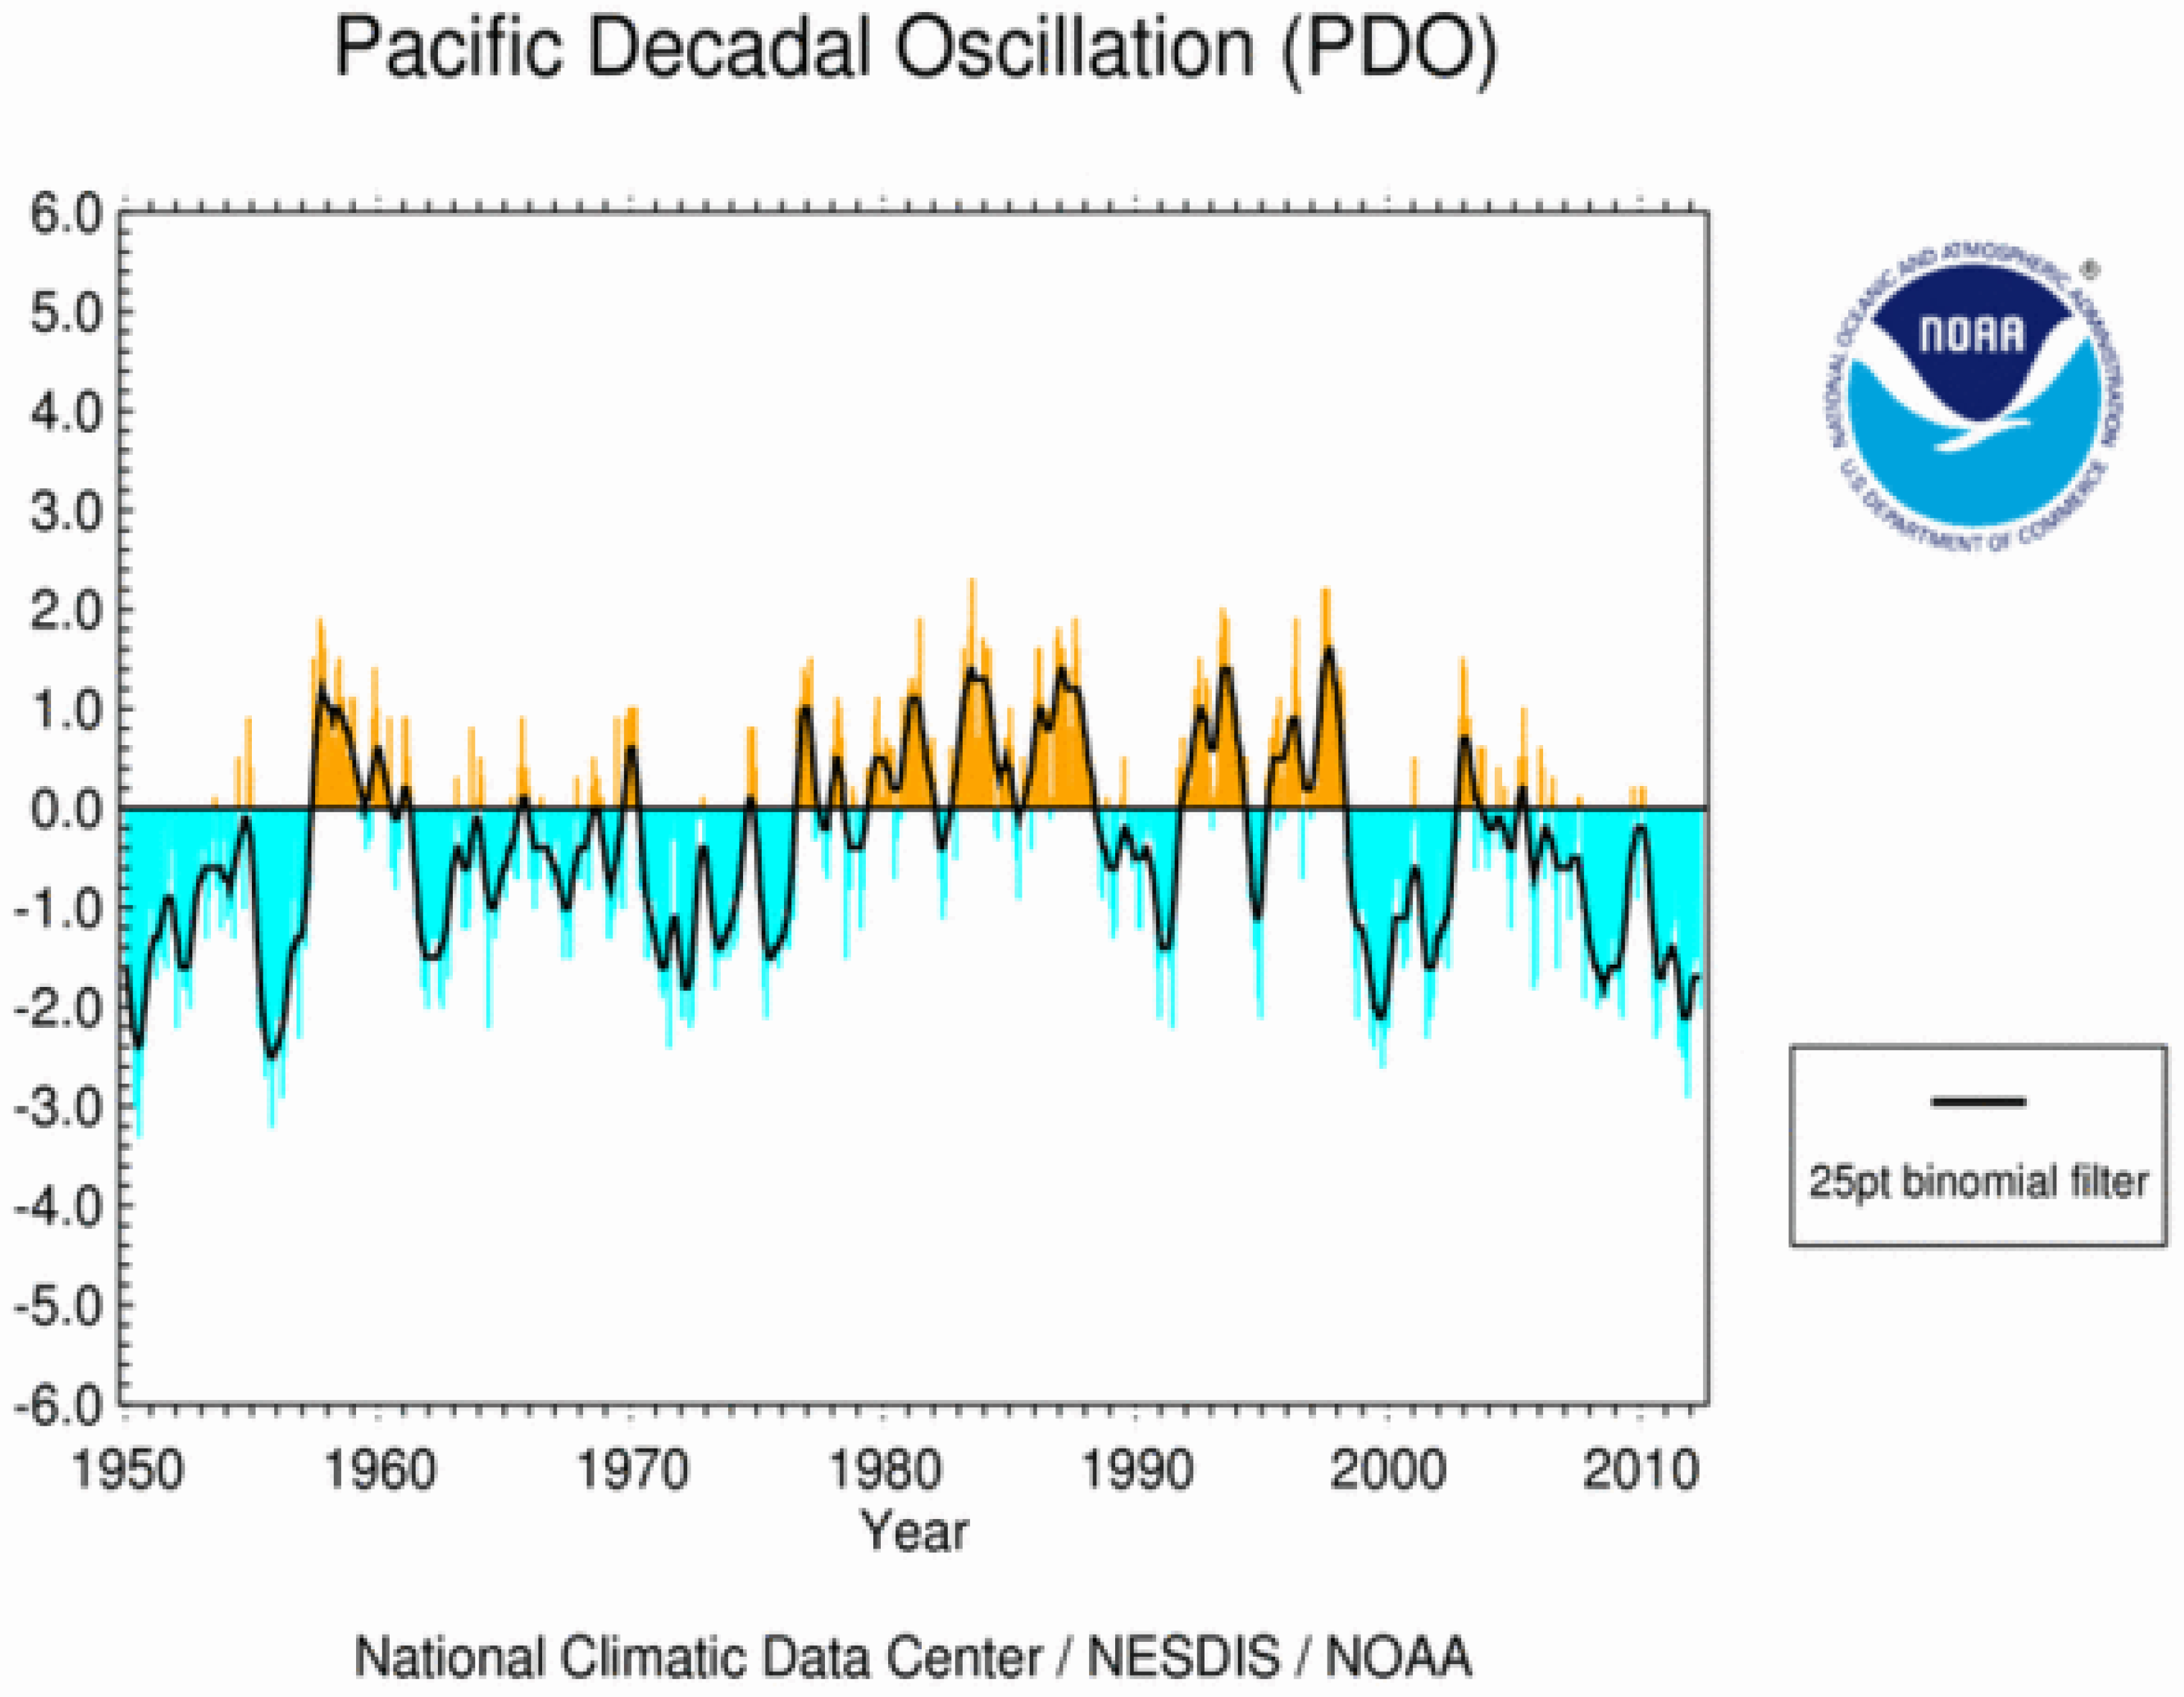
This fluctuating change is likely the result of multi-decadal oscillation [13,14]. Since the Pacific Decadal Oscillation (PDO) has a similar phase to that shown in Figure 4 [15]; earlier data back to 1900 show the same phase changes), it is reasonable to consider that temperature’s multi-decadal change is closely related to the PDO, a natural phenomenon. Consistent with this expectation, the PDO shows a clearly decreasing trend since 2000.
Figure 4.
The Pacific Decadal Oscillation (PDO) [15]. http://www.ncdc.noaa.gov/teleconnections/pdo/
Figure 4.
The Pacific Decadal Oscillation (PDO) [15]. http://www.ncdc.noaa.gov/teleconnections/pdo/

3. Synthesis
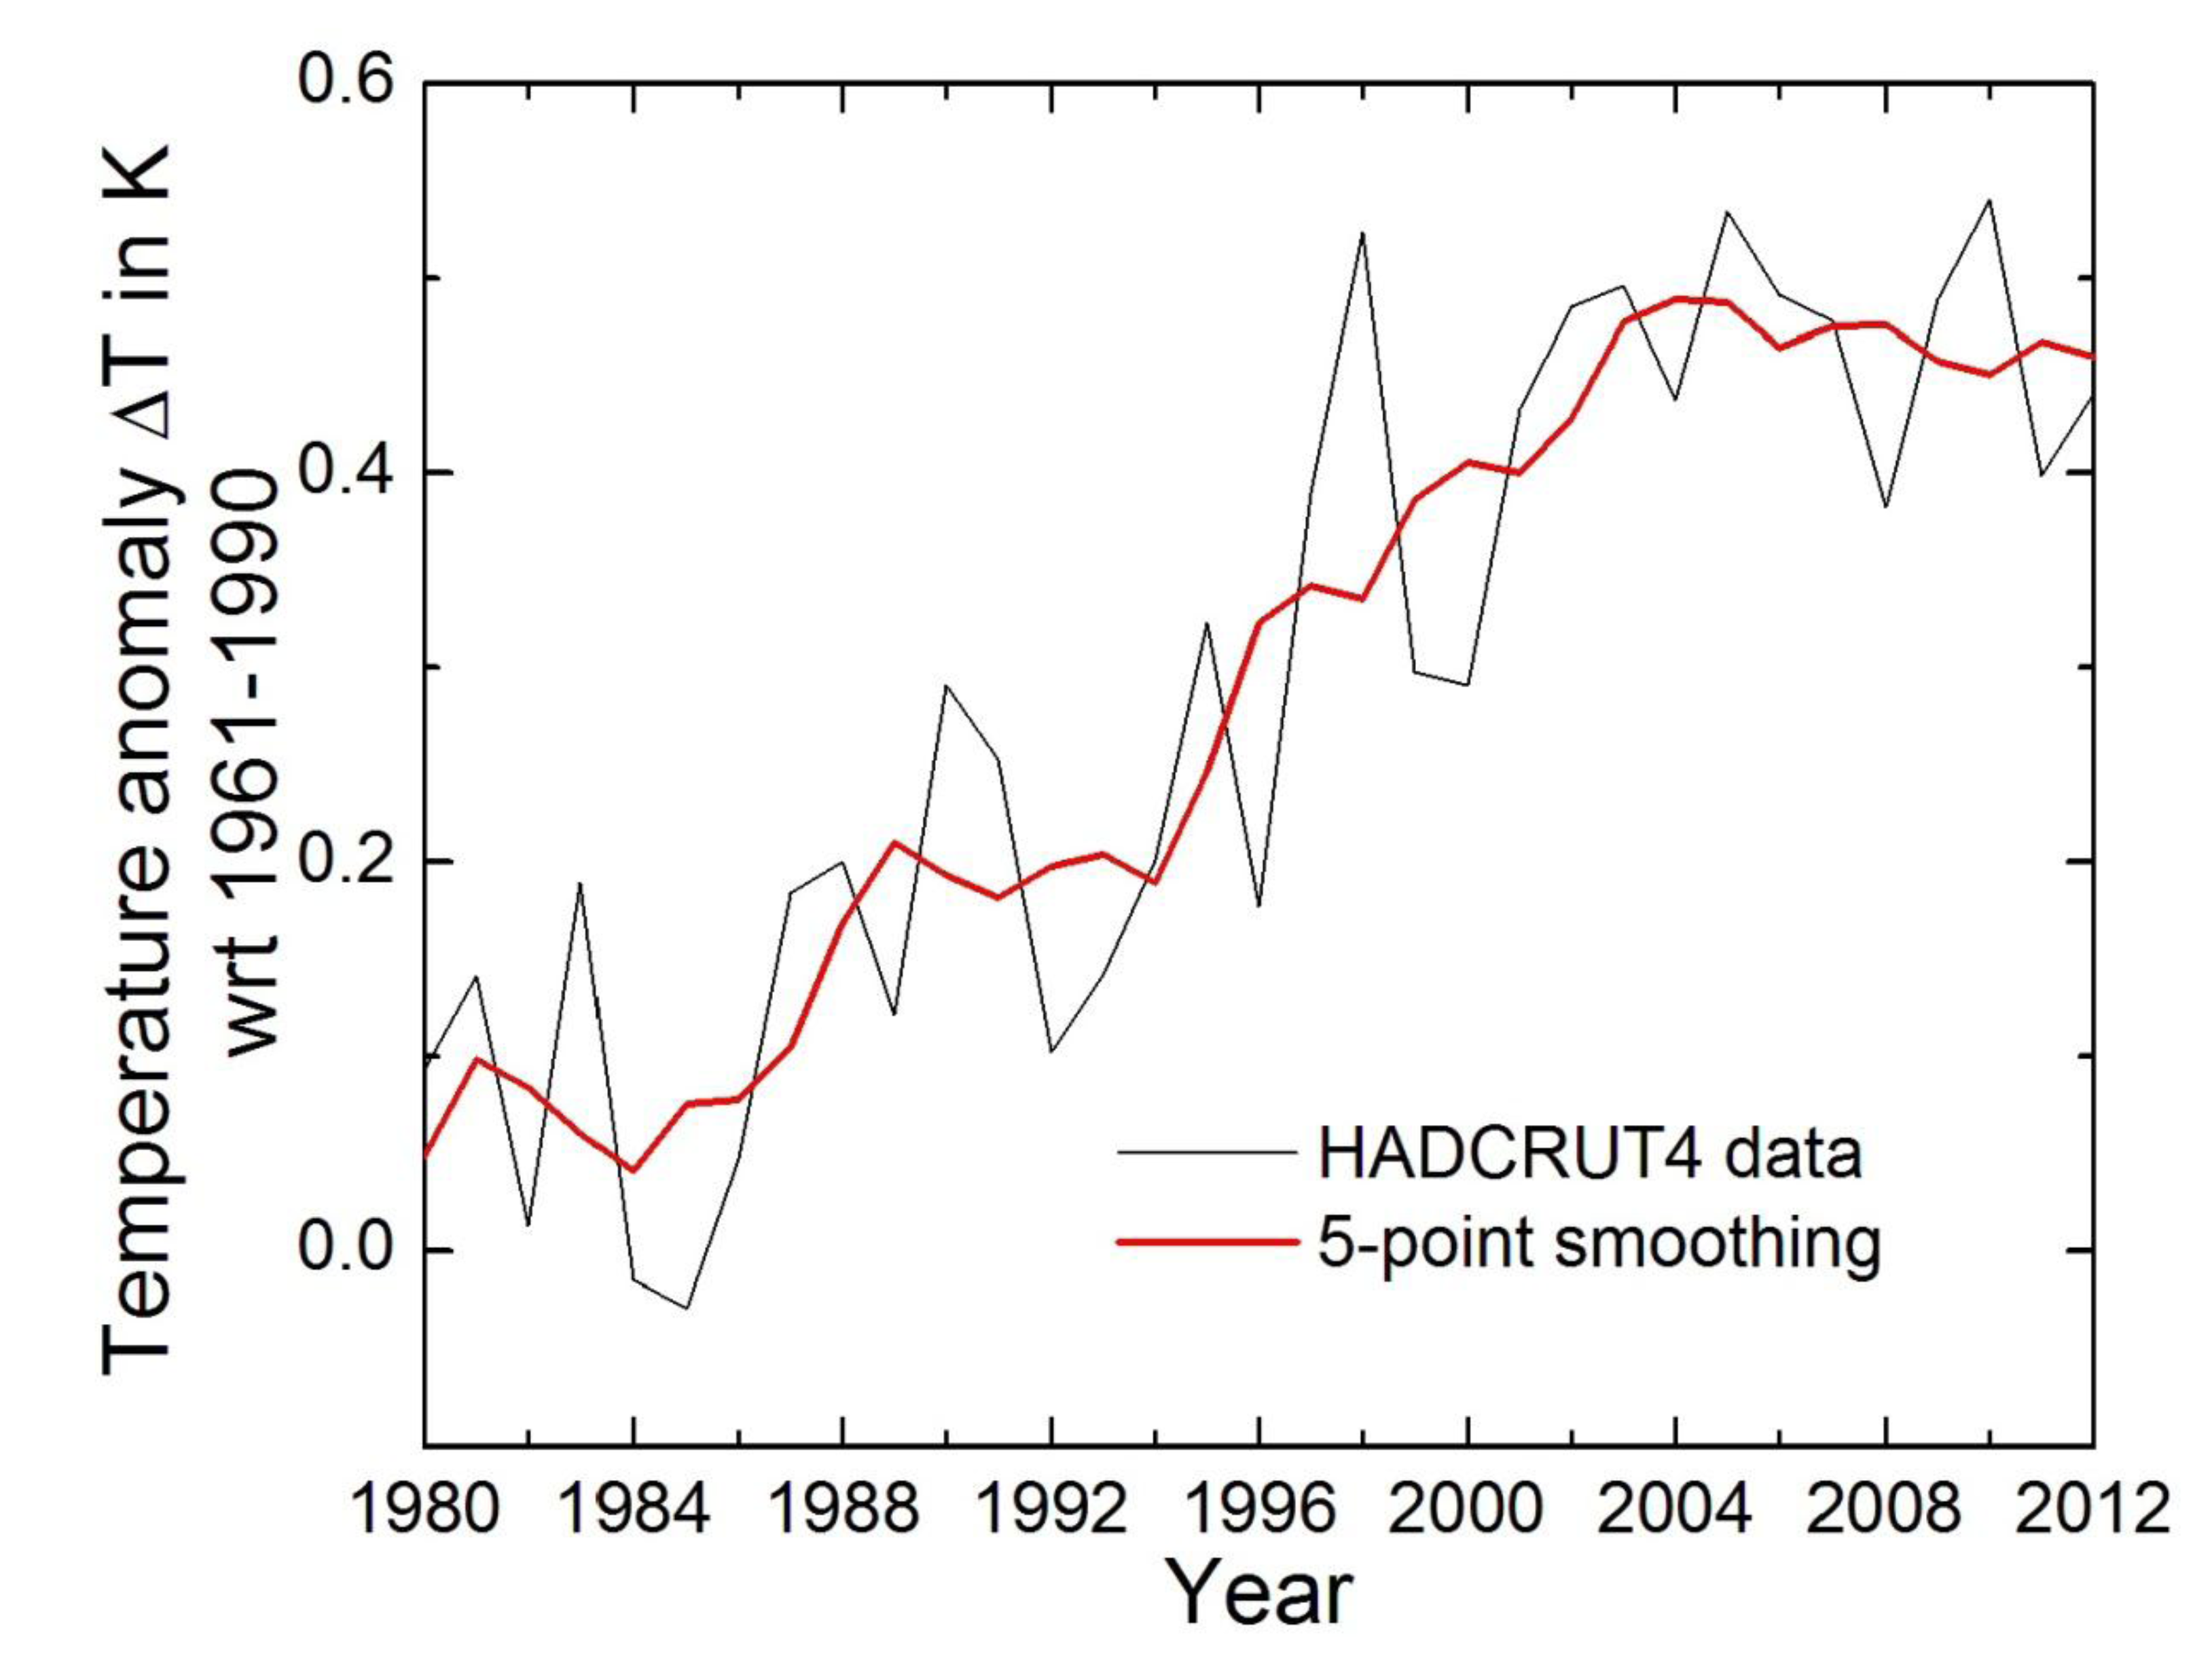
Figure 5 shows the above findings in graphic form and represents an improved version of Figure 9 of Akasofu [8]. The large rectangular box shaded in yellow shows temperature changes from 1860 to 2010 (standard data, similar to Figure 1), together with a linear black line showing the 0.5 °C/100 year rate of increase and the multi-decadal oscillation shown in red and blue, above and below the line, respectively. Figure 5 shows a detailed version of data shown in the yellow box. The dotted line before 1860 indicates that the linear line may be extended back to about 1800, assuming that the LIA indeed began to recover from about 1800. Figure 6 shows the HADCRUT4 data [16], together with its five-point smoothing data. It is clear from the above data set that the warming trend is halted and that there is an indication of even slight cooling after 2000.
Figure 5.
An interpretation of changes in global average temperature from 1800 to 2012. The temperature in the vertical axis is for reference scale; for detail, see the text. An insert above the yellow box is a detailed version of data shown in the yellow. The HadCRUT4 data are discussed by Morice et al. [16].

In the yellow box, the change from 2000 to June of 2012 is emphasized by the thick blue line to indicate the halting trend as an effect of the multi-decadal oscillation. Above the yellow box is shown a detailed version of this data. Based on the above synthesis, it may be suggested that the present halt to global warming is due to the fact that multi-decadal oscillation has overwhelmed the prior, near linear (LIA recovery) increase. Indeed, such a trend is similar to those after 1880 and 1940, when temperature actually decreased toward 1910 and 1970, respectively (particularly in light of the fact that CO2 had begun to increase rapidly after 1946). It may be noted, however, that Levitus et al. [17] showed a continuous increase of the world ocean heat content after 2000, although the rate of increase seems to decrease after 2004; on the other hand, the result by Pielke [18] does not seem to show such an increase after 2000.
Figure 6.
The HADCRUT4 data as illustrated in Figure 5, together with the five-point smoothing, but shown for the interval 1980–2012 only.
Figure 6.
The HADCRUT4 data as illustrated in Figure 5, together with the five-point smoothing, but shown for the interval 1980–2012 only.

The temperature increase from 1975 to 2000, shown by the thick red line (essentially the same line as shown in yellow in Figure 1), is likely composed primarily of recovery from the LIA, combined with the positive phase of the multi-decadal oscillation [8]. In contrast, the IPCC considers the temperature rise from 1975 to 2000 as “very likely due to the observed increase in anthropogenic greenhouse gas concentrations [2].
Based on this assumption, the IPCC has predicted a +2 °~ 4 °C temperature increase by 2100 [2], as shown in Figure 5 by the dotted extension of the red thick line, to have resulted more immediately in a +0.2 °C or greater temperature increase by 2012. However, the halted increase (or even slight decrease) in temperature since 2000 indicates a situation more similar to those after 1880 and 1940.
It is quite likely, therefore, that the near linear increase due to LIA recovery has been temporarily overwhelmed by the multi-decadal oscillation, which had reached a positive peak in about the year 2000.
Assuming these results obtained by statistical analysis will continue throughout the 21th century, we may observe the dashed line from 2012 to 2100 as the linear extension, in conjunction with multi-decadal oscillation. The expected rise in temperature due to recovery from the LIA remains about 0.5 °C, though the contribution from multi-decadal oscillation will depend on its phase (±0.2 °C).
4. Conclusion
It is likely that both the near linear increase and multi-decadal oscillation are primarily natural changes. Thus, in order to estimate the effects caused by CO2 over the last two centuries, it is important to isolate these natural components of climate change from real temperature data.
Acknowledgements
Conflict of Interest
The author declares no conflict of interest.
References and Notes
- Burroughs, W.J. Climate Change; Cambridge University Press: Cambridge, UK, 2001; p. 298. [Google Scholar]
- IPCC, Climate Change 2007: The physical science basis. Contribution of Working Group I to the Fourth Assessment Report of the Intergovernmental Panel on Climate Change; Solomon, S.; Qin, D.; Manning, M.; Chen, Z.; Marquis, M.; Averyt, K.B.; Tignor, M.; Miller, H.L. (Eds.) Cambridge University Press: New York, USA, 2007.
- Wu, Z.; Huang, N.E.; Long, S.R.; Peng, C.-H. On the trend, detrending, and variability of nonlinear and nonstationary time series. In Proceeding of National Academy of Sciences, USA; 2007; 104, pp. 14889–14894. [Google Scholar]
- Bryant, E. Climate Process & Change; Cambridge University Press: Cambridge, UK, 1997; Volume 91-92, p. 209. [Google Scholar]
- Esper, J.; Cook, E.R.; Schweingruber, F.H. Low frequency signals in long tree-ring chronologies for reconstructing past temperature variability. Science 2002, 295, 2250–2253. [Google Scholar] [CrossRef]
- Nussbaumer, S.U.; Zumbühl, H.J.; Steiner, D. Fluctuations of the “Mer de Glace” AD 1500-2000; an interdisciplinary approach using new historical data and neural network simulations. Zeitschrift für Gletscherkunde und Glazialgeologie 2007, 40, 183. [Google Scholar]
- Magnuson, J.J.; Robertson, D.M.; Benson, B.J.; Wynne, R.H.; Livingstone, D.M.; Arai, T.; Assel, R.A; Barry, R.G.; Card, V.; Kuusisto, E.; Granin, N.G.; Prowse, T.D.; Stewart, K.M.; Vuglinski, V.S. Historical Trends in lake and river ice cover in the Northern Hemisphere. Science 2000, 289, 1743–1746. [Google Scholar] [CrossRef]
- Akasofu, S. On the recovery from the Little Ice Age. Natutral Science 2010, 2, 1211–1224. [Google Scholar] [CrossRef]
- Jevrejeva, S.; Moore, J.C.; Grinsted, A.; Woodworth, P.L. Recent global sea level acceleration started over 200 years ago? Geophys. Res. Lett. 2008, 35, L08715. [Google Scholar] [CrossRef]
- National Research Council of the National Academies, Surface temperature reconstructions for the last 2000 years (Summary figure), Washington, D.C. 2006; p. 145.
- Hoyt, D.V.; Schatten, K.H. The Role of the Sun in Climate Change; Oxford University Press: New York, USA, 1997; p. 279. [Google Scholar]
- Muscheler, R.; Joos, F.; Beer, J.; Müller, S.A.; Snowball, I. Solar activity during the last 1000 yr inferred from radionuclide records. Quaternary Science Rev. 2007, 26, 82–97. [Google Scholar]
- Schlesinger, E.E.; Ramankutty, N. An oscillation in the globall climate system of period 65-70 years. Nature 1994, 367, 723–726. [Google Scholar] [CrossRef]
- Polyakov, I.V.; Bahtt, U.S.; Simmons, H.L.; Walsh, D.; Walsh, J.E.; Zhang, X. Multidecadal variability of North Atlantic temperature and salinity during the twenty century. J. Climate 2005, 18, 4562–4581. [Google Scholar]
- NOAA. Available online: http://www.ncdc.noaa.gov/teleconnections/pdo/.
- Morice, C.P.; Kennedy, J.J.; Rayner, N.A.; Jones, P.D. Quantifying uncertainties in global and regional temperature change using an ensemble of observational estimates: The HadCRUT4 data set. J. Geophys. Res. 2012, 117, D08101. [Google Scholar] [CrossRef]
- Levitus, S.; Antonov, J.I.; Boyer, T.P.; Baranova, O.K.; Garcia, H.E.; Locarmini, R.A.; Mishonov, A.V.; Reagan, J.R.; Seidov, D.; Yarosh, E.S.; Zweng, M.M. World ocean heat content and thermosteric sea level change (0-222m), 1955-2010. Geophys. Res. Lett. 2012, 39, L10603. [Google Scholar] [CrossRef]
- Pielke, R. A., Sr. A broader view of the role of humans in the climate system. Physics Today 2008, 61, 54–55. [Google Scholar] [CrossRef]
© 2013 by the authors; licensee MDPI, Basel, Switzerland. This article is an open access article distributed under the terms and conditions of the Creative Commons Attribution license (http://creativecommons.org/licenses/by/3.0/).
Share and Cite
MDPI and ACS Style
Akasofu, S.-I. On the Present Halting of Global Warming. Climate 2013, 1, 4-11. https://doi.org/10.3390/cli1010004
AMA Style
Akasofu S-I. On the Present Halting of Global Warming. Climate. 2013; 1(1):4-11. https://doi.org/10.3390/cli1010004
Chicago/Turabian StyleAkasofu, Syun-Ichi. 2013. "On the Present Halting of Global Warming" Climate 1, no. 1: 4-11. https://doi.org/10.3390/cli1010004