Article

Assessing Heatwave-Related Deaths among Older Adults by Diagnosis and Urban/Rural Areas from 1999 to 2020 in Slovenia

1
Centre for Environmental Health, National Institute of Public Health Slovenia, Zaloška 29, 1000 Ljubljana, Slovenia
2
Medical Faculty, University of Ljubljana, Vrazov trg 2, 1000 Ljubljana, Slovenia
3
Slovenian Environment Agency, Vojkova 1b, 1000 Ljubljana, Slovenia
*
Author to whom correspondence should be addressed.
Climate 2024, 12(9), 148; https://doi.org/10.3390/cli12090148
Submission received: 22 August 2024 / Revised: 19 September 2024 / Accepted: 20 September 2024 / Published: 21 September 2024

Abstract

:
Background: The association between mortality and heatwaves is well documented. Heatwaves frequency, intensity, and duration increase with global climate change. The most vulnerable group for dying during heatwaves is older people. Knowing which diseases contribute to a higher number of deaths during heatwaves is important for planning appropriate public health preventive measures. Methods: We assessed the short-term association between the number of deaths for older adults (75+ years) and heatwaves in the years 1999 to 2020 in Slovenia. We estimated the relative risks (RR) with a 95% confidence interval for the number of deaths for the observed diagnosis (all causes, circulatory, respiratory) and urban vs. rural areas associated with heatwaves in Slovenia for each year, comparing the number of deaths during heatwaves with reference days. Results: Most years showed no significant increase in deaths during heatwaves for those aged 75 and older. However, in 2006, 2007, 2014, and 2015, there was a significant increase in deaths during heatwaves. For the general population, heatwaves were associated with an increase in deaths due to all causes: 10% more in 2006 and 26% more in both 2007 and 2014. For those aged 75 and older, heatwaves were associated with an increase in deaths due to all causes: 22% more in 2007, 27% more in 2014, and 28% more in 2015. For those aged 75 and older, heatwaves were associated with an increase in deaths due to circulatory system diseases: 25% more in 2006, 33% more in 2007, 30% more in 2014, and 27% more in 2015. Regarding urban vs. rural areas, in 2006 and 2012, the elderly in urban areas were more affected, with 33% and 26% more deaths, respectively. In contrast, in 2007, 2014, and 2015, old age population in rural areas was more affected, with 29%, 26%, and 31% more deaths, respectively. Conclusions: According to the literature data, older adults are most susceptible to the effects of extreme heat due to physiological changes that occur with aging, chronic diseases, certain medications, a sedentary lifestyle, and social isolation. The results of our study will help in planning appropriate preventive public health measures to better protect older adults during the next heatwaves in Slovenia.

1. Introduction

Human-caused greenhouse gas emissions have resulted in a noticeable increase in global temperatures, associated with more frequent, prolonged, and intense heatwaves and hot summers [1,2]. In Slovenia, every decade over the past 30 years has been warmer than the previous ones, with the exception of the period from 2001 to 2010, which was not statistically significantly warmer than 1991 to 2000 [3]. The temperature of the atmosphere in Slovenia in the first two decades of this millennium (2001–2020) was 1.8 [1.5 to 2.0] °C above that in the period 1850–1900, and in the last decade (2011–2020) by 2.1 [1.9 to 2.4] °C [3]. However, climate change projections for Europe, including Slovenia, suggest that temperatures will keep increasing rapidly, along with their health impacts, unless significant measures for mitigation and adaptation are put in place [4,5].
Heatwaves are among the extreme weather events globally that have the most significant impact in terms of death tolls, particularly highlighted over the past two decades (since the notorious 2003 disaster in France) [6]. This heightened awareness of the immediate health effects of heatwaves has prompted the development of prevention plans and adaptation strategies aimed at safeguarding vulnerable groups [7,8]. Older adults are especially at risk from extreme heat due to age-related physiological changes, limited access to healthcare, chronic conditions, specific medications, social isolation, a sedentary lifestyle, and the availability of air conditioning, all of which impair body temperature regulation and increase the risk of dehydration [9,10]. Heatwaves can also trigger or worsen adverse drug reactions in older adults who take diuretics, serotonergic antidepressants, ACE inhibitors, proton pump inhibitors, non-dopaminergic anti-parkinsonian drugs, antiepileptics, and beta-blockers [11]. As life expectancy increases, the demographic composition of society is shifting, with the 60+ age group projected to make up 21.1% of Europe’s population by 2050 [12]. By 2060, the 65+ age group will constitute over 35% of Slovenia’s population, raising concerns about a rise in chronic non-communicable diseases among this population [13]. This demographic change is particularly relevant to heatwaves, as older individuals are more susceptible to extreme temperatures, heightening health risks and placing additional pressure on healthcare systems.
The future impact of heatwaves on human health remains uncertain, with many unanswered questions about whether this effect will remain stable, increase, or decrease over time [14]. Numerous studies examining heatwaves across various periods and emission scenarios suggest that the link between heatwave intensity and increased mortality may stay consistent over time [15,16,17,18]. However, progressive adaptation to heat, along with the implementation of prevention plans targeting vulnerable subgroups, could potentially reduce the impact of heatwaves [19,20]. Currently, little is known about the factors driving these changes, but identifying them is crucial for better supporting vulnerable groups and managing future risks. Previous studies have proposed several possible explanations, such as improvements in healthcare, heightened awareness, and the adoption of adaptation strategies like air conditioning and early warning systems, but there is limited quantitative evidence to support these claims. Only a few studies have quantitatively linked changes in vulnerability to specific factors, such as the prevalence of air conditioning and other socio-economic factors [19,21].
The varied topography and the interplay of different geographical units (e.g., the Adriatic Sea, the Alps, and the Pannonian Plain) are reflected in the great spatial diversity of Slovenia’s climate. Mountain, Mediterranean, and temperate continental climate types are thus intertwined in a relatively small area so that even in small areas, there is a wide range of climatic conditions.
In the central part of Slovenia, where valleys predominate among the hills, most people live in the Ljubljana basin.
There are large differences in the amount and distribution of precipitation. Due to the orographic effect, the amount of precipitation increases from the sea towards the interior of Slovenia, reaching a maximum at the Dinaric–Alpine barrier. A slightly smaller but noticeable maximum of precipitation also occurs in the Kamnik–Savinja Alps due to the effect of the uplift of air masses. Behind the Dinaric barrier to the northeast, precipitation decreases rapidly with distance from the sea and the orographic barrier.
Slovenia does not have a distinctly dry or wet part of the year, but significant differences exist between months or seasons. The sub-Mediterranean climate is characterized by two rainfall maxima: the first occurs in late spring, the second in autumn. The Alpine climate is characterized by a peak in autumn, with a slightly less pronounced maximum in late spring and early summer. In the east of the country, where the influence of the continental climate is pronounced, the highest rainfall occurs during summer showers and storms, with the driest months being in winter.
Temperatures tend to drop with altitude. The average annual temperature drops by 5.3 °C for every 1000 m. Not only altitude but also the slope and orientation of the terrain have a major influence on temperature conditions. In closed valleys and basins, lakes of cold air with a temperature reversal often occur in the cold half, and the spatial distribution of temperature then differs considerably from the average. The spatial distribution of mean annual temperature follows the relief of Slovenia. The warmest temperatures are on the coast, in the Vipava Valley and in Brda.
It is also warmer in the rest of the Primorska region and in the lowlands of eastern Slovenia. The coldest temperatures are in the mountains, where the average annual temperature does not exceed 0 °C at the highest peaks. Temperature fluctuations are smallest in the Primorska region due to the influence of the sea and in the mountains, where we are already very close to a free atmosphere. The warmest area extends across the Vipava Valley and most of the Karst, and from the coast, it extends to the Karst rim. The second warmest thermal belt covers the whole eastern half of the country (except for the higher hills) and the Ljubljana basin.
The upward trend in average summer temperature is the highest of all seasons. All regions are experiencing an increase in both warm and hot days. The frequency of cold and icy days has decreased significantly throughout Slovenia, including in Primorska.
In summer, there is more sunshine in Primorska and the lowlands and basins because convection breaks out in the rugged mountainous terrain, resulting in more cloud cover. The opposite is true in the cold half of the year. Except for Primorska, the valleys receive less sunshine than the mountainous areas because fog or low clouds often linger in the valleys and valleys due to the occurrence of cold air lakes. There is also an increasing trend in the duration of solar irradiation.
In Slovenia, research has already been conducted on the short-term impact of heatwaves on mortality within certain vulnerable subgroups of the population [22]. International studies have primarily found an association between increased mortality and heatwaves due to cardiovascular, cerebrovascular, and respiratory diseases, particularly among the elderly [10].
The aim of this study was to assess the short-term association between heatwaves and the number of deaths for older adults (75 years and more), the most vulnerable population, in the period from 1999 to 2020 in Slovenia, to see whether any differences appeared after the increase in duration, frequency, and intensity of the heatwaves and more intense public health measures and inter-sectoral cooperation after the year 2015 in Slovenia.

2. Methods

2.1. Study Area

The Republic of Slovenia is a country located in Southern Central Europe, spanning 20,273 square kilometers (7827 sq. mi). Its population was 1,978,334 in 1999, 2,050,189 in 2011, and 2,108,977 in 2021 [23]. Slovenia experiences four major climate systems: the coastal climate in littoral Slovenia, the central climate in central Slovenia, a more continental climate in the northeastern region, and an alpine climate in the mountainous areas. The country’s terrain, which is predominantly hilly except for the coastal region and the northwestern area dominated by the Alps, has a significant impact on its weather (Slovenian Environment Agency, Climate in Slovenia).

2.2. Time Period

In each observed year, independently from each other, we chose the period from May to September because this is the hottest part of the year in Slovenia. Analyses were conducted from 1999 to 2020 because in Slovenia, in 1999, the International Classification of Diseases (ICD)—9 changed to the ICD—10, which is still used today.

2.3. Number of Deaths Source

Data on all underlying causes of mortality, categorized by age group, diagnosis, and municipality, for the months of May through September from 1999 to 2020, were retrieved from the Mortality database of the National Institute of Public Health (NIPH), following the International Classification of Diseases, Tenth Revision (ICD-10). Since the published data do not specify the time or location of death, making it impossible to identify individuals, we believe that Ethical Approval is not required.

2.4. Definition of Heatwave, Heatwave Deaths, and Reference Periods Deaths

To evaluate heat load, we employed pseudo-equivalent temperatures. We calculated the average from three weather monitoring stations representing Slovenia’s different climate regions: littoral Slovenia, central Slovenia, and the more continental northeastern Slovenia [24]. Although the sample size is relatively small, several studies have shown that sample sizes need to be large enough to achieve statistical significance; some studies, including those initiated by an expert group under the World Meteorological Organization, recommend samples of at least one million [25]. Since Slovenia lacks cities of such scale, we used mortality data for the entire country. For consistency, we also aggregated the meteorological data [25].
Drawing from previous studies and the methodology used to compile the environmental indicators “Heatwaves and the daily number of deaths” within the indicator group “Human health and ecosystem resilience”, we based our assessment on the average values from the three weather stations representing Slovenia’s most populous climate regions: Bilje (Nova Gorica) in western Slovenia, Ljubljana in the central region, and Murska Sobota, located on the plains of northeastern Slovenia. The sparsely populated mountainous region, where heat stress is rare, was excluded from the analysis.
A heatwave was defined as a period of two or more consecutive days with a pseudo-equivalent daily temperature exceeding 56.0 °C. This temperature was calculated by summing the air temperature and the partial pressure of water vapor multiplied by 1.5 [26]. Temperature data were sourced from the Slovenian Environment Agency. The pseudo-equivalent temperature index, which accounts for the combined effects of air temperature and humidity on thermal discomfort in hot, humid conditions, has been used in Slovenia for several decades [26].
The heatwave periods in our study included all heatwaves that occurred between May 1 and September 30 during the years from 1999 to 2020 in Slovenia, as identified by previous meteorological analyses (Figure 1).
The non-heatwave (reference) periods were defined in line with earlier studies [22,27]. We determined the length of the reference period, representing the number of days outside of heatwaves from May to September. For each year, the reference period matched the total number of heatwave days in that year. The reference days were selected using a consistent approach across all 22 years. Half of the reference period days were taken from the beginning of May (starting on May 1), while the other half were taken from the beginning of September (starting on September 1). If the total number of reference days was odd, an extra day was added to May. The number of deaths during the reference periods was calculated for each year separately and designated as A0. Similarly, heatwave-related deaths were calculated for each year and labeled as A1. Both heatwave deaths and reference period deaths were defined as any death recorded by ICD-10 during the respective periods.
The “lag” effect should be taken into account when determining the heatwave and reference periods. Previous studies suggest considering a lag period lasting from 0 to 3 days [28,29,30] or even longer. After descriptively analyzing several heatwaves, we chose not to include the days immediately following a heatwave in our heatwave periods. Therefore, for the heatwaves in our study, we defined the “lag” as 0 days.

2.5. Definitions of Subgroups

To examine the risks associated with different causes of death, we calculated the relative risks (RRs) and 95% confidence intervals (95% CI) for dying from all causes (ICD 10, A00-T98) for both the general population and old age population. We also calculated these risks for circulatory system diseases (ICD 10, I00-I99) and respiratory system diseases (ICD 10, J00-J99) specifically for those aged 75 and older.
Defining urban versus rural areas in Slovenia posed a challenge, as the country has only two cities with populations exceeding 100,000: Ljubljana, which is the capital, and Maribor. In our research, we categorized these two municipalities as urban areas, while the remaining fifty-six Slovenian municipalities were classified as rural. The analysis of rural versus urban areas was conducted specifically for the elderly population (aged 75 and older).

2.6. Statistical Analysis: Relative Risks, 95% Confidence Interval and Excess Deaths

All data were processed and analyzed using Microsoft Excel, version 2010 (Microsoft, Redmond, WA, USA). Following previous studies, we employed a simplified relative risk (RR) approach, comparing the number of deaths during heatwave periods with those during reference periods [22,27], separately for each observed year (1999–2020). We assumed, as in previous research [22,27], that the population size remained constant within each observed year. The RR was calculated to evaluate the impact of heatwaves by dividing the number of deaths during heatwave periods (A1) by the number of deaths during reference periods (A0), as shown in (Equation (1)).
R R = A 1 A 0
We calculated 95% confidence intervals (95% CI) for the RR using a simple approach for person–time incidence ratios (Equation (2)) [27]:
95   %   C I = e l n R R ± 1.96   1 A 1 + 1 A 0
Statistically significant mortality increases during heatwaves belonged to the subgroups where the lower limit of the 95% CI was above or equal to 1.00.
Excess deaths were calculated from the RR in terms of percent (%). For example, if RR = 1.05, then 5% of excess deaths during heatwaves appeared in the observed year. On the contrary, if RR = 0.95, then 5% of decreased deaths during heatwaves appeared in the observed year.

3. Results

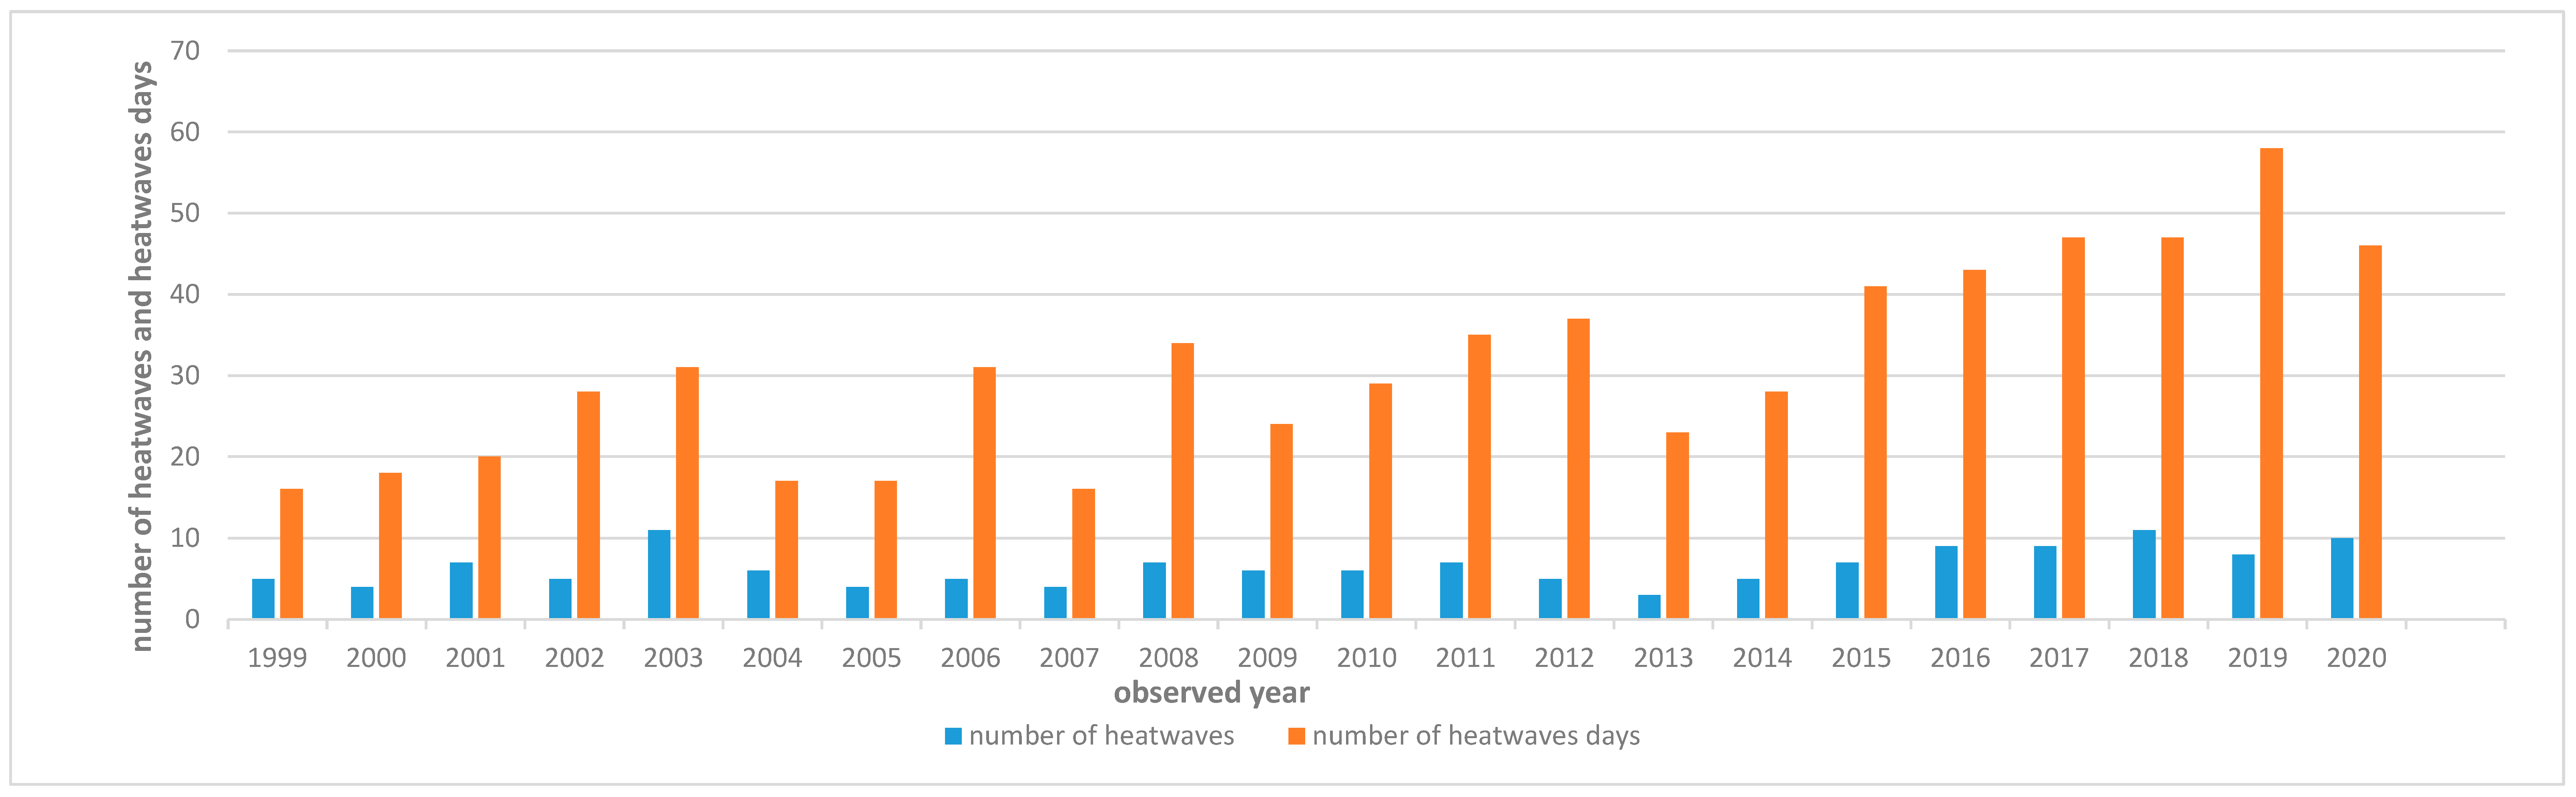
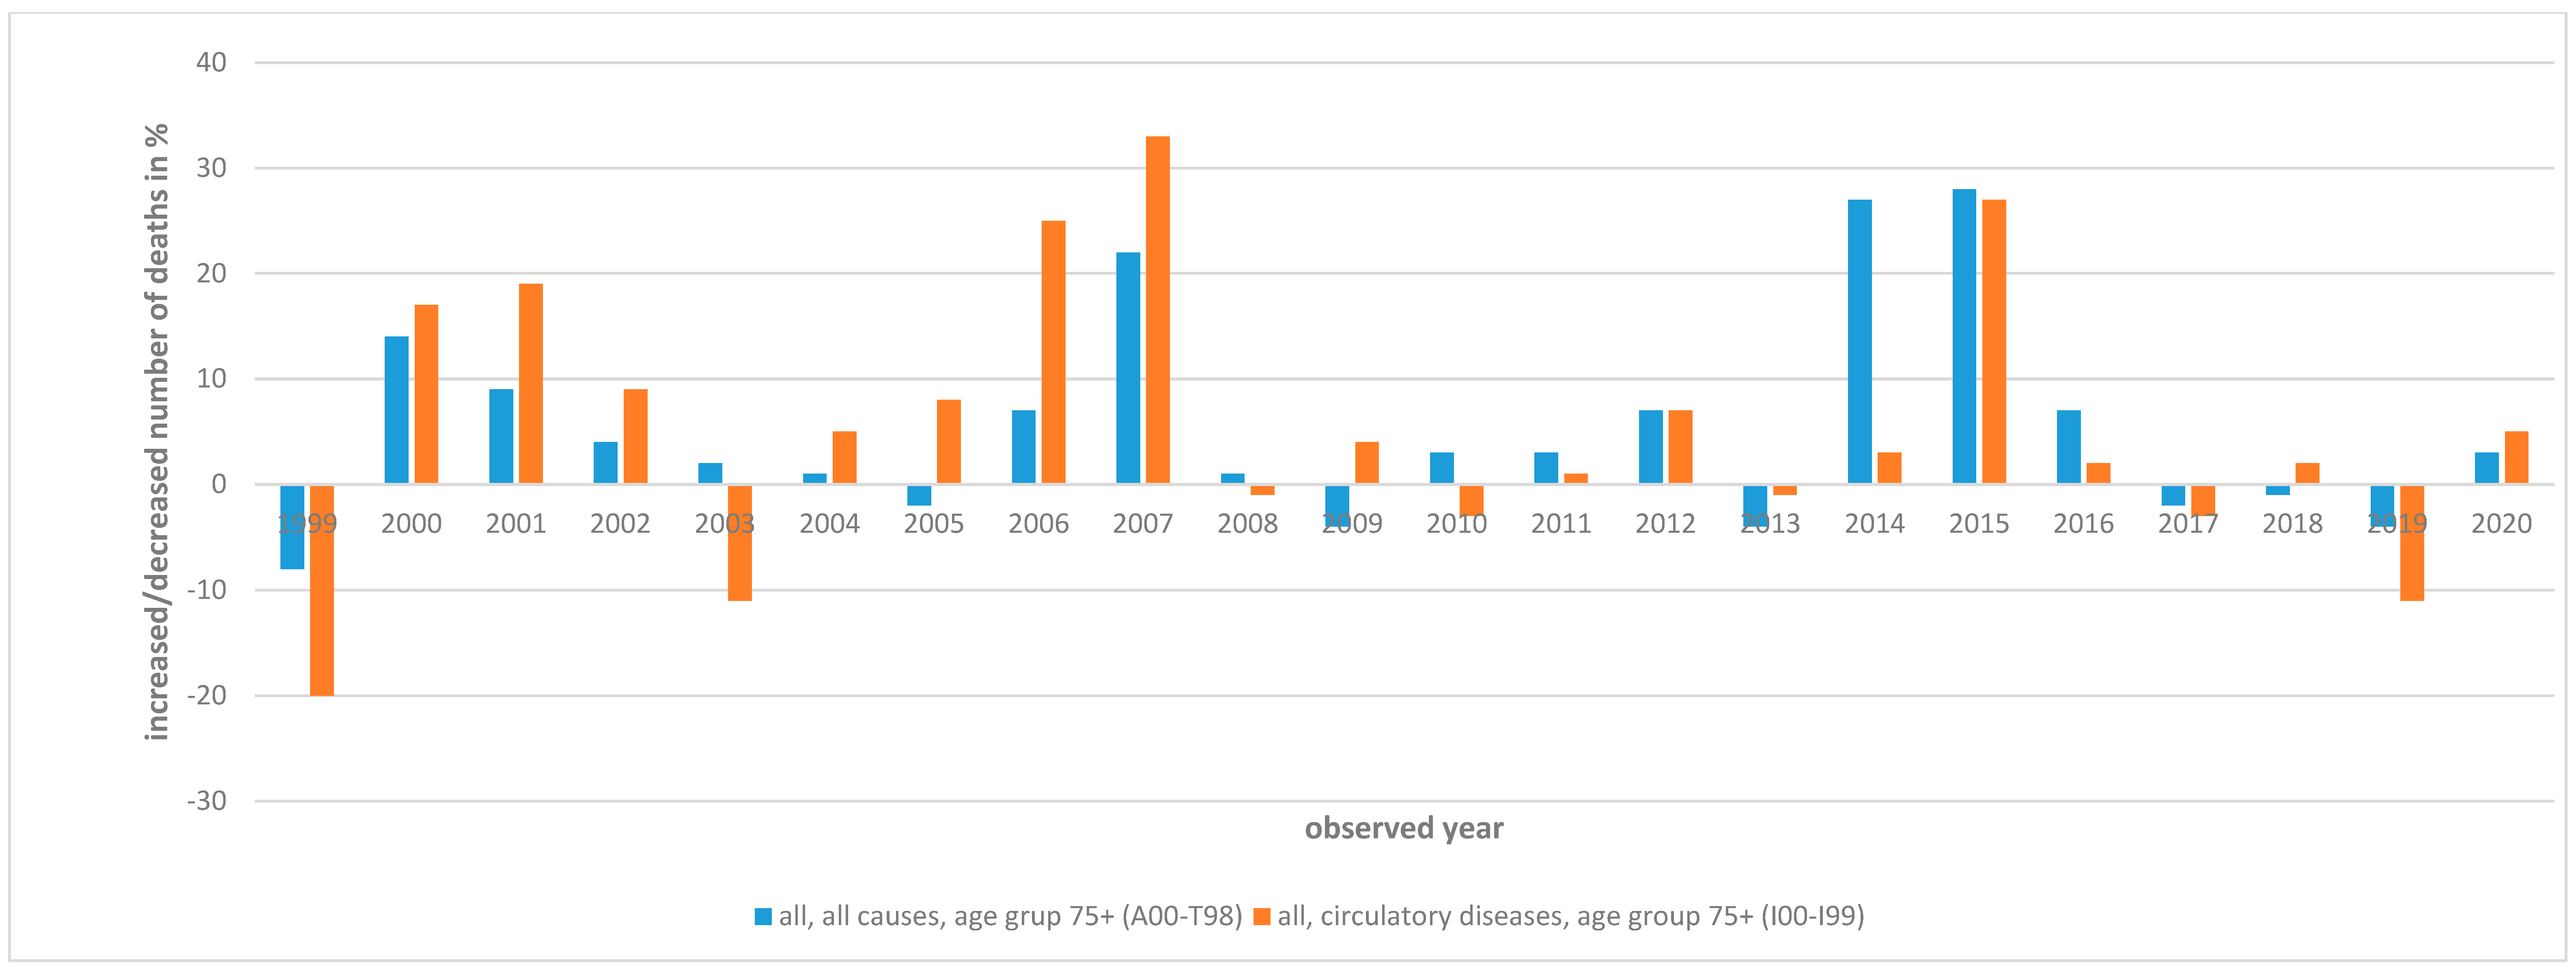
3.1. Analysis of Number of Deaths during Heatwaves for Each Year from 1999 to 2020

Analyses of the number of deaths during heatwaves were performed independently for each of the observed years. Most years showed no significant increase in deaths during heatwaves for both the general population and those aged 75 and older, regardless of diagnosis or urban/rural location. However, in 2006, 2007, 2014, and 2015, there was a significant increase in deaths during heatwaves (Table 1).
  • For the general population, heatwaves were associated with an increase in deaths due to all causes: 10% (95% CI: 0–21%) more in 2006; 26% more in both 2007 (95% CI: 12–42%) and 2014 (95% CI: 14–40%).
  • For those aged 75 and older, heatwaves were associated with an increase in deaths due to all causes: 22% more (95% CI: 4–44%) in 2007, 27% more (95% CI: 12–43%) in 2014, and 28% more (95% CI: 15–41%) in 2015.
  • For those aged 75 and older, heatwaves were associated with an increase in deaths due to circulatory system diseases: 25% more (95% CI: 5–48%) in 2006, 33% more (95% CI: 6–67%) in 2007, 30% more (95% CI: 1–55%) in 2014, and 27% more (95% CI: 1–48%) in 2015.
Regarding urban vs. rural areas, in 2006 and 2012, the elderly population in urban areas was more affected, with 33% (95% CI: 2–72%) and 26% (95% CI: 1–57%) more deaths, respectively. In contrast, in 2007, 2014, and 2015, the elderly population in rural areas was more affected, with 29% (95% CI: 13–47%), 26% (95% CI: 9–45%), and 31% (95% CI: 16–47%) more deaths, respectively.
In Figure 2, excess deaths due to all causes and circulatory system diseases for the elderly population (75+ years old) during heatwaves in Slovenia in the past 22 years (1999–2020) are shown. Additionally, in Figure 2, heatwave duration in days and the number of heatwaves over the 22 years in Slovenia are also shown.

3.2. Reports for Air Pollution in Slovenia for the Observed Years (2006, 2007, 2014, 2015)

Slovenia is one of the countries with the highest PM10 levels in Europe. PM10 emissions per capita and per land area are also among the highest in the European Union. High emissions are due to the widespread use of wood for domestic heating in technically outdated stoves and boilers. Low-wind conditions and pronounced long-lasting temperature inversions are frequent in the colder part of the year in basins and valleys across continental Slovenia. These unfavorable meteorological conditions significantly contribute to elevated PM10 levels. In the last five years, PM10 levels at most urban monitoring stations exceeded the allowed number of exceedances in continental Slovenia. However, there were fewer exceedances in the Primorska region (Mediterranean part of Slovenia), where low wind and stable atmospheric conditions are much less frequent. Levels during winter are much higher than in the warmer part of the year also because of wood combustion in domestic heating appliances. After 2008, the yearly limit value for PM10 was exceeded only at the monitoring site Ljubljana Centre, which is under the direct influence of traffic. Due to lower PM levels in the warmer part of the year, the yearly limit value for PM2.5 has never been exceeded at any of the monitoring sites [31].
Ozone pollution is predominantly a regional issue. In Slovenia, ozone pollution is characterized by the pronounced influence of trans-boundary pollution, which classifies Slovenia as one of the most ozone-affected countries in Europe. The maximum daily eight-hour mean value for the protection of human health was exceeded at most monitoring sites. Lower concentrations were measured at the sites, which are under the direct influence of traffic. The highest concentrations were measured in the Primorska region, which is significantly influenced by trans-boundary pollution. The highest yearly average concentrations were measured at high-altitude monitoring sites (e.g., Krvavec) [31].
As the mortality rate for older people during heatwaves increased in 2006, 2007, 2014, and 2015, we checked the air pollution reports for the observed years in Slovenia. We wondered whether air pollution was higher in the observed years than in other years, which is a factor that can also contribute to increased mortality.
Ambient air in Slovenia in 2006 and in 2007 was—as in recent years—overly polluted with PM10 particles with the highest concentrations at urban sites, which are influenced by emissions from traffic (Maribor) and also local industry (cities of Zasavje region). The allowed annual number of exceedances of the daily limit value was exceeded at all urban monitoring stations in 2006 and 2007—most notably in Maribor and Zasavje—while in rural monitoring stations, it was exceeded in Rakičan near Murska Sobota. In 2006 and 2007, ozone concentrations exceeded the limit values in all places except the typical traffic sites (Maribor, Zagorje). As in previous years, the most polluted regions with ozone were the coastal and Primorska regions (Otlica, Nova Gorica, Koper). The alert threshold for ozone was exceeded once in Otlica [31].
PM10 levels in 2014 were lower than in the previous years. This is attributed mainly to favorable meteorological conditions. The number of days that exceeded the daily limit value was higher than the allowed 35 only at Ljubljana Centre, Zagorje, and two monitoring sites in Celje. The first year when the yearly limit value was not exceeded at any monitoring site was 2014. The yearly limit value for PM2.5 was not exceeded either [31]. In 2014, ozone levels were lower than in the previous years. The first year without exceedances of the information threshold since the beginning of measurements in Slovenia was 2014. The allowed number of exceedances of the maximum daily eight-hour mean value was exceeded only in the Primorska region, which belongs to the Mediterranean part of Slovenia, and at elevated monitoring sites [31].
In 2015, the PM10 levels were slightly higher than in 2014. This could be mainly attributed to the less favorable meteorological conditions. More than 35 exceedances of the daily limit value were measured at the monitoring sites Ljubljana Center, Celje AMP Gaji, Celje, Zagorje, Trbovlje, Murska Sobota Rakičan, Ljubljana Bežigrad, and Novo mesto. In 2015, as well as in 2014, there were no exceptions to the yearly PM10 limit value recorded on any of the measuring sites. Similarly, the yearly limit value for PM2.5 was not exceeded anywhere. In general, a decreasing trend of PM levels was observed after 2002, although there are significant yearly variations due to different meteorological conditions in each year. The decrease in PM levels is attributed mainly to a decrease in industrial emissions [31]. In 2015, levels of ozone pollution were slightly higher than in 2014 [31].

4. Discussion

Slovenia experiences extreme weather events annually, with heatwaves during the summer classified as such events, potentially leading to increased mortality. When interpreting our conclusions about heatwaves in Slovenia, it is crucial to recognize that the findings are highly influenced by the definition of heatwaves, which lacks a universally accepted standard.
The elderly group is the most vulnerable during heatwaves due to reduced body temperature regulation that comes with aging [32,33]. Additionally, this group often suffers from chronic medical conditions like heart disease and chronic obstructive pulmonary disease (COPD) [34]. Therefore, the combined risks of age and co-morbidities heighten their susceptibility to heat-related illnesses.
Some previous foreign studies assessed increased mortality during heatwaves for the elderly population. A study in Brisbane (Australia) found increased mortality due to all causes for the elderly (60+ years old) in time series analysis from 2010 to 2019 [35]. In Iran, a study was conducted in the southwestern city of Dezful, which found that during the years 2013 to 2019, mortality for those over 75 years old significantly increased [36]. Regarding risk factors associated with heatwave mortality for those over 65 years old, a Chinese study conducted from 2008 to 2018 assessed that functional aging is an underlying factor in enhancing heatwave resilience in the elderly population [37]. The findings of the literature review by Liu and co-workers indicate that underlying regional climate conditions need to be accounted for when assessing the risk of heat-related cardiovascular disease-related mortality, as well as the characteristics of the population and disease subgroups. Increasing temperatures, in conjunction with an increase in the proportion of older people in the population, might result in a rise in poor cardiovascular health outcomes associated with climate change [38]. In England, a study by Thompson and co-workers assessed mortality during heatwaves in the year 2020. Significant excess mortality was observed for cardiovascular disease, respiratory disease, Alzheimer’s, and Dementia across all three heatwaves, which appeared in 2020 in persons aged 65+ years. There was no evidence that the heatwaves affected the proportional increase in people dying at home and not seeking heat-related health care [39].
In our study, in most of the observed years, there were no statistically significant excess deaths during heatwaves for all populations or for those 75+ years old according to diagnosis and urban/rural areas. However, in 2006, 2007, 2014, and 2015, the association between heatwaves and the number of deaths showed that older people die more, mainly because of cardiovascular diseases. These findings align with previous research on mortality during heatwaves [40,41,42]. However, during these years, including 2012, older adults in both urban and rural areas were equally affected. Earlier studies have generally indicated a higher risk of heatwave-related mortality in urban areas, attributing this to the urban heat island effect [43,44,45], which is often considered the primary factor [46,47]. Conversely, other studies have shown that heat-related mortality risk was actually higher in rural areas than in urban ones [48,49], suggesting that lower levels of non-climatic factors—such as air conditioner availability, education, healthcare infrastructure, and the aging population in rural areas—contribute to the increased risk in rural regions [47,49]. As far as air pollution is concerned, in the observed years 2006, 2007, 2014, and 2015, when mortality for older adults increased, we found no higher levels of PM and ozone than in other observed years [31].
Some findings from our study differ from other reported research on mortality during extreme heat. Unlike many previous studies [50,51], we did not find statistically significant evidence of an increase in deaths among older adults due to respiratory diseases during heatwaves. Additionally, some of our results showed no significant association between heatwaves and mortality, especially in the most recent years, beginning in 2015. Despite increased summer heat stress, the number of heatwave-related deaths among the elderly in Slovenia did not rise. The underlying factors behind this phenomenon remain unclear. While past studies have suggested possible reasons, such as improvements in healthcare, heightened awareness, and the adoption of adaptive measures like air conditioning and early warning systems, the evidence is still limited [20,23].
On the other hand, Slovenia has implemented more extensive public health interventions since 2015: (i) Heatwaves are now recognized as hazardous weather events, with the National Weather Service issuing warnings since 2011, which were enhanced in 2016 with special alerts for vulnerable populations. (ii) Several mass-media campaigns have been launched to inform the public, particularly older adults and those with circulatory diseases, about preventive measures during heatwaves through internet publications, TV, radio, and newspapers. (iii) Primary care centers are also actively addressing the issue, warning chronically ill patients—such as those on antihypertensive medications or with mental health conditions—of the potential complications related to their medication use during heatwaves. Public health efforts specifically focus on the vulnerable subgroups (older adults, children, pregnant women, chronically ill individuals). Our massages are short and easy to understand and consider physiological as well as socio-economic factors:
Take care of old-age individuals (identify lonely elderly individuals).
Use air conditioning in your home, if possible.
Drink water (take care of the old age individuals; make sure they drink water even if they are not thirsty).
Do not drink alcohol, sweet drinks, or coffee.
Avoid big cities; go to nature or public places with air conditioning, such as libraries and shopping centers.
Dress in light clothes and protect your head with hats.
In case of polypharmacy, contact your personal doctor.
We recommend being physically active early in the morning or late in the afternoon.
Use the freely available drinking water in the fountains to freshen yourself in the big cities.
The vulnerability of older adults is associated with both physiological and social factors [9,10], and this issue may worsen in the future. In 2022, people aged 65 and over made up 21.1% of Slovenia’s population, a figure projected to rise to 30.9% by 2060 [13]. Despite a considerable decline in recent decades, circulatory system diseases continue to be the leading cause of death in Slovenia, responsible for 38% of all deaths in 2019 (45% in women and 31% in men) [52]. More women than men succumbed to circulatory system diseases in 2019, with the highest number of deaths occurring among those aged 75 and above in both sexes. In women, these deaths were mainly due to cerebrovascular diseases, whereas in men, ischemic heart disease was the more frequent cause. Among those under 75, more men than women died from circulatory system diseases [53]. The most frequent reasons for outpatient visits at both specialist and primary care levels include hypertensive diseases, peripheral vascular diseases, and cardiac arrhythmias [52]. Elevated cholesterol and triglyceride levels, commonly associated with aging, along with hypertension, are key contributors to atherosclerosis [53]. Atherosclerosis, particularly when combined with hypertension, is the primary factor leading to acute coronary syndrome, cerebral stroke, chronic kidney diseases, and heart failure [53]. Risk factors linked to hypertension include high cholesterol, obesity, high salt intake, alcohol consumption, and low physical activity. The accelerated rise in peripheral resistance caused by hypertension, resulting from vascular smooth muscle hypertrophy [54] and vascular rarefaction [55], impairs core temperature regulation due to reduced control of blood flow in the skin [56]. These effects can be further aggravated by medications, such as certain psychotropic and cardiovascular drugs, that affect thermoregulatory capacity [57].
Physiological cardiovascular issues in older adults make them particularly vulnerable during heatwaves. Older individuals struggle more to regulate their body temperature through vasodilation and sweating when temperatures rise [58]. Existing heart conditions in the elderly hinder their ability to effectively increase cardiac output, resulting in insufficient blood flow to the skin during elevated core temperatures [59]. Additionally, older adults are more susceptible to dehydration, which further strains the heart and other organs [60,61]. The combined impact of dehydration-induced hemoconcentration and pulmonary inflammation (as discussed later) can lead to acute coronary syndrome and cerebral stroke [62]. Severe health outcomes related to excessive heat, such as heat syncope, heat exhaustion, heat cramps, and heat stroke [63], are well-documented. When core temperatures exceed 40 °C, and the body cannot cool itself through vasodilation and sweating, it can result in multi-organ dysfunction syndrome [64].
As people age, their lungs undergo physiological changes that can impair ventilation even in the absence of disease, and these changes are coupled with a weakened immune system [65]. During heatwaves, poor outdoor air quality exacerbates these lung functions, with elevated ground-level ozone being a major contributor. This ozone causes local inflammation that can become systemic [66]. In Slovenia, the western regions are particularly exposed to high ozone levels. Additionally, older adults are more vulnerable to infections and pathogens [67]. Heatwaves often lead to an increase in vector-borne, water-borne, and food-borne diseases [65]. The combination of respiratory infections or inflammation due to poor air quality can also accelerate the development of atherosclerotic plaques [67]. Air pollution-induced inflammation in the respiratory tract can enhance coagulation through various mechanisms [67], which, coupled with impaired cardiovascular responses, increases the risk of thrombotic events [65,68]. Furthermore, inflammation and infection can worsen chronic obstructive pulmonary disease (COPD) and asthma, conditions that are common among the elderly [69]. In Slovenia, 16% of adults had asthma in 2010 [70], and COPD affects just over 10% of the population [71], both conditions associated with high morbidity and mortality.
In our study, we did not analyze the particularly vulnerable old population subgroups or diagnoses within the old population, such as mental illnesses (because of small daily observed outcome—deaths), diseases that are transmitted through food and water (because these causes increase primarily morbidity, less mortality), other diseases that are associated with higher mortality for older people during heatwaves (endocrine diseases, diseases of the kidney, diseases of the digestive system—again because of small daily outcome—deaths), and socio-economical vulnerability (because it would be necessary to analyze individual parameters such as, e.g., social isolation, loneliness, air conditioning, education, etc., and this goes beyond analysis in the present article).

Limitations and Strengths of the Study

We acknowledge that our study has several limitations. The analysis is based on a very small number of daily deaths due to Slovenia’s small population, and as shown in Table 1, the confidence intervals for some statistical subgroups are quite broad, making the results speculative and incomplete. Additionally, because of the limited number of daily deaths, we could only analyze a few variables without considering other major diagnoses associated with increased mortality during heatwaves among older adults. Furthermore, the study only recorded the underlying causes of death, leaving out potential contributions from other diseases, injuries, conditions, or events. We also did not account for confounding factors that could affect death rates during the summer, such as summer smog, other outdoor air pollutants, indoor living conditions, and socio-economic status.
The strengths of our study are that the results most likely indirectly show that with public health measures and inter-sectoral cooperation, we might improve people’s awareness and help them behave more safely during days of high heat. For now, little is known about the factors that contribute to stabilization in mortality of older people age population during heatwaves despite increased heat load in the last observed summers. Further studies should focus on a better assessment of public health interventions and impact of each individual intervention.
In future analyses, we will use a new heatwave definition (the Australian one) [72], which is more common internationally. Due to the small observed sample, we intend to extend our analysis using the Poisson regression model and conduct an analysis for each climate region separately.

5. Conclusions

Our findings suggest that, overall, older people in Slovenia did not experience more deaths during heatwaves, especially in recent years. The number of deaths increased only in a few years (2006, 2007, 2012, 2014, and 2015) and was mainly due to circulatory system causes in both urban and rural areas. Mortality related to circulatory system issues in older adults, especially during extreme heat events, should be addressed with targeted prevention strategies due to its potentially severe consequences. The discussion highlights that physiological adaptation, demographic factors, and socio-economic conditions all play distinct roles in influencing the population’s vulnerability to heatwaves. When evaluating future health risks in the context of projected climate change, it is essential to consider the potential effects of these factors.

Author Contributions

Conceptualization, S.P., K.B., M.P., A.U., T.C. and A.H., data curation, S.P., A.H. and T.C.; formal analysis, S.P. and T.C.; investigation, S.P., K.B., M.P., A.U. and A.H.; methodology, S.P. and T.C., administration, K.B. and A.U.; resources, S.P. and T.C.; supervision, S.P. and A.H.; validation, K.B., M.P., A.U. and T.C.; visualization, S.P.; writing—original draft preparation, S.P., K.B., M.P., A.U., T.C. and A.H.; writing—review and editing, S.P., K.B. and A.H. All authors have read and agreed to the published version of the manuscript.

Funding

This document was prepared as part of the Pharaon project, which received funding from the European Union’s Horizon 2020 Research and Innovation Programme under Grant Agreement No. 857188.

Institutional Review Board Statement

It is impossible to identify the individual in the published data in the paper as the data are not specified for time or area of death. Therefore, we do not consider Ethical Approval to be necessary.

Informed Consent Statement

Not applicable.

Data Availability Statement

Data are available at a reasonoble request.

Conflicts of Interest

The authors declare no conflicts of interest.

References

  1. Perkins-Kirkpatrick, S.E.; Lewis, S.C. Increasing trends in regional heatwaves. Nat. Commun. 2020, 11, 3357. [Google Scholar] [CrossRef] [PubMed]
  2. IPCC. Climate Change 2021: The Physical Science Basis; Masson-Delmotte, V., Zhai, P., Pirani, A., Connors, S.L., Péan, C., Chen, Y., Goldfarb, L., Gomis, M.I., Matthews, J.B.R., Berger, S., et al., Eds.; Cambridge University Press: Cambridge, UK, 2021. [Google Scholar]
  3. Berkeley Earth. Available online: https://berkeleyearth.org/ (accessed on 29 October 2023).
  4. Martínez-Solanas, È.; Quijal-Zamorano, M.; Achebak, H.; Petrova, D.; Robine, J.M.; Herrmann, F.R.; Rodó, X.; Ballester, J. Projections of temperature-attributable mortality in Europe: A time series analysis of 147 contiguous regions in 16 countries. Lancet Planet Health 2021, 5, e446–e454. [Google Scholar] [CrossRef] [PubMed]
  5. Ocena Podnebnih Sprememb v Sloveniji do Konca 21. Stoletja. Available online: https://meteo.arso.gov.si/uploads/probase/www/climate/text/sl/publications/OPS21_Porocilo.pdf (accessed on 23 October 2023).
  6. European Environment Agency. Climate Change, Impacts and Vulnerability in Europe 2012; EEA Report No 12/2012; EEA: Kebnhaven, Denmark, 2012.
  7. Fouillet, A.; Rey, G.; Wagner, V.; Laaidi, K.; Empereur-Bissonnet, P.; Le Tertre, A.; Frayssinet, P.; Bessemoulin, P.; Laurent, F.; De Crouy-Chanel, P.; et al. Has the impact of heat waves on mortality changed in France since the European heat wave of summer 2003? A study of the 2006 heat wave. Int. J. Epidemiol. 2008, 37, 309–317. [Google Scholar] [CrossRef]
  8. Casanueva, A.; Burgstall, A.; Kotlarski, S.; Messeri, A.; Morabito, M.; Flouris, A.D.; Nybo, L.; Spirig, C.; Schwierz, C. Overview of Existing Heat-Health Warning Systems in Europe. Int. J. Environ. Res. Public Health 2019, 16, 2657. [Google Scholar] [CrossRef] [PubMed]
  9. Åström, D.O.; Forsberg, B.; Rocklöv, J. Heat wave impact on morbidity and mortality in the elderly population: A review of recent studies. Maturitas 2011, 69, 99–105. [Google Scholar] [CrossRef]
  10. Kenney, W.L.; Munce, T.A. Invited review: Aging and human temperature regulation. J. Appl. Physiol. (1985) 2003, 95, 2598–2603. [Google Scholar] [CrossRef]
  11. Sommet, A.; Durrieu, G.; Lapeyre-Mestre, M.; Montastruc, J.L.; Association of French PharmacoVigilance Centres. A comparative study of adverse drug reactions during two heat waves that occurred in France in 2003 and 2006. Pharmacoepidemiol. Drug Saf. 2012, 21, 285–288. [Google Scholar] [CrossRef]
  12. United Nation. World Population Ageing 2013 ST/ESA/SER.A/348; Department of Economic and Social Affairs, Population Division: New York, NY, USA, 2013. [Google Scholar]
  13. Statistical Office of the Republic of Slovenia. EUROPOP2023 Population Projections-Demographic Balances and Selected Indicators, Slovenia, 2022–2100. Available online: https://pxweb.stat.si/SiStatData/pxweb/sl/Data/Data/05U3019S.px/ (accessed on 27 October 2023).
  14. Linares, C.; Mirón, I.J.; Montero, J.C.; Criado-Álvarez, J.J.; Tobías, A.; Díaz, J. The time trend temperature-mortality as a factor of uncertainty analysis of impacts of future heat waves. Environ. Health Perspect. 2014, 122, A118. [Google Scholar] [CrossRef]
  15. Martinez, G.S.; Baccini, M.; De Ridder, K.; Hooyberghs, H.; Lefebvre, W.; Kendrovski, V.; Scott, K.; Spasenovska, M. Projected heat-related mortality under climate change in the metropolitan area of Skopje. BMC Public Health 2016, 16, 407. [Google Scholar] [CrossRef]
  16. Wu, J.; Zhou, Y.; Gao, Y.; Fu, J.S.; Johnson, B.A.; Huang, C.; Kim, Y.M.; Liu, Y. Estimation and uncertainty analysis of impacts of future heat waves on mortality in the eastern United States. Environ. Health Perspect. 2014, 122, 10–16. [Google Scholar] [CrossRef]
  17. Peng, R.D.; Bobb, J.F.; Tebaldi, C.; McDaniel, L.; Bell, M.L.; Dominici, F. Toward a quantitative estimate of future heat wave mortality under global climate change. Environ. Health Perspect. 2011, 119, 701–706. [Google Scholar] [CrossRef]
  18. Roldán, E.; Gómez, M.; Pino, M.R.; Pórtoles, J.; Linares, C.; Díaz, J. The effect of climate-change-related heat waves on mortality in Spain: Uncertainties in health on a local scale. Stoch. Environ. Res. Risk A 2016, 30, 831–839. [Google Scholar] [CrossRef]
  19. Bobb, J.F.; Peng, R.D.; Bell, M.L.; Dominici, F. Heat-related mortality and adaptation to heat in the United States. Environ. Health Perspect. 2014, 122, 811–816. [Google Scholar] [CrossRef] [PubMed]
  20. Díaz, J.; Carmona, R.; Mirón, I.J.; Ortiz, C.; Linares, C. Comparison of the effects of extreme temperatures on daily mortality in Madrid (Spain), by age group: The need for a cold wave prevention plan. Environ. Res. 2015, 143 Pt A, 186–191. [Google Scholar] [CrossRef]
  21. Ng, C.F.S.; Boeckmann, M.; Ueda, K.; Zeeb, H.; Nitta, H.; Watanabe, C.; Honda, Y. Heat-related mortality: Effect modification and adaptation in Japan from 1972 to 2010. Glob. Environ. Change 2014, 9, 234–243. [Google Scholar] [CrossRef]
  22. Perčič, S.; Kukec, A.; Cegnar, T.; Hojs, A. Number of Heat Wave Deaths by Diagnosis, Sex, Age Groups, and Area, in Slovenia, 2015 vs. 2003. Int. J. Environ. Res. Public Health 2018, 15, 173. [Google Scholar] [CrossRef]
  23. Republic of Slovenia Statistical Office. Population of Slovenia. Available online: https://www.google.com/search?sxsrf=ACYBGNTJ6IA1Lb1L92EqTGYAVmhU2HdxgA%3A1571495426941&source=hp&ei=Ah6rXar6NuuXmwXdxYS4AQ&q=prebivalstvo+slovenije&oq=prebivastvo&gs_l=psy-ab.1.0.0i13l10.2340055.2346463.2348400...0.0..0.304.1473.8j2j1j1......0....1..gws-wiz.....10..35i362i39j35i39j0j0i10j0i203.XYQvALUynys#spf=1571497774642 (accessed on 18 October 2023).
  24. Slovenian Environment Agency (ARSO). National Meteorological Service of Slovenia. Available online: http://meteo.arso.gov.si/met/en/climate/ (accessed on 23 October 2023).
  25. Michelozzi, P.; Kirchmayer, U.; Katsouyanni, K.; Biggeri, A.; McGregor, G.; Menne, B.; Kassomenos, P.; Anderson, H.R.; Baccini, M.; Accetta, G.; et al. Assessment and prevention of acute health effects of weather conditions in Europe, the PHEWE project: Background, objectives, design. Environ. Health 2007, 6, 12. [Google Scholar] [CrossRef]
  26. Vida, M. Medicinska Meteorologija; Medicinska Fakulteta: Ljubljana, Slovenia, 1990. [Google Scholar]
  27. Joe, L.; Hoshiko, S.; Dobraca, D.; Jackson, R.; Smorodinsky, S.; Smith, D.; Harnly, M. Mortality during a Large-Scale Heat Wave by Place, Demographic Group, Internal and External Causes of Death, and Building Climate Zone. Int. J. Environ. Res. Public Health 2016, 13, 299. [Google Scholar] [CrossRef] [PubMed]
  28. Anderson, B.G.; Bell, M.L. Weather-related mortality: How heat, cold, and heat waves affect mortality in the United States. Epidemiology 2009, 20, 205–213. [Google Scholar] [CrossRef]
  29. Bao, J.; Wang, Z.; Yu, C.; Li, X. The influence of temperature on mortality and its Lag effect: A study in four Chinese cities with different latitudes. BMC Public Health 2016, 16, 375. [Google Scholar] [CrossRef]
  30. Baccini, M.; Kosatsky, T.; Analitis, A.; Anderson, H.R.; D’Ovidio, M.; Menne, B.; Michelozzi, P.; Biggeri, A.; PHEWE Collaborative Group. Impact of heat on mortality in 15 European cities: Attributable deaths under different weather scenarios. J. Epidemiol. Community Health 2011, 65, 64–70. [Google Scholar] [CrossRef] [PubMed]
  31. Slovenian Environment Agency. Air Qality–Yearly Reports. Available online: http://rte.arso.gov.si/zrak/kakovost%20zraka/poro%C4%8Dila%20in%20publikacije/kakovost_letna.html (accessed on 9 September 2024).
  32. Van Someren, E.J. More than a marker: Interaction between the circadian regulation of temperature and sleep, age-related changes, and treatment possibilities. Chronobiol. Int. 2000, 17, 313–354. [Google Scholar] [CrossRef]
  33. Son, J.; Liu, J.C.; Bell, M.L. Temperature-related mortality: A systematic review and investigation of effect modifiers. Environ. Res. Lett. 2019, 14, 073004. [Google Scholar] [CrossRef]
  34. Sherina, M.S.; Rampal, L.; Mustaqim, A. Factors associated with chronic illness among the elderly in a rural community in Malaysia. Asia Pac. J. Public Health 2004, 16, 109–114. [Google Scholar] [CrossRef] [PubMed]
  35. Franklin, R.C.; Mason, H.M.; King, J.C.; Peden, A.E.; Nairn, J.; Miller, L.; Watt, K.; FitzGerald, G. Heatwaves and mortality in Queensland 2010–2019: Implications for a homogenous state-wide approach. Int. J. Biometeorol. 2023, 67, 503–515. [Google Scholar] [CrossRef]
  36. Aghababaeian, H.; Ostadtaghizadeh, A.; Ardalan, A.; Asgary, A.; Akbary, M.; Yekaninejad, M.S.; Sharafkhani, R.; Stephens, C. Mortality Risk Related to Heatwaves in Dezful City, Southwest of Iran. Environ. Health Insights 2023, 17, 11786302231151538. [Google Scholar] [CrossRef]
  37. Xi, D.; Liu, L.; Zhang, M.; Huang, C.; Burkart, K.G.; Ebi, K.; Zeng, Y.; Ji, J.S. Risk factors associated with heatwave mortality in Chinese adults over 65 years. Nat. Med. 2024, 30, 1489–1498. [Google Scholar] [CrossRef]
  38. Liu, J.; Varghese, B.M.; Hansen, A.; Zhang, Y.; Driscoll, T.; Morgan, G.; Dear, K.; Gourley, M.; Capon, A.; Bi, P. Heat exposure and cardiovascular health outcomes: A systematic review and meta-analysis. Lancet Planet Health 2022, 6, e484–e495. [Google Scholar] [CrossRef]
  39. Thompson, R.; Landeg, O.; Kar-Purkayastha, I.; Hajat, S.; Kovats, S.; O’Connell, E. Heatwave Mortality in Summer 2020 in England: An Observational Study. Int. J. Environ. Res. Public Health 2022, 19, 6123. [Google Scholar] [CrossRef]
  40. Chen, K.; Bi, J.; Chen, J.; Chen, X.; Huang, L.; Zhou, L. Influence of heat wave definitions to the added effect of heat waves on daily mortality in Nanjing, China. Sci. Total Environ. 2015, 506–507, 18–25. [Google Scholar] [CrossRef]
  41. Kim, E.J.; Kim, H. Effect modification of individual- and regional-scale characteristics on heat wave-related mortality rates between 2009 and 2012 in Seoul, South Korea. Sci. Total Environ. 2017, 595, 141–148. [Google Scholar] [CrossRef] [PubMed]
  42. Ma, W.; Zeng, W.; Zhou, M.; Wang, L.; Rutherford, S.; Lin, H.; Liu, T.; Zhang, Y.; Xiao, J.; Zhang, Y.; et al. The short-term effect of heat waves on mortality and its modifiers in China: An analysis from 66 communities. Environ. Int. 2015, 75, 103–109. [Google Scholar] [CrossRef] [PubMed]
  43. Gabriel, K.M.; Endlicher, W.R. Urban and rural mortality rates during heat waves in Berlin and Brandenburg, Germany. Environ. Pollut. 2011, 159, 2044–2050. [Google Scholar] [CrossRef] [PubMed]
  44. Burkart, K.; Schneider, A.; Breitner, S.; Khan, M.H.; Krämer, A.; Endlicher, W. The effect of atmospheric thermal conditions and urban thermal pollution on all-cause and cardiovascular mortality in Bangladesh. Environ. Pollut. 2011, 159, 2035–2043. [Google Scholar] [CrossRef] [PubMed]
  45. Hajat, S.; Kovats, R.S.; Lachowycz, K. Heat-related and cold-related deaths in England and Wales: Who is at risk? Occup. Environ. Med. 2007, 64, 93–100. [Google Scholar] [CrossRef]
  46. Kovats, R.S.; Hajat, S. Heat stress and public health: A critical review. Annu. Rev. Public Health 2008, 29, 41–55. [Google Scholar] [CrossRef]
  47. Hu, K.; Guo, Y.; Hochrainer-Stigler, S.; Liu, W.; See, L.; Yang, X.; Zhong, J.; Fei, F.; Chen, F.; Zhang, Y.; et al. Evidence for Urban-Rural Disparity in Temperature-Mortality Relationships in Zhejiang Province, China. Environ. Health Perspect. 2019, 127, 37001. [Google Scholar] [CrossRef]
  48. Zeng, W.; Lao, X.; Rutherford, S.; Xu, Y.; Xu, X.; Lin, H.; Liu, T.; Luo, Y.; Xiao, J.; Hu, M.; et al. The effect of heat waves on mortality and effect modifiers in four communities of Guangdong Province, China. Sci. Total Environ. 2014, 482–483, 214–221. [Google Scholar] [CrossRef]
  49. Chen, K.; Zhou, L.; Chen, X.; Ma, Z.; Liu, Y.; Huang, L.; Bi, J.; Kinney, P.L. Urbanization Level and Vulnerability to Heat-Related Mortality in Jiangsu Province, China. Environ. Health Perspect. 2016, 124, 1863–1869. [Google Scholar] [CrossRef]
  50. D’Ippoliti, D.; Michelozzi, P.; Marino, C.; de’Donato, F.; Menne, B.; Katsouyanni, K.; Kirchmayer, U.; Analitis, A.; Medina-Ramón, M.; Paldy, A.; et al. The impact of heat waves on mortality in 9 European cities: Results from the EuroHEAT project. Environ. Health 2010, 9, 37. [Google Scholar] [CrossRef]
  51. Conti, S.; Masocco, M.; Meli, P.; Minelli, G.; Palummeri, E.; Solimini, R.; Toccaceli, V.; Vichi, M. General and specific mortality among the elderly during the 2003 heat wave in Genoa (Italy). Environ. Res. 2007, 103, 267–274. [Google Scholar] [CrossRef] [PubMed]
  52. Health in Slovenia. Available online: https://nijz.si/wp-content/uploads/2022/07/zdravje_v_sloveniji_eng_e-verzija.pdf (accessed on 18 October 2023).
  53. American Heart Association. Available online: https://www.heart.org/en/health-topics/cholesterol/about-cholesterol/atherosclerosis (accessed on 18 October 2023).
  54. Folkow, B. Physiological aspects of primary hypertension. Physiol. Rev. 1982, 62, 347–504. [Google Scholar] [CrossRef]
  55. Greene, A.S.; Tonellato, P.J.; Lui, J.; Lombard, J.H.; Cowley, A.W., Jr. Microvascular rarefaction and tissue vascular resistance in hypertension. Am. J. Physiol. 1989, 256 Pt 2, H126–H231. [Google Scholar] [CrossRef]
  56. Carberry, P.A.; Shepherd, A.M.; Johnson, J.M. Resting and maximal forearm skin blood flows are reduced in hypertension. Hypertension 1992, 20, 349–355. [Google Scholar] [CrossRef] [PubMed]
  57. Allen, A.; Segal-Gidan, G. Heat-related illness in the elderly. Clin. Geriatr. 2007, 15, 37–45. [Google Scholar]
  58. Kenney, W.L.; Craighead, D.H.; Alexander, L.M. Heat waves, aging, and human cardiovascular health. Med. Sci. Sports Exerc. 2014, 46, 1891–1899. [Google Scholar] [CrossRef]
  59. Cui, J.; Arbab-Zadeh, A.; Prasad, A.; Durand, S.; Levine, B.D.; Crandall, C.G. Effects of heat stress on thermoregulatory responses in congestive heart failure patients. Circulation 2005, 112, 2286–2292. [Google Scholar] [CrossRef]
  60. Schols, J.M.; De Groot, C.P.; van der Cammen, T.J.; Olde Rikkert, M.G. Preventing and treating dehydration in the elderly during periods of illness and warm weather. J. Nutr. Health Aging 2009, 13, 150–157. [Google Scholar] [CrossRef]
  61. Watso, J.C.; Farquhar, W.B. Hydration Status and Cardiovascular Function. Nutrients 2019, 11, 1866. [Google Scholar] [CrossRef]
  62. Keatinge, W.R.; Coleshaw, S.R.; Easton, J.C.; Cotter, F.; Mattock, M.B.; Chelliah, R. Increased platelet and red cell counts, blood viscosity, and plasma cholesterol levels during heat stress, and mortality from coronary and cerebral thrombosis. Am. J. Med. 1986, 81, 795–800. [Google Scholar] [CrossRef]
  63. Knochel, J.P. Heat stroke and related heat stress disorders. Dis. Mon. 1989, 35, 301–377. [Google Scholar] [PubMed]
  64. Glazer, J.L. Management of heatstroke and heat exhaustion. Am. Fam. Physician 2005, 71, 2133–2140. [Google Scholar] [PubMed]
  65. Wang, L.; Green, F.H.; Smiley-Jewell, S.M.; Pinkerton, K.E. Susceptibility of the aging lung to environmental injury. Semin. Respir. Crit. Care Med. 2010, 31, 539–553. [Google Scholar] [CrossRef] [PubMed]
  66. Bélanger, D.; Berry, P.; Bouchet, V.; Charron, D.; Clarke, K.L.; Doyon, B.; Fleury, M.; Furgal, C.; Gosselin, P.; Lamy, S.; et al. Human Health in a Changing Climate: A Canadian Assessment of Vulnerabilities and Adaptive Capacity; Séguin, J., Ed.; Health Canada: Ottawa, ON, Canada, 2008. Available online: www.sindark.com/NonBlog/Articles/hc-cc-report/CCandHealth.pdf (accessed on 19 October 2019).
  67. Bevan, G.H.; Al-Kindi, S.G.; Brook, R.; Rajagopalan, S. Ambient Air Pollution and Atherosclerosis: Recent Updates. Curr. Atheroscler. Rep. 2021, 23, 63. [Google Scholar] [CrossRef]
  68. Robertson, S.; Miller, M.R. Ambient air pollution and thrombosis. Part. Fibre Toxicol. 2018, 15, 1. [Google Scholar] [CrossRef]
  69. Mazzoli-Rocha, F.; Fernandes, S.; Einicker-Lamas, M.; Zin, W.A. Roles of oxidative stress in signaling and inflammation induced by particulate matter. Cell Biol. Toxicol. 2010, 26, 481–498. [Google Scholar] [CrossRef]
  70. Šuškovič, S.; Camlek, T.; Gril, M.; Hudoklin, I.; Klobučar, A.; Koren, I.; Koterle, M.; Terzin, K.; Mežnar, B.; Silič, A. Prevalenca astme pri odraslih v Sloveniji. Zdrav. Vestn. 2011, 80, 451–457. [Google Scholar]
  71. Blanco, I.; Diego, I.; Bueno, P.; Fernández, E.; Casas-Maldonado, F.; Esquinas, C.; Soriano, J.B.; Miravitlles, M. Geographical distribution of COPD prevalence in Europe, estimated by an inverse distance weighting interpolation technique. Int. J. Chron. Obstruct. Pulmon. Dis. 2017, 13, 57–67. [Google Scholar] [CrossRef]
  72. Nairn, J.R.; Fawcett, R. Defining Heatwaves: Heatwave Defined as a Heat-Impact Event Servicing all Community and Business Sectors in Australia; Technical Report 060; Centre for Australian Weather and Climate Research (CAWCR): Kent Town, SA, Australia, 2013; 84p.
Figure 1. Number of heatwaves and number of days during heatwaves, from the year 1999 to 2020, in Slovenia.
Climate 12 00148 g001
Figure 2. Increased/decreased number of deaths, in %, due to all causes and due to the circulatory system causes, for the age group 75+ years from 1999 to 2020 in Slovenia.
Climate 12 00148 g002
Table 1. Relative risks (RR) for number of deaths during heatwaves and 95% confidence interval (CI) due to diagnosis, urban/rural area, for age group 75+ years, from 1999 to 2020 in Slovenia.
19992000200120022003
Underlying Cause of Death (ICD-10 code)RR (95% CI)RR (95% CI)RR (95% CI)RR (95% CI)RR (95% CI)
ALL, all causes (A00-T98)0.96 (0.85–1.08)1.06 (0.94–1.19) 1.09 (0.97–1.21)1.04 (0.95–1.14)1.03 (0.94–1.12)
ALL, all causes, age group 75+ years (A00-T98)0.91 (0.76–1.09) 1.14 (0.96–1.36)1.09 (0.93–1.28)1.04 (0.94–1.18) 1.02 (0.92–1.16)
ALL, circulatory diseases, age group 75+ years (I00-I99)0.8 (0.63–1.02)1.17 (0.92–1.49)1.19 (0.94–1.51)1.09 (0.9–1.32)0.89 (0.47–1.06)
ALL, respiratory diseases, age group 75+ years (J00-J99)1.2 (0.69–2.3)1.03 (0.54–1.96)0.90 (0.53–1.53)1.05 (0.66–1.69) 0.98 (0.65–1.48)
ALL, urban area, age group 75+ years (A00-T98)1.04 (0.63–1.74)1.04 (0.72–1.49)1.18 (0.85–1.65)1.08 (0.82–1.42)1.11 (0.86–1.43)
ALL, rural area, age group 75+ years (A00-T98)0.85 (0.71–1.03)1.16 (0.95–1.41)1.07 (0.89–1.28)1.03 (0.89–1.19)1.00 (0.87–1.15)
20042005200620072008
Underlying Cause of Death (ICD-10 code)RR (95% CI)RR (95% CI)RR (95% CI)RR (95% CI)RR (95% CI)
ALL, all causes (A00-T98)1.03 (0.91–1.16)1.01 (0.9–1.14)1.10 (1.00–1.21)1.26 (1.12–1.42)1.02 (0.93–1.11)
ALL, all causes, age group 75+ years (A00-T98)1.01 (0.86–1.19)0.98 (0.84–1.15) 1.07 (0.95–1.21)1.22 (1.04–1.44)1.01 (0.90–1.13)
ALL, circulatory diseases, age group 75+ years (I00-I99)1.05 (0.81–1.33)1.08 (0.85–1.35)1.25 (1.05–1.48)1.33 (1.06–1.67)0.99 (0.84–1.16)
ALL, respiratory diseases, age group 75+ years (J00-J99)1.10 (0.64–1.88)1.29 (0.71–2.31) 1.13 (0.79–1.69)1 (0.52–2.07)0.95 (0.65–1.38)
ALL, urban area, age group 75+ years (A00-T98)1.18 (0.84–1.66)1.06 (0.77–1.47)1.33 (1.02–1.72)1.07 (0.77–1.49)0.98 (0.78–1.23)
ALL, rural area, age group 75+ years (A00-T98)0.94 (0.78–1.13)0.94 (0.79–1.13)1.09 (0.95–1.26)1.29 (1.13–1.47)1.02 (0.90–1.16)
20092010201120122013
Underlying Cause of Death (ICD-10 code)RR (95% CI)RR (95% CI)RR (95% CI)RR (95% CI)RR (95% CI)
ALL, all causes (A00-T98)1.01 (0.91–1.11)1.05 (0.96–1.14)1.01 (0.93–1.09)1.03 (0.95–1.11)
ALL, all causes, age group 75+ years (A00-T98)0.96 (0.84–1.1)1.03 (0.91–1.15)1.03 (0.93–1.15)1.07 (0.96–1.19)0.96 (0.86–1.09)
ALL, circulatory diseases, age group 75+ years (I00-I99)1.04 (0.85–1.26)0.97 (0.87–1.15)1.01 (0.87–1.18)1.07 (0.92–1.24)0.99 (0.83–1.17)
ALL, respiratory diseases, age group 75+ years (J00-J99)0.86 (0.52–1.40)1.27 (0.84–1.93)0.84 (0.57–1.23)0.81 (0.56–1.17)1.23 (0.79–1.91)
ALL, urban area, age group 75+ years (A00-T98)1.17 (0.89–1.53)1.25 (0.98–1.60)1.02 (0.82–1.28)1.26 (1.01–1.57)1.04 (0.84–1.27)
ALL, rural area, age group 75+ years (A00-T98)0.90 (0.77–1.05)0.96 (0.84–1.1)1.03 (0.92–1.16)1.02 (0.9–1.14)0.93 (0.8–1.07)
20142015201620172018
Underlying Cause of Death (ICD-10 code)RR (95% CI)RR (95% CI)RR (95% CI)RR (95% CI)RR (95% CI)
ALL, all causes (A00-T98)1.26 (1.14–1.40)1.07 (0.99–1.16)0.99 (0.91–1.06)1.01 (0.94–1.09)1.01 (0.92–1.08)
ALL, all causes, age group 75+ years (A00-T98)1.27 (1.12–1.43)1.28 (1.15–1.41)1.07 (9.96–1.19)0.98 (0.90–1.06)0.99 (0.89–1.09)
ALL, circulatory diseases, age group 75+ years (I00-I99)1.3 (1.1–1.55)1.27 (1.1–1.48)1.02 (0.87–1.18)0.97 (0.86–1.11)1.02 (0.85–1.21)
ALL, respiratory diseases, age group 75+ years (J00-J99)1.03 (0.65–1.63)1.08 (0.75–1.55)0.83 (0.55–1.23)0.98 (0.67–1.44)0.97 (0.58–1.63)
ALL, urban area, age group 75+ years (A00-T98)1.29 (0.99–1.68)1.17 (0.95–1.45)1.14 (0.92–1.43)0.98 (0.87–1.11)1.10 (0.90–1.36)
ALL, rural area, age group 75+ years (A00-T98)1.26 (1.09–1.45)1.31 (1.16–1.47)1.05 (0.93–1.18)0.97 (0.86–1.1)1.05 (0.90–1.23)
20192020
Underlying Cause of Death (ICD-10 code)RR (95% CI)RR (95% CI)
ALL, all causes (A00-T98)1 (0.94–1.06)1.06 (0.99–1.13)
ALL, all causes, age group 75+ years (A00-T98)0.96 (0.87–1.03)1.03 (0.95–1.12)
ALL, circulatory diseases, age group 75+ years (I00-I99)0.89 (0.80–1.00)1.05 (0.93–1.2)
ALL, respiratory diseases, age group 75+ years (J00-J99)0.88 (0.79–1.01)1.02 (0.68–1.55)
ALL, urban area, age group 75+ years (A00-T98)1.08 (0.92–1.28)0.98 (0.83–1.17)
ALL, rural area, age group 75+ years (A00-T98)1.03 (0.92–1.16)1.04 (0.95–1.15)
Legend: ALL—both sexes; Climate 12 00148 i001—statistically significant association.
Disclaimer/Publisher’s Note: The statements, opinions and data contained in all publications are solely those of the individual author(s) and contributor(s) and not of MDPI and/or the editor(s). MDPI and/or the editor(s) disclaim responsibility for any injury to people or property resulting from any ideas, methods, instructions or products referred to in the content.

