Next Article in Journal
Enhancing Agricultural Soil Carbon Sequestration: A Review with Some Research Needs
Previous Article in Journal
Community-Led Climate Preparedness and Resilience in Boston: New Evidence from Communities of Color
Previous Article in Special Issue
Analysis of Hydrometeorological Trends and Drought Severity in Water-Demanding Mediterranean Islands under Climate Change Conditions
 
 
climate-logo
Article Menu
Article

Characterization of Water Bodies through Hydro-Physical Indices and Anthropogenic Effects in the Eastern Northeast of Brazil

by
Christopher Horvath Scheibel
1,
Astrogilda Batista do Nascimento
1,
George do Nascimento Araújo Júnior
1,
Alexsandro Claudio dos Santos Almeida
1,
Thieres George Freire da Silva
1,2,
José Lucas Pereira da Silva
1,
Francisco Bento da Silva Junior
1,
Josivalter Araújo de Farias
1,
João Pedro Alves de Souza Santos
1,
José Francisco de Oliveira-Júnior
3,
Jhon Lennon Bezerra da Silva
4,
Fernando Manuel João
1,
Alex Santos de Deus
1,
Iêdo Teodoro
1,
Henrique Fonseca Elias de Oliveira
4 and
Marcos Vinícius da Silva
1,*
1
Department of Plant Production, Engineering and Agricultural Sciences Campus, Federal University of Alagoas, BR 104, SN, Rio Largo 57100-000, AL, Brazil
2
Academic Unit of Serra Talhada (UAST), Agrometeorology Laboratory, Federal Rural University of Pernambuco (UFRPE), Av. Gregório Ferraz Nogueira, s/n, Serra Talhada 56909-535, PE, Brazil
3
Institute of Atmospheric Sciences (ICAT), Federal University of Alagoas (UFAL), Maceió 57072-260, AL, Brazil
4
Cerrado Irrigation Graduate Program, Goiano Federal Institute-Campus Ceres, GO-154, km 218-Zona Rural, Ceres 76300-000, GO, Brazil
*
Author to whom correspondence should be addressed.
Climate 2024, 12(9), 150; https://doi.org/10.3390/cli12090150
Submission received: 25 August 2024 / Revised: 17 September 2024 / Accepted: 19 September 2024 / Published: 23 September 2024

Abstract

:
Brazil, despite possessing the largest renewable freshwater reserves in the world (8.65 trillion m3 annually), faces growing challenges in water management due to increasing demand. Agriculture, responsible for 68.4% of water consumption, is one of the main drivers of this demand, especially in the São Francisco River Basin, where irrigation accounts for 81% of total water withdrawals. Water bodies play a crucial role in sustaining ecosystems and supporting life, particularly along the East-West axis of Alagoas, a water-rich region in the ENEB. This study aimed to map and quantify the spatiotemporal variations of water bodies in the ENEB region and assess the impacts of human activities using MODIS satellite data, applying hydrological indices such as NDWI, MNDWI, and AWEI. Between 2003 and 2022, significant variations in the extent of water bodies were observed, with reductions of up to 100 km2 during dry periods and expansions of up to 300 km2 during wet seasons compared to dry periods. AWEI and MNDWI proved to be the most effective indices for detecting water bodies with MODIS data, providing accurate insights into water dynamics. Additionally, the MapBiomas Rios dataset, despite being resampled from a 30 m to a 500 m resolution, offered the most accurate representation of water bodies due to its methodology for data acquisition. Changes in albedo and surface temperature were also detected, highlighting the influence of climate change on the region’s water resources. These findings are crucial for guiding the sustainable management of water resources, not only in Alagoas but also in other regions of Brazil and similar semi-arid areas around the world. The study demonstrates the hydrological variability in the state of Alagoas, indicating the need for adaptive strategies to mitigate the impacts of climate change and anthropogenic pressures, supporting the need for informed decision-making in water resource management at both local and national levels.

1. Introduction

For millennia, rivers have provided food, water for domestic and agricultural use, transportation, and more recently, energy generation and industrial production [1]. However, managing water resources remains a global challenge, particularly in semi-arid regions such as parts of Africa [2,3,4], the Middle East [5,6], North America [7], and Australia [8], where water scarcity and environmental degradation are exacerbated by harsh climatic changes and conditions. In these areas, satellite remote sensing has emerged as a powerful tool for monitoring water bodies, as demonstrated in studies from the Nile Basin [9], the Gobi Desert [10], the Sacramento–San Joaquin Delta of California [11], and the Murray-Darling Basin [12]. Despite their effectiveness, these approaches often face challenges such as limited long-term data, low spatial resolution, and interference from cloud cover, which can affect the accuracy of water body detection. Furthermore, many of these regions struggle with consistent monitoring due to technological and satellite coverage limitations.
Brazil, despite being the country with the largest availability of renewable freshwater resources globally (8.65 trillion m3 annually, according to FAO, 2017), is not immune to these concerns. Agriculture is the activity that uses water the most in Brazil, accounting for 68.4% of the flow consumed from water bodies, second to the National Agency of Water (ANA, 2019) [13,14]. Although Brazil is well endowed with fresh water, its growing demand has caused concern. According to the survey “Atlas Irrigation—use of water in irrigated agriculture” [15].
Economic activity that uses water the most in Brazil, particularly in the São Francisco River Basin (SFRB), where water withdrawals for irrigation granted by water authorities amount to 22.3 billion m3 per year, a number that is close to 81% of the total withdrawal [13]. The SFRB is one of the largest basins in Brazil, with a drainage area that encompasses six Brazilian states (Alagoas, Bahia, Goiás, Minas Gerais, Pernambuco, Sergipe), and the Distrito Federal.
It is subdivided into four geographic regions: Upper, Middle, Sub-Middle, and Lower [16]. The SFRB is under socioeconomic and environmental vulnerabilities. It encompasses regions with high population density and poverty and regions with low population density; social and environmentally diverse (biomes of Caatinga, Atlantic Forest, and Cerrado), which makes it difficult and challenging to enforce any type of scientific investigation [17].
It is widely known that the water availability from water bodies is vital for populations and ecosystems, especially in the semi-arid regions of Northeast Brazil (NEB), which face high climatic variability and the effects of flash droughts and severe droughts, impacting agriculture, water resources, civil defense, and tourism [18,19,20,21,22,23,24,25]. More specifically, in the state of Alagoas, in the Eastern Northeast of Brazil (ENEB), water availability varies significantly between climatic mesoregions, with the semi-arid portion facing frequent and severe droughts, in contrast to the coastal areas [18,21,26].
The condition and water availability in the semiarid region of NEB have demonstrated the severe effects of drought; these conditions favor vulnerability to environmental degradation processes, which are further exacerbated by the pressures of human activities, such as inadequate land use and management practices, including intensive agriculture, livestock, deforestation, and fires. The severe droughts between 2011 and 2020 notably impacted rural development opportunities, such as family farming, and worsened local and regional socioeconomic conditions [27].
Droughts lead to significant social, and economic losses at the local (municipalities and communities), regional, and national scales in Brazil affecting rural-urban migration flows [28], such as in the NEB region. These challenges highlight the importance of adopting public policies that promote sustainable land use and water resource management [29,30], especially in contingency situations, aiming to mitigate the adverse effects of climate variability in the NEB, particularly in extreme climate conditions, supporting rural livelihoods, and strengthening the resilience of affected local communities, not only in the state of Alagoas.
Furthermore, characterizing water bodies is essential for the adoption of public policies and the appropriate and sustainable institutional management of resources, contributing to sustainable development and the maintenance of biodiversity [31,32,33,34]. Efficient management of water resources is crucial for water security and the well-being of communities [35]. Recent studies highlight the importance of biodiversity conservation and sustainable management in the region [36].
Data from meteorological stations indicate that the Alagoas sertão region has an average annual precipitation between 400 and 600 mm [37,38,39] and average temperatures above 25 °C. In the Agreste region of Alagoas, precipitation ranges from 700 to 1000 mm [39,40,41,42,43], while in the Zona da Mata (eastern Alagoas), the average annual precipitation is significantly higher, usually between 1000 and 1800 mm [44,45,46,47].
The variability in rainfall and temperatures in the Alagoas semi-arid, characterized by prolonged droughts and extreme events, impacts water availability and the dynamics of water bodies [26,48,49]. The transition region between the Sertão and Agreste of Alagoas contains remnants of the Atlantic Forest and strategic water resources, including the São Francisco River basin [26,50], with the highest percentage of Atlantic Forest found in the Eastern mesoregion [16].
According to the study by Júnior et al. (2023) [51], temporal analyses identified drier and wetter years throughout the time series. Dry years, such as 2003, 2012, 2016, and 2018, stood out due to the absence of months with maximum rainfall, suggesting a direct impact of unfavorable climate conditions. In contrast, years such as 2000, 2002, 2006, 2008, 2011, and 2020 had at least three months with maximum rainfall, with 2022 registering the highest number of months with elevated precipitation in the series, being characterized as one of the wettest years.
When comparing these rainfall patterns with ENSO (El Niño and La Niña events) fluctuations, a strong correlation was observed between ENSO and variations in precipitation patterns, as noted in studies such as Oliveira-Junior et al. (2021) [52]. During El Niño events, historically associated with drought in Northeast Brazil, years with fewer months of heavy rainfall were observed, such as 2003 and 2015, both classified as moderate El Niño, and 2010, which experienced a strong El Niño.
Conversely, during La Niña years, which often bring increased precipitation to Northeast Brazil, a higher occurrence of months with maximum rainfall was identified. For instance, the year 2000, which corresponded to a moderate La Niña, had several months with maximum rainfall. Similarly, 2007, 2011, and 2021, which coincided with moderate to strong La Niña events, registered months with rainfall above the established threshold. Notably, 2020, also influenced by La Niña, saw a significant increase in maximum rainfall months, as most of the mentioned years correspond to ENSO events, specifically La Niña episodes [34] in the study area.
Satellite remote sensing datasets are valuable for monitoring the dynamics of water bodies, ensuring the detection of change patterns in a practical and effective manner, and with low operational costs [53,54,55]. They map seasonal and interannual patterns in the extent of these environments [38,56]. In recent years, the integration of satellite imagery with Geographical Information Systems (GIS) has further enhanced the capability to monitor and predict changes in river morphology, enabling a more detailed understanding of the evolution of these environments [57]. Through the use of spectral indices—combinations of surface reflectance at different wavelengths—researchers can effectively analyze temporal satellite images to track shifts in river dynamics [58].
There are several physical-hydric indices for detecting water bodies, such as the Normalized Difference Water Index (NDWI) [58,59,60,61,62], Modified Normalized Difference Water Index (MNDWI) [60,61,63,64], Normalized Difference Moisture Index (NDMI) [58,59,65,66], Automated Water Extraction Index (AWEI) [58,67,68,69,70], and Water Ratio Index (WRI) [58,71,72]. These indices are effective in detecting changes in the extent and quality of water resources [73], helping to understand the impacts of anthropogenic activities and climate change [74,75].
The MODIS sensor was designed to meet the requirements of three fields of study: atmosphere, ocean, and land, with spectral and spatial resolution bands selected for these objectives and nearly daily global coverage [76,77,78]. Several studies have highlighted the efficiency of MODIS in detecting land cover and land use changes at a continental scale in the Amazon [79,80,81], in the Caatinga [82], in the Brazilian Cerrado [83,84], and in other biomes and regions worldwide [85,86]. Additionally, it has been used to detect land cover and land use changes in deforestation mapping in Asia [73,87,88] and in multitemporal analyses in China [89,90]. Moreover, MODIS has been successfully applied in studies of water resources and water bodies monitoring in various regions around the world [56,74,75].
The use of Geographic Information Systems, such as the Google Earth Engine (GEE) cloud platform service, when combined with apps such as MapBiomas Brasil [91], with medium and high spatial resolution images, allows for the identification of phenological changes in ecosystems [89,92,93] and the mapping of land use and cover dynamics [94,95,96,97]. This facilitates orbital monitoring, generating time series that enable the characterization of trends and patterns in the observed targets [98,99,100].
In the context of digital image processing, the main objective of this study was to map the quantitative and spatiotemporal variations of water coverage areas using orbital remote sensing datasets to estimate physical-hydric indices. The aim was to address some of the limitations found in previous studies of the semi-arid region of northeastern Brazil, particularly regarding the use of low- and high-resolution imagery. This study utilized satellite images available on the Google Earth Engine (GEE) platform and spectral indices used for the identification of water bodies, monitoring the dynamics of water bodies in the state of Alagoas over a 20-year period, and comparing them with data from the MapBiomas Rios (MBR) project along the East-West axis of Alagoas. The specific objectives included: (I) establishing biennial time series of water bodies using the GEE cloud platform; (II) identifying changes and patterns in the regional dynamics of surface water across the state of Alagoas; and (III) comparing the effectiveness of different spectral indices used for water body identification.

2. Materials and Methods

2.1. Study Area

The study area encompasses the entire state of Alagoas, including its climatic mesoregions (East, Agreste, and Sertão)—(Figure 1a) and elevation (m) derived from the Shuttle Radar Topography Mission (SRTM) (Figure 1b), located in the NEB region. The state of Alagoas has a total area of approximately 27,767 km2 [101]. To the east, Alagoas borders the Atlantic Ocean, with a coastal strip of 229 km; to the north (N), it borders the state of Pernambuco; to the west (W), it borders Bahia; and to the south (S), it borders Sergipe.
Alagoas is divided into three climatic mesoregions (Figure 1a): Sertão, Agreste, and East Alagoas [41,52]. It is situated between latitude 8°48′12″–10°29′12″ S and longitude 35°09′36″–38°13′54″ W. The state extends 339 km in the longitudinal direction (East-West) and 186 km in the direction of its shorter axis (North-South) [18], with an average altitude of approximately 300 m and an estimated population of 3,127,683 inhabitants, according to the 2020 census [102].
Three climatic types are predominant in Alagoas. The East, characterized as the Zona da Mata, has a tropical monsoon climate classification (‘Am’). The Agreste, in the central portion of the state, has a tropical climate with a dry winter (‘Aw’). The Sertão, which covers the entire western part of the state, is characterized by low air humidity associated with high temperatures and is classified as BSh [103,104].

2.2. Data Acquisition

Part of the results presented in this study were obtained using the GEE platform, where datasets can be accessed and manipulated through an integrated development environment (IDE) called the GEE Code Editor [105]. In the Code Editor, all scripts were developed using the JavaScript programming language. The data used were obtained from the MODIS sensor aboard the TERRA satellite, from the MOD14A1, MOD11A2, MOD09A1, and MCD43A3 libraries. The selected products are provided with atmospheric correction and orthorectification, with a spatial resolution of 500 m [76,106,107].
For the retrieval of images of the state of Alagoas, the MBR 2.0 snippet for GEE (MBR is part of the MapBiomas Project, which does annual Land Use Land Cover Maps of Brazil), considering the period from 2003 to 2022 at biennial intervals, with the data averaged only for the recurring year. To achieve the study’s objectives, spectral indices for water detection from remote sensing images were employed, such as NDWI [60], MNDWI [61], AWEI [67], albedo [86], and MBR 2.0 data.

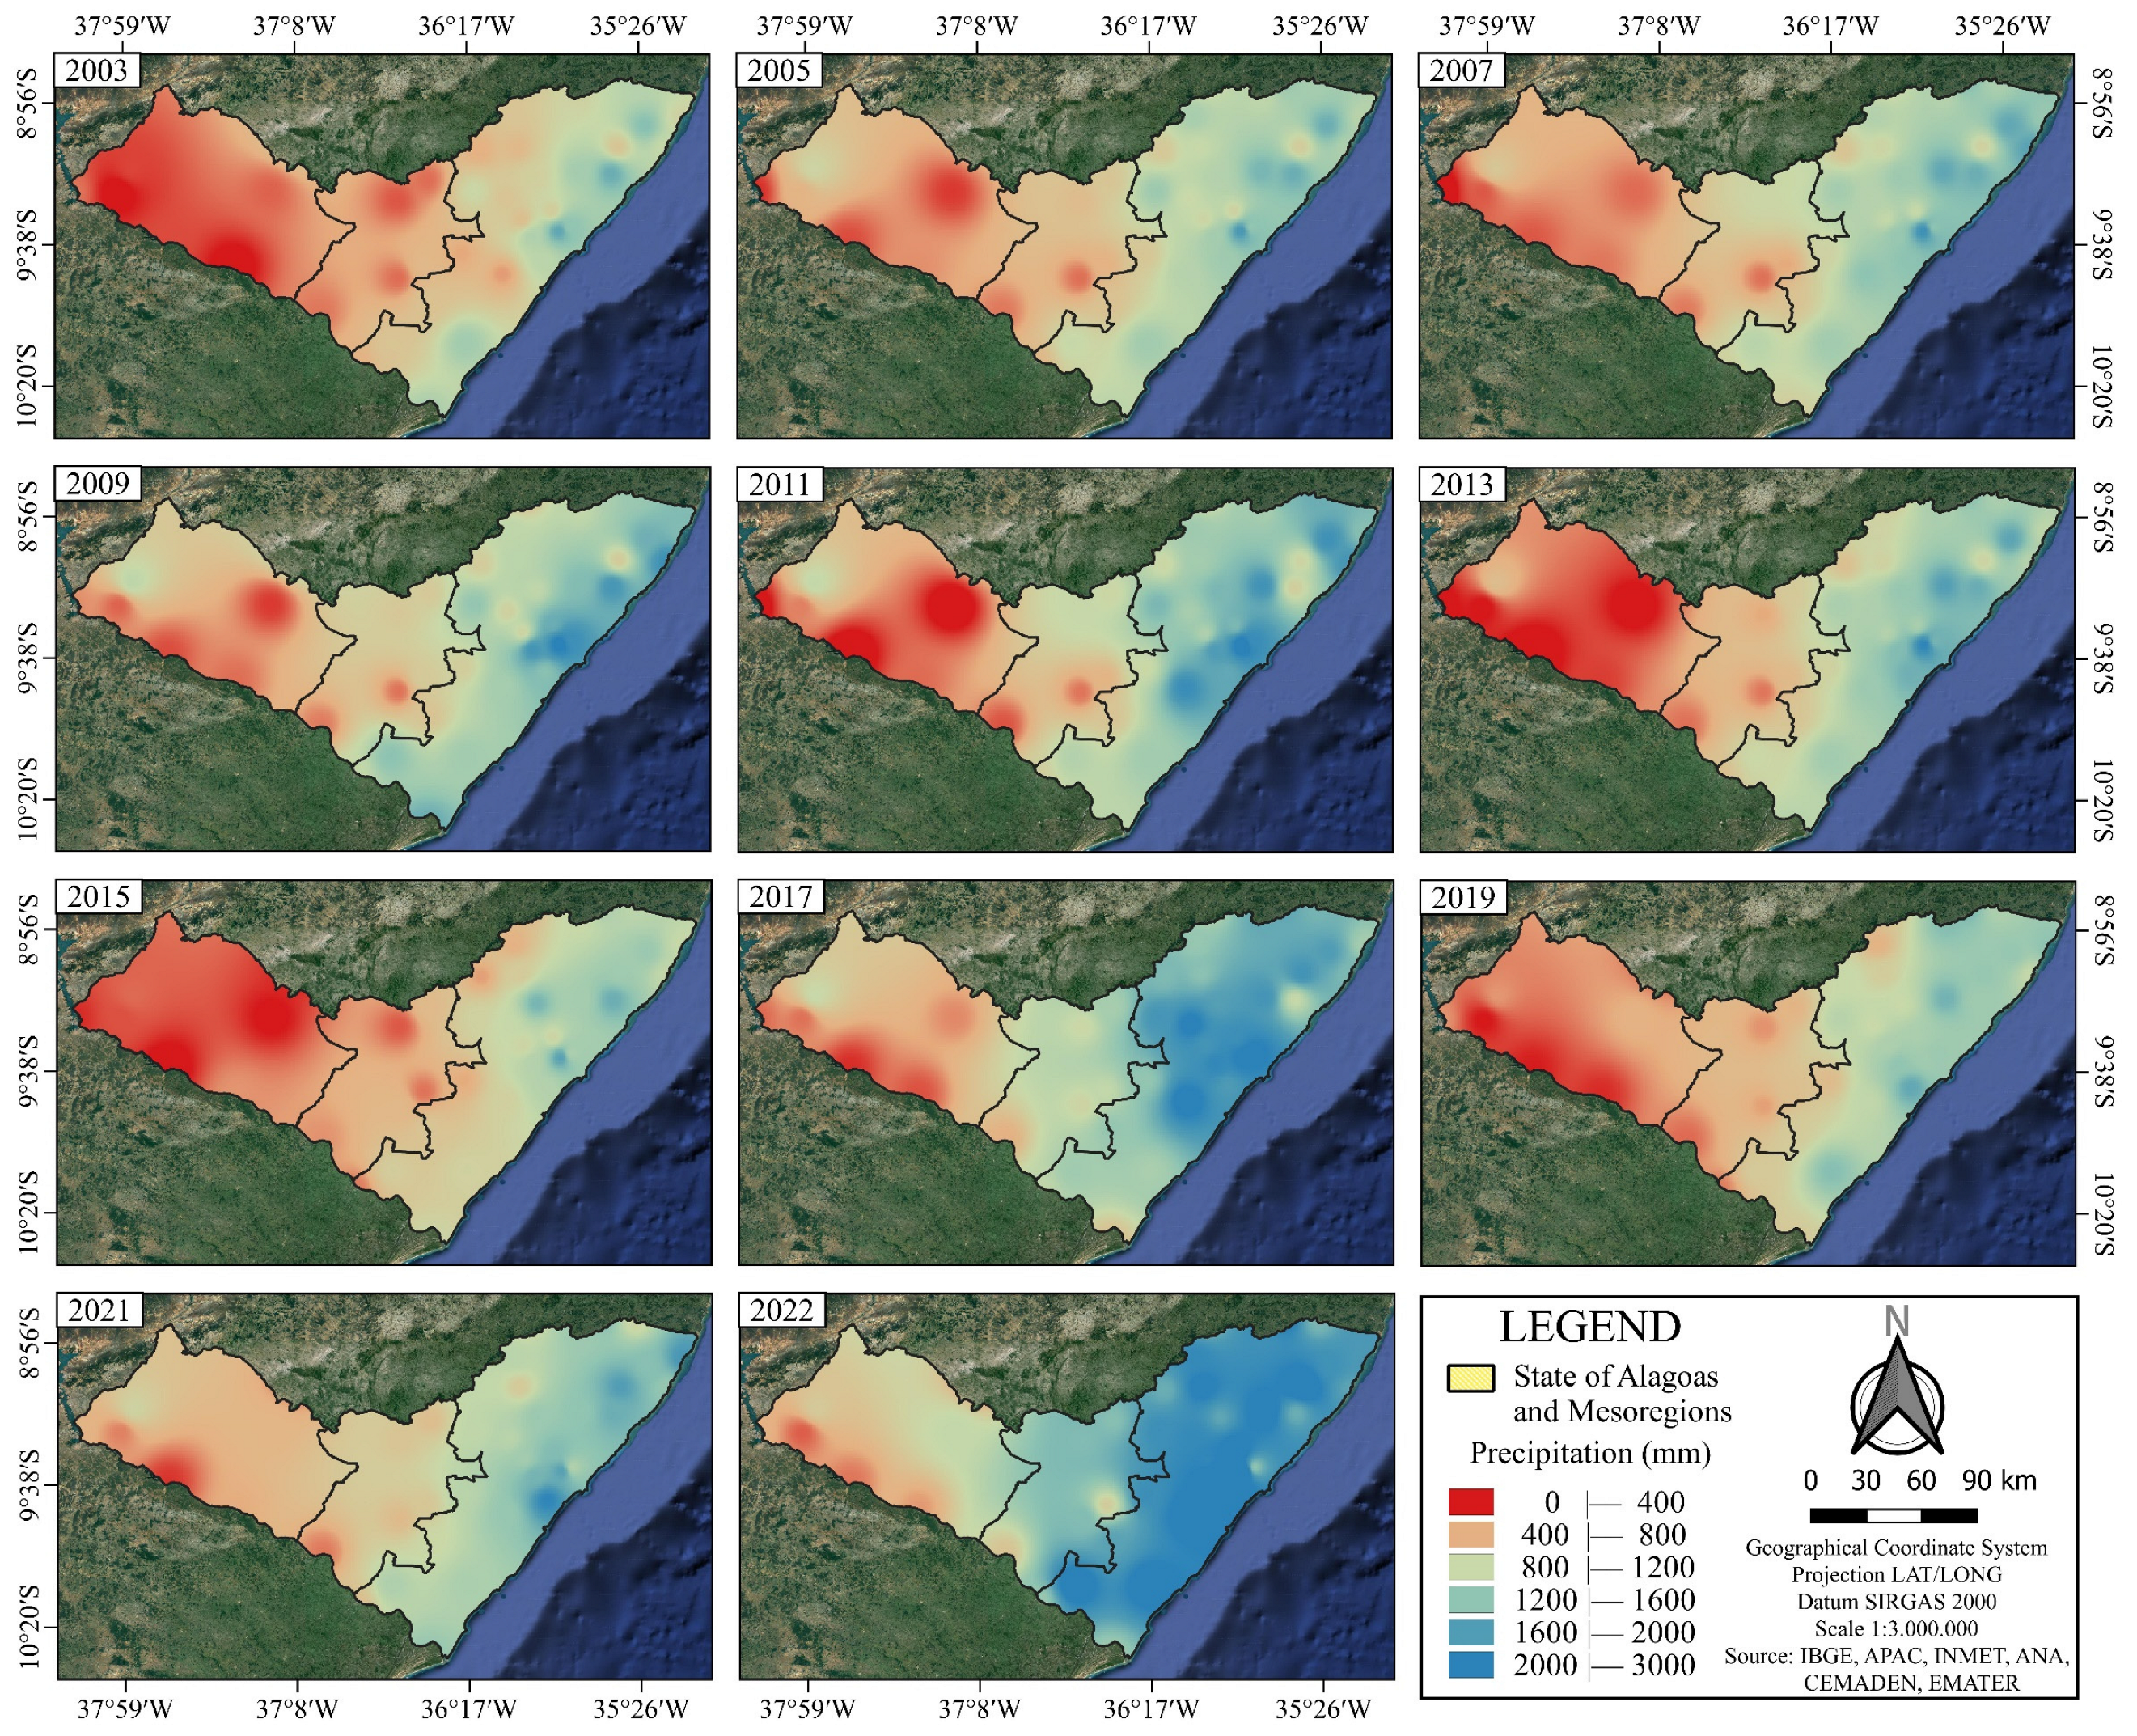
2.3. Precipitation Data

Precipitation data were obtained from automatic and conventional meteorological stations of the National Institute of Meteorology (INMET) [108], the National Water and Basic Sanitation Agency (ANA) [14], the Institute for Innovation in Sustainable Rural Development of Alagoas (EMATER), the National Center for Monitoring and Early Warning of Natural Disasters (CEMADEM), the Brazilian Institute of Geography and Statistics (IBGE) [102], and the Pernambuco Agency for Water and Climate (APAC) [109]. These data were subjected to quality control due to adverse failures or missing precipitation data. Failures and missing data in meteorological stations are common, with missing data reaching up to one-third of the data collection period in some cases [43,110].
To fill in the gaps in the data, multiple imputation was performed for up to 10% of the missing data from meteorological stations, taking into account the distance between the nearest neighboring stations and those at the same latitude [25,111]. In the context of validating precipitation data, the application of the EM algorithm can assist in estimating missing values and identifying patterns and trends in the data, improving the consistency and quality of the time series [112,113]. This approach has been successfully used in various hydrological and climatic studies, demonstrating its effectiveness in validating and filling precipitation data [114,115]. This procedure enabled the generation of a representative set of precipitation information reflecting the spatiotemporal variability of rainfall in Alagoas during the study period, minimizing errors and inconsistencies in the data [24,116].

Meteorological Characterization of the Data

The analysis of water bodies’ response to climatic variations, particularly during extreme events such as El Niño and La Niña, requires a rigorous methodology to understand water dynamics in the face of water stress [19,117]. Between 2003 and 2022, critical years were identified that exemplify extreme conditions of both drought and intense precipitation, with these climatic phenomena associated with El Niño and La Niña events [118,119]. This association was confirmed through the analysis of the obtained rainfall data and corroborated by information captured from both biophysical indices and the annual mean of surface temperature (Tsup) [19,34,120].
Based on the analysis of climatic data associated with extreme events and the average of El Niño and La Niña, years with characteristics of drought or high rainfall were identified, ranging from moderate to extreme intensity. Among the years studied, the series from the interval of 2003 to 2021 was selected, with data collected biennially, averaging only the odd years plus the addition of the year 2022 to the data range of this study, thus comprising eleven time series of rainfall and biophysical data. The analysis considered the relationship of these events with the occurrence of El Niño and La Niña phenomena [119,121]. This approach follows the research line proposed by Marengo et al. [121,122], which examines the implications of El Niño and La Niña events on regional climate variability [123,124].

2.4. Pre-Processing

The preprocessing of raster images obtained on the GEE platform is a crucial step in the analysis of water indices. Using JavaScript programming, specific spectral bands are combined to calculate indices such as NDWI, MNDWI, AWEI, albedo, and Tsup. The final product mitigates atmospheric interferences, such as aerosols and particles, and corrects reflectance errors, scattering, and diffusion, resulting in images with reduced error.
Subsequently, the images were reprojected to the SIRGAS 2000 geodetic reference system, UTM zone 24S, to ensure geospatial accuracy. In QGIS (Quantum Geographic Information System) version 3.28, the images were cropped using a shapefile (SHP) for the state of Alagoas, obtained from the IBGE [101], which provides free shapefiles for the geopolitical divisions of the country.
The shapefiles were used within the GEE platform to automate the clipping process on the raster images generated and already calculated with the water indices, ensuring that the analysis was restricted to the geographical boundaries of Alagoas. The pre-processed raster layers were then retrieved from Google Drive, downloaded to the local computer, and exported to QGIS for data analysis.
Finally, thematic maps and the extraction of quantitative and qualitative water data were performed in QGIS using internal tools and Python-based plugins. This method facilitates the acquisition of relevant water parameters and enables a detailed analysis of the spatio-temporal variability of water conditions in Alagoas.

2.5. Calculation of Hydro-Physical Indices

In this study, a biennial interval starting from 2003 was employed, utilizing only the representative mean for each specific year (ex. 2003, 2005, …, 2022). The biophysical indices NDWI, MNDWI, AWEI, and albedo were computed using the GEE platform, which automatically performs a cleaning and calibration of each raster image as mentioned before. The NDWI was proposed by McFeeters [63] and is used for detecting and monitoring changes in water content. The NDWI is calculated based on the reflectance of the green band (ρGreen) and the reflectance of the near-infrared band (ρNIR), as shown in Equation (1):
N D W I = ( ρ G r e e n ρ N I R ) ( ρ G r e e n + ρ N I R )
The NDWI may confuse urban targets with water bodies [61] and fail to enhance flooded areas with shallow depth [125]. In this regard, Xu [61] proposes a modification of the NDWI proposed by McFeeters [60]. The modified water index, MNDWI [61], was used for the extraction of flooded areas and explores the different spectral responses of the infrared and visible regions [126]. The MNDWI allows for better delineation of open water bodies and wetter areas, calculated by the ratio between the reflectance of the green band (ρGreen) and the shortwave infrared band (ρSWIR1), Equation (2):
M N D W I = ( ρ G r e e n ρ S W I R 1 ) ( ρ G r e e n + ρ S W I R 1 )
The AWEI, suggested by Feyisa [47], is an advanced technique developed to improve the detection and extraction of water surfaces from remote sensing images based on five spectral bands (blue, green, NIR, SWIR 1, and SWIR 2). The AWEI effectively maximizes the contrast between water and other dark surfaces, such as shadows and buildings with similar reflectance patterns.
The AWEI has two variants: AWEInsh (AWEI non-shadow) and AWEIsh (AWEI shadow). AWEInsh is designed to effectively suppress non-water pixels, including built-up areas and exposed soils, while AWEIsh aims to enhance water extraction accuracy by removing shadow pixels that may not be completely eliminated by AWEInsh [67]. AWEIsh is particularly useful in regions with significant shadow presence and other dark surfaces, although it may lead to the misclassification of some highly reflective targets as water [67].
A W E I n s h = 4 × ρ G r e e n ρ S W I R 1 0.25 × ρ N I R + 2.75 × ρ S W I R 2
A W E I s h = ρ B l u e + 2.5 × ρ G r e e n 1.5 × ρ N I R + ρ S W I R 1 0.25 × ρ S W I R 2
In the present study, the AWEInsh (AWEI non-shadow) spectral index was chosen for characterizing water bodies in the state of Alagoas, considering the specific characteristics of the study area. The choice of AWEInsh is justified by its ability to effectively suppress non-water pixels, including exposed soil and sparse vegetation, which are prominent features of the Alagoas landscape. Unlike other spectral indices, such as NDWI and MNDWI, which may experience confusion between water and other targets with similar spectral responses [62,127], AWEInsh demonstrates greater robustness in discriminating between classes in areas with mixed coverage.
Surface albedo, along with hydro-physical indices, plays a crucial role in monitoring and understanding natural resources. Through albedo analysis, it is possible to infer important characteristics of the Earth’s surface, such as vegetation cover, the presence of wetlands, and changes in land use and land cover [128]. Albedo plays a significant role in climate and environmental systems for its role in radiation balance, particularly in modulating the absorption of solar radiation received by the earth’s surface [129].
α t o a = 0.215 × ρ 1 + 0.215 × ρ 2 + 0.242 × ρ 3 + 0.129 × ρ 4 + ( 0.101 × ρ 5 ) + ( 0.062 × ρ 6 ) ( 0.036 × ρ 7 )
Considering the ability of the GEE platform to automatically adjust various atmospheric effects in its processed products, it was not necessary to implement additional correction procedures for the raster images of both albedo and other indices. This feature is highlighted by Gorelick et al. [105], who elucidate the functionality of GEE in providing an extensive archive of pre-processed satellite imagery and geospatial datasets, where atmospheric corrections are applied automatically.

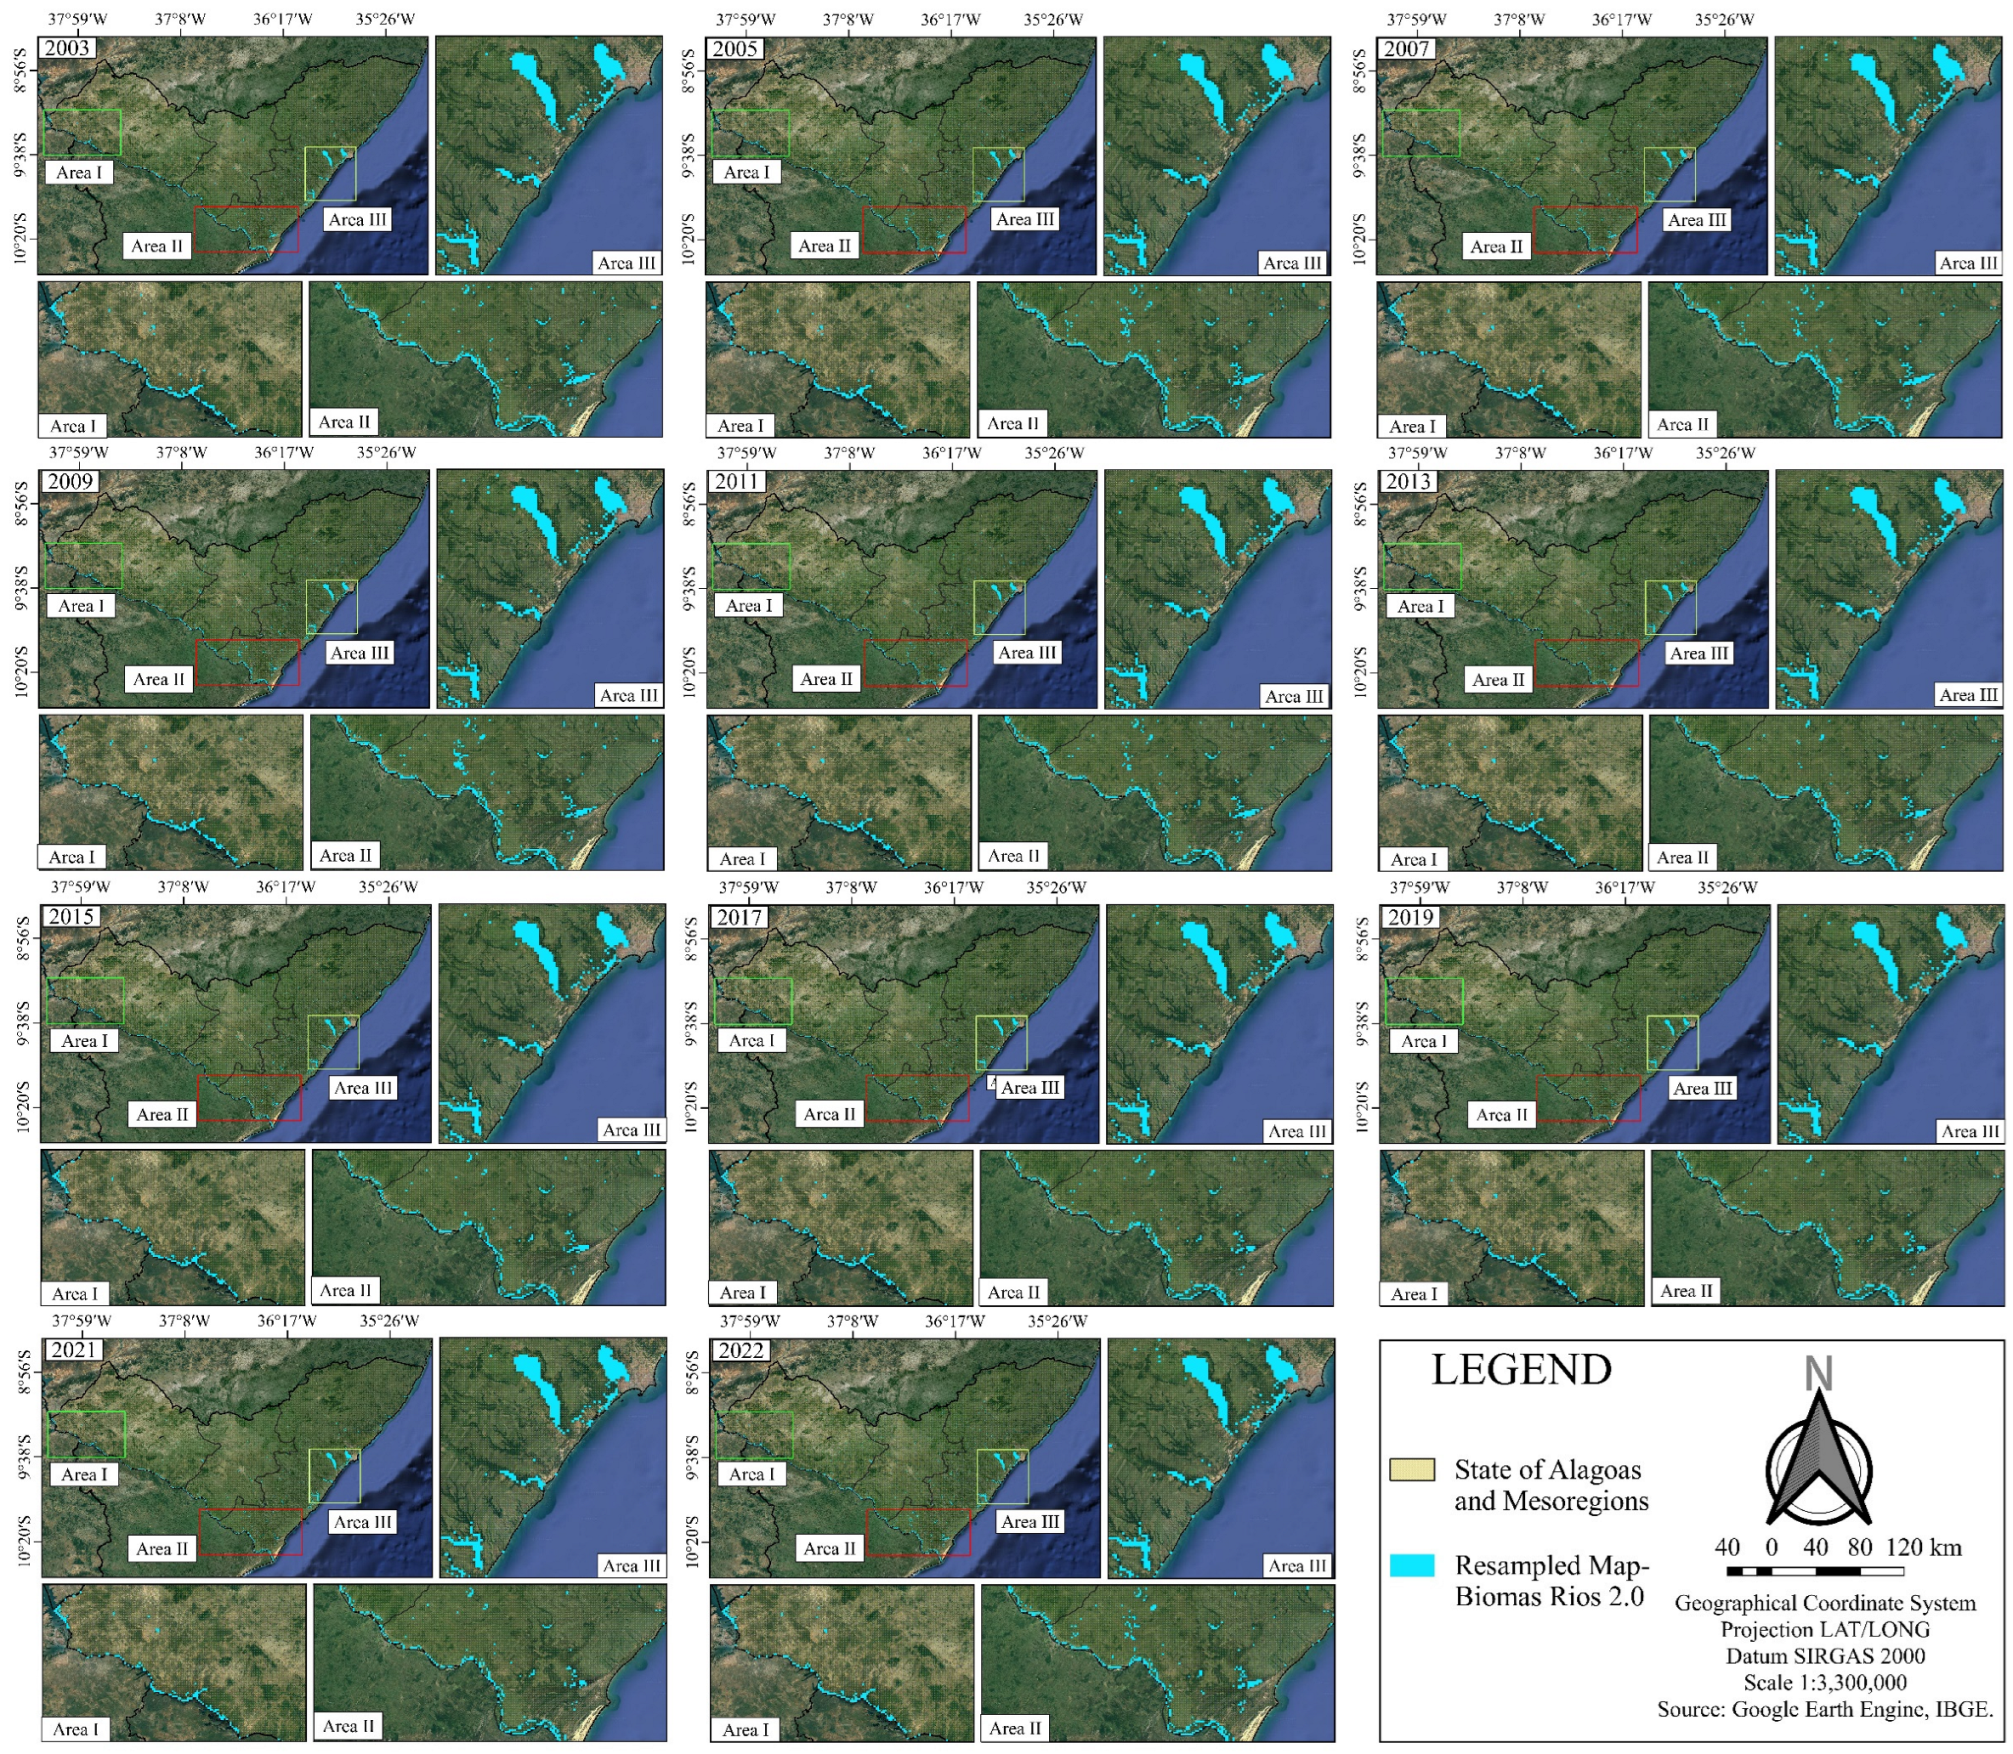
2.6. Classification and Extraction of Water Bodies Using MapBiomas Rios 2.0

The characterization of water bodies was based on the use of products from the MBR 2.0 project, which were processed and classified using Landsat series raster data with a spatial resolution of 30 m [130]. The process relied on machine learning algorithms via the GEE platform and the MapBiomas Project, part of the MapBiomas Brazil [91], an initiative focused on mapping the dynamics of surface water and water bodies across Brazil since 1985, using images from the Landsat 5, 7, and 8 satellites and currently covering the period from 1985 to 2023.
After completing the necessary procedures to obtain the image series on the GEE platform, including selecting libraries, location, area, and sequence of years, the data were stored and made available for download on Google Drive. The classification of MBR rasters, clipping, calculation of water body areas, and development of thematic maps were carried out in QGIS 3.28.8 Firenze.

2.7. Sampling of Water Body Values

After acquiring raster images containing relevant indices through the GEE platform and MapBiomas 2.0 applet (Figure 2), these products were processed and downloaded from the GEE cloud; they were then used to create the maps presented in this article, conducting both quantitative and qualitative analyses. Given the vast number of pixels in each image (where each pixel represents a unit of information), a sampling of these data was performed.
This operation involved applying the raster file areas to a vector layer (shapefile point files), thus facilitating the extraction of information through the use of specialized tools. This approach allowed for sampling of the data (image pixels) in the calculated indices, reducing the number of data points captured from over 39,000 pixels to 998 points, thereby decreasing the number of pixels data points by 97.4%.
The information retrieved by this method allowed for the acquisition of geolocation data and specific index values for each point, which were then organized into a tabular format and exported to data manipulation software such as Excel [131,132]. Using the retrieved values, it was possible to generate graphs and corresponding numerical correlations. These data were extracted and transferred to Excel, enabling a detailed analysis of both numerical and graphical aspects.
Additionally, a unitary classification of the pixel values was performed, recoding them to reflect land use, land cover, and water body classifications consistent with the methodologies applied by MBR 2.0. This process was facilitated by the use of the r.recode tool applied to the raster images. The application of r.report allowed for the quantification of the classified data, expressing the results in square kilometers for each classified category relative to the index (Figure 2).

3. Results and Discussion

Figure 3 shows the annual average of the spatiotemporal distribution of NDWI during the study period. NDWI values range from −1.00 to 1.00; however, for this study, values lower than −0.74 and higher than 0.28 were not observed, indicating moderate levels of turbidity or influence on the mean pixel values in water bodies. According to Yang et al. [70], NDWI is an effective index for water body extraction, capable of enhancing water features and suppressing the response from other targets, such as vegetation and soil.
The area I represented on the NDWI thematic map Figure 3, as well as on the others (MNDWI, AWEInsh, resampled MBR, albedo, Tsup) thematic maps in this paper, partially corresponds to the São Francisco River within the geopolitical division of the state of Alagoas at LAT/LONG coordinates 9.267° S/38.265° W; 9.645° S/37.625° W, near the city of Paulo Afonso and Paulo Afonso Hydroelectric Power Plant at the state of Bahia. Area II is located near the mouth of the São Francisco River in the Atlantic Ocean at LAT/LONG coordinates 10.072° S/37.011° W; 10.449° S/36.157° W, and area III represents the Manguaba, Mundaú, Roteiro lagoons, and the Coruripe River, from right to left and from top to bottom, with LAT/LONG coordinates 9.576° S/36.098° W; 10.022° S/35.676° W, all these water bodies flowing into the Atlantic Ocean.
The NDWI thematic maps highlighted a characteristic of homogenization in agricultural and natural vegetation areas, except for water bodies. Spectral smoothing, particularly in vegetated environments, aims to facilitate the observation of areas with water coverage. This corroborates the findings of Xie et al. [127], which demonstrated that NDWI can have limitations in distinguishing between water bodies and other dark surfaces, such as shadows and urban areas.
The range of values between −0.25 and 1.00 appears in the thematic geospatial maps as areas covered by water bodies, such as lakes, ponds, or rivers, while the largest areas are situated between −1.00 and −0.25. This highlights areas of land use, exposed soil, planting, or native forests in the state of Alagoas. According to Wang et al. [64], positive NDWI values are generally associated with water pixels, while negative values correspond to other types of land cover.
In this study, it is considered that the range of values from −0.25 to 1.00 has the highest reliability for detecting water bodies. However, the range of values from −0.25 to 0.00 may reflect moisture conditions around rivers and reservoirs with respect to the NDWI. This interpretation aligns with the observations of Huang et al. [56], who indicate that NDWI values near the threshold between water and non-water classes may represent wet transition zones adjacent to water bodies.
When analyzing the NDWI maps (Figure 3) and MNDWI maps (Figure 4), it is observed that in the years 2003, 2013, 2015, and 2017—periods marked by moderate to extreme El Niño events [19,120]—the western portion of the state of Alagoas shows distinct values for each index. For the NDWI, values between −0.45 and −0.25 are highlighted, contrasting with the other years, while for the MNDWI, the values from −1.00 to −0.60 are most prominent, indicating low moisture in the western region of the state. Additionally, there are no anomalous values or discontinuities related to moisture levels in this semi-arid region.
According to Yang et al. [70], NDWI may exhibit inconsistencies in detecting water bodies in arid and semi-arid regions during extended drought periods [133], such as those observed during intense El Niño events in Northeast Brazil [119]. In similar scenarios, the drastic reduction in precipitation leads to the disappearance or significant decrease of water levels in intermittent rivers and reservoirs, further complicating the spectral discrimination between water and other targets by NDWI. Martins et al. [117] said since the accuracy of the detection from satellite images depends on several factors, including the type of object being detected and the quality of the satellite image [134].
In contrast, MNDWI demonstrates greater robustness in identifying water features even under adverse conditions, as evidenced by the higher spatial-temporal coherence of index values during El Niño years compared to NDWI [135,136]. This is due to MNDWI’s higher sensitivity to variations in the spectral response of water and its greater ability to suppress the influence of other targets, such as vegetation and exposed soil [62,137].
Souza used the MNDWI to analyze the spatial-temporal variability of water bodies in the São Francisco River transboundary region and showed that the water content in the study area was generally low, with no significant variations over time, but with an increase in the water bodies, mainly due to the construction of a reservoir in the Brazilian semi-arid region [138]. Similarly, Silva applied the MNDWI to assess the distribution and availability of surface water in Northeast Brazil, demonstrating the index’s capability to capture the region’s hydrological response to extreme climate events [27].
The use of the biophysical index AWEI in studies since 2014 has demonstrated its effectiveness in identifying and mapping water bodies in various environmental contexts. Yang et al. [70] utilized the AWEI to map the spatial and temporal distribution of water resources in the Yellow River Basin in China, highlighting the index’s capability to detect variations in the extent and quality of surface water. Xie et al. [127] applied the AWEI to assess water quality across China, demonstrating the index’s robustness in distinguishing between clean and polluted water.
In this study, the application of AWEInsh (Figure 5) in the state of Alagoas revealed distinct spatiotemporal patterns in the distribution of water bodies and wetter zones across the East-West axis, with significant variations in the extent and connectivity of surface water resources over the analyzed period (2003–2022). The thematic maps generated from AWEI enabled a more precise characterization of water-covered areas, highlighting the index’s sensitivity to seasonal and interannual changes in both regional water availability and seasonal humidity throughout the year.
Compared to other spectral indices, such as NDWI and MNDWI, AWEI demonstrated a greater ability to discriminate between water and other targets with similar spectral responses, reducing confusion among land use and land cover classes such as water bodies, exposed soil, and areas with vegetation [67,70,127]. This improvement in mapping accuracy is supported by recent studies highlighting AWEInsh effectiveness in distinguishing water features from other targets, even in complex environmental conditions [137,139,140]. This is likely due to its greater ability to minimize the influence of non-water features, such as exposed soil and vegetation.
The increased accuracy in detecting water bodies provided by AWEInsh is crucial for both research and a better understanding when applying water resource management in Alagoas, especially in the context of growing anthropogenic pressure caused by human activities and climate change [141,142]. Due to the rising anthropogenic pressure from agricultural expansion, deforestation, and urbanization, the negative impacts on water resources are intensified, contributing to the degradation of water bodies, decreased soil moisture [142,143], as well as the depletion of soil physical-chemical properties and water contamination. These land use and land cover changes alter hydrological dynamics, affecting infiltration, surface runoff, and aquifer recharge [144,145].
The use of AWEInsh in conjunction with MNDWI for the spatiotemporal characterization of water bodies in Alagoas facilitates a significant improvement in monitoring and understanding regional water dynamics [144,146]. During the analysis of MNDWI maps (Figure 4) and AWEInsh (Figure 5), it is observed that in the years 2003, 2013, 2015, 2017, and 2019, there was a significant decrease in moisture in the region due to low rainfall, as evidenced by the lower values in the spectral indices.
Figure 6 illustrates the spatiotemporal distribution of surface albedo in the state of Alagoas between 2003 and 2022. Albedo, defined as the proportion of incident solar radiation reflected by a surface [147], ranges from 0.00 to approximately 1.00, with values observed between 0.00 and 0.36 for the study area. The highest values, around 0.36, are found in the white sand dunes of Piaçabuçu, near the mouth of the São Francisco River, corroborating the findings of Dantas [148] and Costa [149].
The lowest albedo values are typically associated with water bodies, wetlands, and wet soils, while the highest albedo values are generally found in dry land or bare soil, as observed in some studies [129,150]. These reduced albedo values in water surfaces and dense vegetation are consistent with previous studies conducted in different regions of Brazil [151,152].
In areas with typical Caatinga vegetation, agriculture, and pastures, albedo values are intermediate, starting at approximately 0.20 (Figure 6). These results align with prior research investigating the spectral behavior of albedo in different types of vegetation and land use in the Brazilian semi-arid region [153].
The albedo value range between 0.25 and 0.30, peaking at 0.30, predominantly highlights non-vegetated areas, urban infrastructure, and desert regions, such as the white sand dunes in Piaçabuçu [47]. This variation in albedo values reflects the heterogeneity of land cover and the influence of factors such as substrate composition, vegetation presence, and surface moisture.
The spectral behavior pattern of albedo revealed a clear distinction between water bodies (at minimum values) and natural vegetation areas, corroborating the geospatial and quantitative data from the MapBiomas Project [51,154]. The trend analysis conducted in this study detected a significant decrease in vegetation and water body areas, consistent with the results obtained from the MNDWI, AWEI, and albedo indices.
In the years 2003, 2013, 2015, 2017, and 2019, images show a reduction in moisture, corroborating the patterns identified by the MNDWI and AWEI indices (Figure 4 and Figure 5). This decrease in moisture can be attributed to various factors, such as prolonged droughts [19] caused by extreme El Niño events, changes in land use and cover [155], and the intensification of anthropogenic activities in the region [156].
Mariano et al. [157] point out that surface albedo plays a significant role in the surface energy balance, being one of the main drivers of the evapotranspiration process in the partitioning of sensible and latent heat fluxes. Over time, a well-defined spectral behavior pattern is also observed over the western region of the State of Alagoas, where there is an increase in albedo values in the area corresponding to the Agreste region in eastern Alagoas (Figure 6).
In the annual quantitative analysis of NDWI, the most critical period concerning the water condition in the State of Alagoas is noted for the years 2020 and 2021. However, when analyzing other indices, differences are observed in the years with the lowest water availability. For MBR 2.0, the most critical year is 2021, while for MNDWI it is 2019, and for AWEInsh it is 2017 (Table 1) [56,137].
The variation in water body detection across different indices can be attributed to differences in sensitivity to drought conditions and the specific characteristics of water bodies during each period [56,137]. The annual data show that for water bodies and potential wet areas, NDWI values range from 200.0 km2 to 319.2 km2, while MNDWI varies from 220.1 km2 to 423.4 km2, and AWEInsh ranges from 330.0 km2 to 432.2 km2. In comparison, the more stable and consistent values from the MapBiomas Rios (MBR) 2.0 dataset range between 304.8 km2 and 400.9 km2, reflecting a more moderate response to temporal and spatial variations in water coverage. This variation in water body detection area between NDWI and MNDWI is consistent with a brief study conducted by Gil et al., 2019 [158].
Regarding the resampled MBR as illustrated in the spatiotemporal distribution shown in Figure 7, values show a high degree of alignment with the original MBR dataset, with values ranging between 303.1 km2 and 398.2 km2. This consistency demonstrates that despite being resampled from 30 m to 500 m resolution, the resampled MBR dataset still provides an accurate representation of water bodies.
The minimal differences between the original and resampled MBR values, typically within a margin of error of 0.5–1.5%, highlight the reliability of this dataset for detecting water body dynamics even at lower spatial resolutions. This proves advantageous in large-scale temporal analyses, where higher-resolution datasets might not always be available or feasible to use due to computational limitations.
The areas covered by water bodies during the most critical years range from 199.99 to 165.48 km2, indicating a significant reduction in the extent of water surfaces compared to other years in the spatiotemporal analysis. This decrease may be associated with various factors, such as prolonged droughts [19], changes in land use and land cover [159,160,161], and increased demand for water resources due to economic activities [156].
On the other hand, the years from 2003 to 2022 stand out for having the largest amounts of water-covered areas, with values of 303.1 and 398.7 km2 (Figure 7). These results suggest a higher availability of surface water during these periods, possibly related to more favorable climatic conditions, such as the occurrence of wetter years [162], and a lower anthropogenic pressure on water resources [163].
It is important to emphasize that, in addition to the differences in the identification of water bodies by spectral indices, the characteristics of the images used also influence the results obtained. The data from the MBR 2.0 project and the MapBiomas 8.0 collection are derived from Landsat satellite images, which have a spatial resolution of 30 m, corresponding to an area of 900 m2 per pixel [164].
On the other hand, images acquired by MODIS sensors onboard the Terra and Aqua satellites have a spatial resolution of 500 m, which equals an area of 250,000 m2 per pixel [76]. This difference in spatial resolution has direct implications for the detection and discrimination of targets.
The pixel, being the basic unit of the image, represents the average reflectance values of the elements present in the corresponding area on the ground [144]. Thus, the lower spatial resolution of MODIS sensors ends up incorporating the spectral response of mixed targets in the landscape, such as riparian vegetation bordering water bodies [67]. This spectral mixing effect can lead to an underestimation of the actual extent of water surfaces, especially in areas with smaller water bodies or dense surrounding vegetation [56].
This inherent limitation of the spatial resolution of MODIS data was evidenced in the results presented in Table 2. When comparing the areas of water bodies mapped by the NDWI and MNDWI indices with the values obtained from MBR 2.0, there is a systematic overestimation by the spectral indices. This discrepancy can be attributed, in part, to the lower spatial resolution of MODIS images, which tend to aggregate the spectral response of water with that of adjacent targets, such as riparian vegetation [56]. It is worth noting that the values of AWEInsh do not follow the same pattern as indices such as MNDWI and NDWI.
Previous studies corroborate these findings, highlighting the influence of spatial resolution on the accuracy of water body mapping. Lima et al. [165] compared the performance of different spectral indices derived from Landsat and MODIS images in detecting reservoirs in the Brazilian semiarid region, observing a consistent underestimation of water areas by MODIS data compared to the results obtained with higher spatial resolution Landsat images.
Analyzing the presented results, it is evident that the water-covered area values mapped by the spectral indices NDWI and MNDWI show significant differences compared to the data quantified by the MBR 2.0 project. This discrepancy is exemplified by the year 2003, where the extent of water bodies detected by MNDWI was 342.43 km2, while MapBiomas indicated an area of 367.12 km2. This overestimation by MNDWI is consistently observed throughout all the analyzed years, due to the different sensors used during the research.
Figure 8 illustrates, in a bar chart, the areas in km2 covered by water bodies, characterized using annual values of hydrophysical indices such as AWEI, NDWI, MNDWI, MBR 2.0, and resampled MBR 2.0.
This may introduce a certain degree of uncertainty in the characterization of water resources, as pixels with lower resolution, used in MODIS images, tend to aggregate the spectral response of different targets, such as water and vegetation, resulting in a possible underestimation of the actual extent of water areas [56]. This spectral mixing effect is particularly relevant in regions with smaller water bodies or significant surrounding vegetation [70].
Previous studies support the influence of spatial resolution on the accuracy of water body mapping. Silva [166], when analyzing the São Francisco and Parnaíba river basins, found absolute differences ranging from 11% to 19% in the extent of water bodies mapped by spectral indices derived from images with distinct resolutions. These results highlight the importance of considering the characteristics and limitations of remote sensing data used in the analysis of regional hydrological dynamics [167].
It is worth noting that, even with high precipitation levels for the state of Alagoas, the spatial distribution of rainfall may not favor the geographic location of rivers, lakes, and reservoirs (Figure 9). Proximity to the Atlantic Ocean plays a significant role in the distribution of precipitation in Alagoas, as moisture from the ocean is transported to the mainland by trade winds, promoting cloud formation and rainfall in coastal and adjacent regions [18,43]. Additionally, the presence of mountainous regions, such as the Sertão Alagoano, also influences the spatial distribution of precipitation due to the orographic effect, where moist air is forced to rise over the topographic barrier, resulting in higher precipitation on the windward slopes and lower precipitation on the leeward slopes [103,110].
This complex interaction between atmospheric systems, sea surface temperature (SST) anomalies, extreme climatic events, and local geographic features, such as proximity to the ocean and topographic composition, results in a heterogeneous distribution of precipitation in the state of Alagoas, which may not directly favor the location of water bodies, especially during periods represented in a typical flow in periods of water scarcity [168]. Recent studies have highlighted the complexity of precipitation distribution in Alagoas and its impacts on water availability. Oliveira-Júnior et al. [169] analyzed wet and dry periods in the state using the Standardized Precipitation Index (SPI) and found a high spatiotemporal variability of rainfall, with occurrences of extreme drought and rainfall events over the past decades. This variability can lead to a significant reduction in annual water quantities in water bodies, especially during prolonged drought periods, as is the case in NEB regions, which are further vulnerable to the pressures of anthropogenic actions [19,109].
Understanding the spatiotemporal variability of water bodies, as demonstrated by the spectral patterns of water indices, is directly conditioned by the high climatic variability in the state of Alagoas, especially when observing the eastern axis of the region (Figure 8). Research conducted in the region shows the interaction between vegetation biomass change patterns and precipitation, such that the absence of rain favors the dynamics of dry vegetation known as Caatinga or Brazilian savanna [170,171] in the western axis.
Figure 10 illustrates the spatiotemporal distribution of Tsup in the state of Alagoas between 2003 and 2022. The spatiotemporal analysis of this biophysical parameter reveals the occurrence of high values, primarily from the eastern to the western part of the state, characterized by the scarcity of water bodies and a semi-arid climate. The behavior of water bodies over time in the semiarid region [27] was analyzed, and water body areas were characterized in the NDWI and MNDWI indices, with pixel values obtained ranging between −0.25 and 1.0 (Figure 3 and Figure 4).
This result demonstrates significant relevance concerning albedo, contributing substantially to the scope of the study by highlighting the relationship between high Tsup and higher reflectance in the albedo spectrum, particularly in semi-arid or desert areas associated with exposed soil during extreme droughts, a common condition in the region [161].
Additionally, it is possible to observe the formation of intense heat islands in certain regions over time, especially during extreme El Niño events [172]. These heat islands and large warm masses, identified by pixels with red hues indicating high temperatures, are noteworthy [156]. Tsup values in the state of Alagoas generally range between 20.0 °C and 40.0 °C, with recorded temperatures up to 43.4 °C during the year 2015 (Figure 8).
The integrated analysis of biophysical parameters such as Tsup shown in Figure 10, and albedo is essential for understanding the patterns of energy exchange processes [173] between the Earth’s surface and the atmosphere, as well as for evaluating the impacts of climate change [174,175] and anthropogenic activities [176].
The microclimate is strongly influenced by the type of surface cover and the rainfall regime. Changes in vegetation cover modify energy distribution patterns, significantly impacting key variables such as temperature and relative humidity [43]. In areas with dense vegetation cover, producing a thermoregulatory effect of the local microclimate. These factors are characterized as ecosystem services provided by total or partial non-suppression of native vegetation cover [177], as clearly observed in Figure 9 in the eastern region of Alagoas.
However, it is important to note that during periods of high precipitation volume associated with La Niña events, milder temperatures are observed [19,119]. This phenomenon can be exemplified by the years 2007, 2011, and 2022, in which accumulated temperatures of 37.8 °C, 38.8 °C, and 35.8 °C were recorded, respectively—values lower than the historical average for the region according to Figure 9 and Table 4.
The relationship between vegetation cover, precipitation regime, and Tsup is supported by recent studies. Yu [178] analyzed the influence of vegetation and precipitation on the variability of surface temperature [179] in northwest China, in which the dynamics related to Tsup are similar to those observed in the Brazilian semi-arid region., highlighting the thermo-hydro-regulatory role associated with vegetation and the moderating effect of rainfall on temperatures. Similarly, ref. [156] emphasized the importance of vegetation cover in moderating temperatures and maintaining moisture in semi-arid regions, especially during periods of water scarcity [168].
Table 3 presents the statistical parameters and temporal variability of the hydro-physical parameters for the state of Alagoas between 2003 and 2022. Analysis of the raster images and the relationship of the hydro-physical indices NDWI, MNDWI, and AWEInsh reveal a space-time behavior pattern of medium variability, with the CV values ranging between 11.69% and 17.78%. These values highlight the influence of climatic and anthropogenic factors on the dynamics of water resources in semi-arid regions.
The statistical analysis of NDWI, MNDWI, and AWEInsh from 2003 to 2022 reveals their effectiveness in detecting and monitoring water bodies under varying climatic conditions. NDWI consistently detects areas with low water coverage with minimal fluctuations, and shows increased sensitivity to water presence during wetter years such as 2007. Its coefficient of variation (CV) decreases over time, highlighting its stability in long-term monitoring.
In general, the average annual values from the space-time analysis stand out, where the Normalized Difference Water Index (NDWI) showed an average variation ranging from −0.511 to −0.551 over time. Negative values of NDWI indicate the presence of dry vegetation or exposed soil, while positive values are associated with water bodies and areas with higher moisture [127]. However, its CV has slightly increased in recent years, likely due to fluctuations in water availability linked to the rainfall regime during series years.
MNDWI exhibits higher sensitivity to both drought and high precipitation, with moderate variability in detecting water bodies, particularly during wetter years such as 2021, obtaining average values ranging from −0.465 to −0.517, demonstrating its higher sensitivity in detecting water features and suppressing background noise, such as built-up areas and exposed soil [61,137]. Meanwhile, its CV has increased slightly in recent years, probably due to fluctuations in water availability linked mainly to the rainfall regime or land use changes too.
AWEInsh, the most variable index, is highly sensitive to interannual changes, with significant fluctuations in water body detection, especially during extreme weather events such as El Niño. Over time, AWEInsh has shown increased stability, with its CV decreasing, reflecting its growing reliability in detecting water bodies despite climatic variability.
The average between the years ranged from −18,440 to −19,658. Due to this scale factor for this biophysical index, it is not possible to directly associate it with the patterns of NDWI and MNDWI (–1.0 to 1.0). Only through the integration of normalized AWEInsh results with other data, such as high-resolution spatial images, precipitation data, and land use and cover information, can a more comprehensive and reliable characterization of the water dynamics in the studied region be achieved [168,180].
In addition to the evidence of space-time behavior patterns with medium to high variability, the highest CV values are situated between 17.72% and 29.95% when compared with Table 2. This significant variability in spatial and temporal distribution of rainfall is a striking feature of the NEB, associated with the influence of atmospheric systems at different scales, SST anomalies, and the occurrence of extreme climatic events such as El Niño and La Niña [19,52,119].
The graph in Figure 11a illustrates a negative correlation between NDVI and the water surface area. The correlation coefficient R = −0.34 indicates a weak negative relationship, suggesting that as the NDVI increases, the water surface area tends to decrease. This is represented by the regression equation y = −477.82x + 515.67, where the slope of the line reflects the inverse relationship. The Root Mean Square Error (RMSE) of 34.39 suggests a moderate dispersion of data points around the regression line. NDVI primarily reflects the health and density of vegetation, where higher NDVI values correspond to more abundant or healthier vegetation. The negative correlation observed suggests that during periods of increased vegetation density (i.e., higher NDVI values), the water surface area decreases, possibly due to reduced precipitation or increased evapotranspiration.
The second graph, Figure 11b, shows a positive correlation between NDWI and the water surface area, with a correlation coefficient of R = 0.41, indicating a low moderate positive relationship between the variables. The regression equation y = 685.58x + 362.51 and RMSE of 33.30 suggest that the data points in this graph are more closely aligned with the regression line compared to the NDVI analysis. NDWI is specifically designed to detect water bodies by enhancing the reflectance of water features while suppressing the influence of vegetation and soil. The positive correlation suggests that higher NDWI values correspond to larger water surface areas, as expected given that NDWI is more sensitive to the presence of water.
Years such as 2015, 2016, 2018, and 2019, which are labeled in red and associated with high-intensity El Niño events, show small water surface areas associated with drought conditions. These results may reflect effective water retention in reservoirs or changes in water management practices that mitigate the reduction of surface water during dry periods. Conversely, the blue-labeled years—2007, 2008, 2010, 2011, and 2022—associated with high-intensity La Niña events show lower scattered NDWI values and larger water surface areas when compared with El Niño events.
The results indicate that both indices are reliable in assessing water body dynamics, as demonstrated by the negative correlation observed in Figure 11a and positive correlation in Figure 11b. While NDVI provides useful information about vegetation cover, it is less directly related to changes in water surface area, with the annual averages more dispersed across the graph, particularly in regions where water bodies and vegetation overlap. In contrast, NDWI is more focused on water body areas.
Table 4 presents information on albedo, Tsup, and summarized rainfall regime data. For Ts, spatial-temporal behavior patterns of low variability were observed, with CV ranging from 6.82% to 11.8%. These low variability values are not only related to the homogeneity of land cover and topographic characteristics of the region [156].
The analysis of albedo, surface temperature (Tsup), and annual total precipitation from 2003 to 2022 provides valuable insights into environmental and climatic dynamics during this period. Albedo shows relatively stable minimum values, ranging from 0.049 (2019) to 0.082 (2022), indicating consistent surface reflectance, possibly due to vegetation or moisture content. Maximum values, from 0.207 (2011) to 0.259 (2003), suggest a slight decrease in reflectance over time, which may reflect increased vegetation cover or reduced bare soil exposure.
Albedo exhibited a pattern of medium variability, with CV values ranging from 11.68% to 19.21%. This variability can be attributed to changes in land use and cover and variations in surface moisture conditions [181]. Mean albedo values remained stable, ranging between 0.162 (2015, 2019) and 0.174 (2017), with decreasing variability as indicated by the coefficient of variation (CV), which dropped from 12.64% (2003) to 9.33% (2022), suggesting greater homogeneity in surface conditions.
This parameter is crucial for understanding the energy balance at the Earth’s surface and is directly related to changes in land use and cover [16,149,182]. Lower albedo values are observed in water bodies [150,183], while higher values are associated with exposed soils without vegetation or desert areas [152].
It is important to note that Tsup is influenced by various factors such as water availability, vegetation, and meteorological conditions, which can present significant variations at local scales [180,184], ultimately demonstrating that the region has a well-defined climate with no extreme annual temperature changes. The minimum values of Tsup remained stable, ranging from 25.05 °C (2005) to 25.96 °C (2009), while maximum values varied significantly, from 35.65 °C (2022) to 43.39 °C (2015), reflecting periods of intense heat or drought, particularly in 2015.
The average temperature fluctuated between 29.79 °C (2007) and 34.36 °C (2015), with lower values corresponding to cooler years and higher values linked to heat waves or reduced cloud cover. Water availability and climatic conditions influence the spatio-temporal variability and temporal trends of biophysical parameters [153], considering that higher average temperatures exceed 43 °C. The standard deviation (SD) decreased over time, from 3.85 °C (2003) to 2.03 °C (2007), showing increased stability.
The coefficient of variation (CV), which dropped from 11.81% (2003) to 6.83% (2007), suggests more consistent surface temperature patterns in recent years. It is notable that Tsup plays a crucial role in energy and mass exchange processes between the Earth’s surface and the atmosphere [185], serving as a valuable indicator of environmental and climatic changes [156,186].
Finally, the average annual rainfall totals ranged from 885.81 mm to 1368.24 mm over the analyzed period. Annual total precipitation exhibited greater variability, with minimum values ranging from 211.7 mm (2011) to 598.7 mm (2022), reflecting increased consistency in rainfall by 2022, likely due to La Niña conditions. Maximum values ranged from 1856.7 mm (2003) to 3093.3 mm (2022), indicating a general trend of higher precipitation in recent years. Mean precipitation followed a similar upward trend, from 905.8 mm (2003) to 1749.4 mm (2022), suggesting intense rainfall events, particularly in 2022.
The SD increased from 301.7 mm (2005) to 581.8 mm (2022), indicating growing variability in rainfall distribution, while the CV values, ranging from 28.00% (2005) to 40.26% (2013), suggest higher variability in precipitation during certain years. This significant variability in precipitation is a notable characteristic of the Brazilian Northeast, associated with the influence of atmospheric systems on different scales, SST anomalies, and the occurrence of extreme climatic events such as El Niño and La Niña [19,52,119].
The results presented in Table 4 highlight the complexity of the space-time dynamics of physical-hydric parameters in Alagoas, emphasizing the need for continuous and integrated monitoring of these parameters to understand the hydrological and climatic processes in the region. The joint analysis of biophysical indices, precipitation data, Tsup, and albedo, combined with remote sensing and geoprocessing techniques, provides a comprehensive assessment of water bodies, supporting sustainable water resource management and adaptation to climate change in semi-arid environments [119,156,187].
Figure 12 presents boxplot graphs for temperature and precipitation over the studied period. The accumulated annual precipitation (Figure 12a) demonstrates good interannual variability, reflecting the nature of rainfall in the region, particularly during years of moderate to extreme El Niño and La Niña events. Outliers present in some years, such as 2003, 2009, 2021, and 2022, indicate extreme precipitation events that are inconsistent with the rest of the data, mainly in the coastal region of the state, as shown in Figure 8, where information from periods of intense rainfall, specifically during La Niña years, was captured.
Surface temperature (Figure 12b) shows significant variation between years, reflecting climate change and the influence of land cover conditions. Outliers identified in the years 2005, 2007, 2011, 2017, and 2019 indicate events related to transitional effects between El Niño and La Niña on the captured temperature throughout the year, factors attributed to heatwaves or abrupt changes in vegetation cover during the respective year. The joint analysis of the precipitation and temperature graphs allows for an assessment of the interaction between climatic variables and their implications for the environmental dynamics of the region. The presence of outliers in both graphs suggests the occurrence of extreme climatic events that affect both precipitation and temperature, potentially impacting water availability and vegetation cover in the state.
The analysis of soil temperature ratios, obtained from MODIS sensor data, and precipitation measured by meteorological stations provides crucial information about the interactions between climatic variables and surface conditions. Some studies have shown that Tsup is strongly influenced by land cover, water availability, and climatic conditions [43,156]. Precipitation, in turn, plays a crucial role in modulating surface temperatures and the dynamics of water bodies. Precipitation data from meteorological stations have been widely used to correlate precipitation events with variations in Tsup, highlighting the importance of rainfall in maintaining soil moisture levels and thermal regulation [19,119].
Figure 12, which presents the soil temperature ratio obtained from MODIS data relative to precipitation measured at meteorological stations, reveals distinct patterns that reflect the complex interaction between water availability, land cover, and climatic variations. The ratio of precipitation to soil temperature is a powerful metric that provides insights into the state of the environment.
The analysis of the relationship between precipitation (rainfall) and soil temperature is crucial for understanding the hydric and thermal dynamics of a region, especially in areas susceptible to climate change and intensive anthropogenic activities, such as the state of Alagoas. Previous studies have highlighted the importance of this relationship for environmental and agricultural management [1,117].
Annual averages of temperature and precipitation were calculated for each year from 2003 to 2022, revealing significant variability in both parameters. Years with higher precipitation often corresponded to lower soil temperatures and vice versa, showing a moderate negative correlation between precipitation and soil temperature. This indicates that years with higher precipitation tend to have lower soil temperatures. This effect can be explained by the cooling from increased evapotranspiration and greater cloud cover during rainy periods [117,120].
The scatter plots in Figure 13 depict the negative correlation between annual precipitation (mm) and average soil temperature (°C) over the years 2003 to 2022. A consistent inverse relationship is observed throughout the period, where rising soil temperatures are associated with reduced annual precipitation. This relationship is quantified by the correlation coefficients (R) and regression equations in each plot, showing varying strengths of correlation across the years.
In 2003 and 2005, the correlations were moderately strong (R = −0.73 and −0.59, respectively), indicating a clear inverse relationship between soil temperature and precipitation. 2007 showed the weakest correlation (R = −0.49), suggesting that other climatic factors may have influenced precipitation patterns that year. By 2009 and 2011, stronger negative correlations (R = −0.72 and −0.57) were re-established, with sharper declines in precipitation as soil temperature increased.
Notably, 2015 exhibited the strongest correlation (R = −0.79), with 63% of the variation in precipitation explained by soil temperature, highlighting severe drought conditions likely driven by high soil temperatures. In 2017 and 2019, moderate correlations (R = −0.61 and −0.72) persisted, again reflecting the strong influence of soil temperature on precipitation levels. In 2021 and 2022, the correlations remained significant (R = −0.71 and −0.66), with 2022 displaying the steepest regression slope (Y = −182.61X + 7237.98), indicating that higher soil temperatures had an even greater impact on reducing precipitation.
The analysis confirms the interdependence between precipitation and soil temperature in Alagoas. Variations in precipitation, influenced by extreme climate events, directly impact soil temperatures. Furthermore, Table 3 and Table 4 complement the analysis by presenting the surface temperature and total precipitation data observed in the study area. Both soil temperature and rainfall data are crucial for understanding the processes of energy and mass exchange between the Earth’s surface and the atmosphere, influenced by factors such as land cover, water availability, and prevailing climatic conditions. This reaffirms findings from other studies, where the eastern part of Alagoas is classified as tropical Aw and the western part of the state exhibits high temperatures and low humidity (Bsh).

4. Conclusions

The state of Alagoas has experienced significant changes in its water bodies over the past two decades (2003–2022), driven by climate change and anthropogenic activities. The analysis of hydrological indices—NDWI, MNDWI, and AWEInsh—demonstrates their effectiveness in detecting and monitoring water bodies, despite some limitations. NDWI tends to underestimate the extent of water bodies and presented the smallest detected areas among all indices, ranging from 162.5 km2 (2020) to 319.2 km2 (2004).
This suggests that NDWI is less sensitive in detecting water bodies, particularly during low precipitation years. The lowest values were recorded between 2015 and 2021, years marked by severe droughts that reduced the extent of water bodies and, consequently, the available water volume, while MNDWI also underestimates, but to a lesser extent, with somewhat variation, and values ranging from 220.1 km2 (2019) to 423.4 km2 (2004), demonstrating that this index is highly sensitive to climatic conditions. In years of high precipitation, such as 2004 and 2007, MNDWI detected larger water body areas, while during drought years such as 2015 and 2017, it showed significantly reduced areas.
AWEInsh, despite its higher variability and overestimation, is particularly effective in capturing extreme seasonal and interannual changes in water bodies, making it a robust tool for analyzing dynamic water body variations, especially in regions prone to both drought and heavy rainfall. Together, these indices provide a comprehensive understanding of water body dynamics in Alagoas, particularly under the influence of climatic events such as El Niño and La Niña.
AWEInsh displayed the greatest variation, with areas ranging from 330.0 km2 (2017) to 432.2 km2 (2007), indicating its sensitivity to seasonal and interannual variations in water bodies. Despite this, AWEInsh remains effective in detecting water bodies even during drought periods, making it a robust tool for temporal analysis of water dynamics.
The comparison of average values, standard deviations, and coefficients of variation reveals greater variability in MNDWI, followed by AWEInsh and NDWI. Each index shows distinct strengths in water body detection over the study period. NDWI proves to be the most stable, though moderately reliable, due to its underestimation, exhibiting lower variability, and performing well in long-term water body monitoring. MNDWI balances the detection of small water bodies and reflects seasonal changes, although its sensitivity to climatic variability can fluctuate in certain years.
The original and resampled MBR data exhibited consistent values over the years, with minimal variations. Water body areas ranged from a maximum of 400.9 km2 (2007) to a minimum of 304.8 km2 (2021) for the original MBR, while the resampled MBR ranged from 398.2 km2 (2007) to 303.1 km2 (2021).
This consistency underscores the robustness of the MBR, even after data reprocessing. The lowest values for MBR occurred between 2012 and 2015, possibly due to intense droughts influenced by events such as El Niño. The resampled MBR data maintains the spatial-temporal coherence of water body dynamics, making it a robust choice for long-term monitoring, especially when combined with indices such as AWEInsh or MNDWI, which capture more extreme variations during dry and wet periods.
Fluctuations in albedo were consistent with decreased precipitation and increased temperatures, reflecting changes in vegetation cover and soil moisture. Surface temperature analysis conducted through MODIS products revealed significant variations exclusively correlated with extreme El Niño and La Niña events, showing warming during drier periods and cooler, wetter conditions during higher precipitation years.
The negative correlation between albedo and precipitation, along with increased Tsup during drought periods, confirms the interdependence of these variables. While albedo remained stable, reflecting consistent surface conditions, Tsup exhibited fluctuations tied to extreme climatic events. Precipitation, however, showed significant variability, with an increasing trend in recent years due to changes in the climatic cycle, highlighting the region’s susceptibility to climate change and extreme weather patterns (ENSO).
The analysis of annual precipitation versus average soil temperature from 2003 to 2022 reveals a consistent inverse relationship, with higher soil temperatures contributing to reduced precipitation levels. The strongest correlations occurred in drought years, such as 2015, emphasizing the critical role of soil temperature in determining precipitation patterns. Monitoring soil temperature alongside precipitation will be vital for understanding and predicting future water availability, especially as climate change continues to alter these dynamics.
Finally, the analysis of the correlation between water surface area and NDVI, compared to NDWI, shows that NDVI is not as strongly correlated with water surface area as NDWI. This is expected, as NDVI primarily focuses on vegetation density and health, while NDWI is specifically designed to detect water bodies. The graph illustrating the relationship between NDWI and water surface area indicates that NDWI is a more reliable index for monitoring water bodies over time, especially in semi-arid or drought-prone regions, where water availability is highly variable.
The variability observed in water surface area over the years also highlights the influence of El Niño and La Niña events, with El Niño typically reducing water surface areas and La Niña increasing water availability. However, local factors such as land use changes and water management practices may influence this general pattern.
Despite the limitations of MODIS data—low spatial resolution but high temporal resolution and broad spatial coverage—these data provide valuable information for the sustainable management of water resources in Alagoas. The fluctuations observed from 2003 to 2022 reflect the climatic and anthropogenic dynamics that directly influence water availability. The study reaffirms the importance of using biophysical indices, hydrological indices, and remote sensing data to understand and manage water resources, providing a solid foundation for the development of public policies aimed at water sustainability in the state of Alagoas.

Author Contributions

Conceptualization, C.H.S., A.B.d.N., J.L.B.d.S. and M.V.d.S.; methodology, C.H.S., J.A.d.F., J.F.d.O.-J., J.L.B.d.S. and A.B.d.N.; software, C.H.S., F.B.d.S.J. and J.L.P.d.S.; validation, C.H.S., H.F.E.d.O. and A.B.d.N.; formal analysis, C.H.S., G.d.N.A.J., A.C.d.S.A., H.F.E.d.O. and M.V.d.S.; investigation, C.H.S., A.B.d.N., I.T. and M.V.d.S.; resources, C.H.S., H.F.E.d.O. and M.V.d.S.; data curation, C.H.S. and M.V.d.S.; writing—original draft preparation, C.H.S., J.F.d.O.-J., G.d.N.A.J., A.C.d.S.A., T.G.F.d.S., J.P.A.d.S.S., M.V.d.S., F.M.J., A.S.d.D. and I.T.; writing—review and editing, C.H.S., A.B.d.N., G.d.N.A.J., A.C.d.S.A., T.G.F.d.S., J.L.P.d.S., F.B.d.S.J., J.A.d.F., J.P.A.d.S.S., F.M.J., A.S.d.D., I.T., J.F.d.O.-J., J.L.B.d.S., H.F.E.d.O. and M.V.d.S.; visualization, C.H.S., A.B.d.N., G.d.N.A.J., T.G.F.d.S., J.L.P.d.S., A.C.d.S.A., F.B.d.S.J., J.A.d.F., J.P.A.d.S.S., J.F.d.O.-J., J.L.B.d.S., F.M.J. and M.V.d.S.; supervision, G.d.N.A.J., A.C.d.S.A., T.G.F.d.S. and M.V.d.S.; project administration, G.d.N.A.J., A.C.d.S.A., T.G.F.d.S. and M.V.d.S. All authors have read and agreed to the published version of the manuscript.

Funding

This research did not receive direct funding. However, the authors were supported by postgraduate scholarships.

Data Availability Statement

The code used in the GEE data acquisition within the original study described in this paper is available at https://drive.google.com/file/d/1rBYNhX7ZB6DlNHiNNYzl7rm3RBgX9v3-/view?usp=sharing (accessed on 10 September 2024), under the CC BY license. The original contributions presented in the study are included in the article, further inquiries can be directed to the corresponding author(s).

Acknowledgments

We acknowledge the Programa de Pós-Graduação em Agronomia (PPGA) and the Laboratório de Irrigação e Agrometeorologia (LIA) of the Universidade Federal de Alagoas (UFAL) for supporting the development of this research; the Coordenação de Aperfeiçoamento de Pessoal de Nível Superior (CAPES-Finance Code 001); and the PDPG Strategic Partnerships in the States III program for funding the Postdoctoral fellowship.

Conflicts of Interest

The authors declare no conflicts of interest.

Abbreviations

ANANational Water and Basic Sanitation Agency
APACPernambuco Agency for Water and Climate
AWEIAutomated Water Extraction Index
CEMADEMNational Center for Monitoring and Early Warning of Natural Disasters
CVCoefficient of Variation
EMATERInstitute for Innovation in Sustainable Rural Development of Alagoas
ENEBEastern Northeast of Brazil
ENSOEl Niño-Southern Oscillation
GEEGoogle Earth Engine
IBGEBrazilian Institute of Geography and Statistics
IDE Integrated Development Environment
INMETNational Institute of Meteorology
MBRMapBiomas Rios
MNDWIModified Normalized Difference Water Index
NDMINormalized Difference Moisture Index
NDWINormalized Difference Water Index
NEBNortheast Brazil
QGISQuantum Geographic Information System
SFRBSão Francisco River Basin
SHPShapefile
SPIStandardized Precipitation Index
SRTMShuttle Radar Topography Mission
SSTSea Surface Temperature
TsupSurface Temperature
WRIWater Ratio Index

References

  1. Grill, G.; Lehner, B.; Thieme, M.; Geenen, B.; Tickner, D.; Antonelli, F.; Babu, S.; Borrelli, P.; Cheng, L.; Crochetiere, H.; et al. Mapping the World’s Free-Flowing Rivers. Nature 2019, 569, 215–221. [Google Scholar] [CrossRef]
  2. Diop, M.; Chirinda, N.; Beniaich, A.; El Gharous, M.; El Mejahed, K. Soil and Water Conservation in Africa: State of Play and Potential Role in Tackling Soil Degradation and Building Soil Health in Agricultural Lands. Sustainability 2022, 14, 13425. [Google Scholar] [CrossRef]
  3. Boudhar, A.; Boudhar, S.; Oudgou, M.; Ibourk, A. Assessment of Virtual Water Flows in Morocco’s Foreign Trade of Crop Products. Resources 2023, 12, 49. [Google Scholar] [CrossRef]
  4. Nlend, B.; Huneau, F.; Ngo Boum-Nkot, S.; Song, F.; Komba, D.; Gwodog, B.; Meyoupe, P.; Djieugoue, B.; Fongoh, E. Review of Isotope Hydrology Investigations on Aquifers of Cameroon (Central Africa): What Information for the Sustainable Management of Groundwater Resources? Water 2023, 15, 4056. [Google Scholar] [CrossRef]
  5. Fan, J.; Wei, S.; Liu, G.; Zhou, X.; Li, Y.; Wu, C.; Xu, F. Response Time of Vegetation to Drought in Weihe River Basin, China. Atmosphere 2023, 14, 938. [Google Scholar] [CrossRef]
  6. Zhou, H.; Zhang, L.; Liu, X.; Liang, D.; Zhu, Q.; Gou, Y.; Zhou, H.; Zhang, L.; Liu, X.; Liang, D.; et al. Study of the Relationship between High Mountain Asia Snow Cover and Drought and Flood in the Yangtze River Basin during 1980–2019. Remote Sens. 2022, 14, 3588. [Google Scholar] [CrossRef]
  7. Megdal, S.B.; Dillon, P.; Seasholes, K. Water Banks: Using Managed Aquifer Recharge to Meet Water Policy Objectives. Water 2014, 6, 1500–1514. [Google Scholar] [CrossRef]
  8. Tangdamrongsub, N.; Han, S.C.; Tian, S.; Schmied, H.M.; Sutanudjaja, E.H.; Ran, J.; Feng, W. Evaluation of Groundwater Storage Variations Estimated from GRACE Data Assimilation and State-of-the-Art Land Surface Models in Australia and the North China Plain. Remote Sens. 2018, 10, 483. [Google Scholar] [CrossRef]
  9. Deribe, M.M.; Melesse, A.M.; Kidanewold, B.B.; Dinar, S.; Anderson, E.P. Assessing International Transboundary Water Management Practices to Extract Contextual Lessons for the Nile River Basin. Water 2024, 16, 1960. [Google Scholar] [CrossRef]
  10. He, J.; Li, Q.M.; Wang, W.C.; Xu, D.M.; Wan, Y.R. The Diurnal Variation Characteristics of Latent Heat Flux under Different Underlying Surfaces and Analysis of Its Drivers in the Middle Reaches of the Heihe River. Water 2022, 14, 3514. [Google Scholar] [CrossRef]
  11. Qi, S.; He, M.; Bai, Z.; Ding, Z.; Sandhu, P.; Chung, F.; Namadi, P.; Zhou, Y.; Hoang, R.; Tom, B.; et al. Novel Salinity Modeling Using Deep Learning for the Sacramento—San Joaquin Delta of California. Water 2022, 14, 3628. [Google Scholar] [CrossRef]
  12. Robinson, G.M.; Song, B. Managing Water for Environmental Provision and Horticultural Production in South Australia’s Riverland. Sustainability 2023, 15, 11546. [Google Scholar] [CrossRef]
  13. de Brito, P.L.C.; de Azevedo, J.P.S. Economic Value of Water for Irrigation in São Francisco River Basin, Brazil. Appl. Water Sci. 2022, 12, 155. [Google Scholar] [CrossRef]
  14. Agência Nacional de Águas—Conjuntura Dos Recursos Hídricos—Sistema Nacional de Informações Sobre Recursos Hídricos. Available online: https://www.snirh.gov.br/portal/centrais-de-conteudos/conjuntura-dos-recursos-hidricos (accessed on 12 September 2024).
  15. Agência Nacional de Águas (ANA) Atlas Irrigação 2017: Uso Da Água Na Agricultura Irrigada (1a Edição). Available online: https://metadados.snirh.gov.br/geonetwork/srv/api/records/c639ac44-8151-421d-a1ed-c333392d76a9 (accessed on 10 September 2024).
  16. Fernandes, M.M.; Fernandes, M.R.d.M.; Garcia, J.R.; Matricardi, E.A.T.; Lima, A.H.d.S.; Filho, R.N.d.A.; Filho, R.R.G.; Piscoya, V.C.; Piscoya, T.O.F.; Filho, M.C. Land Use and Land Cover Changes and Carbon Stock Valuation in the São Francisco River Basin, Brazil. Environ. Chall. 2021, 5, 100247. [Google Scholar] [CrossRef]
  17. Teixeira, A.H.d.C.; Takemura, C.M.; Leivas, J.F.; Pacheco, E.P.; Bayma-Silva, G.; Garçon, E.A.M. Water Productivity Monitoring by Using Geotechnological Tools in Contrasting Social and Environmental Conditions: Applications in the São Francisco River Basin, Brazil. Remote Sens. Appl. 2020, 18, 100296. [Google Scholar] [CrossRef]
  18. Lyra, G.B.; Oliveira-Júnior, J.F.; Zeri, M. Cluster Analysis Applied to the Spatial and Temporal Variability of Monthly Rainfall in Alagoas State, Northeast of Brazil. Int. J. Climatol. 2014, 34, 3546–3558. [Google Scholar] [CrossRef]
  19. Marengo Orsini, J.A.; Alves, L.M.; Alvala, R.C.S.; Cunha, A.P.; Brito, S.; Moraes, O.L.L. Climatic Characteristics of the 2010–2016 Drought in the Semiarid Northeast Brazil Region. Acad. Bras. Ciênc. 2018, 90, 1973–1985. [Google Scholar] [CrossRef]
  20. Masih, I.; Maskey, S.; Mussá, F.E.F.; Trambauer, P. A Review of Droughts on the African Continent: A Geospatial and Long-Term Perspective. Hydrol. Earth Syst. Sci. 2014, 18, 3635–3649. [Google Scholar] [CrossRef]
  21. Abreu, V.; Coralli, A.; Proença, L.; Santos, A. Uso Da áGua NA Agricultura Irrigada (1A Edição).Avaliação Do Ciclo de Vida Como Ferramenta Para Medir a Eficiência Ambiental Do Hidrogênio Renovável. Impact Proj. 2023, 2, 105–122. [Google Scholar] [CrossRef]
  22. Barbosa, H.A. Flash Drought and Its Characteristics in Northeastern South America during 2004–2022 Using Satellite-Based Products. Atmosphere 2023, 14, 1629. [Google Scholar] [CrossRef]
  23. Barbosa, H.A. Understanding the Rapid Increase in Drought Stress and Its Connections with Climate Desertification since the Early 1990s over the Brazilian Semi-Arid Region. J. Arid Environ. 2024, 222, 105142. [Google Scholar] [CrossRef]
  24. Filho, W.L.F.C.; dos Santos, T.V.; Diogo, A.M.; de Amorim, R.F.C. de Diagnóstico Da Precipitação e EVI Em Dois Eventos de Seca No Nordeste Do Brasil. J. Dep. Geogr. 2018, 35, 102–112. [Google Scholar] [CrossRef]
  25. Júnior, J.F.d.O.; Lyra, G.B.; Góis, G.; Brito, T.T.; de Moura, N.d.S.H. Análise de Homogeneidade de Séries Pluviométricas Para Determinação Do Índice de Seca IPP No Estado de Alagoas. Floresta Ambiente 2012, 19, 101–112. [Google Scholar] [CrossRef]
  26. Lyra, G.B.; Oliveira-Júnior, J.F.; Gois, G.; Cunha-Zeri, G.; Zeri, M. Rainfall Variability over Alagoas under the Influences of SST Anomalies. Meteorol. Atmos. Phys. 2017, 129, 157–171. [Google Scholar] [CrossRef]
  27. da Silva, J.L.B.; Moura, G.B.d.A.; da Silva, M.V.; de Oliveira-Júnior, J.F.; Jardim, A.M.d.R.F.; Refati, D.C.; Lima, R.d.C.C.; de Carvalho, A.A.; Ferreira, M.B.; de Brito, J.I.B.; et al. Environmental Degradation of Vegetation Cover and Water Bodies in the Semiarid Region of the Brazilian Northeast via Cloud Geoprocessing Techniques Applied to Orbital Data. J. S. Am. Earth Sci. 2023, 121, 104164. [Google Scholar] [CrossRef]
  28. Delazeri, L.M.M.; Da Cunha, D.A.; Oliveira, L.R. Climate Change and Rural–Urban Migration in the Brazilian Northeast Region. GeoJournal 2022, 87, 2159–2179. [Google Scholar] [CrossRef]
  29. Rebelo, A.J.; Holden, P.B.; Esler, K.; New, M.G. Benefits of Water-Related Ecological Infrastructure Investments to Support Sustainable Land-Use: A Review of Evidence from Critically Water-Stressed Catchments in South Africa. R. Soc. Open Sci. 2021, 8, 201402. [Google Scholar] [CrossRef]
  30. Santos, E.; Carvalho, M.; Martins, S. Sustainable Water Management: Understanding the Socioeconomic and Cultural Dimensions. Sustainability 2023, 15, 13074. [Google Scholar] [CrossRef]
  31. Chavez, P.S. Image-Based Atmospheric Corrections Revisited and Improved. Photogramm. Eng. Remote Sens. 1996, 62, 1025–1036. [Google Scholar]
  32. Hope, A.; Coulter, L.; Stow, D.; Service, D.; Schutte, T.; Redlin, S.; Peterson, S.; Lowenfish, M.; Kaiser, J.; Walters, A. Irrigated Vegetation Assessment in Urban Environments: A Project of the NASA Affiliated Research Center at SDSU, AgriCast Incorporated Partnership. Photogramm. Eng. Remote Sens. 2003, 69, 381–390. [Google Scholar]
  33. de Medeiros, E.S.; Oliveira, W.D.S.; da Silva, P.V.; de Souza, A.; Bicalho, C.C.; Mauad, M.; de Souza, S.A. Mapping Rainfall Variability in the São Francisco River Basin: Insights for Water Resource Management. Rev. Bras. Meteorol. 2024, 39, e39240050. [Google Scholar] [CrossRef]
  34. da Silva, J.L.P.; da Silva Junior, F.B.; de Souza Santos, J.P.A.; dos Santos Almeida, A.C.; da Silva, T.G.F.; Oliveira-Júnior, J.F.d.; Araújo Júnior, G.d.N.; Scheibel, C.H.; da Silva, J.L.B.; de Lima, J.L.M.P.; et al. Semi-Arid to Arid Scenario Shift: Is the Cabrobó Desertification Nucleus Becoming Arid? Remote Sens. 2024, 16, 2834. [Google Scholar] [CrossRef]
  35. Crispim, D.L.; Pimentel Da Silva, G.D.; Fernandes, L.L. Rural Water Sustainability Index (RWSI): An Innovative Multicriteria and Participative Approach for Rural Communities. Impact Assess. Proj. Apprais. 2021, 39, 320–334. [Google Scholar] [CrossRef]
  36. Alsaeed, B.S.; Hunt, D.V.L.; Sharifi, S. A Sustainable Water Resources Management Assessment Framework (SWRM-AF) for Arid and Semi-Arid Regions—Part 1: Developing the Conceptual Framework. Sustainability 2024, 16, 2634. [Google Scholar] [CrossRef]
  37. Moura, M.S.B.; Galvincio, J.D.; Brito, L.T.L.; Souza, L.S.B.; Sá, I.I.S.; Silva, T.G.F. Clima e Água de Chuva No Semi-Árido; Embrapa Semi-Árido: Petrolina, Brazil, 2007. [Google Scholar]
  38. Silva, J.d.S.; Júnior, J.B.C.; Rodrigues, D.T.; Silva, F.D.d.S. Climatology and Significant Trends in Air Temperature in Alagoas, Northeast Brazil. Theor. Appl. Climatol. 2023, 151, 1805–1824. [Google Scholar] [CrossRef]
  39. Ferreira, T.R.; Maguire, M.S.; da Silva, B.B.; Neale, C.M.U.; Serrão, E.A.O.; Ferreira, J.D.; de Moura, M.S.B.; dos Santos, C.A.C.; Silva, M.T.; Rodrigues, L.N.; et al. Assessment of Water Demands for Irrigation Using Energy Balance and Satellite Data Fusion Models in Cloud Computing: A Study in the Brazilian Semiarid Region. Agric. Water Manag. 2023, 281, 108260. [Google Scholar] [CrossRef]
  40. Sousa, T.R.; Schietti, J.; de Souza, F.C.; Esquivel-Muelbert, A.; Ribeiro, I.O.; Emílio, T.; Pequeno, P.A.C.L.; Phillips, O.; Costa, F.R.C. Palms and Trees Resist Extreme Drought in Amazon Forests with Shallow Water Tables. J. Ecol. 2020, 108, 2070–2082. [Google Scholar] [CrossRef]
  41. Ferreira, J.J.M.; Fernandes, C.I.; Ferreira, F.A.F. Technology Transfer, Climate Change Mitigation, and Environmental Patent Impact on Sustainability and Economic Growth: A Comparison of European Countries. Technol. Forecast. Soc. Change 2020, 150, 119770. [Google Scholar] [CrossRef]
  42. Júnior, P.F.; de Sousa, M.L.; Vitorino, I.; de Oliveira Ponte de Souza, P.J. Estimativa Da Evapotranspiração Da Soja via Sensoriamento Remoto No Leste Do Pará: Uma Avaliação Quantitativa. In Proceeding of the XV Brazilian Symposium on Remote Sensing—SBSR, Curitiba, PR, Brazil, 30 April–5 May 2011; INPE: São Paulo, Brazil, 2011. [Google Scholar]
  43. Dos Santos, S.R.Q.; Cunha, A.P.M.d.A.; Ribeiro-Neto, G.G. Avaliação de Dados de Precipitação Para O Monitoramento Do Padrão Espaço-Temporal Da Seca No Nordeste Do Brasil. Rev. Bras. Climatol. 2019, 25, 80–100. [Google Scholar] [CrossRef]
  44. Lima, B.P.; Mamede, G.L.; Lima Neto, I.E. Monitoring and Modeling of Water Quality in a Semiarid Watershed. Eng. Sanit. Ambient. 2018, 23, 125–135. [Google Scholar] [CrossRef]
  45. de Almeida, H.A.; Aguiar, D.B.; Silva, J.N.; Damaseceno, J. Indicadores Hídricos Do Núcleo de Desertificação Da Microrregião Do Seridó Ocidental Da Paraíba (Water Indicators of Desertification Nucleus in the Seridó Microregion of Paraíba State). Rev. Bras. Geogr. Física 2015, 7, 784–797. [Google Scholar] [CrossRef]
  46. Carvalho, W.d.S.; Filho, F.J.C.M.; dos Santos, T.L. Uso E Cobertura Do Solo Utilizando a Plataforma Google Earth Engine (Gee): Estudo de Caso Em Uma Unidade de Conservação/Land Use and Land Cover Using the Google Earth Engine Platform (Gee): Case Study in a Conservation Unit. Braz. J. Dev. 2021, 7, 15280–15300. [Google Scholar] [CrossRef]
  47. Costa, M.D.S.; De Oliveira-Júnior, J.F.; Dos Santos, P.J.; Correia Filho, W.L.F.; De Gois, G.; Blanco, C.J.C.; Teodoro, P.E.; da Silva, C.A., Jr.; Santiago, D.D.B.; Souza, E.D.O.; et al. Rainfall extremes and drought in Northeast Brazil and its relationship with El Niño–Southern Oscillation. Int. J. Climatol. 2021, 41, E2111–E2135. [Google Scholar] [CrossRef]
  48. Nascimento, A.; Araújo, K.; Dias-Silva, K. Variação Espaço-Temporal E Correlatos Das Variáveis Limnológicas Do Rio Xingu a Montante Da Usina Hidrelétrica de Belo Monte, Altamira-Pa. Encicl. Biosf. 2021, 18, 353. [Google Scholar] [CrossRef]
  49. Carvalho, A.T.F. Reflexões Sobre a Hidrogeomorfologia Dos Rios Intermitentes Frente Às Definições Das Áreas de Preservação Permanente de Cursos d’água No Brasil. Geogr. Atos 2020, 4, 135–150. [Google Scholar] [CrossRef]
  50. Günther, W.M.R.; Ciccotti, L.; Rodrigues, A.C. Desastres: Múltiplas Abordagens e Desafios; Elsevier: Rio de Janeiro, Brazil, 2017. [Google Scholar]
  51. View of Preliminary Study of GPM-IMERG Data to Analyze Rainfall Variability in the State of Alagoas—Brazil. Available online: https://periodicos.ufpe.br/revistas/index.php/jhrs/article/view/260549/45257 (accessed on 10 September 2024).
  52. de Oliveira-Júnior, J.F.; de Gois, G.; Silva, I.J.d.L.; Souza, E.d.O.; Jardim, A.M.d.R.F.; da Silva, M.V.; Shah, M.; Jamjareegulgarn, P. Wet and Dry Periods in the State of Alagoas (Northeast Brazil) via Standardized Precipitation Index. J. Atmos. Sol. Terr. Phys. 2021, 224, 105746. [Google Scholar] [CrossRef]
  53. Ponzoni, F.J.; Shimabukuro, Y.E.; Kuplich, T.M. Textbook of Sensoriamento Remoto Aplicado ao Estudo da Vegetação; Oficina de Textos: São Paulo, SP, Brasil, 2012; pp. 101–102. [Google Scholar]
  54. Kaplan, G.; Avdan, U. Monthly Analysis of Wetlands Dynamics Using Remote Sensing Data. ISPRS Int. J. Geoinf. 2018, 7, 411. [Google Scholar] [CrossRef]
  55. Rahaman, H.; Roshani; Masroor; Sajjad, H. Integrating Remote Sensing Derived Indices and Machine Learning Algorithms for Precise Extraction of Small Surface Water Bodies in the Lower Thoubal River Watershed, India. J. Clean. Prod. 2023, 422, 138563. [Google Scholar] [CrossRef]
  56. Huang, X.; Wang, C.; Li, Z. A near Real-Time Flood-Mapping Approach by Integrating Social Media and Post-Event Satellite Imagery. Ann. GIS 2018, 24, 113–123. [Google Scholar] [CrossRef]
  57. Saprathet, T.; Losiri, C.; Sitthi, A.; Laonamsai, J. Monitoring of Morphological Change in Lam Phachi River Using Geo-Informatics System. In Applied Geography and Geoinformatics for Sustainable Development; Springer: Berlin/Heidelberg, Germany, 2023; pp. 51–64. [Google Scholar] [CrossRef]
  58. Laonamsai, J.; Julphunthong, P.; Saprathet, T.; Kimmany, B.; Ganchanasuragit, T.; Chomcheawchan, P.; Tomun, N. Utilizing NDWI, MNDWI, SAVI, WRI, and AWEI for Estimating Erosion and Deposition in Ping River in Thailand. Hydrology 2023, 10, 70. [Google Scholar] [CrossRef]
  59. Gao, B.-C. NDWI—A Normalized Difference Water Index for Remote Sensing of Vegetation Liquid Water from Space. Remote Sens. Environ. 1996, 58, 257–266. [Google Scholar] [CrossRef]
  60. McFEETERS, S.K. The Use of the Normalized Difference Water Index (NDWI) in the Delineation of Open Water Features. Int. J. Remote Sens. 1996, 17, 1425–1432. [Google Scholar] [CrossRef]
  61. Xu, H. Modification of Normalised Difference Water Index (NDWI) to Enhance Open Water Features in Remotely Sensed Imagery. Int. J. Remote Sens. 2006, 27, 3025–3033. [Google Scholar] [CrossRef]
  62. Ji, L.; Zhang, L.; Wylie, B. Analysis of Dynamic Thresholds for the Normalized Difference Water Index. Photogramm. Eng. Remote Sens. 2009, 75, 1307–1317. [Google Scholar] [CrossRef]
  63. Moghaddam, M.H.R.; Sedighi, A.; Fayyazi, M.A. Applying MNDWI Index and Linear Directional Mean Analysis for Morphological Changes in the Zarriné-Rūd River. Arab. J. Geosci. 2015, 8, 8419–8428. [Google Scholar] [CrossRef]
  64. Wang, X.; Xie, S.; Zhang, X.; Chen, C.; Guo, H.; Du, J.; Duan, Z. A Robust Multi-Band Water Index (MBWI) for Automated Extraction of Surface Water from Landsat 8 OLI Imagery. Int. J. Appl. Earth Obs. Geoinf. 2018, 68, 73–91. [Google Scholar] [CrossRef]
  65. Jin, S.; Sader, S.A. Comparison of Time Series Tasseled Cap Wetness and the Normalized Difference Moisture Index in Detecting Forest Disturbances. Remote Sens. Environ. 2005, 94, 364–372. [Google Scholar] [CrossRef]
  66. Sriwongsitanon, N.; Gao, H.; Savenije, H.H.G.; Maekan, E.; Saengsawang, S.; Thianpopirug, S. Comparing the Normalized Difference Infrared Index (NDII) with Root Zone Storage in a Lumped Conceptual Model. Hydrol. Earth Syst. Sci. 2016, 20, 3361–3377. [Google Scholar] [CrossRef]
  67. Feyisa, G.L.; Meilby, H.; Fensholt, R.; Proud, S.R. Automated Water Extraction Index: A New Technique for Surface Water Mapping Using Landsat Imagery. Remote Sens. Environ. 2014, 140, 23–35. [Google Scholar] [CrossRef]
  68. Rad, A.M.; Kreitler, J.; Sadegh, M. Augmented Normalized Difference Water Index for Improved Surface Water Monitoring. Environ. Model. Softw. 2021, 140, 105030. [Google Scholar] [CrossRef]
  69. Zhang, R.; Zhu, L.; Ma, Q.; Chen, H.; Liu, C.; Zubaida, M. The Consecutive Lake Group Water Storage Variations and Their Dynamic Response to Climate Change in the Central Tibetan Plateau. J. Hydrol. 2021, 601, 126615. [Google Scholar] [CrossRef]
  70. Yang, X.; Qin, Q.; Yésou, H.; Ledauphin, T.; Koehl, M.; Grussenmeyer, P.; Zhu, Z. Monthly Estimation of the Surface Water Extent in France at a 10-m Resolution Using Sentinel-2 Data. Remote Sens. Environ. 2020, 244, 111803. [Google Scholar] [CrossRef]
  71. Shen, L.; Li, C. Water Body Extraction from Landsat ETM+ Imagery Using Adaboost Algorithm. In Proceedings of the 2010 18th International Conference on Geoinformatics, Beijing, China, 18–20 June 2010; IEEE: New York, NY, USA, 2010; pp. 1–4. [Google Scholar]
  72. Fisher, A.; Flood, N.; Danaher, T. Comparing Landsat Water Index Methods for Automated Water Classification in Eastern Australia. Remote Sens. Environ. 2016, 175, 167–182. [Google Scholar] [CrossRef]
  73. Li, Y.; Sheng, W.; Yang, G.; Liang, B.; Su, Z.; Chen, Z. Home Assistant-Based Collaborative Framework of Multi-Sensor Fusion for Social Robot. In Proceedings of the 2018 13th World Congress on Intelligent Control and Automation (WCICA), Changsha, China, 4–8 July 2018; IEEE: New York, NY, USA; pp. 401–406.
  74. Pekel, J.-F.; Cottam, A.; Gorelick, N.; Belward, A.S. High-Resolution Mapping of Global Surface Water and Its Long-Term Changes. Nature 2016, 540, 418–422. [Google Scholar] [CrossRef]
  75. Zou, Z.; Li, X.; Liu, Y.; Wang, X.; Wang, W. Tendências Divergentes Da Área Do Corpo d’água de Superfície Aberta Nos Estados Unidos Contíguos de 1984 a 2016 (Original Em Inglês: Divergent Trends of Open-Surface Water Body Area in the Contiguous United States from 1984 to 2016). Proc. Natl. Acad. Sci. USA 2018, 115, 3810–3815. [Google Scholar] [CrossRef]
  76. Justice, C.O.; Giglio, L.; Korontzi, S.; Owens, J.; Morisette, J.T.; Roy, D.; Descloitres, J.; Alleaume, S.; Petitcolin, F.; Kaufman, Y. The MODIS Fire Products. Remote Sens. Environ. 2002, 83, 244–262. [Google Scholar] [CrossRef]
  77. Barnes, W.L.; Pagano, T.S.; Salomonson, V.V. Prelaunch Characteristics of the Moderate Resolution Imaging Spectroradiometer (MODIS) on EOS-AM1. IEEE Trans. Geosci. Remote Sens. 1998, 36, 1088–1100. [Google Scholar] [CrossRef]
  78. Xiong, X.; Che, N.; Barnes, W. Terra MODIS On-Orbit Spatial Characterization and Performance. IEEE Trans. Geosci. Remote Sens. 2005, 43, 355–365. [Google Scholar] [CrossRef]
  79. Morton, D.C.; Defries, R.S.; Shimabukuro, Y.E.; Anderson, L.O.; Bon, F.D.; Santo, E.-; Hansen, M.; Carroll, M. Rapid Assessment of Annual Deforestation in the Brazilian Amazon Using MODIS Data. Am. Meteorol. Soc. 2005, 9, 1–22. [Google Scholar] [CrossRef]
  80. Nepstad, D.; McGrath, D.; Stickler, C.; Alencar, A.; Azevedo, A.; Swette, B.; Bezerra, T.; DiGiano, M.; Shimada, J.; da Motta, R.S.; et al. Slowing Amazon Deforestation through Public Policy and Interventions in Beef and Soy Supply Chains. Science 2014, 344, 1118–1123. [Google Scholar] [CrossRef]
  81. Diniz, C.G.; Souza, A.A.d.A.; Santos, D.C.; Dias, M.C.; da Luz, N.C.; de Moraes, D.R.V.; Maia, J.S.A.; Gomes, A.R.; Narvaes, I.d.S.; Valeriano, D.M.; et al. DETER-B: The New Amazon Near Real-Time Deforestation Detection System. IEEE J. Sel. Top. Appl. Earth Obs. Remote Sens. 2015, 8, 3619–3628. [Google Scholar] [CrossRef]
  82. de Barros Corrêa, A.C.; de Azevêdo Cavalcanti Tavares, B.; de Lira, D.R.; da Silva Mutzenberg, D.; de Souza Cavalcanti, L.C. The Semi-Arid Domain of the Northeast of Brazil. In The Physical Geography of Brazil; Springer: Berlin/Heidelberg, Germany, 2019; pp. 119–150. [Google Scholar] [CrossRef]
  83. Ferreira, L.G.; Huete, A.R. Assessing the Seasonal Dynamics of the Brazilian Cerrado Vegetation through the Use of Spectral Vegetation Indices. Int. J. Remote Sens. 2004, 25, 1837–1860. [Google Scholar] [CrossRef]
  84. Jacon, A.D.; Galvão, L.S.; dos Santos, J.R.; Sano, E.E. Seasonal Characterization and Discrimination of Savannah Physiognomies in Brazil Using Hyperspectral Metrics from Hyperion/EO-1. Int. J. Remote Sens. 2017, 38, 4494–4516. [Google Scholar] [CrossRef]
  85. Gao, X.; Dong, S.; Li, S.; Xu, Y.; Liu, S.; Zhao, H.; Yeomans, J.; Li, Y.; Shen, H.; Wu, S.; et al. Using the Random Forest Model and Validated MODIS with the Field Spectrometer Measurement Promote the Accuracy of Estimating Aboveground Biomass and Coverage of Alpine Grasslands on the Qinghai-Tibetan Plateau. Ecol. Indic. 2020, 112, 106114. [Google Scholar] [CrossRef]
  86. Liang, S.; Fang, H.; Chen, M.; Shuey, C.J.; Walthall, C.; Daughtry, C.; Morisette, J.; Schaaf, C.; Strahler, A. Validating MODIS Land Surface Reflectance and Albedo Products: Methods and Preliminary Results. Remote Sens. Environ. 2002, 83, 149–162. [Google Scholar] [CrossRef]
  87. Miettinen, J.; Stibig, H.J.; Achard, F. Remote Sensing of Forest Degradation in Southeast Asia-Aiming for a Regional View through 5–30 m Satellite Data. Glob. Ecol. Conserv. 2014, 2, 24–36. [Google Scholar] [CrossRef]
  88. Leinenkugel, P.; Deck, R.; Huth, J.; Ottinger, M.; Mack, B. The Potential of Open Geodata for Automated Large-Scale Land Use and Land Cover Classification. Remote Sens. 2019, 11, 2249. [Google Scholar] [CrossRef]
  89. Zhang, P.; Ma, Y.; Liu, S.; Wang, G.; Zhang, J.; He, X.; Zhang, J.; Rui, Y.; Zhang, Z. Phytotoxicity, Uptake and Transformation of Nano-CeO2 in Sand Cultured Romaine Lettuce. Environ. Pollut. 2017, 220, 1400–1408. [Google Scholar] [CrossRef] [PubMed]
  90. Zhao, H.; Chen, Z.; Jiang, H.; Jing, W.; Sun, L.; Feng, M. Evaluation of Three Deep Learning Models for Early Crop Classification Using Sentinel-1A Imagery Time Series-a Case Study in Zhanjiang, China. Remote Sens. 2019, 11, 2673. [Google Scholar] [CrossRef]
  91. MapBiomas Brasil. Available online: https://brasil.mapbiomas.org/colecoes-mapbiomas-1 (accessed on 12 September 2024).
  92. Pastick, N.J.; Dahal, D.; Wylie, B.K.; Parajuli, S.; Boyte, S.P.; Wu, Z. Characterizing Land Surface Phenology and Exotic Annual Grasses in Dryland Ecosystems Using Landsat and Sentinel-2 Data in Harmony. Remote Sens. 2020, 12, 725. [Google Scholar] [CrossRef]
  93. Zhu, L.; Ives, A.R.; Zhang, C.; Guo, Y.; Radeloff, V.C. Climate Change Causes Functionally Colder Winters for Snow Cover-Dependent Organisms. Nat. Clim. Change 2019, 9, 886–893. [Google Scholar] [CrossRef]
  94. Li, X.; Su, X.; Hu, Z.; Yang, L.; Zhang, L.; Chen, F. Improved Distortion Correction Method and Applications for Large Aperture Infrared Tracking Cameras. Infrared Phys. Technol. 2019, 98, 82–88. [Google Scholar] [CrossRef]
  95. Feng, K.; Wang, T.; Liu, S.; Kang, W.; Chen, X.; Guo, Z.; Zhi, Y. Monitoring Desertification Using Machine-Learning Techniques with Multiple Indicators Derived from MODIS Images in Mu Us Sandy Land, China. Remote Sens. 2022, 14, 2663. [Google Scholar] [CrossRef]
  96. Parente, L.; Ferreira, L. Assessing the Spatial and Occupation Dynamics of the Brazilian Pasturelands Based on the Automated Classification of MODIS Images from 2000 to 2016. Remote Sens. 2018, 10, 606. [Google Scholar] [CrossRef]
  97. Tseng, M.L.; Chang, C.H.; Lin, C.W.R.; Wu, K.J.; Chen, Q.; Xia, L.; Xue, B. Future Trends and Guidance for the Triple Bottom Line and Sustainability: A Data Driven Bibliometric Analysis. Environ. Sci. Pollut. Res. 2020, 27, 33543–33567. [Google Scholar] [CrossRef]
  98. Kennedy, R.E.; Yang, Z.; Gorelick, N.; Braaten, J.; Cavalcante, L.; Cohen, W.B.; Healey, S. Implementation of the LandTrendr Algorithm on Google Earth Engine. Remote Sens. 2018, 10, 691. [Google Scholar] [CrossRef]
  99. Bullock, E.L.; Woodcock, C.E.; Souza, C.M.; Olofsson, P. Satellite-Based Estimates Reveal Widespread Forest Degradation in the Amazon. Glob. Change Biol. 2020, 26, 2956–2969. [Google Scholar] [CrossRef]
  100. Rapinel, S.; Mony, C.; Lecoq, L.; Clément, B.; Thomas, A.; Hubert-Moy, L. Evaluation of Sentinel-2 Time-Series for Mapping Floodplain Grassland Plant Communities. Remote Sens. Environ. 2019, 223, 115–129. [Google Scholar] [CrossRef]
  101. IBGE—Instituto Brasileiro de Geografia e Estatística Área Da Unidade Territorial: Área Territorial Brasileira. Available online: https://www.ibge.gov.br/geociencias/organizacao-do-territorio/estrutura-territorial/15761-areas-dos-municipios.html (accessed on 10 September 2024).
  102. IBGE|Portal Do IBGE|IBGE. Available online: https://www.ibge.gov.br/ (accessed on 13 September 2024).
  103. Alvares, C.A.; Stape, J.L.; Sentelhas, P.C.; Moraes, G.J.L.; Sparovek, G. Köppen’s Climate Classification Map for Brazil. Meteorol. Z. 2013, 22, 711–728. [Google Scholar] [CrossRef]
  104. Beck, H.E.; Zimmermann, N.E.; McVicar, T.R.; Vergopolan, N.; Berg, A.; Wood, E.F. Present and Future Köppen-Geiger Climate Classification Maps at 1-km Resolution. Sci. Data 2018, 5, 180214. [Google Scholar] [CrossRef]
  105. Gorelick, N.; Hancher, M.; Dixon, M.; Ilyushchenko, S.; Thau, D.; Moore, R. Google Earth Engine: Planetary-Scale Geospatial Analysis for Everyone. Remote Sens. Environ. 2017, 202, 18–27. [Google Scholar] [CrossRef]
  106. Vermote, E.F.; El Saleous, N.Z.; Justice, C.O. Atmospheric Correction of MODIS Data in the Visible to Middle Infrared: First Results. Remote Sens. Environ. 2002, 83, 97–111. [Google Scholar] [CrossRef]
  107. Wan, B.; Guo, Q.; Fang, F.; Su, Y.; Wang, R. Mapping US Urban Extents from MODIS Data Using One-Class Classification Method. Remote Sens. 2015, 7, 10143–10163. [Google Scholar] [CrossRef]
  108. Instituto Nacional de Meteorologia—INMET. Available online: https://portal.inmet.gov.br/ (accessed on 13 September 2024).
  109. APAC—Agência Pernambucana de Águas e Clima—Início. Available online: https://www.apac.pe.gov.br/ (accessed on 13 September 2024).
  110. De Souza, E.B.; Carmo, A.M.C.; de Moraes, B.C.; Nacif, A.; da Silva Ferreira, D.B.; da Rocha, E.J.P.; Souza, P.J.D.O.P. Sazonalidade Da Precipitação Sobre a Amazônia Legal Brasileira: Clima Atual e Projeções Futuras Usando o Modelo REGCM4. Rev. Bras. Climatol. 2016, 18, 2237–8642. [Google Scholar]
  111. Wanderley, H.S.; Sediyama, G.C.; Justino, F.B.; Alencar, L.P.d.; Delgado, R.C. Variabilidade Da Precipitação No Sertão Do São Francisco, Estado de Alagoas. Rev. Bras. Eng. Agríc. Ambient. 2013, 17, 790–795. [Google Scholar] [CrossRef]
  112. Vicente-Serrano, S.M.; Beguería, S.; López-Moreno, J.I. A Multiscalar Drought Index Sensitive to Global Warming: The Standardized Precipitation Evapotranspiration Index. J. Clim. 2010, 23, 1696–1718. [Google Scholar] [CrossRef]
  113. Teegavarapu, R.S.V. Methods for Analysis of Trends and Changes in Hydroclimatological Time-Series. In Trends and Changes in Hydroclimatic Variables; Elsevier: Amsterdam, The Netherlands, 2019; pp. 1–89. [Google Scholar]
  114. Campozano, L.; Sanchez, E.; Aviles, A.; Samaniego, E. Evaluation of Infilling Methods for Time Series of Daily Precipitation and Temperature: The Case of the Ecuadorian Andes. Maskana 2014, 5, 99–115. [Google Scholar] [CrossRef]
  115. Mukherjee, M.; Shu, L.; Wang, D. Survey of Fog Computing: Fundamental, Network Applications, and Research Challenges. IEEE Commun. Surv. Tutor. 2018, 20, 1826–1857. [Google Scholar] [CrossRef]
  116. Cavalcante, I.B.d.S.; Da Silva, D.F.; Brandão, C.B. Analysis of the Spatio-Temporal Variability of Rainfall in Maceió-Al and Its Climate Causes. Pesqui. Geocienc. 2022, 49, e123971. [Google Scholar] [CrossRef]
  117. Martins, E.S.P.R.; Coelho, C.A.S.; Haarsma, R.; Otto, F.E.L.; King, A.D.; Jan van Oldenborgh, G.; Kew, S.; Philip, S.; Vasconcelos Júnior, F.C.; Cullen, H. A Multimethod Attribution Analysis of the Prolonged Northeast Brazil Hydrometeorological Drought (2012–16). Bull. Am. Meteorol. Soc. 2018, 99, S65–S69. [Google Scholar] [CrossRef]
  118. Nobre, G.G.; Muis, S.; Veldkamp, T.I.; Ward, P.J. Achieving the Reduction of Disaster Risk by Better Predicting Impacts of El Niño and La Niña. Prog. Disaster Sci. 2019, 2, 100022. [Google Scholar] [CrossRef]
  119. Cunha, A.P.M.A.; Zeri, M.; Leal, K.D.; Costa, L.; Cuartas, L.A.; Marengo, J.A.; Tomasella, J.; Vieira, R.M.; Barbosa, A.A.; Cunningham, C.; et al. Extreme Drought Events over Brazil from 2011 to 2019. Atmosphere 2019, 10, 642. [Google Scholar] [CrossRef]
  120. Jiménez-Muñoz, J.C.; Mattar, C.; Barichivich, J.; Santamaría-Artigas, A.; Takahashi, K.; Malhi, Y.; Sobrino, J.A.; Schrier, G. van der Record-Breaking Warming and Extreme Drought in the Amazon Rainforest during the Course of El Niño 2015–2016. Sci. Rep. 2016, 6, 33130. [Google Scholar] [CrossRef]
  121. Marengo, J.A.; Alves, L.M.; Soares, W.R.; Rodriguez, D.A.; Camargo, H.; Riveros, M.P.; Pabló, A.D. Two Contrasting Severe Seasonal Extremes in Tropical South America in 2012: Flood in Amazonia and Drought in Northeast Brazil. J. Clim. 2013, 26, 9137–9154. [Google Scholar] [CrossRef]
  122. Marengo, J.A.; Torres, R.R.; Alves, L.M. Drought in Northeast Brazil—Past, Present, and Future. Theor. Appl. Climatol. 2017, 129, 1189–1200. [Google Scholar] [CrossRef]
  123. Grimm, A.M.; Tedeschi, R.G. ENSO and Extreme Rainfall Events in South America. J. Clim. 2009, 22, 1589–1609. [Google Scholar] [CrossRef]
  124. Kayano, M.T.; Andreoli, R.V.; Ferreira de Souza, R.A. Relations between ENSO and the South Atlantic SST Modes and Their Effects on the South American Rainfall. Int. J. Climatol. 2013, 33, 2008–2023. [Google Scholar] [CrossRef]
  125. Knight, A.W.; Tindall, D.R.; Wilson, B.A. A Multitemporal Multiple Density Slice Method for Wetland Mapping across the State of Queensland, Australia. Int. J. Remote Sens. 2009, 30, 3365–3392. [Google Scholar] [CrossRef]
  126. Ouma, Y.O.; Tateishi, R. A Water Index for Rapid Mapping of Shoreline Changes of Five East African Rift Valley Lakes: An Empirical Analysis Using Landsat TM and ETM+ Data. Int. J. Remote Sens. 2006, 27, 3153–3181. [Google Scholar] [CrossRef]
  127. Xie, W.; Liang, G.; Guo, Q. A New Improved FSVM Algorithm Based on SVDD. Concurr. Comput. 2019, 31, e4893. [Google Scholar] [CrossRef]
  128. Oliveira, B.S.; Moraes, E.C.; Carrasco-Benavides, M.; Bertani, G.; Mataveli, G.A.V. Improved Albedo Estimates Implemented in the METRIC Model for Modeling Energy Balance Fluxes and Evapotranspiration over Agricultural and Natural Areas in the Brazilian Cerrado. Remote Sens. 2018, 10, 1181. [Google Scholar] [CrossRef]
  129. Felipe, A.J.B.; Baguio, M.A.; Saludes, R.B. Modeling Assessment on the Influences of Physiographic Dynamics of Landscape and Micro-Climatic Conditions at Siffu-Mallig Watershed in the Philippines. Model. Earth Syst. Environ. 2024, 10, 5329–5350. [Google Scholar] [CrossRef]
  130. Souza, E.d.O.; Costa, M.d.S.; Júnior, J.F.d.O.; de Gois, G.; Mariano, G.L.; Costa, C.E.d.S.; Filho, W.L.F.C.; Santiago, D.d.B. Estimativa e Espacialização Da Erosividade Em Mesorregiões Climáticas No Estado de Alagoas. Rev. Bras. Meteorol. 2020, 35, 769–783. [Google Scholar] [CrossRef]
  131. Tabachnick, B.G.; Fidell, L.S. Experimental Designs Using ANOVA; Thomson/Brooks/Cole: Belmont, CA, USA, 2007. [Google Scholar]
  132. Hair, J.F., Jr.; Babin, B.; Money, A.H.; Samouel, P. Fundamentos de Métodos de Pesquisa Em Administração; Bookman: Porto Alegre, Brazil, 2005. [Google Scholar]
  133. De Melo Albuquerque, P.I.; Bezerra Rodrigues, J.P.; Peixoto, F.D.S.; Miranda, M.D.P. Sensoriamento Remoto Aplicado Em Indicadores de Desertificação No Municipio de Parelhas—RN. Rev. Geogr. 2020, 37, 241. [Google Scholar] [CrossRef]
  134. Gonçalves, R.V.S.; Cardoso, J.C.F.; Oliveira, P.E.; Raymundo, D.; de Oliveira, D.C. The Role of Topography, Climate, Soil and the Surrounding Matrix in the Distribution of Veredas Wetlands in Central Brazil. Wetl. Ecol. Manag. 2022, 30, 1261–1279. [Google Scholar] [CrossRef]
  135. Du, Y.; Zhang, Y.; Ling, F.; Wang, Q.; Li, W.; Li, X. Water Bodies’ Mapping from Sentinel-2 Imagery with Modified Normalized Difference Water Index at 10-m Spatial Resolution Produced by Sharpening the SWIR Band. Remote Sens. 2016, 8, 354. [Google Scholar] [CrossRef]
  136. Zhou, Y.; Dong, J.; Xiao, X.; Xiao, T.; Yang, Z.; Zhao, G.; Zou, Z.; Qin, Y. Open Surface Water Mapping Algorithms: A Comparison of Water-Related Spectral Indices and Sensors. Water 2017, 9, 256. [Google Scholar] [CrossRef]
  137. Wang, F.; Wang, Z.; Yang, H.; Zhao, Y.; Li, Z.; Wu, J. Capability of Remotely Sensed Drought Indices for Representing the Spatio–Temporal Variations of the Meteorological Droughts in the Yellow River Basin. Remote Sens. 2018, 10, 1834. [Google Scholar] [CrossRef]
  138. Sousa, L.d.B.d.; Montenegro, A.A.d.A.; Silva, M.V.d.; Lopes, P.M.O.; Silva, J.R.I.; Silva, T.G.F.d.; Lins, F.A.C.; Silva, P.C. Spatiotemporal Dynamics of Land Use and Land Cover through Physical–Hydraulic Indices: Insights in the São Francisco River Transboundary Region, Brazilian Semiarid Area. AgriEngineering 2023, 5, 1147–1162. [Google Scholar] [CrossRef]
  139. Zhou, Y.; Hu, J.; Li, Z.; Li, J.; Zhao, R.; Ding, X. Quantifying Glacier Mass Change and Its Contribution to Lake Growths in Central Kunlun during 2000–2015 from Multi-Source Remote Sensing Data. J. Hydrol. 2019, 570, 38–50. [Google Scholar] [CrossRef]
  140. Acharya, P.; Liu, F. Spectral Index. Monitoring for Temporal Changes in Mining Areas. In Proceedings of Tailings and Mine Waste 2023, Vancouver, CA, USA, 5–8 November 2023; University of British Columbia Library: Vancouver, CA, USA, 2023. [Google Scholar]
  141. Santos, M.R.d.S.; Vitorino, M.I.; Pereira, L.C.C.; Pimentel, M.A.d.S.; Quintão, A.F. Socioenvironmental Vulnerability to Climate Change: Conditions of Coastal Municipalities in Pará State. Ambiente Soc. 2021, 24, e01671. [Google Scholar] [CrossRef]
  142. Silva, T.R.B.F.; Santos, C.A.C.d.; Silva, D.J.F.; Santos, C.A.G.; da Silva, R.M.; de Brito, J.I.B. Climate Indices-Based Analysis of Rainfall Spatiotemporal Variability in Pernambuco State, Brazil. Water 2022, 14, 2190. [Google Scholar] [CrossRef]
  143. Silva, C.A.; Fialho, E.S.; Rocha, V.M. Uma Visão Social Sobre o Clima e Seus Significados Nas Paisagens Climáticas Dos Lugares, o Pantanal/Brasil No Contexto Das Mudanças Climáticas. In Métodos e Técnicas no Estudo da Dinâmica da Paisagem Física nos Países da CPLP Comunidade dos Países de Expressão Portuguesa; Oliveira, J.L.P.C., Zacharias, A.A., Pancher, A.M., Eds.; EUMED: Málaga, Spain, 2022; pp. 49–76. [Google Scholar]
  144. Almeida, A.H.B.d.; Almeida, H.S.A.d.; Oliveira, M.K.T.d. Perspectivas Da Gestão Hídrica No Semiárido Brasileiro Para a Irrigação. Discip. Sci.—Ciênc. Nat. Tecnol. 2021, 22, 119–132. [Google Scholar] [CrossRef]
  145. Lopes, F.A.S.; Martins, M.E.; De Oliveira, F.B.; De Oliveira, C.H.R. Sistema de Informação Geográfica Como Ferramenta de Gestão Em Uma Universidade Pública. Obs. Econ. Latinoam. 2023, 21, 26656–26678. [Google Scholar] [CrossRef]
  146. Da Cunha, N.O. Análise Multitemporal da Fragilidade Ambiental da Bacia Hidrográfica do Córrego da Porteira no Município de Aquidauana. Master’s Thesis, Universidade Federal de Mato Grosso do Sul, Pioneiros, Brazil, 2021. [Google Scholar]
  147. Lima, F.J.L.d.; Martins, F.R.; Costa, R.S.; Gonçalves, A.R.; dos Santos, A.P.P.; Pereira, E.B. The Seasonal Variability and Trends for the Surface Solar Irradiation in Northeastern Region of Brazil. Sustain. Energy Technol. Assess. 2019, 35, 335–346. [Google Scholar] [CrossRef]
  148. Dantas, J.C.; da Silva, R.M.; Santos, C.A.G. Drought Impacts, Social Organization, and Public Policies in Northeastern Brazil: A Case Study of the Upper Paraíba River Basin. Environ. Monit. Assess. 2020, 192, 317. [Google Scholar] [CrossRef]
  149. Fernandez-Moran, R.; Wigneron, J.P.; De Lannoy, G.; Lopez-Baeza, E.; Parrens, M.; Mialon, A.; Mahmoodi, A.; Al-Yaari, A.; Bircher, S.; Al Bitar, A.; et al. A New Calibration of the Effective Scattering Albedo and Soil Roughness Parameters in the SMOS SM Retrieval Algorithm. Int. J. Appl. Earth Obs. Geoinf. 2017, 62, 27–38. [Google Scholar] [CrossRef]
  150. Ponce, V.M.; Lohani, A.K.; Huston, P.T. Surface Albedo and Water Resources: Hydroclimatological Impact of Human Activities. J. Hydrol. Eng. 1997, 2, 197–203. [Google Scholar] [CrossRef]
  151. Chrystiane, R.; Matos, M.; Lúcia, A.; Candeias, B.; Rodrigues, J.; Junior, T. Revista Brasileira de Cartografia (2013) N 0 65/1: 139-160 Sociedade Brasileira de Cartografia, Geodésia, Fotogrametria e Sensoriamento Remoto Mapeamento Da Vegetação, Temperatura E Albedo Da Bacia Hidrográfica Do Pajeú Com Imagens Modis Mapping Vegetation, Temperature and Albedo of Watershed Pajeú with MODIS Images. Rev. Bras. Cartogr. 2021, 73, 598–614. [Google Scholar] [CrossRef]
  152. Damasceno, C.E.; Martins, A.P. Análise Comparativa Do Albedo de Superfície Utilizando o Algoritmo SEBAL Para Os Sistemas Sensores Terra/MODIS e Landsat8/OLI No Município de Jataí (GO). In Os Desafios da Geografia Física na Fronteira do Conhecimento; Instituto De Geociências—UNICAMP: Campinas, Brazil, 2017; pp. 4931–4940. [Google Scholar]
  153. Bezerra, A.C.; da Silva, J.L.B.; Moura, G.B.d.A.; Lopes, P.M.O.; Nascimento, C.R.; Ribeiro, E.P.; Galvíncio, J.D.; Silva, M.V. da Dynamics of Land Cover and Land Use in Pernambuco (Brazil): Spatio-Temporal Variability and Temporal Trends of Biophysical Parameters. Remote Sens. Appl. 2022, 25, 100677. [Google Scholar] [CrossRef]
  154. Nascimento, C.M.; Demattê, J.A.M.; Mello, F.A.O.; Rosas, J.T.F.; Tayebi, M.; Bellinaso, H.; Greschuk, L.T.; Albarracín, H.S.R.; Ostovari, Y. Soil Degradation Detected by Temporal Satellite Image in São Paulo State, Brazil. J. S. Am. Earth Sci. 2022, 120, 104036. [Google Scholar] [CrossRef]
  155. Souza, Í.N.P.d.; Nóbrega, R.A.d.A.; Ribeiro, S.M.C. O Papel Das Infraestruturas Ferroviárias Nas Mudanças de Uso e Cobertura Do Solo No MATOPIBA. Geogr. Dep. Univ. Sao Paulo 2019, 38, 123–136. [Google Scholar] [CrossRef]
  156. Teixeira, A.; Leivas, J.; Struiving, T.; Reis, J.; Simão, F. Energy Balance and Irrigation Performance Assessments in Lemon Orchards by Applying the SAFER Algorithm to Landsat 8 Images. Agric. Water Manag. 2021, 247, 106725. [Google Scholar] [CrossRef]
  157. Mariano, D.A.; Santos, C.A.C.d.; Wardlow, B.D.; Anderson, M.C.; Schiltmeyer, A.V.; Tadesse, T.; Svoboda, M.D. Use of Remote Sensing Indicators to Assess Effects of Drought and Human-Induced Land Degradation on Ecosystem Health in Northeastern Brazil. Remote Sens. Environ. 2018, 213, 129–143. [Google Scholar] [CrossRef]
  158. Gil, A.P.; Padovani, C.R.; Luiz, A.; Coelho, N. Comparação Entre Ndwi E Mndwi Para O Mapeamento de áReas Inundadas No Pantanal Do Taquari; INPE: São José dos Campos, Brazil, 2019. [Google Scholar]
  159. Caballero, C.B.; Ruhoff, A.; Biggs, T. Land Use and Land Cover Changes and Their Impacts on Surface-Atmosphere Interactions in Brazil: A Systematic Review. Sci. Total Environ. 2022, 808, 152134. [Google Scholar] [CrossRef]
  160. Beeram, S.N.R.; Shahanas, P.V.; Pramada, S.K.; Thendiyath, R. Impact of Change in Land Use/Land Cover and Climate Variables on Groundwater Recharge in a Tropical River Basin. Environ. Dev. Sustain. 2024, 26, 14763–14786. [Google Scholar] [CrossRef]
  161. Jardim, A.M.d.R.F.; Araújo Júnior, G.D.N.; da Silva, M.V.; Dos Santos, A.; da Silva, J.L.B.; Pandorfi, H.; de Oliveira-Júnior, J.F.; Teixeira, A.H.d.C.; Teodoro, P.E.; de Lima, J.L.M.P.; et al. Using Remote Sensing to Quantify the Joint Effects of Climate and Land Use/Land Cover Changes on the Caatinga Biome of Northeast Brazilian. Remote Sens. 2022, 14, 1911. [Google Scholar] [CrossRef]
  162. De Medeiros, F.J.; De Oliveira, C.P.; Gomes, R.D.S.; Da Silva, M.L.; Cabral Júnior, J.B. Hydrometeorological Conditions in the Semiarid and East Coast Regions of Northeast Brazil in the 2012–2017 Period. Acad. Bras. Ciênc. 2021, 93, e20200198. [Google Scholar] [CrossRef]
  163. Nair, K.S. Impact of Climate Change and Anthropogenic Pressure on the Water resources of India: Challenges in Management. Proc. IAHS 2016, 374, 63–67. [Google Scholar] [CrossRef]
  164. A 30 Meter Landsat Pixel Sub-Divided into 900 1 Meter Pixels (a) and...| Download Scientific Diagram. Available online: https://www.researchgate.net/figure/A-30-meter-Landsat-pixel-sub-divided-into-900-1-meter-pixels-a-and-the-incremental_fig1_351736252 (accessed on 23 August 2024).
  165. De Lima, J.L.; Silva Sousa, K.N.; Santos, P.R.B. Detecção Remota Dos Potenciais Efeitos de Secas Intensas sobre a Sazonalidade da áGua no Complexo Fluvio-Lacustre do Curuaí, Rio Amazonas, Pará, Brasil. Geo UERJ 2021, 38, e42362. [Google Scholar] [CrossRef]
  166. Silva, G.P.d. Expressão Geomorfológica da Queda do Nível de Base no Baixo São Francisco. Master’s Thesis, Universidade Federal de Alagoas, Maceió, Brazil, 2022. [Google Scholar]
  167. Lima, M.M.d.; Donegá, M.V.B.; de Souza, T.W.S.; Panza, M.R.; Pacheco, F.M.P.; Cavalheiro, W.C.S.; Hara, F.A. dos S.; Vendruscolo, J. Hidrogeomorfometria da Microbacia do Rio Paraíso: Informações para Auxiliar o Manejo dos Recursos Naturais na Amazônia Ocidental. Res. Soc. Dev. 2021, 10, e41410313367. [Google Scholar] [CrossRef]
  168. Bettencourt, P.; Fernandes, P.A.; Fulgêncio, C.; Canas, Â.; Wasserman, J.C. Prospective Scenarios for Water Sustainability in the São Francisco River Basin. Sustain. Water Resour. Manag. 2023, 9, 81. [Google Scholar] [CrossRef]
  169. de Oliveira-Júnior, J.F.; Correia Filho, W.L.F.; de Barros Santiago, D.; de Gois, G.; da Silva Costa, M.; da Silva Junior, C.A.; Teodoro, P.E.; Freire, F.M. Rainfall in Brazilian Northeast via In Situ Data and CHELSA Product: Mapping, Trends, and Socio-Environmental Implications. Environ. Monit. Assess. 2021, 193, 263. [Google Scholar] [CrossRef]
  170. Silva, J.L.B.d.; Moura, G.B.d.A.; Silva, M.V.d.; Lopes, P.M.O.; Guedes, R.V.; e Silva, Ê.F.D.F.; Ortiz, P.F.S.; de Moraes Rodrigues, J.A. Changes in the Water Resources, Soil Use and Spatial Dynamics of Caatinga Vegetation Cover over Semiarid Region of the Brazilian Northeast. Remote Sens. Appl. 2020, 20, 100372. [Google Scholar] [CrossRef]
  171. Ferreira, R.R.; Mutti, P.; Mendes, K.R.; Campos, S.; Marques, T.V.; Oliveira, C.P.; Gonçalves, W.; Mota, J.; Difante, G.; Urbano, S.A.; et al. An Assessment of the MOD17A2 Gross Primary Production Product in the Caatinga Biome, Brazil. Int. J. Remote Sens. 2021, 42, 1275–1291. [Google Scholar] [CrossRef]
  172. Marengo, J.A.; Cunha, A.P.; Alves, L.M. A Seca de 2012-15 no Semiárido do Nordeste do Brasil no Contexto Histórico. Rev. Climanálise 2016, 3, 49–54. [Google Scholar]
  173. Biudes, M.S.; Vourlitis, G.L.; Machado, N.G.; de Arruda, P.H.Z.; Neves, G.A.R.; de Almeida Lobo, F.; Neale, C.M.U.; de Souza Nogueira, J. Patterns of Energy Exchange for Tropical Ecosystems across a Climate Gradient in Mato Grosso, Brazil. Agric. For. Meteorol. 2015, 202, 112–124. [Google Scholar] [CrossRef]
  174. Krol, M.S.; Bronstert, A. Regional Integrated Modelling of Climate Change Impacts on Natural Resources and Resource Usage in Semi-Arid Northeast Brazil. Environ. Model. Softw. 2007, 22, 259–268. [Google Scholar] [CrossRef]
  175. Zilli, M.; Scarabello, M.; Soterroni, A.C.; Valin, H.; Mosnier, A.; Leclère, D.; Havlík, P.; Kraxner, F.; Lopes, M.A.; Ramos, F.M. The Impact of Climate Change on Brazil’s Agriculture. Sci. Total Environ. 2020, 740, 139384. [Google Scholar] [CrossRef]
  176. Marques, J.F.; Alves, M.B.; Silveira, C.F.; Amaral e Silva, A.; Silva, T.A.; dos Santos, V.J.; Calijuri, M.L. Fires Dynamics in the Pantanal: Impacts of Anthropogenic Activities and Climate Change. J. Environ. Manag. 2021, 299, 113586. [Google Scholar] [CrossRef]
  177. Borges, C.K.; dos Santos, C.A.C.; Carneiro, R.G.; da Silva, L.L.; de Oliveira, G.; Mariano, D.; Silva, M.T.; da Silva, B.B.; Bezerra, B.G.; Perez-Marin, A.M.; et al. Seasonal Variation of Surface Radiation and Energy Balances over Two Contrasting Areas of the Seasonally Dry Tropical Forest (Caatinga) in the Brazilian Semi-Arid. Environ. Monit. Assess. 2020, 192, 524. [Google Scholar] [CrossRef] [PubMed]
  178. Yu, X.N.; Huang, Y.M.; Li, E.G.; Li, X.Y.; Guo, W.H. Effects of Rainfall and Vegetation to Soil Water Input and Output Processes in the Mu Us Sandy Land, Northwest China. Catena 2018, 161, 96–103. [Google Scholar] [CrossRef]
  179. He, S.; Zhang, C.; Meng, F.R.; Bourque, C.P.A.; Huang, Z.; Li, X.; Han, Y.; Feng, S.; Miao, L.; Liu, C. Vegetation-Cover Control of between-Site Soil Temperature Evolution in a Sandy Desertland. Sci. Total Environ. 2024, 908, 168372. [Google Scholar] [CrossRef] [PubMed]
  180. Lopes, A.R.; Dotto, M.; Xavier, E.; Giarola, C.M.; Pirola, K. Balanço Hídrico Climatológico E Classificação Climática Para O Município de Paranavaí, Paraná. Rev. Bras. Eng. Biossistemas 2021, 15, 367–380. [Google Scholar] [CrossRef]
  181. Lozano-Parra, J.; Schnabel, S.; Pulido, M.; Gómez-Gutiérrez, Á.; Lavado-Contador, F. Effects of Soil Moisture and Vegetation Cover on Biomass Growth in Water-Limited Environments. Land. Degrad. Dev. 2018, 29, 4405–4414. [Google Scholar] [CrossRef]
  182. Fernandes, M.M.; Fernandes, M.R.d.M.; Garcia, J.R.; Matricardi, E.A.T.; de Almeida, A.Q.; Pinto, A.S.; Menezes, R.S.C.; Silva, A.d.J.; Lima, A.H.d.S. Assessment of Land Use and Land Cover Changes and Valuation of Carbon Stocks in the Sergipe Semiarid Region, Brazil: 1992–2030. Land. Use Policy 2020, 99, 104795. [Google Scholar] [CrossRef]
  183. Heffernan, E.; Epstein, H.; Declan, T.; Chen, J.; Lei, C.; Chu, H.; Li, X.; Torn, M.; Wang, Y.-P.; Sciusco, P.; et al. Overlooked Cooling Effects of Albedo in Terrestrial Ecosystems. Environ. Res. Lett. 2024, 19, 093001. [Google Scholar] [CrossRef]
  184. Pan, X.; Wang, Z.; Liu, S.; Yang, Z.; Guluzade, R.; Liu, Y.; Yuan, J.; Yang, Y. The Impact of Clear-Sky Biases of Land Surface Temperature on Monthly Evapotranspiration Estimation. Int. J. Appl. Earth Obs. Geoinf. 2024, 129, 103811. [Google Scholar] [CrossRef]
  185. Saha, K. The Earth’s Atmosphere: Its Physics and Dynamics; Springer: Berlin/Heidelberg, Germany, 2008. [Google Scholar] [CrossRef]
  186. Li, H.; Yang, B.; Meng, Y.; Liu, K.; Wang, S.; Wang, D.; Zhang, H.; Huang, Y.; Liu, X.; Li, D.; et al. Relationship between Carbon Pool Changes and Environmental Changes in Arid and Semi-Arid Steppe—A Two Decades Study in Inner Mongolia, China. Sci. Total Environ. 2023, 893, 164930. [Google Scholar] [CrossRef]
  187. Cunha, J.; Nóbrega, R.L.B.; Rufino, I.; Erasmi, S.; Galvão, C.; Valente, F. Surface Albedo as a Proxy for Land-Cover Clearing in Seasonally Dry Forests: Evidence from the Brazilian Caatinga. Remote Sens. Environ. 2020, 238, 111250. [Google Scholar] [CrossRef]
Figure 1. Map of Brazil for the study area, highlighting the three mesoregions (a) and the spatial variability of elevations (b) in the state of Alagoas. Data source: the Brazilian Institute of Geography and Statistics (IBGE) [101].
Climate 12 00150 g001
Figure 2. Sequence of tools used in the study, followed by data retrieval from the study area and the tools used up to the final results, such as thematic maps and index databases.
Climate 12 00150 g002
Figure 3. Annual average of the spatiotemporal distribution of NDWI in Alagoas, between 2003 and 2022.
Climate 12 00150 g003
Figure 4. Annual average of the spatial-temporal distribution of the MNDWI water index in the state of Alagoas, between 2003 and 2022.
Climate 12 00150 g004
Figure 5. Annual average of the spatiotemporal distribution of AWEInsh in Alagoas, between 2003 and 2022.
Climate 12 00150 g005
Figure 6. Spatiotemporal Distribution of the Surface Albedo Biophysical Parameter in the State of Alagoas, from 2003 to 2022.
Climate 12 00150 g006
Figure 7. Annual average of the spatiotemporal distribution of resampled MapBiomas Rios from 30 m to 500 m spatial resolution in Alagoas between 2003 and 2022.
Climate 12 00150 g007
Figure 8. Spatiotemporal comparison of the detection capability of hydrophysical indices for areas covered by water bodies between NDWI, MNDWI, and AWEInsh values calculated in MBR 2.0 and resampled MBR 2.0 in the State of Alagoas, between 2003 and 2022.
Climate 12 00150 g008
Figure 9. Annual precipitation (mm) for the El Niño years (2003, 2015, 2019) and La Niña years (2007 and 2022) in the state of Alagoas. Source: INMET [108], APAC [109], authors (2023).
Climate 12 00150 g009
Figure 10. Space-time distribution of surface temperature (Tsup) in the state of Alagoas, between 2003 and 2022.
Climate 12 00150 g010
Figure 11. Correlation scatter plot with a regression line for maximum and minimum water surface area (km2) versus (a) NDVI and (b) NDWI over a period of 20 years. The years in red text represent the driest periods, blue text indicates the wettest years, and black text corresponds to periods with low to moderate ENSO activity. The scatter points highlight the temporal variation in water surface area relative to vegetation and water indices, with clear distinctions between drought and wet phases based on ENSO classification events.
Climate 12 00150 g011
Figure 12. (a) Boxplot of annual precipitation (mm) from 2003 to 2022, based on MODIS data. The boxes show the interquartile range (IQR), with whiskers extending to 1.5 times the IQR and outliers marked as points. Precipitation variability increases over time, with 2022 showing the widest range. (b) Boxplot of average surface soil temperature (°C) for the same period, also using MODIS data. The graph shows fluctuations in temperature, with higher values in 2015 and 2017 and a slight decrease in recent years.
Climate 12 00150 g012
Figure 13. Scatter plot of the annual precipitation ratio and average soil temperature throughout the year.
Climate 12 00150 g013
Table 1. Table of values for the biophysical identification of areas covered by water bodies according to the index ratios (MBR, AWEInsh, MNDWI, NDWI) and the calculated values from resampled MBR 2.0 data in the State of Alagoas, between 2003 and 2022.
Indices/Year2003200420052006200720082009201020112012
MBR367.1394.2397.1391.9400.9395.2396.2385.4371.4354.5
Resampled MBR366.4391.1393.6389.7398.2390.6392.5378.6368.4349.3
AWEInsh405.3415.7415.3407.3432.2399.7424.9396.8406.5399.7
MNDWI342.4423.4346.6317.2367.9337.0349.3315.0338.0270.0
NDWI309.9319.2260.9239.4259.9244.5252.8205.4218.1200.0
Indices/Year2013201420152016201720182019202020212022
MBR332.2324.2317.1308.6312.3313.3309.0314.1304.8376.0
MBR resampled324.3317.5310.9303.3309.7310.7305.3311.4303.1371.8
AWEInsh375.8377.7371.3413.0330.0333.2342.2371.8358.4426.1
MNDWI270.0286.4235.2226.7235.5222.8220.1246.7262.2409.8
NDWI200.0196.1191.7189.2183.8168.9165.5162.5165.0200.5
Table 2. Spatiotemporal comparison of water-covered areas between the NDWI, MNDWI, and AWEInsh physical-hydrological indices, MBR 2.0 and resampled MBR 2.0, including mean, standard deviation, and coefficient of variation (CV) of the values found in the State of Alagoas, from 2003 to 2022.
Year2003200420052006200720082009201020112012
Mean358.22388.72362.70349.10371.81353.41363.15336.23340.48314.70
SD35.1841.2562.3070.5866.5665.9567.3379.7772.5879.32
CV9.82%10.61%17.18%20.22%17.90%18.66%18.54%23.72%21.32%25.20%
Year2013201420152016201720182019202020212022
Mean300.45300.37285.25288.17274.26269.77268.41281.31278.69356.84
SD67.5966.9271.3086.3262.2270.6673.1279.7972.1790.34
CV22.50%22.28%24.99%29.95%22.69%26.19%27.24%28.36%25.89%25.32%
Table 3. Table of values comparing physical-hydrological indices, AWEInsh, NDWI, and MNDWI obtained during the study, for the state of Alagoas in years of more extreme meteorological conditions, between 2003 and 2022.
20032005200720092011201320152017201920212022
AWEInshMin28,205.5−25,077.1−24,856.9−25,479.0−25,338.9−27,527.0−27,082.6−26,662.3−27,287.6−25,368.6−23,910.0
Max−131.483.9547.558.9947.497.1−1152.088.6−24.9106.0649.0
Mean−19,412.3−18,940.8−18,678.8−18,771.3−18,519.4−19,459.1−19,603.2−19,657.9−19,555.3−19,054.0−18,439.7
MED−19,038.4−18,955.6−18,740.5−18,849.6−18,671.6−19,300.0−19,510.6−19,633.8−19,408.9−19,051.1−18,582.0
SD3119.12645.62497.62607.42325.62838.63014.72633.22760.52391.02268.1
CV16.07%13.97%13.37%13.89%12.56%14.59%15.38%13.40%14.12%12.55%12.30%
NDWIMin−0.726−0.695−0.705−0.702−0.700−0.706−0.719−0.683−0.734−0.708−0.692
Max0.2390.2040.2720.2450.2070.1910.1490.1750.2030.2320.201
Mean−0.518−0.529−0.542−0.537−0.546−0.515−0.511−0.510−0.551−0.535−0.545
MED−0.530−0.533−0.545−0.541−0.551−0.522−0.514−0.513−0.555−0.537−0.548
SD0.0830.0660.0680.0640.0640.0700.0720.0670.0720.0640.064
CV16.05%12.54%12.61%11.90%11.72%13.54%14.12%13.21%13.05%12.00%11.69%
MNDWIMin−0.636−0.595−0.593−0.613−0.599−0.629−0.645−0.607−0.642−0.638−0.600
Max0.2770.3370.3840.2710.3950.3370.1330.3310.2490.3120.393
Mean−0.503−0.483−0.465−0.484−0.473−0.488−0.517−0.479−0.514−0.487−0.458
MED−0.516−0.497−0.480−0.501−0.482−0.499−0.527−0.489−0.527−0.501−0.470
SD0.0800.0740.0790.0800.0750.0750.0730.0680.0710.0840.081
CV15.87%15.23%16.92%16.52%15.91%15.33%14.10%14.28%13.89%17.16%17.78%
Table 4. Table of values comparing biophysical indices, albedo, temperature, and precipitation obtained during the study in the state of Alagoas during years of extreme meteorological conditions, from 2003 to 2022.
20032005200720092011201320152017201920212022
AlbedoMin0.0570.0740.0660.0590.0800.0720.0600.0730.0490.0600.082
Max0.2590.2510.2280.2260.2070.2580.2410.2420.2340.2160.209
Mean0.1640.1660.1660.1630.1630.1690.1620.1740.1620.1640.166
MED0.1620.1650.1660.1630.1630.1690.1610.1730.1610.1650.167
SD0.0210.0170.0160.0160.0150.0180.0190.0190.0170.0150.015
CV12.64%10.09%9.43%9.69%9.05%10.77%11.77%10.70%10.80%9.27%9.33%
Tsup (°C)Min25.47025.05025.14025.96025.14025.69025.71025.74025.57025.27025.310
Max41.17039.13037.82040.61037.42041.39043.39040.84042.15039.93035.650
Mean32.59631.56029.79032.86130.29532.40934.35531.55532.33631.60730.064
MED31.56031.08029.41032.04029.85031.12033.53030.87031.69030.93029.750
SD3.8492.4812.0343.2232.1363.7833.8132.9273.0813.1962.119
CV11.81%7.86%6.83%9.81%7.05%11.67%11.10%9.28%9.53%10.11%7.05%
Annual total precipitation (mm)Min329.6467.3226.9489.4211.7238.1316.3456.8404.0478.7598.7
Max1856.72018.02133.32468.32564.52305.81902.52574.41895.52358.83093.3
Mean905.81077.51116.01188.41191.81044.1926.51413.61028.01197.41749.4
MED850.61028.11125.01128.71197.21033.0878.71380.9952.51141.71804.2
SD304.9301.7343.8369.4467.3420.4329.4500.6342.0335.8581.8
CV33.66%28.00%30.81%31.09%39.21%40.26%35.55%35.41%33.27%28.04%33.26%
Disclaimer/Publisher’s Note: The statements, opinions and data contained in all publications are solely those of the individual author(s) and contributor(s) and not of MDPI and/or the editor(s). MDPI and/or the editor(s) disclaim responsibility for any injury to people or property resulting from any ideas, methods, instructions or products referred to in the content.

