1. Introduction
Air temperature or dry-bulb temperature has widely been used in atmospheric research to understand weather and climate variability and change. e.g., [
1]. However, this measure alone does not capture the total heat content of the air because dry-bulb temperature only accounts for dry heat content and does not include moist heat [
2]. As a result, we suggest that, in addition to air temperature, equivalent temperature (T
E) can be used for more accurate measurement of atmospheric heat content since T
E represents both dry and moist heat [
3,
4,
5,
6,
7,
8]. In other words, this measure provides a more accurate representation of the near-surface energy budget.
Pielke Sr. et al. and Ribera et al. [
2,
9] demonstrated the value of T
E as a measure of atmospheric heat content. Previously, Pielke Sr. [
10] has shown that a 1 °C dew point temperature increase is equivalent to a 2.5 °C increase in air temperature and thus atmospheric moisture plays an important role in the calculation of atmospheric heat content. Subsequent research provided additional evidence of the role of atmospheric moisture in atmospheric heat content or T
E calculation [
5,
7].
Near surface and tropospheric T
E for the contiguous United States using data from 1979–2005 was analyzed and results suggest that using T
E along with temperature may help to remove uncertainties in near surface and tropospheric temperature trends [
5]. It is also shown that vegetation plays an important role in influencing near surface T
E [
5]. Analyses of high-density meso-scale data from 33 Mesonet stations in Kentucky, USA, further demonstrated the relationship between T
E and atmospheric heat content [
7]. This study in Kentucky [
7] shows about 10% (14.14 g kg
−1) moisture contribution in the summer resulted in a T
E of 59 °C in comparison to the air temperature of 24 °C (see Figure 2a,b of [
7]).
Previously, differences in near surface air and equivalent temperature trends from 1982–1997 over the Eastern U.S. were investigated [
3]. It was found that overall T
E trends were relatively larger in the eastern U.S. than temperature trends [
3]. These patterns, however, vary widely from site to site, so local microclimate is very important. In another study, 123 years of data for the summer season from one location in Ohio was analyzed and it reported a positive trend in T
E during the second half of the 20th century [
4]. An assessment of T
E trends for seven locations over the Central U.S. found that for a majority of these locations, summer trends of T
E were positive and greater than annual trends [
6]. This research in the Central U.S. [
4] also demonstrated the potential use of T
E in heat wave assessment. A follow-up study, using data from four locations in Illinois, USA, found a good relationship between summer T
E hot days and antecedent 5-cm soil moisture anomalies [
11]. It was reported that the highest summer T
E was strongly linked to spring soil moisture [
11].
In this study, we investigate and quantify intra-seasonal and inter-annual variations of atmospheric heat content (T
E) of different air masses during the growing season in the east central USA, represented by the state of Kentucky (
Figure 1).
Note that the growing season also represents warm months. Kentucky was selected for several reasons. First, it provides a unique opportunity to work with a high quality T
E time series [
7]. Second, this time series is derived from high-quality observations collected by the Kentucky Mesonet [
12]. Kentucky Mesonet is a research grade weather and climate-observing network with redundant sensors that record high-quality, five-minute data from 72 locations. Third, this study is a natural progression of previous research efforts [
7].
A study [
7] on Kentucky and the east central U.S. investigated inter-seasonal and inter-annual variations of T
E at meso-scale from 2009–2014, which was the first of its kind. The time period was determined by the availability of the highest number of stations. Note that the Kentucky Mesonet started to install stations in 2007. The current study builds on the research presented in [
7] and assesses intra-seasonal variations of T
E for the growing season. Moreover, previous studies were focused on continental [
3,
5] and regional scales [
6], while the current study focuses on meso-scales by analyzing data from a Mesonet. In addition, none of the previous studies were focused on quantifying T
E climatology related to air masses at this scale.
In the past, T
E for different meteorological seasons (spring, summer, fall, and winter) were investigated for the east-central U.S. [
7], while T
E associated with different air masses during the growing season were not assessed [
7]. In the current study, we investigated T
E associated with different air masses during the growing season. During this season, land surface conditions and vegetation go through distinct changes along with meteorological seasonal changes. To further capture distinct atmospheric characteristics within the growing season, we have identified three periods: early (April–May), mid (June–July), and late (August–September). Previously, T
E climatology for 33 stations/locations was developed and the current study used data from 10 of these stations (see Figure 1 in [
7]). For identifying air masses, the present study used a Spatial Synoptic Classification (SSC) [
13,
14].
The SSC characterizes air masses based on the moisture and temperature of air. The present research quantified intra-growing season variations of T
E and SSC influences on T
E. The underlying hypothesis is that differences between T
E and T, which are largest during the growing season (see Figures 4 and 5 in [
7] and
Figure 2 of this paper), are directly related to the air mass types over the region and, to a lesser extent, land cover differences. The reasoning is that the characteristics of the air mass types that influence the weather at a particular location also influence the temperature and moisture content of the atmosphere, and thereby produce variations in T
E during the growing season.
It is expected that the moist air mass types within the growing season will have higher T
E, while the dry air mass types will have lower T
E. In addition, generally T
E would be higher compared to air temperature.
Figure 2 presents T
E and air temperature from a Kentucky Mesonet station during the growing season of 2014 where T
E is consistently higher than air temperature. Day-to-day variations in T
E are largely linked to humidity of the air mass. Thus, among others, the novelty of this research lies in the fact that it quantified magnitudes of T
E for different air masses during the growing season and inter- and intra-seasonal variations of T
E. Other research findings include determination of dominant air mass types that correspond to high and low T
E values for different years and within the growing season of the study region.
This research recognizes that land use and land cover affects the heat and moisture budgets and influences TE. In other words, TE at a location could be the result of large-scale moisture advection and local contribution via moisture recycling. For the latter, vegetation can play an important role by transferring moisture through evapotranspiration. However, the objective of this research is to quantify TE for different air mass types throughout the growing season and not quantify relative contribution of large-scale moisture advection and contribution from local moisture sources.
The data and methods used in this study are described in
Section 2. The results and discussion are presented in
Section 3, followed by the conclusions in
Section 4.
4. Conclusions
The assessment of climate variability and change has largely focused on air temperature as the primary metric [
1]. Research suggests that the air temperature alone is an inadequate metric of near-surface heat content, as it does not account for the changes associated with moisture content variations. We suggest that equivalent temperature (T
E), which incorporates both the dry and moist heat content, is a better indicator of overall heat content. In this paper we investigate and quantify intra-seasonal and inter-annual variations of growing season T
E in the east central U.S. This research explains some of the causes of these variations by examining the influence of different air mass types.
Daily TE and air mass (using the Spatial Synoptic Classification) data between 2010 and 2014 for 10 Mesonet stations were analyzed to examine how different air mass types influenced equivalent temperature. These 10 stations and their data were selected from a set of data from 33 stations. An analysis of variance (ANOVA) on all the air mass types yielded statistically significant variations among TE values and these differences varied intra-seasonally and inter-annually. The results suggest that TE changed under different air mass types as well as in different times of the seasons. From the results and analysis, it can be inferred that the intra-seasonal and inter-annual variations in TE in the study region and period were influenced by the major air mass types, and there were links between changes in and magnitudes of TE to intra-seasonal air mass differences.
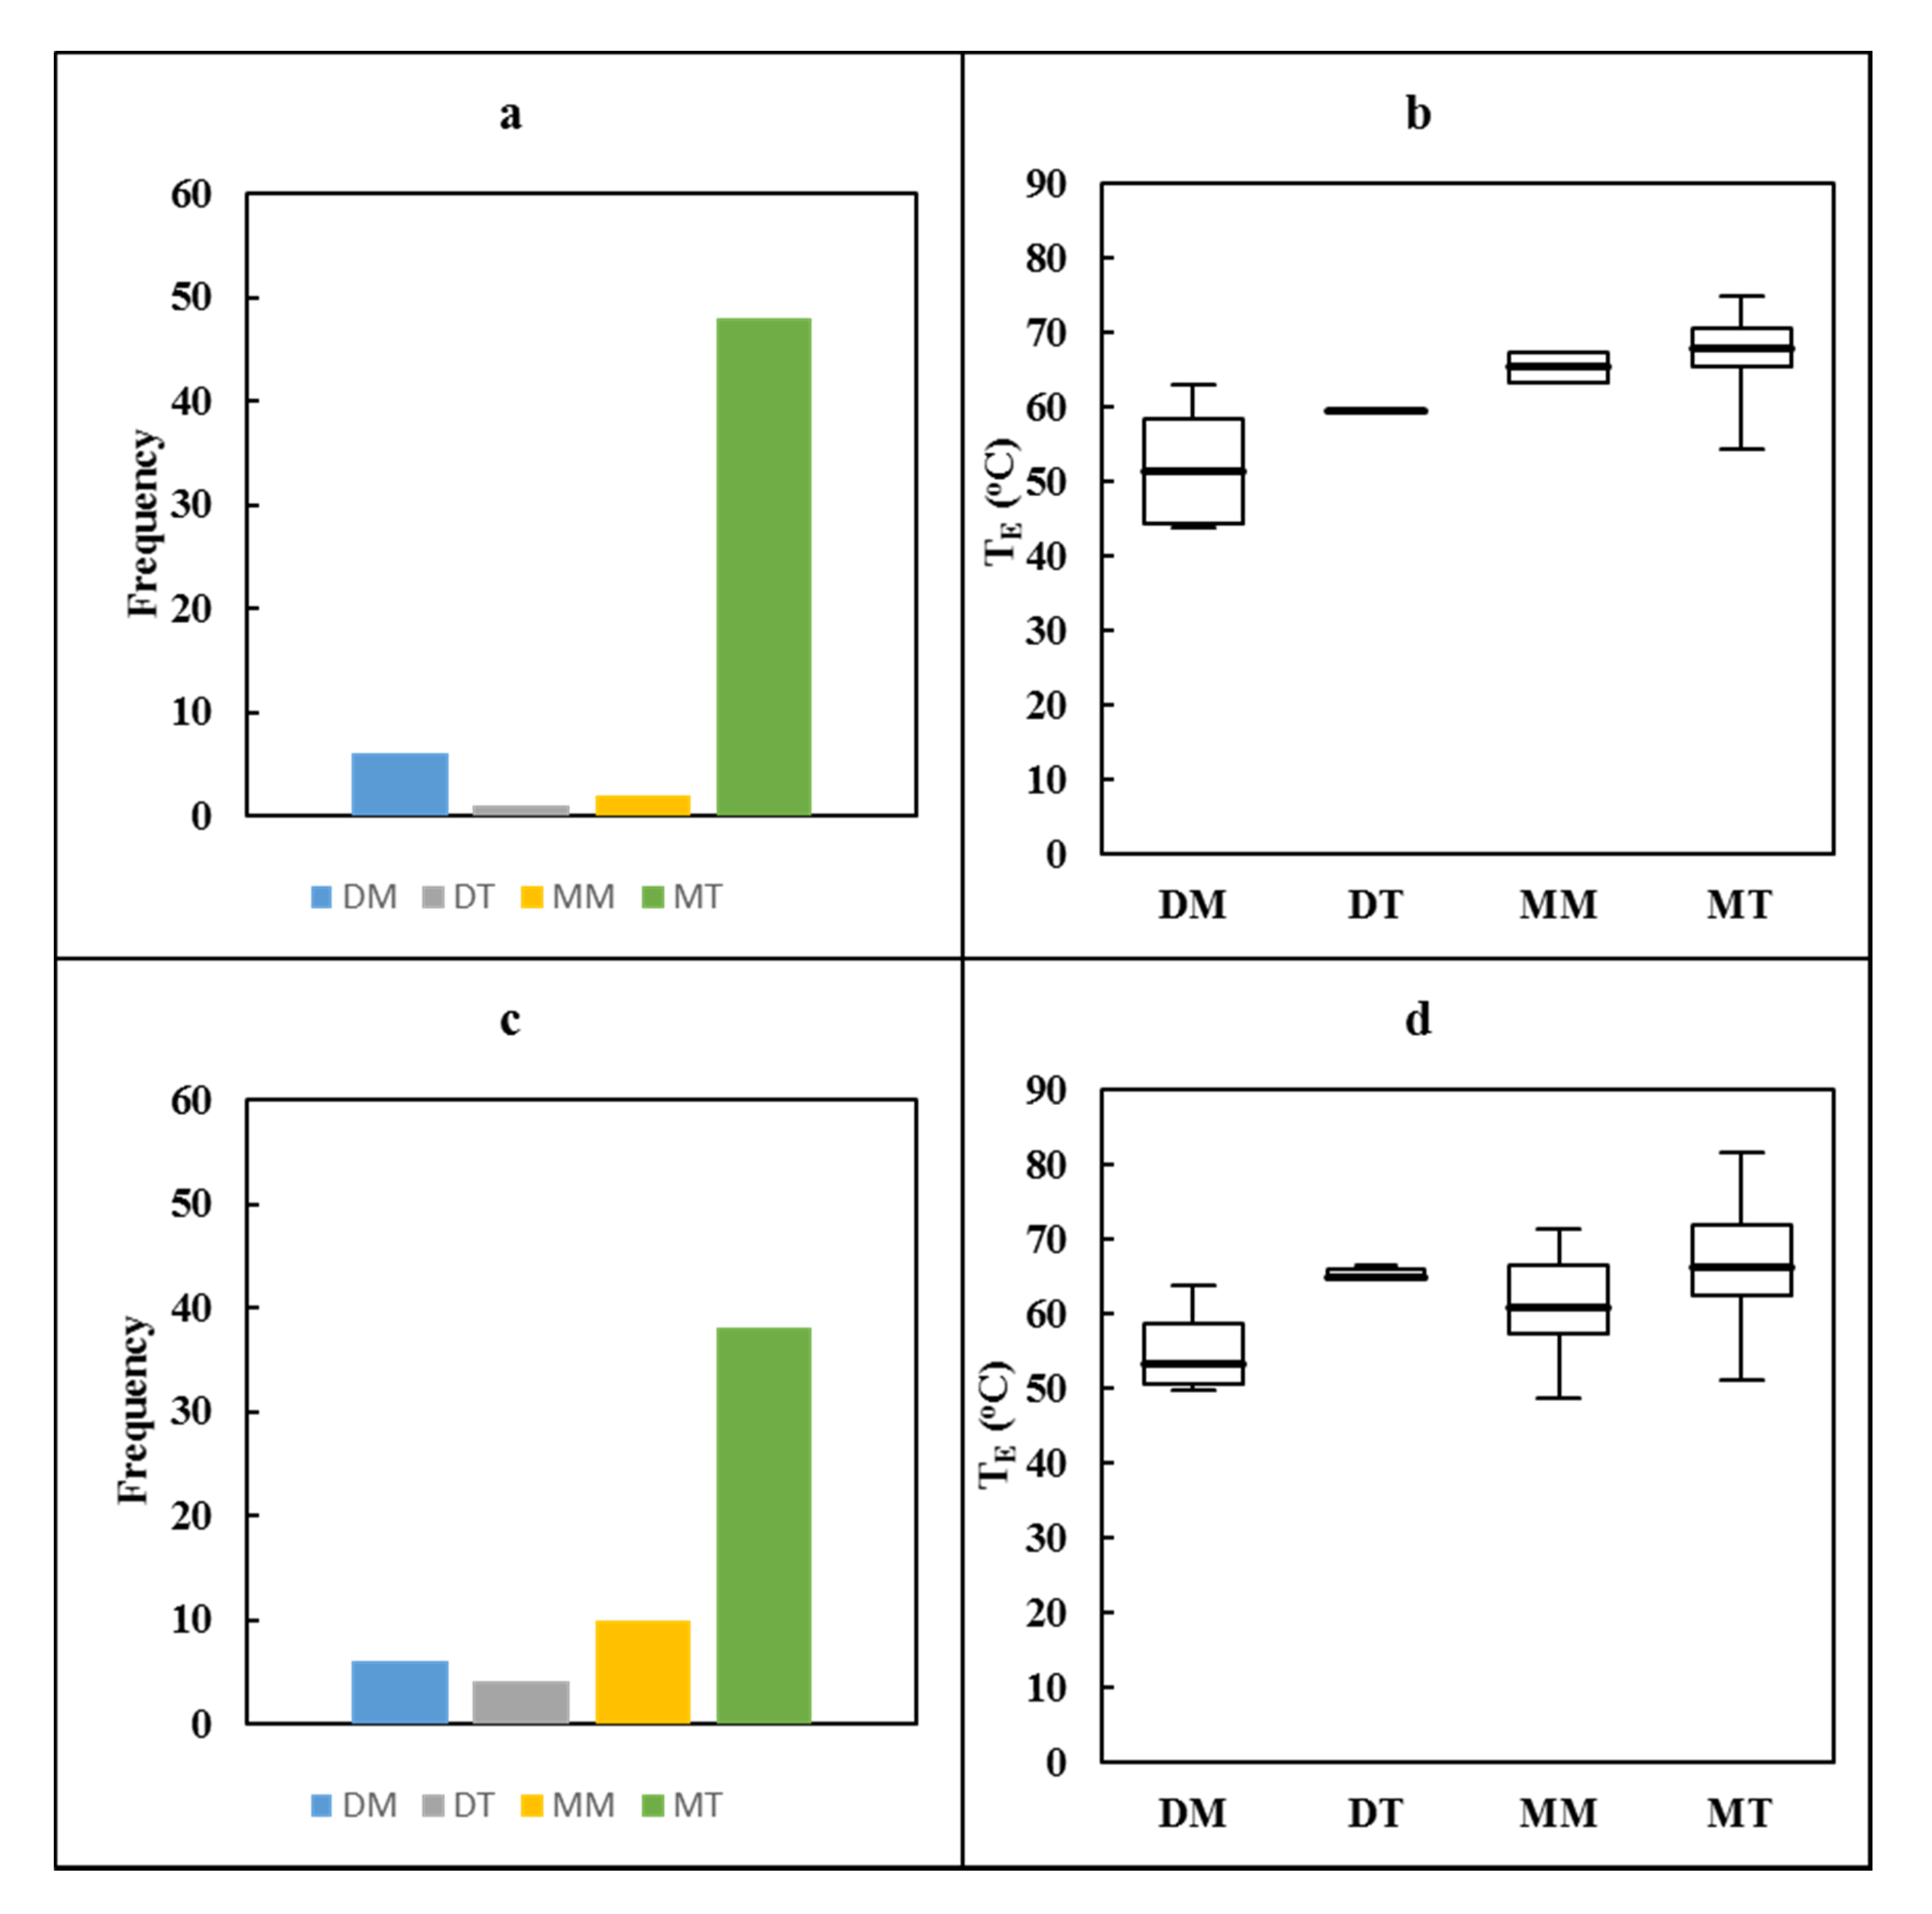
Results indicated that the growing season was dominated by the MT air mass for all stations for the years 2010, 2011, 2013, and 2014. In 2012, the DM dominated the growing season for all stations except for the Barren County Mesonet station. The highest TE values were expected to be influenced most by the MT air mass. As the season transitioned into the mid-growing season (June and July), occurrences of high TE values corresponded with the higher frequency of moist air mass (MT) occurrences. In the late growing season (August and September), TE values began to decline. This is mainly due to the changes in season and synoptic weather pattern and related changes in air mass types, and also due to declining plant water requirement and evapotranspiration.
Finally, differences between T
E and T in the early growing season were smaller. Days with low T
E were also characterized by dry air mass types and days with high T
E were typically moist and had a corresponding high T
E-T difference, especially in the mid-growing season. In short, based on the findings of this study [
7], we suggest that future research could focus on moisture budget analysis to shed further light on the contributions of various moisture sources to T
E. In particular, future investigations may quantify relative contribution of different air masses and various types of land use land cover to T
E.


