Article

Study on RP-3 Aviation Fuel Vapor Concentration

1
Jiangsu Key Laboratory of Process Enhancement and New Energy Equipment Technology, School of Mechanical and Power Engineering, Nanjing Tech University, Nanjing 211816, China
2
College of Aerospace Engineering, Nanjing University of Aeronautics and Astronautics, Nanjing 210016, China
3
Nanjing Engineering Institute of Aircraft Systems, Aviation Industry Corporation of China, Nanjing 211106, China
*
Authors to whom correspondence should be addressed.
Aerospace 2023, 10(6), 497; https://doi.org/10.3390/aerospace10060497
Submission received: 27 March 2023 / Revised: 23 May 2023 / Accepted: 23 May 2023 / Published: 24 May 2023

Abstract

:
Fuel vapor concentration is a key parameter for assessing the flammability of aircraft fuel tanks. However, the current research on RP-3 (Rocket Propellant-3) fuel vapor concentration is inadequate. This study categorizes fuel components by the number of carbon atoms and utilizes Raoult’s law to estimate the gas–liquid equilibrium relationship of each constituent element under equilibrium conditions. The equilibrium-state model is experimentally validated, and the differences in the constituents and fuel vapor concentrations of RP-3 and Jet-A (Jet Fuel-A) fuels are analyzed. In addition, an empirical correlation between the overall hydrocarbon concentration of RP-3 fuel vapor and the temperature and pressure in the equilibrium state is established, providing a theoretical basis for determining RP-3 fuel vapor concentration in related investigations. Furthermore, a transient prediction model of fuel vapor concentration is developed using the lumped parameter approach that considers the heat exchange among the fuel, gas, wall, and environment. The model’s accuracy is confirmed by comparing it to existing literature. Then, the temperature and fuel vapor concentration variation patterns in the fuel tank are calculated and evaluated under two typical flight scenarios. The results show a significant difference between the calculated fuel vapor concentration values obtained through equilibrium-state and transient models. Therefore, in the design of fuel vapor catalytic inerting systems, it is crucial to consider both the equilibrium and transient fuel vapor concentration values rather than relying solely on the former. Throughout the flight envelope, gas phase and fuel phase temperatures in RP-3, Jet-A, and C10H22 fuel tanks exhibit minimal differences. However, significant variations in fuel vapor concentration exist depending on the flight state and envelope. Hence, regarding RP-3 as equivalent to C10H22 is inappropriate. Additionally, fuel vapor concentration is a more suitable metric than fuel temperature for assessing fuel tank flammability.

1. Introduction

Aircraft fuel tanks house a substantial volume of aviation fuel, posing a significant threat to flight safety. As per records, 18 incidents of fuel tank explosions have occurred in transport aircraft, resulting in a total of 542 fatalities in the last 50 years [1,2,3]. In July 1996, 12 min after the take-off of Boeing 747 aircraft TWA800, the fuel vapor in the central wing fuel tank combusted and exploded, leading to the deaths of all 230 crew members [4,5,6]. This occurrence spurred the FAA (Federal Aviation Administration) to issue a set of amendments, advisory notifications, and airworthiness regulations, which necessitate the implementation of effective measures to minimize the ignition source or fuel vapor concentration, thereby reducing fuel tank flammability in transportation aircraft [7,8].
The FAR 25.981 airworthiness regulations require that the average flammability exposure time of each fuel tank must not exceed 3% of the flammability exposure assessment time. The criterion for evaluating flammability is whether the maximum temperature of the fuel tank system is lower than the expected minimum spontaneous combustion temperature while keeping a safety margin. In this evaluation standard, temperature is only an indirect criterion for assessing the fuel tank’s flammability. The core of the standard is that there is a certain linear relationship between temperature and fuel vapor concentration, and determining the temperature can determine the fuel vapor concentration, which is the direct criterion for flammability assessment. However, due to the diverse components and physicochemical properties, the fuel vapor concentration of various aviation fuels differs [9,10,11], and Wang’s research has shown that different aviation fuels have considerably varying flammability limits [12]. Therefore, fuel vapor concentration is a crucial parameter in determining fuel tank flammability, and it can also provide a theoretical basis for aircraft airworthiness forensic assessments.
There have been numerous research reports on the calculation and experimentation of fuel vapor concentrations for JP-8 and Jet-A fuels. Shepherd et al. established a relationship between the flash point and fuel composition of Jet-A fuel [13]. Woodrow et al. conducted experimental measurements of the fuel–air ratio (FAR) and molar concentration of Jet-A fuel vapor when the fuel tank was positioned at 14,000 feet, the explosion height of TWA800. The findings indicated that these values fell within the flammable range [14]. Ochs carried out experimental research on the fuel vapor concentration of JP-8 using a heated aluminum fuel tank to simulate different environmental conditions. The experimental results verified the calculation model proposed in the paper, showing that the proposed model could accurately predict the fuel vapor concentration and its changing law under varying environmental conditions [15]. Summer investigated the effect of the fuel loading rate on the vapor concentration in the fuel tank ullage. The results demonstrated that the fuel loading rate did not impact the final fuel vapor concentration but affected the time required to reach the equilibrium state [16]. Polymeropoulos et al. developed a calculation model for Jet-A fuel vapor concentration and verified the calculation model through experimental data. Nevertheless, the calculation parameters were discrete and could not describe the real change rule of fuel vapor concentration during continuous flight, and the heat transfer model was relatively simple, without considering the heat transfer between the external environment atmosphere and the tank wall during flight [17]. Therefore, further research is needed to establish a more accurate and comprehensive fuel vapor concentration prediction model.
However, a small amount of research has been conducted on RP-3 aviation fuel regarding fuel vapor concentration. Previous studies often relied on saturated fuel vapor pressure to calculate the fuel vapor concentration, but this method fails to account for the time required for the fuel vapor to reach equilibrium and the constantly changing environmental conditions in the fuel tank. Thus, in theory, the actual fuel concentration should be lower than the calculated value. Additionally, RP-3 has often been simplified as a single-component C10H22 in inerting system research, which does not accurately reflect its actual composition [18]. As a result, there is currently a dearth of basic RP-3 fuel vapor concentration data available for fuel tank flammability analysis.
This study selects the typical aviation fuels RP-3 and Jet-A as the research objects. Firstly, the differences in their respective components are compared, and the concentration of each component in the gas–liquid under the equilibrium state is calculated using Raoult’s law. Then, all components are converted to the total hydrocarbon concentration based on C3H8, and an empirical correlation between the total hydrocarbon concentration of RP-3 fuel and temperature and pressure is established. Additionally, a transient heat and mass transfer model is established considering the heat exchange between the fuel tank and the environment, which can calculate the fuel tank temperature and multicomponent fuel vapor concentration during flight using the lumped parameter method. The variation of temperature and total hydrocarbon concentration in the fuel tank with flight time is derived to provide a theoretical basis for assessing fuel tank flammability.

2. Fuel Vapor Concentration Study in the Equilibrium State

2.1. Fuel Composition and Calculation Model

The composition of aviation fuels varies depending on the type and the batch. RP-3 fuel is a mixed hydrocarbon fuel consisting mainly of C5-C20 hydrocarbons, which include linear alkanes, cycloalkanes, aromatic hydrocarbons, and olefins. Alkanes constitute the largest proportion, followed by aromatic hydrocarbons and cycloalkanes, while olefins and naphthalene are present in small amounts. Table 1 illustrates the composition of RP-3 and Jet-A fuels [19,20]. The table indicates that the two fuels have significantly different compositions, resulting in different fuel vapor concentrations.
It is assumed that the fuel tank ullage contains N+1 gas components, namely, N types of n-alkanes with varying carbon atom numbers and air. The fuel compositions of RP-3 and Jet-A were obtained from literature sources [21,22] and are presented in Table 2.
According to Raoult’s law, the concentration ratio of each component in the tank ullage at equilibrium can be calculated using Equation (1).
x g i = x l i p i p       i = 1 N
where p denotes the total pressure of the fuel tank, Pa. pi denotes the partial pressure of each component in the tank ullage, Pa, and is determined using the Antoine equation as shown in Equation (2). xgi and xli denote the mole fraction of each component in the gas and liquid phases, respectively, without units.
l o g 10 p i 101325 = A B T l + D 273.15       i = 1 N
where Tl denotes the fuel temperature, K. The constants A, B, and D are determined through regression analysis based on experimental data [23], as illustrated in Table 2.

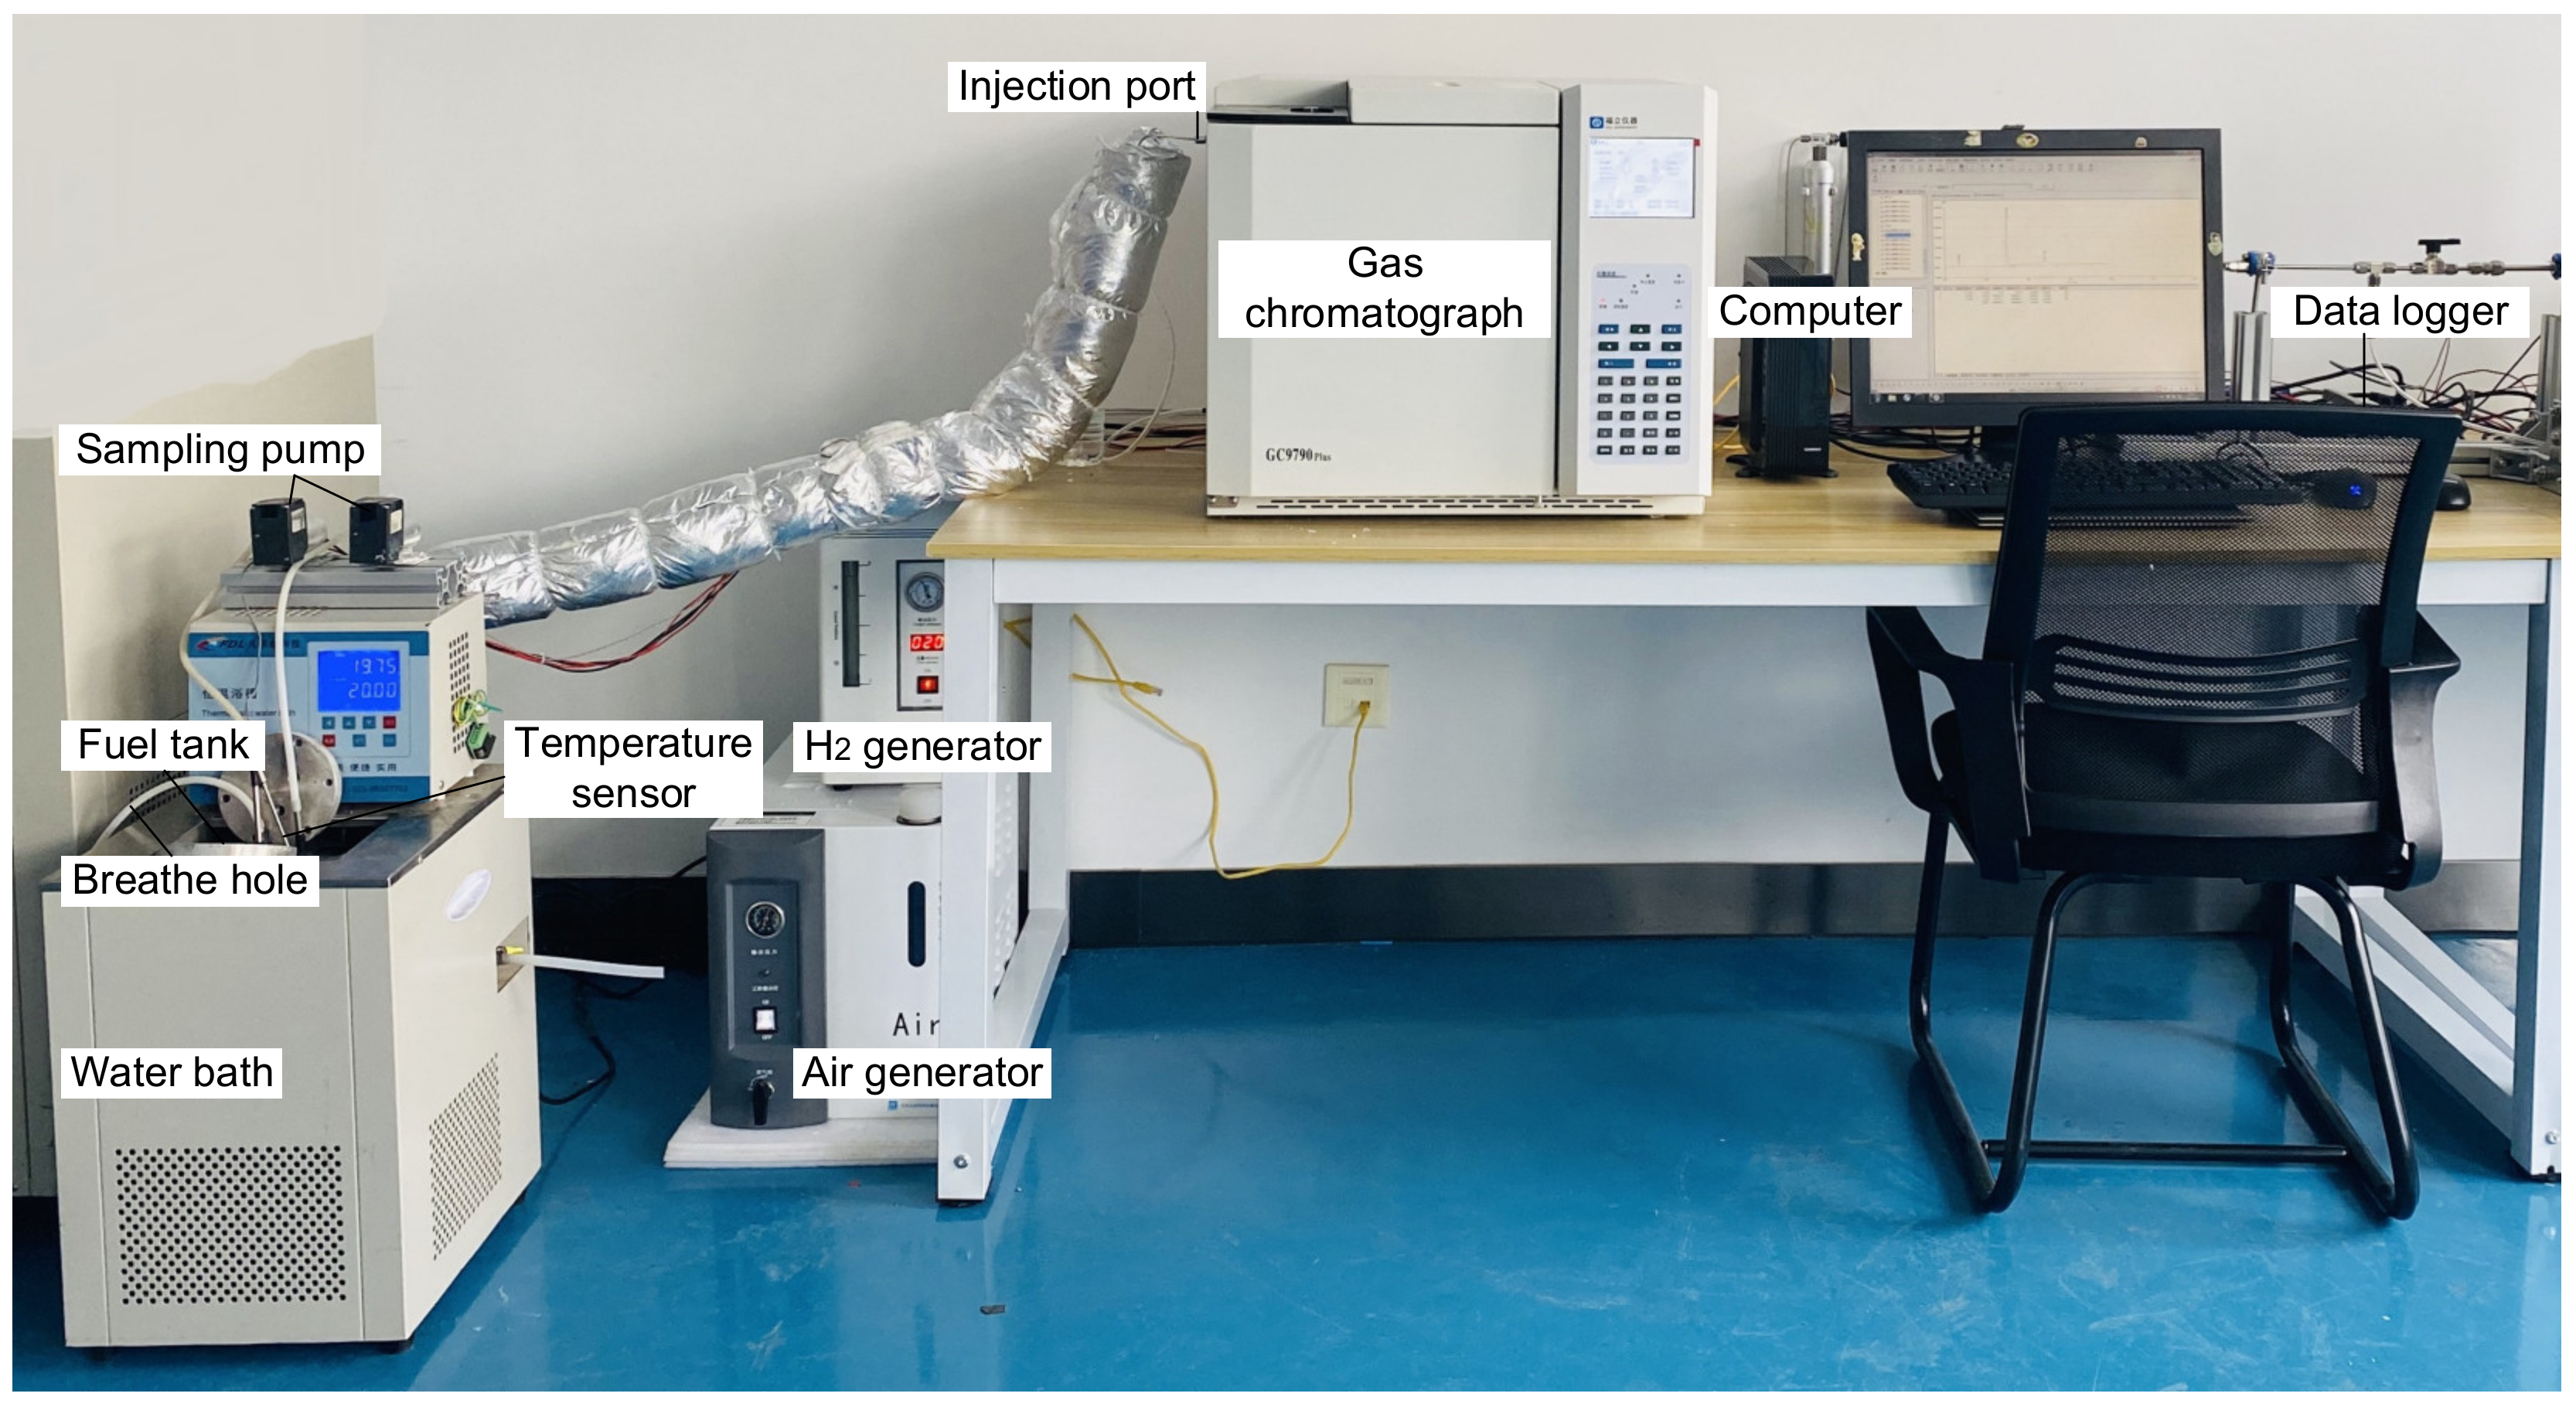
2.2. Experimental Verification

Experiments serve to verify the calculation results for fuel vapor concentration in the equilibrium state. As depicted in Figure 1, the experimental system consists of a fuel tank, a water bath, a temperature sensor, two sampling pumps, a gas chromatograph, a data logger, and a computer. The fuel tank, cylindrical in shape with a diameter of 10 cm and a length of 10 cm, is constructed from stainless steel and features two sampling ports, a temperature sensor interface, and a vent hole on its upper section. Two sampling pumps are employed to extract sample gas from two distinct locations in the tank ullage. A temperature sensor is used to measure the liquid fuel temperature, and its readings are recorded with a data collector. The H2 generator, air generator, and N2 cylinder provide fuel gas, auxiliary gas, and carrier gas to the gas chromatograph. In gas chromatography, a hydrogen flame ionization detector was used for the detector, the column was a capillary column, and the test conditions for the chromatography were set to 100 °C for the inlet, 80 °C for the column chamber, 200 °C for the detector, and 80 °C for the auxiliary oven. The calibration of the gas chromatograph was conducted using 0.1% and 1.5% C3H8 standard gases. The data logger and gas chromatograph data were recorded and processed through software installed on a computer workstation. The fundamental principle of the experiment involved placing the fuel tank in a constant-temperature water bath. After the fuel temperature remained stable for a period of 2 h, it was deemed that gas–liquid mass transfer had reached equilibrium. Sample gas was drawn from the fuel tank’s two sampling ports and sent to the chromatography to measure the fuel vapor concentration. The experiment was repeated three times, and the average value was recorded. The primary equipment and parameters utilized in the experiment are displayed in Table 3.
The specific experimental procedures are as follows:
  • Connect the experimental system and fill the fuel tank with RP-3 fuel to a fuel loading ratio of 50%, ensuring that the sampling rod port is positioned 1 cm away from the fuel surface.
  • Set the fuel temperature by adjusting the water bath temperature and heating the fuel tank until it reaches the predetermined temperature. Maintain the temperature for 2 h to ensure thermal stability.
  • Measure the fuel vapor concentration by taking three readings from each of the two sampling ports under the same fuel temperature. An interval of 1 h is provided between each measurement to ensure the fuel tank reaches a stable mass transfer state.
  • Modify the working conditions by resetting the water bath temperature and repeat step (3).
  • Upon completion of all experiments, close the water bath, and allow the fuel to cool before returning it to the fuel storage tank.
The experimental verification results are presented in Figure 2. The theoretical calculation considers the tank temperature as a fixed value, and the pressure is determined based on the measured temperature data corresponding to the ground pressure. It can be observed that within the measurement range of −20 °C to 50 °C, the relative error between the theoretical calculation and experimental data is 6.45%. This indicates that the partial pressure value pi of each component in the model is highly accurate and can be effectively employed for subsequent analyses and calculations. Nevertheless, when the temperature is either too low or too high, the error tends to increase, which may be attributed to sensor drift.

2.3. Results and Analysis

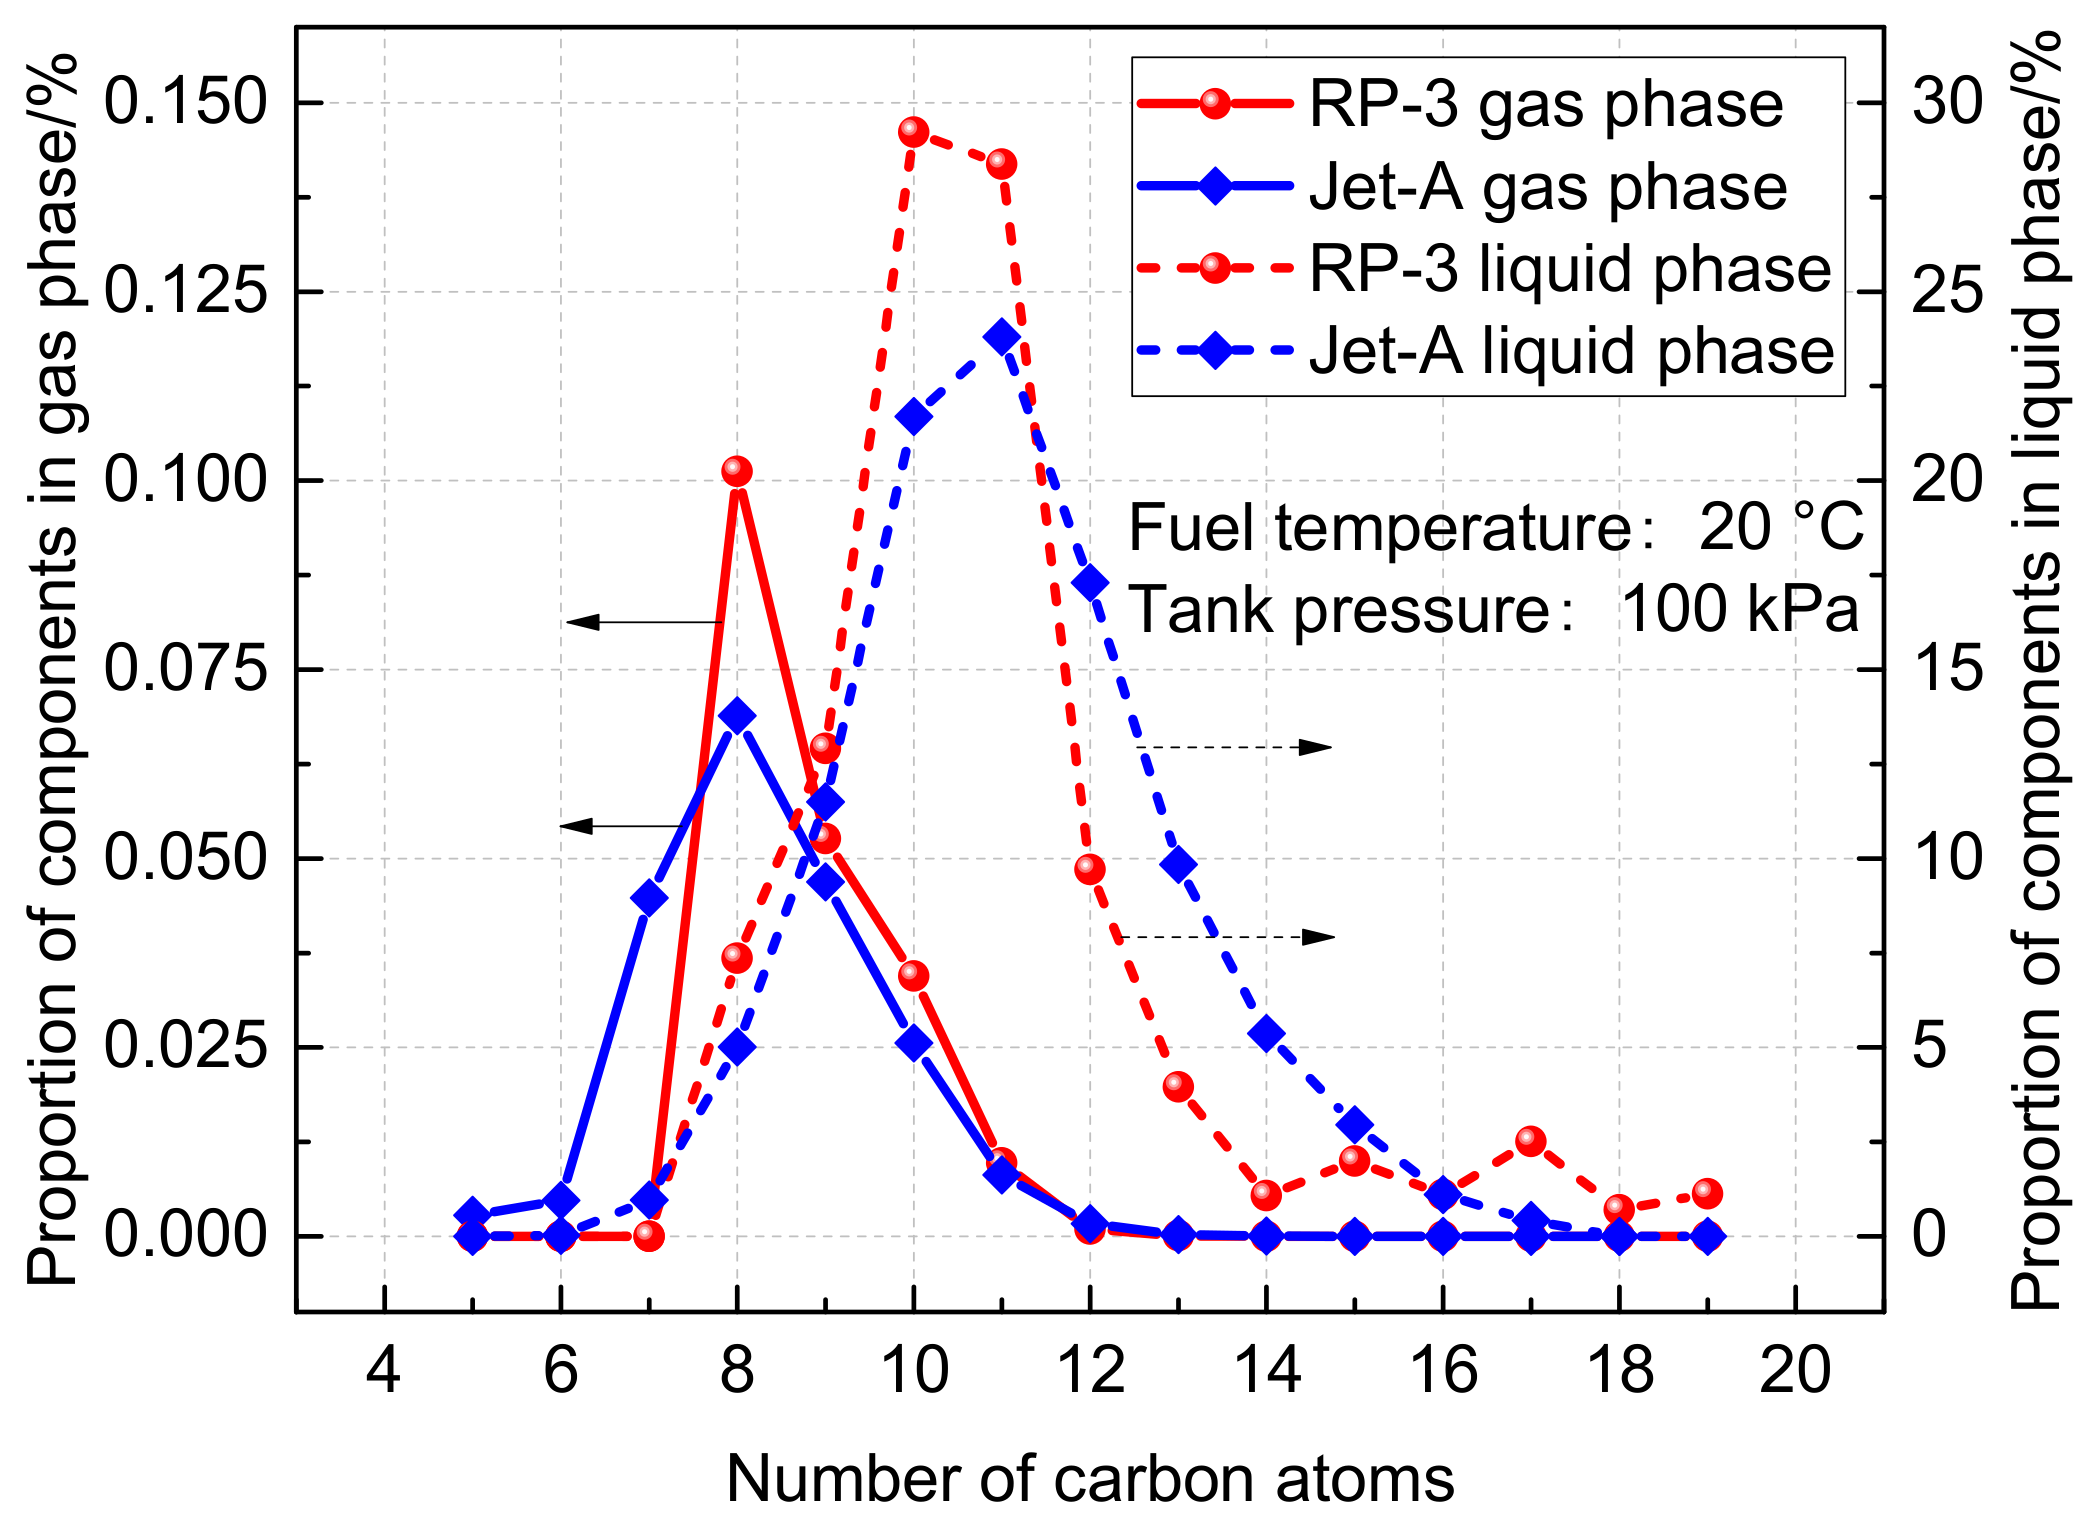
2.3.1. Composition Difference between RP-3 and Jet-A Fuels

Initially, the proportions of components present in the liquid and gas phases of RP-3 and Jet-A fuels were calculated and compared at a temperature of 20 °C and normal pressure, as illustrated in Figure 3. It can be observed that there exist noticeable differences between the proportions of gas and liquid phases. In the case of RP-3 fuel, the maximum proportions in the liquid state correspond to C10 and C11 components. Conversely, C8 and C9 components account for the highest ratio in the gaseous phase, as these components evaporate more easily due to their lower number of carbon atoms. Furthermore, it is evident that the composition of RP-3 and Jet-A fuels are distinct. RP-3 fuel comprises compounds containing fewer carbon atoms on average than Jet-A fuel, leading to higher fuel vapor pressure. Nevertheless, the distribution of carbon atoms in both fuels lies between C5-C20 and follows similar distribution laws.

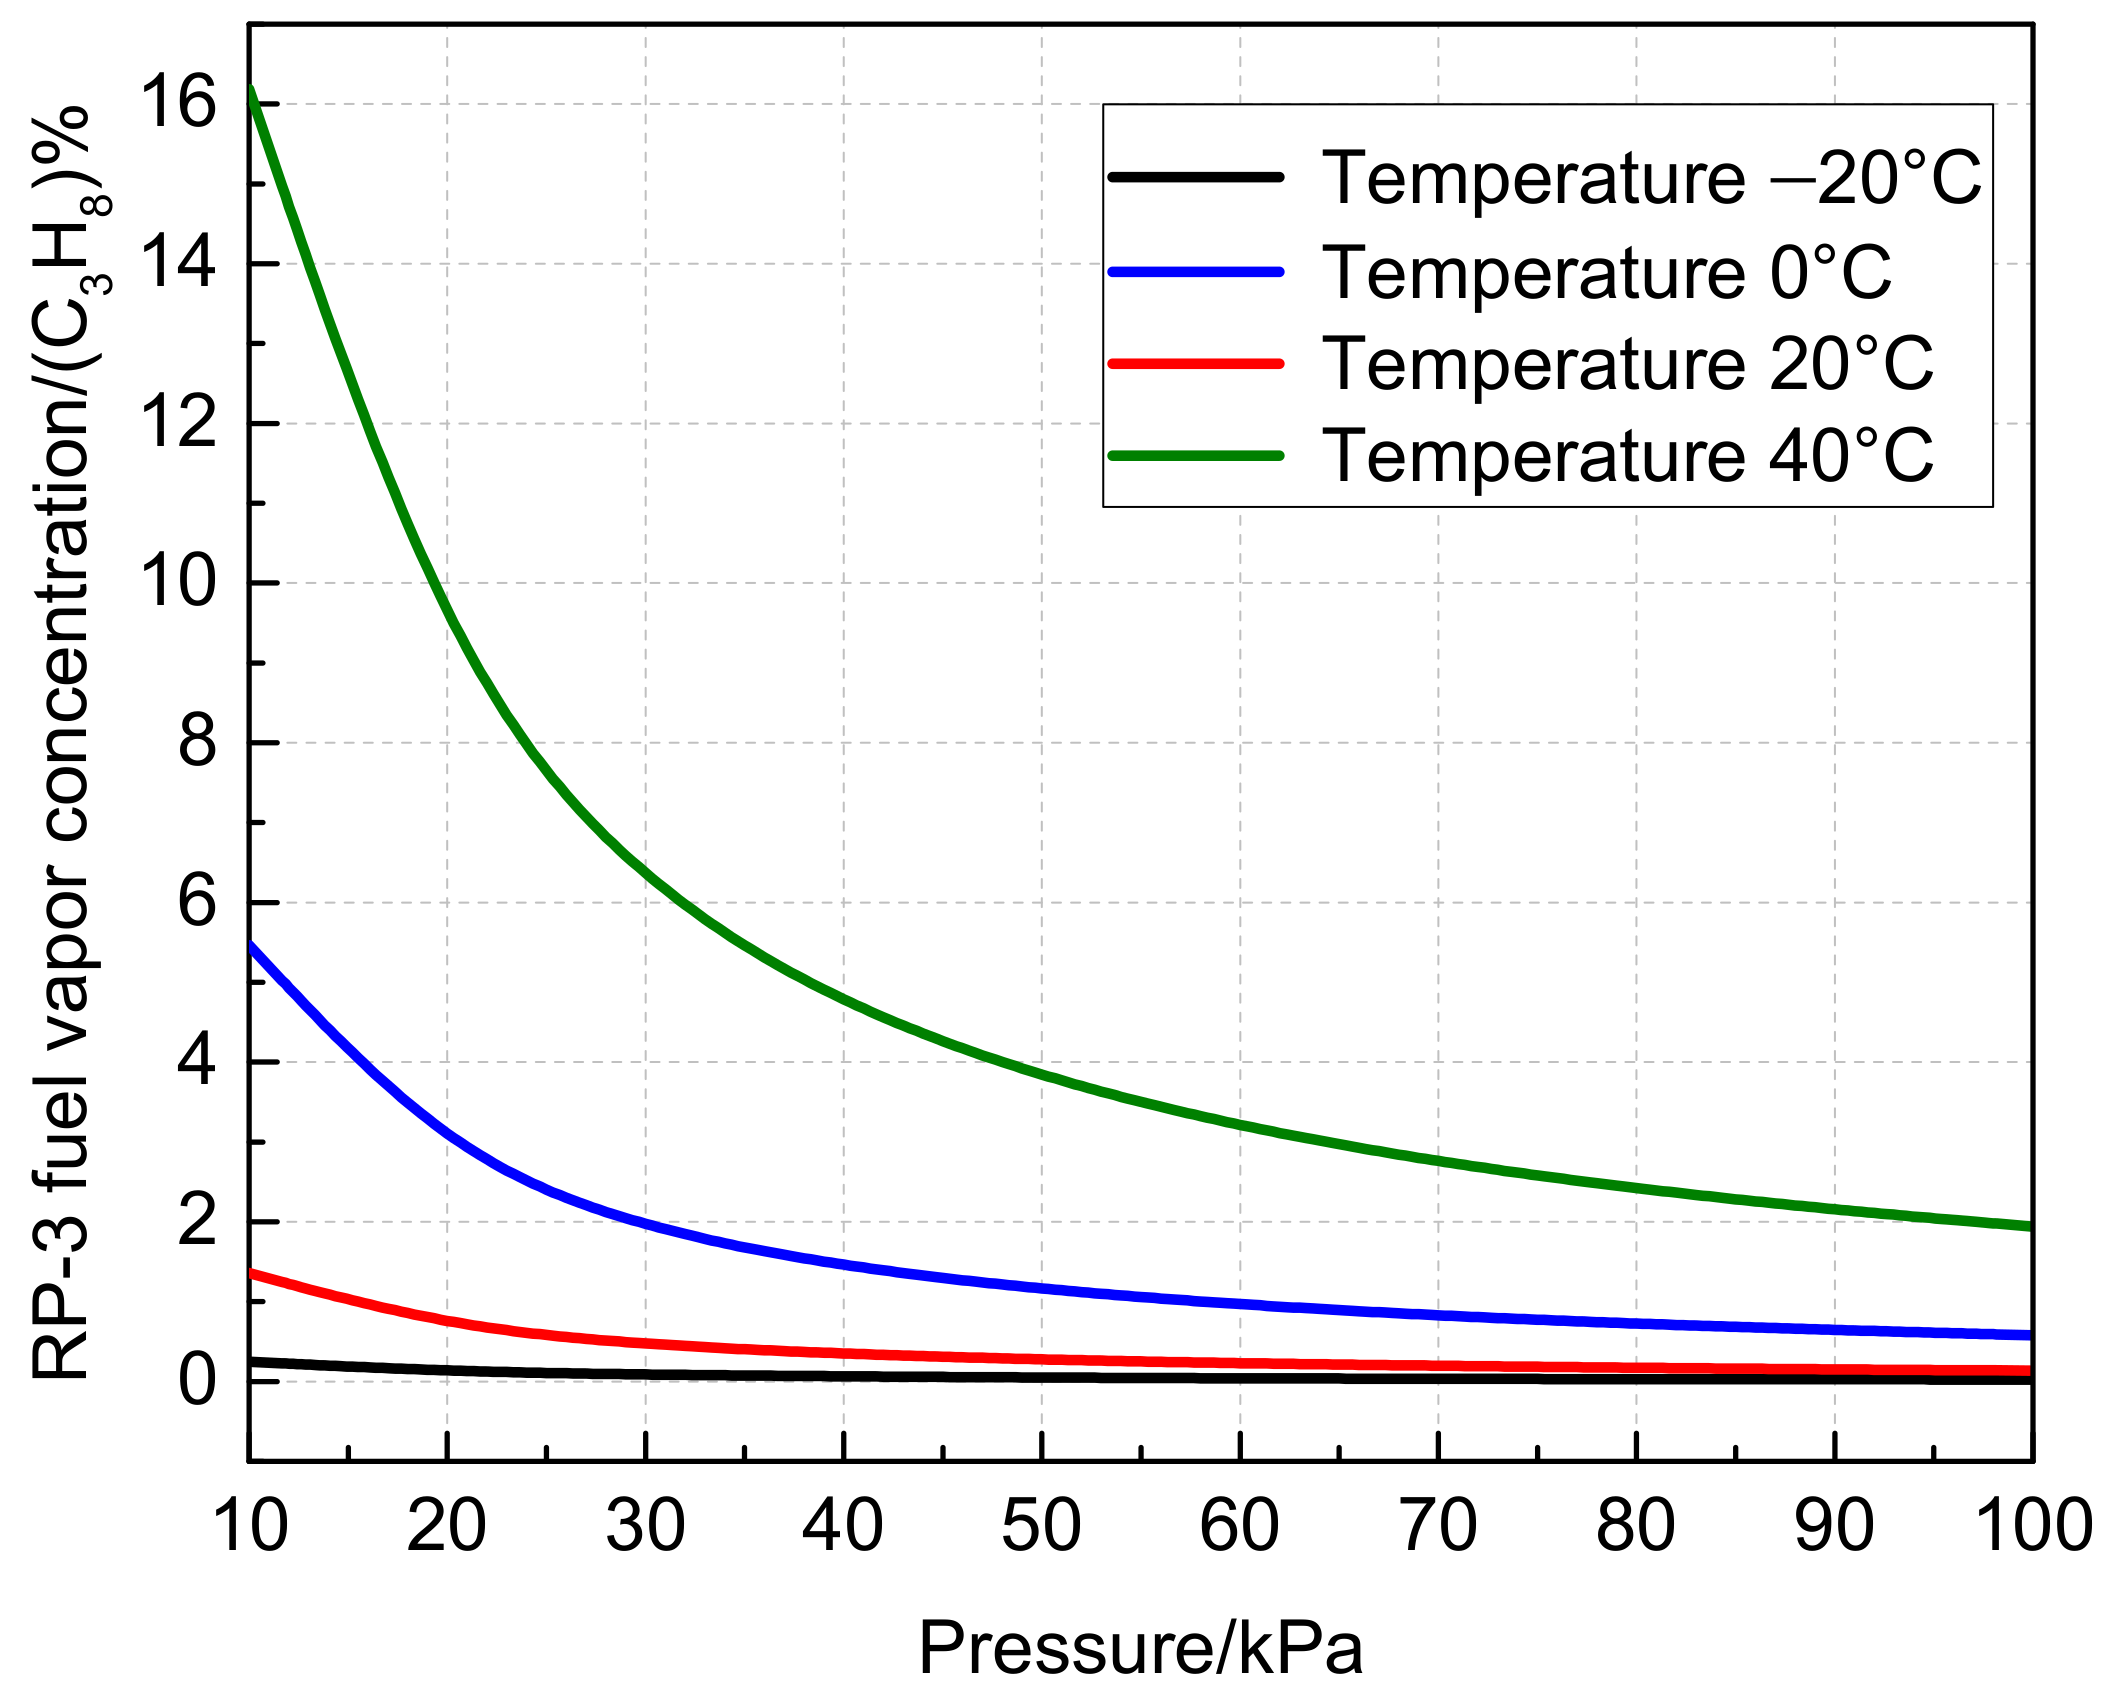
2.3.2. Influence of Temperature and Pressure

As previously mentioned, due to the complex composition of aviation fuel, calculations often use n-decane C10H22 as a substitute for the actual fuel composition [18]. Firstly, the variation in the vapor concentration of RP-3, Jet-A, and RP-3 simplified as C10H22 with fuel temperature was calculated using the equilibrium model, as depicted in Figure 4. For the sake of convenience and uniformity in comparison, based on the conservation of the total number of C atoms, the fuel vapor is converted into the total hydrocarbon concentration measured by C3H8. The vapor concentrations of RP-3 and Jet-A are similar below 0 °C. However, as the temperature exceeds 0 °C, the vapor concentration of RP-3 becomes progressively higher than that of Jet-A, and the difference becomes increasingly significant with increasing fuel temperature. For instance, the vapor concentration of RP-3 fuel is 1.25 times that of Jet-A when the fuel temperature is 40 °C. Furthermore, it is apparent from Figure 4 that the vapor concentration calculated using C10H22 differs significantly from that of RP-3 and Jet-A fuels. The deviation of using C10H22 to simulate RP-3 fuel changes with temperature, and the difference becomes more significant with increasing temperature, although the relative error becomes smaller. When the temperature is 40 °C, the deviation is 21.19%. When comparing the C10H22 calculation result with Jet-A, the fuel vapor concentration of Jet-A is higher than that of C10H22 when the fuel temperature is lower than 40 °C. However, the opposite is true when the fuel temperature is higher than 40 °C. Nonetheless, the error is generally smaller than that of RP-3 fuel.
Furthermore, Figure 5 presents the calculated fuel vapor concentration under different temperatures and pressures in the equilibrium state. It is observed that the fuel vapor concentration increases with increasing temperature and decreasing pressure. The empirical formula for calculating the RP-3 fuel vapor concentration as a function of temperature and pressure is derived and presented in Equation (3). The formula yields a high fitting correlation coefficient of 0.99, and the error between the fitting value and the calculated value is within 5%.
lg 10 4 C C 3 H 8 p = 219.97 2289457.36 T 10303.07
where CC3H8 denotes the total concentration of fuel vapor represented by C3H8, %. T denotes the temperature, K.

3. Fuel Vapor Concentration Study in the Transient State

Although Raoult’s law allows for the quick calculation of fuel vapor concentration under equilibrium conditions, practical applications require consideration of the aircraft’s constantly changing flight conditions, which prevent the fuel tank from reaching equilibrium. Therefore, it is essential to develop a transient prediction model for the fuel vapor concentration in the fuel tank ullage.

3.1. Transient Mathematical Model

3.1.1. Model Assumptions

This model is developed based on the following assumptions:
(1)
The gas in the fuel tank ullage is assumed to be uniformly mixed and treated as an ideal gas, while aviation fuel is treated as an incompressible fluid.
(2)
All radiation effects, including solar radiation, ground radiation, and radiation from the fuel tank wall, are neglected.
(3)
Trace gases, such as carbon dioxide and water vapor, are disregarded in both the air and fuel.
(4)
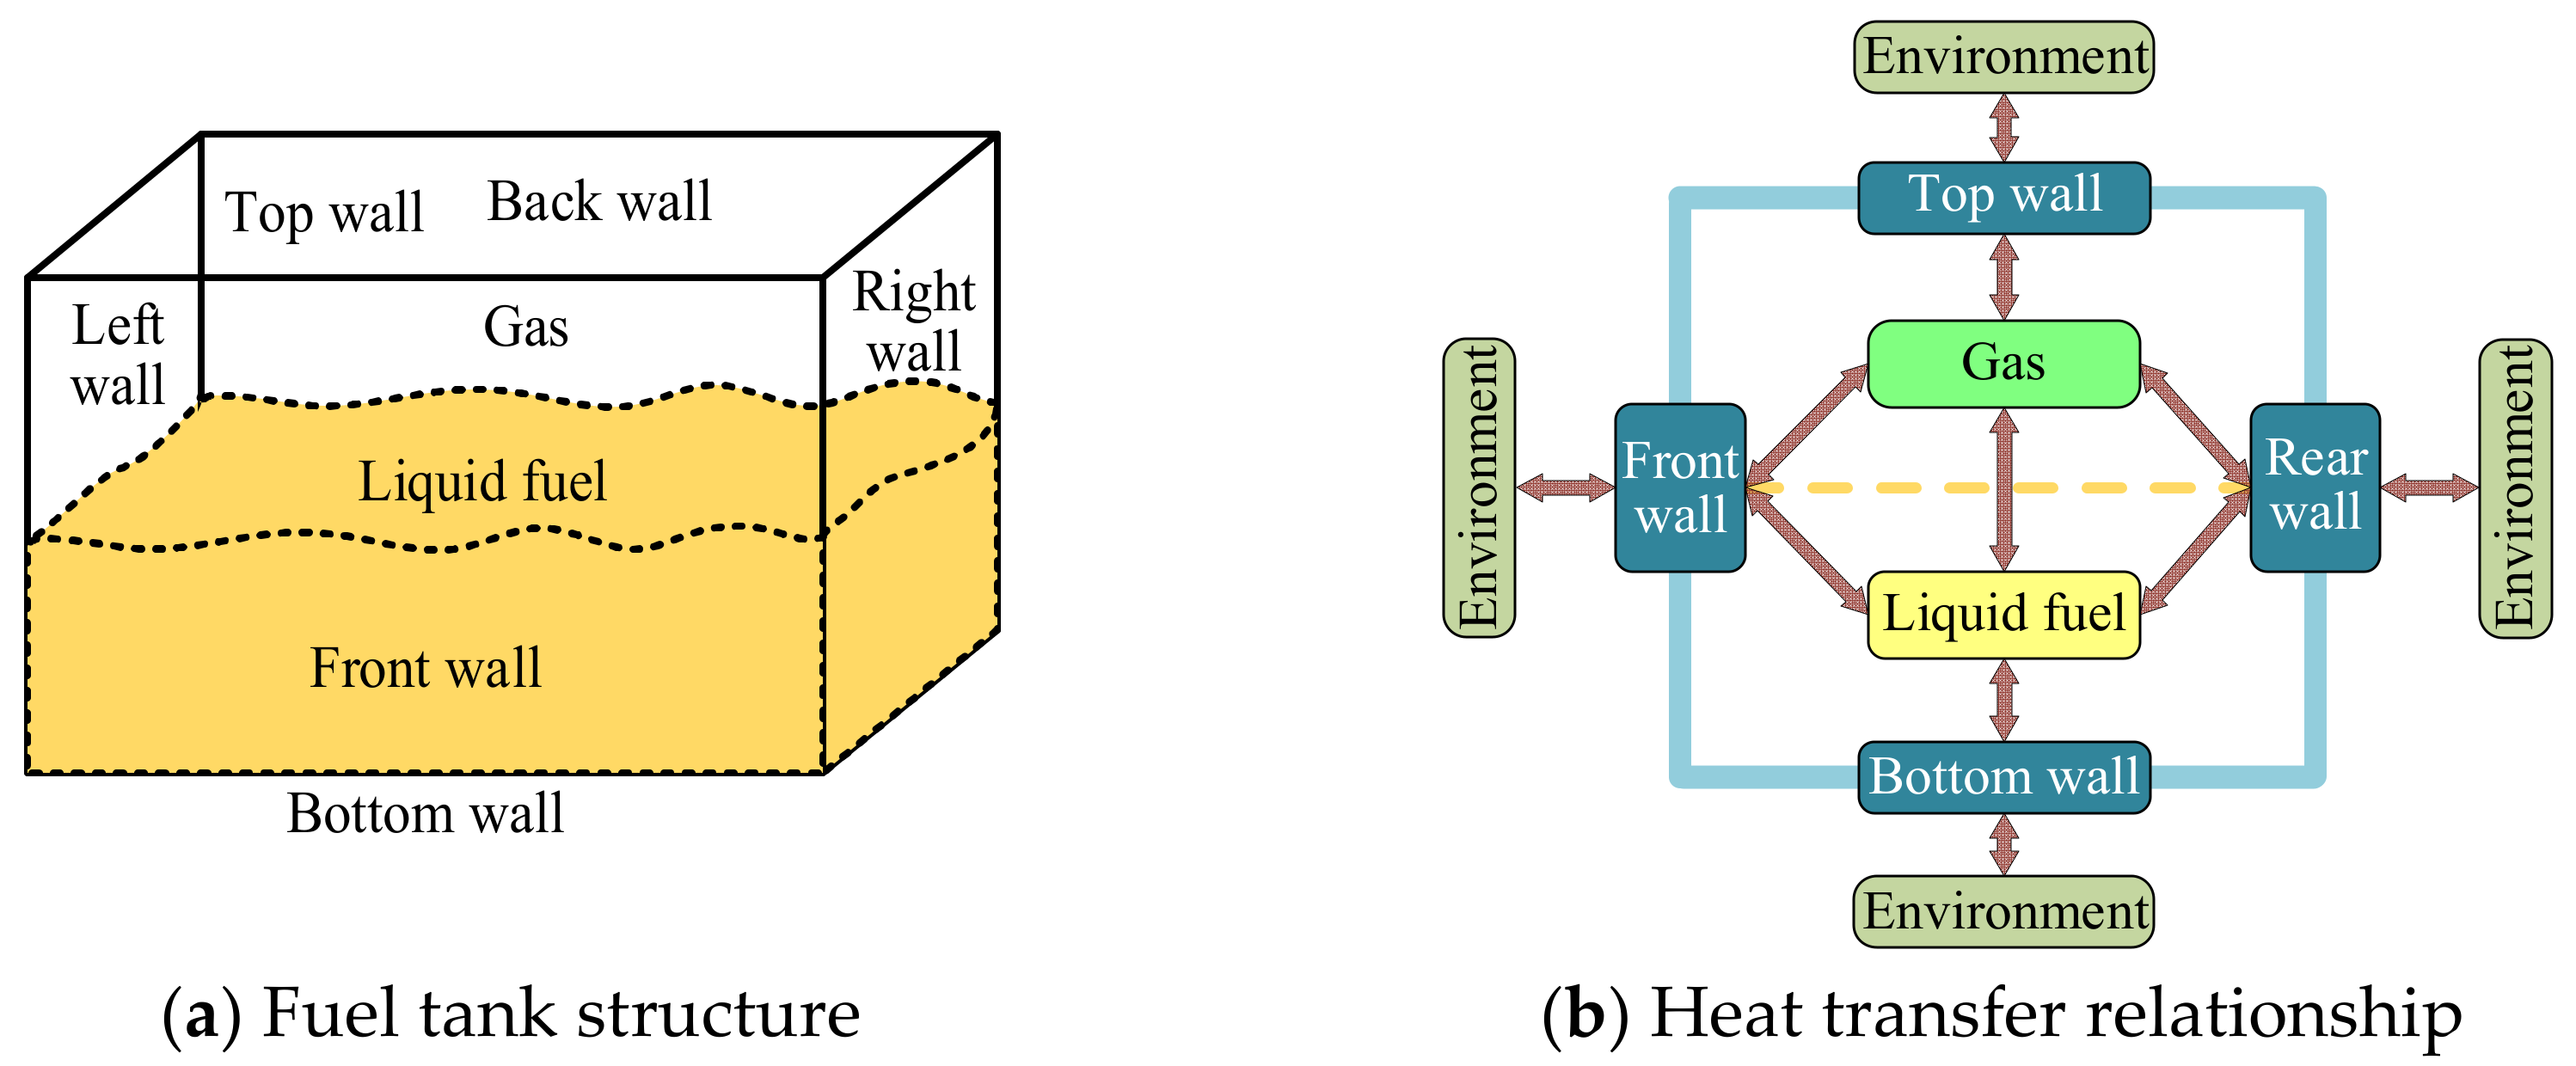
The fuel tank size is assumed to be 1 m × 1 m × 1 m.
(5)
The fuel tank is considered a lumped heat capacity system, meaning that the internal thermal resistance of the object can be ignored compared to the thermal resistance of convection heat transfer.
(6)
The relationship between temperature and pressure with flight altitude is based on reference [24]. Moreover, the total temperature of the external environment after aerodynamic heating is determined by the following equation:
T e = T out + 372 ( 1 + κ 1 2 M a 2 ) 273.15
where Te denotes the total ambient temperature after aerodynamic heating, °C. Tout denotes the ambient atmospheric temperature, °C, and κ denotes the isentropic index, with a value of 1.4. Ma denotes the Mach number of the aircraft.

3.1.2. Heat Transfer Model

In this study, the fuel tank was discretized into six nodes, i.e., the top, bottom, front, and rear tank wall nodes, a gas node, and a fuel node. As illustrated in Figure 6, convective heat transfer was conducted between these nodes. Considering that the left and right walls of the fuel tank are in contact with other fuel tanks, they were treated as adiabatic walls. With the use of the lumped parameter method, non-equilibrium equations were established at different nodes, and the heat conduction in each fuel tank wall was neglected.
Based on the conservation of energy law and the heat transfer relationship illustrated in Figure 6b, the total heat transfer of the top wall can be expressed as the sum of the convective heat transfer between the wall and the external air and the convective heat transfer between the wall and the internal mixed gas. The non-equilibrium state equation can be formulated as follows [25,26]:
d ( m t c p T t ) d t = h a _ t A t ( T e T t ) + h g _ t A t ( T g T t )
In a similar vein, the non-equilibrium heat transfer equations for the bottom wall, front wall, and rear wall can be expressed as follows:
d ( m b c p T b ) d t = h a _ b A b ( T e T b ) + h l _ b A b ( T l T b )
d ( m f c p T f ) d t = h a _ f A f ( T e T f ) + h g _ f ( A f A x ) ( T g T f ) + h l _ f A x ( T l T f )
d ( m r c p T r ) d t = h a _ r A r ( T e T r ) + h g _ r ( A r A x ) ( T g T r ) + h l _ r A x ( T l T r )
The heat transfer equation of the liquid fuel is modified to incorporate the heat change resulting from fuel evaporation and condensation, as well as the heat generated by the internal heat source, as follows:
d ( m l c p , l T l ) d t = h l _ b A b ( T b T l ) + h l _ f A x ( T f T l ) + h l _ r A x ( T r T l ) + h l _ g A u ( T g T l ) m ˙ e h e m ˙ e c p , l T l + m ˙ c c p , g T g + Q i n
The heat transfer equation of the liquid fuel also incorporates the heat change resulting from fuel evaporation and condensation, as well as the heat generated by the internal heat source:
d ( m g c p , g T g ) d t = h g _ t A t ( T t T g ) + h g _ l A t ( T l T g ) + h g _ f ( A f A x ) ( T f T g ) + h g _ r ( A f A x ) ( T r T g ) + m ˙ e c p , l T l + m ˙ c h c m ˙ c c p , g T g + m ˙ o c p , a T out
where t denotes time, s. mu, mb, mf, mr, ml, mg denote the mass of the top, bottom, front and back walls, fuel, and gas in the fuel tank, respectively, kg. m ˙ e , m ˙ c , m ˙ o denote the mass flow rates of fuel vapor evaporation, fuel vapor condensation, and gas exchange between the fuel tank and the environment, respectively, kg/s. cp, cp,l, cp,g, cp,a denote the specific heat capacities of the tank wall, fuel, gas in the tank ullage, and air, respectively, J/(kg·K). Tu, Tb, Tf, Tr denote the temperature of the fuel tank’s top, bottom, front and back walls, respectively, K. Tg, Tout denote the temperature of gas and outside air, respectively, K. Te denotes the total ambient temperature after aerodynamic heating, K. Au, Ab, Af, Ar denote the surface areas of the top, bottom, front, and rear walls of the fuel tank, respectively, m2. Ax denotes the contact area between the fuel and the front wall, m2. ha_t, ha_b, ha_f, ha_r denote the convective heat transfer coefficients between the outside air and the top, bottom, front, and rear walls of the fuel tank, respectively, W/m2·K. hg_t, hg_f, hg_r, hg_l denote the convective heat transfer coefficients between the gas and the top, bottom, front, rear walls, and fuel, respectively, W/m2·K. hl_b, hl_f, hl_r denote the convective heat transfer coefficients between the fuel and the bottom, front, and rear walls of the fuel tank, respectively, W/m2·K. he, hc denote the enthalpy of evaporated and condensed fuel vapor, respectively, J/kg. Qin denotes the heat source in the fuel tank, J/s.

3.1.3. Mass Transfer Model

As the fuel vapor concentration in the fuel tank ullage is relatively low, the evaporation rate of the fuel components in this study m ˙ ei can be estimated using the following equation [27]:
m ˙ ei = A l h mi ρ l y fi y gi       i = 1 N
where Al denotes the surface area of the liquid phase, m2. hmi denotes the mass transfer coefficient, m/s. ρl denotes the density of the liquid fuel, kg/m3; yfi, ygi denote the mass fractions of components on the fuel surface and in the gas phase, respectively, 1.
The mass transfer coefficient, which shares similarities with the heat transfer coefficient, can be calculated using the following formula. The Sherwood number Shi can also be represented in terms of the Nusselt number Nu:
S h i = h mi L D i = N u ( S c i P r ) 1 3       i = 1 N
In Equation (12), L denotes the characteristic length of the fuel tank, m. Di denotes the diffusion coefficient of component i, calculated using Fuller’s equation, as referenced in literature [23], m2/s.
Due to the relatively low gas convection velocity within the fuel tank, it is hypothesized that thermal convection between the gas, fuel, and tank wall is a form of natural convection. Conversely, the fuel tank wall experiences forced convection with the outside air.
The Nusselt number Nu can be calculated using the following equation in the scenario of natural convection.
N u   = 0 . 14   ( R a ) 1 3
The Nusselt number Nu can be represented as Equation (14) in the case of forced convection.
N u   = 0 . 664   R e 1 3 P r 1 3
The Schmidt number is represented as S c i = ν D i , and υ denotes the kinematic viscosity of air, m2/s. In Equation (12), the Prandtl number is represented by P r = ν α , with α representing the thermal diffusion coefficient, m2/s. Equation (13) contains the Raleigh number R a = G r P r . The Grashof number is represented as G r = g 1 ρ g ρ l ρ g L 3 ν 2 , and g′ denotes the gravitational constant, m/s2. ρl and ρg denote the densities of liquid and gas, respectively, kg/m3. The Reynolds number is represented as R e = ρ l v L μ ,and v denotes the gas flow rate within the tank, m/s, and μ denotes the dynamic viscosity, N·s/m2.
Henry’s law enables the calculation of the mole fraction x fi of component i present on the fuel surface, as follows:
x fi = x li p i p       i = 1 N
where pi denotes the component pressure of component i, Pa, which is calculated using the Wagner equation, as cited in literature [23]. p denotes the gas pressure within the fuel tank, Pa. x fi , x li denote the proportion of each component i on the fuel surface and in the liquid phase, respectively.
The mass fraction of component i present on the fuel surface yfi can be determined from the mole fraction calculation.
y fi = x fi M i x fi M i       i = 1 N + 1
The density of liquid fuel ρl can be calculated using the following equation:
ρ l = x li M i x li M i ρ ¯ li       i = 1 N
where ρ ¯ li denotes the density of component i.
Considering the tank ullage as the control volume, the mass conservation equation can be expressed as follows [28]:
d m i d t = m ˙ ei m ˙ ci + m ˙ oi       i = 1 N + 1
The gas within the system follows the ideal gas equation of state:
m i = x gi M i p V g R ¯ T g       i = 1 N + 1
where mi denotes the mass of component i, kg/s. x gi denotes the proportion of each component i present in the gas phase. Vg denotes the gas phase volume within the fuel tank. R ¯ denotes the average gas constant, J/(mol·K).
m ˙ oi M i = 1 M i m ˙ ei m ˙ ci + m i p dp dt m i T g dT g dt       i = 1 N + 1
The concentration of all hydrocarbon components that have been converted to C3H8 can be expressed as follows:
C 3 H 8 % = 10 4 M 3 y fi C i M i       i = 1 N
where M denotes the total molar mass of the mixed gas, kg/mol.

3.2. Model Verification

The present study utilized both the calculated Jet-A aviation fuel values and experimental data obtained from reference [22] to validate the proposed model. In the referenced experiment, a fuel tank with external dimensions of 0.914 m × 0.914 m × 0.610 m was placed within an environmental chamber measuring 1.83 m × 1.83 m × 2.448 m. Measurements of fuel vapor concentration in the fuel tank ullage were obtained over time, under simulated flight conditions, using a flame ionization detector and hydrocarbon analyzer. Propane was utilized as the calibration gas.
The experimental and calculated data from the literature, specifically the 80 °F, 25,000 feet, and 60% loading conditions, were utilized to verify the model proposed in this study. The environmental pressure and temperature parameters during the experiment were input into the calculation model of this paper. The results, including the calculated values of fuel vapor concentration and the gas and fuel temperatures of the fuel tank, were compared with the literature values and presented in Figure 7 and Figure 8.
Figure 7 indicates that the average error between the calculated value and the experimental value from the literature is 23.27%. Conversely, the calculated value of the proposed model in this study falls between the calculated value and the experimental value, with an average error of only 5.17% because the proposed model considers heat exchange between the fuel tank and external environment, unlike the literature. Moreover, the fuel tank temperature calculation is more precise, as shown in Figure 8, with average errors between the calculated and experimental values of 7.56% and 8.23%, respectively. In conclusion, the proposed model in this study is reliable, meets the required accuracy, and can be used for further analysis and calculations.

3.3. Results and Analysis

Using the transient calculation model described above, it is possible to calculate the temperature of the aircraft fuel tank and the concentration of fuel vapor. Additionally, the impact of the flight status on the fuel tank temperature and fuel vapor concentration can be further analyzed.

3.3.1. Effect of the Flight State on Fuel Tank Temperature

Short- and long-range flight envelopes were selected for comparative analysis using the transient calculation model described above. Table 4 provides details on the specific flight conditions considered. The fuel tank’s initial state was assumed to be at equilibrium with the environment at an ambient temperature of 30 °C.
The relationship between the fuel loading rate of two flight ranges and flight time is shown in Figure 9. It can be seen that the fuel loading rate gradually decreases with flight time, and at the end of the short-range flight, the fuel loading rate is 0.19. Although the theoretical fuel loading rate is 0 for long ranges, in reality, the fuel in other fuel tanks will flow through the center wing tank, so there is actually fuel present at the bottom layer of the center wing. Therefore, this article assumes the fuel evaporation rate during calculation is not affected by the fuel loading rate.
Figure 10 illustrates the evolution of gas and fuel temperatures for RP-3, Jet-A, and C10H22 during a short-range flight. At the start of taxiing, the gas temperature in the fuel tank increases due to the impact of aerodynamic heating. Subsequently, as the aircraft ascends, the ambient temperature gradually decreases, resulting in a decline in gas temperature until the cruising altitude is reached. The minimum gas temperature can drop to −5.77 °C. During descent, as the external temperature increases, the gas temperature also rises. The fuel temperature exhibits a similar variation trend to that of gas temperature, but its response time is delayed because of its high specific heat capacity. The minimum fuel temperature throughout the flight period is 6.73 °C. Generally, the variations in gas and fuel temperatures follow the external ambient temperature trend, albeit with a delayed response.
In addition, Figure 10 illustrates that the gas temperature and fuel temperature variation curves of RP-3, Jet-A, and C10H22 overlap. The slight differences are attributable to the distinct densities and specific heat capacities of the various substances.
Figure 11 depicts the temporal evolution of the fuel tank temperature during a long-distance flight. As the cruise time is prolonged, both gas and fuel temperatures further decline. For RP-3, the minimum gas and fuel temperatures can plummet to −13.213 °C and −13.171 °C, respectively. Remarkably, the temperature changes of RP-3, Jet-A, and C10H22 are nearly identical, primarily owing to tiny differences in their densities and specific heat capacities.

3.3.2. Effect of the Flight State on the Fuel Vapor Concentration

Figure 12 illustrates the time-varying behavior of the fuel vapor concentration for different fuel types during a short-range flight. For RP-3, both temperature and pressure reductions initially affect fuel vapor concentration, leading to a short-term fluctuation. Subsequently, temperature reduction begins to dominate, causing a gradual decrease in fuel vapor concentration, with a minimum value of 0.19% achieved at a certain altitude. As the aircraft descends, fuel vapor concentration increases due to the temperature rise. In addition, during a long-range flight, the changes in Jet-A and C10H22 fuel vapor concentrations are similar to that of RP-3, but the values of the three follow a descending order of RP-3, Jet-A, and C10H22.
Figure 13 illustrates the fuel vapor concentration variation with flight time during a long voyage. As compared to the short voyage, the fuel temperature during cruising is further reduced, leading to a decrease in RP-3 fuel vapor concentration to as low as 0.046%. The fuel vapor concentration calculated for C10H22 remains lower than that of RP-3 throughout the flight, while the Jet-A fuel vapor concentration is less than that of RP-3 only for the first 5 h. However, in the later stages of cruising when the fuel temperature is lower, the fuel vapor concentration of Jet-A is slightly higher than that of RP-3, but the difference is insignificant.

4. Discussion

This study presents a steady-state and transient calculation model for fuel vapor concentration, which can provide fundamental fuel vapor concentration data for fuel tank flammability analysis. The paper compares the differences between RP-3 and Jet-A and further analyzes the distinctions when fuel vapor concentration and fuel temperature are utilized as flammability criteria. The results provide a crucial theoretical basis for future fuel tank flammability assessment.
  • The fuel vapor concentrations in the fuel tank ullage exhibit significant differences between RP-3 and Jet-A aviation fuels. During short voyages, the fuel vapor concentration of RP-3 is consistently higher than that of Jet-A. Conversely, during long voyages, the fuel vapor concentration of Jet-A is marginally higher than that of RP-3 towards the end of the cruise phase.
  • RP-3 cannot be simplified as C10H22 when calculating fuel vapor concentration. The fuel vapor concentration calculated based on RP-3 as a single-component fuel is lower than the value calculated using a multicomponent model. For instance, at 40 °C and atmospheric pressure, the difference between the two approaches is 21.19%, and similar results were obtained under flight conditions.
  • Assessing fuel tank flammability based on fuel vapor concentration is more reasonable than using fuel temperature as a criterion. In the flight state, the temperature change curves of the gas and fuel for RP-3, Jet-A, and C10H22 show little difference. If the current airworthiness certification’s method of assessing fuel tank flammability based on temperature is adopted, the impact on RP-3 and Jet-A will not be significant. However, the significant differences in fuel vapor concentrations between RP-3 and Jet-A determine the flammability of the fuel tank.

Author Contributions

Conceptualization, X.P. and S.F.; methodology, X.P. and H.P.; software, X.P. and D.Q.; validation, X.P., D.Q. and W.B.; formal analysis, S.F.; investigation, D.F. and D.Q.; resources, S.F. and H.P.; data curation, D.F.; writing—original draft preparation, X.P. and D.F.; writing—review and editing, S.F. and H.P.; visualization, W.B.; supervision, S.F. and H.P.; project administration, W.B.; funding acquisition, X.P. and S.F. All authors have read and agreed to the published version of the manuscript.

Funding

This research was funded by the Jiangsu Funding Program for Excellent Postdoctoral Talent and the National Natural Science Foundation of China Civil Aviation Joint Fund (Grant No. U1933121).

Data Availability Statement

Some or all data, models, or codes that support the findings of this study are available from the corresponding author upon reasonable request.

Conflicts of Interest

The authors declare that they have no known competing financial interests or personal relationships that could have appeared to influence the work reported in this paper.

References

  1. Smith, D.E. Fuel Tank Inerting Systems for Civil Aircraft. Ph.D. Thesis, College of Engineering, Colorado State University, Fort Collins, FL, USA, 2014. [Google Scholar]
  2. Peng, X.T.; Wang, H.M.; Huang, L.; Liu, G.T.; Wang, C.C.; Feng, S.Y. Performance of an oxygen-consuming inerting system for an aircraft fuel tank with RP-3 aviation fuel in flight. Aerosp. Sci. Technol. 2022, 123, 107446. [Google Scholar] [CrossRef]
  3. Marciello, V.; Di Stasio, M.; Ruocco, M.; Trifari, V.; Nicolosi, F.; Meindl, M.; Lemoine, B.; Caliandro, P. Design exploration for sustainable regional Hybrid-Electric aircraft: A study based on technology forecasts. Aerospace 2023, 10, 165. [Google Scholar] [CrossRef]
  4. Fuel Flammability Task Group. A Review of the Flammability Hazard of Jet a Fuel Vapor in Civil Transport Aircraft Fuel Tanks; 20591 Report No. DOT/FAA/AR-98/26; U.S. Department of Transportation Federal Aviation Administration, Office of Aviation Research: Washington, DC, USA, 1998.
  5. Feng, S.Y.; Peng, X.T.; Chen, C.; Zhang, R.H.; Liu, W.H. Effect of air supplementation on the performance of an onboard catalytic inerting system. Aerosp. Sci. Technol. 2019, 97, 105605. [Google Scholar] [CrossRef]
  6. Li, J.; Yang, W.; Pei, Y. Vulnerability assessment for fire and explosion suppression measures of aircraft fuel system. Adv. Mater. Res. 2012, 510, 64–69. [Google Scholar] [CrossRef]
  7. Cican, G.; Frigioescu, T.F.; Crunteanu, D.E.; Cristea, L. Micro turbojet engine nozzle ejector impact on the acoustic emission, thrust force and fuel consumption analysis. Aerospace 2023, 10, 162. [Google Scholar] [CrossRef]
  8. China Civil Aviation Regulations, Part 25, Airworthiness Standards for Transport Aircraft [CCAR-25-R4], Civil Aviation Administration Order No. 209, 2011.12.7. Available online: http://www.caac.gov.cn/XXGK/XXGK/MHGZ/201606/P020160622405532063536.pdf (accessed on 3 April 2023).
  9. Zimmerman, S.P.; Keneshea, T.J. Handbook of Aviation Fuel Properties; Coordinating Research Council: Alpharetta, GA, USA, 1983; CRC Rep. No. 635. [Google Scholar]
  10. Fu, W.; Li, M.; Tao, Z. World Aviation Fuel Specifications and Progress, 1st ed.; China Petrochemical Press: Beijing, China, 2011; pp. 19–54. [Google Scholar]
  11. Dubovkin, H. Jet Fuel Performance Manual, 1st ed.; Aviation Industry Press: Beijing, China, 1990; pp. 98–125. [Google Scholar]
  12. Wang, S.Y. Research on Fuel Tank Flammability Assessment Technology Based on Domestic Fuel Physical-Chemical Characteristics. Ph.D. Thesis, Nanjing University of Aeronautics and Astronautics, Nanjing, China, 2012. [Google Scholar]
  13. Shepherd, J.E.; Nuyt, C.D.; Lee, J.J. Flash Point and Chemical Composition of Aviation Kerosene (Jet-A); Rep. No. NTSB12-98-CB-0415; California Institute of Technology: Pasadena, CA, USA, 2000. [Google Scholar]
  14. Woodrow, J.E.; Seiber, J.N. The Laboratory Characterization of Jet Fuel Vapor under Simulated Flight Conditions; 89557-0187 Report No. NTSB12-97-SP-0255; Center for Environmental Sciences and Engineering, University of Nevada: Reno, NV, USA, 1997. [Google Scholar]
  15. Ochs, R.I. Vaporization of JP-8 Jet Fuel in a Simulated Aircraft Fuel Tank Under Varying Ambient Conditions; 20591; FAA Report, Report No. DOT/FAA/AR-TT09/42; Air Traffic Organization NextGen & Operations Planning Office of Research and Technology Development: Washington, DC, USA, 2009.
  16. Summer, S.M. Mass Loading Effects on Fuel Vapor Concentrations in an Aircraft Fuel Tank Ullage; FAA Report, Report No. DOT/FAA/AR-TN99/65; U.S. Department of Transportation, Federal Aviation Administration: Washington, DC, USA, 1999.
  17. Polymeropoulos, C.E.; Ochs, R. Jet-A vaporization in a simulated aircraft fuel tank (Including Sub-Atmospheric Pressures and Low Temperatures). In Proceedings of the Fourth International Aircraft Fire and Cabin Research Conference, Lisbon, Portugal, 15–18 November 2004. [Google Scholar]
  18. Shao, L. Theoretical and Experimental Study of Oxygen Consumed Inerting Technology for Aircraft Fuel Tank. Ph.D. Thesis, Nanjing University of Aeronautics and Astronautics, Nanjing, China, 2018. [Google Scholar]
  19. Mze-Ahmed, A.; Hadj-Ali, K.; Devar, P.; Dagaut, P. Kinetics of oxidation of a reformulated jet fuel (1-hexanol/jet a-1) in a jet-stirred reactor: Experimental and modeling study. Combust. Sci. Technol. 2012, 79, 1039–1050. [Google Scholar] [CrossRef]
  20. Zheng, D.; Yu, W.M.; Zhong, B.J. RP-3 aviation kerosene surrogate fuel and the chemical reaction kinetic model. Acta. Phys. Chim. Sin. 2015, 31, 636–642. [Google Scholar]
  21. Xu, J.Q.; Guo, J.J.; Liu, A.K. Construction of autoignition mechanisms for the combustion of RP-3 surrogate fuel and kinetics simulation. Acta. Phys. Chim. Sin. 2015, 4, 643–652. [Google Scholar]
  22. Dadia, D. Modeling Wing Tank Flammability. Ph.D. Thesis, The State University of New Jersey, New Brunswick, NJ, USA, 2009. [Google Scholar]
  23. Bruce, E.P.; John, M.P.; John, P.O. The Properties of Gases and Liquids, 5th ed.; McGraw-Hill Companies Press: New York, NY, USA, 2001; pp. 32–57. [Google Scholar]
  24. Shou, R.; He, H. Aircraft Environmental Control, 1st ed.; Beijing University of Aeronautics and Astronautics Press: Beijing, China, 2004; pp. 110–146. [Google Scholar]
  25. Sanchez, F.; Liscouët-Hanke, S.; Bhise, T. Influence of ventilation flow rate and gap distance on the radiative heat transfer in aircraft avionics bays. Aerospace 2022, 9, 806. [Google Scholar] [CrossRef]
  26. Zhao, X.; Su, L.; Jiang, J.; Deng, W.; Zhao, D. A review of working fluids and flow state effects on thermal performance of micro-channel oscillating heat pipe for aerospace heat dissipation. Aerospace 2023, 10, 179. [Google Scholar] [CrossRef]
  27. Shi, Y.; Ding, S.; Liu, P.; Qiu, T.; Liu, C.; Qiu, C.; Ye, D. Swirl flow and heat transfer in a Rotor-Stator cavity with consideration of the inlet seal thermal deformation effect. Aerospace 2023, 10, 134. [Google Scholar] [CrossRef]
  28. Incropera, F.; DeWitt, D. Fundamentals of Heat and Mass Transfer, 4th ed.; Wiley Press: New York, NY, USA, 2011; pp. 132–151. [Google Scholar]
Figure 1. Diagram of the experimental system.
Aerospace 10 00497 g001
Figure 2. Experimental verification results of RP-3 fuel vapor concentration.
Aerospace 10 00497 g002
Figure 3. Comparison of RP-3 fuel and Jet-A fuel components.
Aerospace 10 00497 g003
Figure 4. Variation of different aviation fuel vapor concentrations with temperature.
Aerospace 10 00497 g004
Figure 5. Variation of RP-3 fuel vapor concentration with temperature and pressure.
Aerospace 10 00497 g005
Figure 6. Schematic diagram of the fuel tank calculation model.
Aerospace 10 00497 g006
Figure 7. Variation of fuel vapor concentration in the ullage with time.
Aerospace 10 00497 g007
Figure 8. Variation of gas and liquid temperature in the fuel tank with time.
Aerospace 10 00497 g008
Figure 9. Variation of the fuel loading rate with time.
Aerospace 10 00497 g009
Figure 10. Variation of fuel tank temperature with time during the short flight voyage.
Aerospace 10 00497 g010
Figure 11. Variation of the fuel tank temperature with time during the long flight voyage.
Aerospace 10 00497 g011
Figure 12. Variation of fuel vapor concentration with time during the short flight voyage.
Aerospace 10 00497 g012
Figure 13. Variation of fuel vapor concentration with time during the long flight voyage.
Aerospace 10 00497 g013
Table 1. Composition of RP-3 fuel and Jet-A fuel.
Fuel TypeAlkanes/%Cycloalkanes/%Aromatic Hydrocarbons/%Olefins/%Others/%
RP-353.037.74.62.02.7
Jet-A39.123.237.400.3
Table 2. Specific components of RP-3 and Jet-A aviation fuel.
Carbon Atom Numbers Ci5678910111213141516171819
RP-3 mole fraction/%0007.3612.9129.2228.379.713.961.081.991. 062.510.71.13
Jet-A mole fraction/%0.0320.221.082.857.7715.62018.115.210.55.492.10.820.130.108
Molar mass Mi/×103 kg·mol−17286100114128142156170184198212226240254268
A3.984.004.024.054.074.074.104.124.134.144.154.154.144.134.14
B1064.841170.881263.911356.361438.031495.171569.571639.271690.671740.881789.951830.511865.101894.301932.80
D232.01224.32216.43209.64202.69193.86187.70181.84174.22167.72161.38154.45149.20143.30137.60
Table 3. Experimental equipment and parameters.
EquipmentManufacturerModelRangePrecision
Fuel tankDN10 cm × Length 10 cm
Water bathFDLDC-303243.15~373.15 K±0.1 K
Temperature sensorShenpengT-type thermocouple273.15~373.15 K±0.1 K
Sampling pumpJHJH24-800–12 L/min
Gas chromatographFuliGC9790plus±1.0%
H2 generatorHongyiHYH-300B
Air generatorHongyiHY-3A 3L
Data loggerHIOKILR8432
Table 4. Flight envelope information.
StateFlight Information (Short Voyage)Flight Information (Long Voyage)
Block Time/minHeight/mFuel Consumption/kgBlock Time/minHeight/mFuel Consumption/kg
Slide out909070189
Take off20→90021020→457630
Climb out26.5900→10,688160429457→12,0004992
Cruise266.410,688942975512,00067,987
Decline1710,688→9001462112,000→457373
Approach6900→01206457→0240
Slide in50503.50135
Disclaimer/Publisher’s Note: The statements, opinions and data contained in all publications are solely those of the individual author(s) and contributor(s) and not of MDPI and/or the editor(s). MDPI and/or the editor(s) disclaim responsibility for any injury to people or property resulting from any ideas, methods, instructions or products referred to in the content.

