Article

Listening for Integrated STEM Discourse: Power and Positioning in a Teacher Professional Development Dataset Activity

by
Andria C. Schwortz
1,* and
Andrea C. Burrows
2
1
Department of Physics and Astronomy, University of Wyoming, Laramie, WY 82071, USA
2
School of Teacher Education, University of Wyoming, Laramie, WY 82071, USA
*
Author to whom correspondence should be addressed.
Educ. Sci. 2022, 12(2), 84; https://doi.org/10.3390/educsci12020084
Submission received: 27 October 2021 / Revised: 13 January 2022 / Accepted: 15 January 2022 / Published: 25 January 2022
(This article belongs to the Section Teacher Education)

Abstract

:
The “leaky pipeline” in STEM remains an open issue. The integration of multiple STEM subjects, especially technology, is a promising approach, and pre-collegiate STEM teachers are particularly underprepared in this content area. In this case study, the authors explore and characterize the discussions of pre-collegiate STEM teachers among themselves when working with a large astronomy dataset using a web-based spreadsheet tool. The authors used a feminist social constructivism theoretical framework and obtained observational field notes on five, in-service, STEM primary and secondary teachers (purposefully selected from 15 potential groups). The participants were audio and video recorded as they worked on the activity for two hours. Discourse analysis was used as qualitative analysis. Results show that the participants positioned group members with higher social status (based on gender, degrees, experience, etc.) as peer mentors. The peer mentors controlled the computer and guided the others to develop pedagogical content knowledge. The computer was also used as a technological bridge between science and math concepts. Participants showed evidence of not only integrating STEM concepts in their discussion, but also made connections to the science-adjacent topics of geography and technical writing. Suggestions are made for teachers and professional development workshop organizers to help ameliorate inequity in this setting.

1. Introduction

Although the “leaky pipeline” of girls and women leaving science, technology, engineering, and math (STEM) has been well-studied, there remain no clear answers to why females tend to leave STEM majors [1,2,3]. The leak has been observed as young as in middle school, and studies of the factors affecting students in middle school include teachers and other educational professionals as large factors influencing students’ gendered ideas of career paths [4]. Primary and secondary school teachers therefore may prove to be productive targets to improve K-12 students’ perceptions of gender in STEM.
Astronomy is a common gateway for STEM instruction in primary and secondary school [5], and also provides a ready environment for the integration of STEM topics [6,7]. There is little information about teacher preparation in astronomy separate from teacher preparation in physics, perhaps because astronomy programs are often organized within physics departments. Investigating teacher preparation in physics is where astronomy is usually taught in the pre-collegiate curricula. When it comes to physics teaching in the USA specifically, only 46% of physics teachers have either a major or minor in physics [8], and this number is even smaller in new physics teachers at 43% [9]. Professional development (PD) workshops for primary and secondary (known as K-12 in the USA) teachers are an environment where post-secondary physics departments can potentially help the preparation of teachers, and there is a need for these PD opportunities [5].
This paper investigates how in-service (or currently teaching) primary and secondary STEM teachers work with datasets in PD. This work looks to expand the literature on integrated STEM, and gender issues in STEM education. Through discourse analysis, this paper analyzes the teachers’ positioning, and whether the in-service STEM teachers integrate separate STEM fields in their use of datasets.
This article continues with a review of the relevant literature, before moving into the methods, results, discussion and conclusions, and implications.

2. Literature Review

The specific group of participants highlighted in this article are part of a larger study composed of a total of 89 individuals who participated in a pre/post-test (see [6]). Among these, 43 individuals were audio and video recorded while working in 15 separate groups. The authors chose a specific group of five individuals as an exemplar case due to their discussion revolving around all of the topics highlighted within the other 14 groups. As a result, this literature review scans the themes found across these many groups and exemplified in the purposefully chosen representative group in this study. These themes are (1) integrated STEM, (2) role of technology within STEM, (3) authentic STEM, (4) sensemaking and the “classroom game,” (5) equity and gender, and (6) partnerships and mentoring. Positioning theory, and the theoretical framework of feminist social constructivism, are also discussed to ground this study.

2.1. Integrated STEM

The integration of STEM is a goal in the USA [10,11,12] and internationally [13,14,15]. The integration of technology into STEM increases the engagement of students in STEM classes, partially due to the student-centered approach [16], and can further assist students from underrepresented groups [17,18]. It is expected that integrated STEM (iSTEM) will improve students’ “interest, engagement, attitude, and motivation” [15], (p. 3). As a result, iSTEM is often depicted as the frontier in STEM education [17,18,19], however no single definition exists specifying exactly how many STEM disciplines must be included to be considered sufficiently “integrated”—see [18] for a discussion of many of the combinations.
Burrows and Slater [20] proposed a theory of educators’ iSTEM, and an integrated model of STEM requires educational researchers to understand the role of the “T” of technology within STEM. In this paper, integrated STEM (or iSTEM) refers to content that combines two or more STEM disciplines, for example two science fields, science and math, or math and technology. These need to be combined simultaneously, rather than changing from one topic to the other. Integrating non-STEM topics with STEM (such as STEAM, or science, technology, engineering, art, and math) is not the explicit goal of this project but is also noted when it occurs. Many K-12 teachers do not feel confident in STEM fields individually, let alone integrating them [21]. Additionally, research into how PD programs encourage teachers to interconnect knowledge between different STEM fields is limited [5].
There is evidence that integrated STEM can be beneficial to students learning, but teachers often need resources to bring that skill into their classrooms and could require even additional support (such as PD) to be able to do so effectively. As a result, more research is needed to see whether and how teachers integrate STEM during PD activities, as there is limited information available about how teachers integrate technology specifically with other aspects of STEM.

2.2. STEM and Technology

Within integrated STEM, datasets are one viable tool for incorporating technology. In the PD activity, the five in-service teacher participants worked with a dataset presented in the form of a spreadsheet, so it is important to understand the role of datasets within STEM. The goal of this section of the literature review is to summarize what role datasets could potentially have within integrated STEM education, so that the researchers may assess whether the teachers did engage in any of these technology practices. This subsection examines the definition of “dataset” before moving on to possible roles of technology within education and whether datasets may fit any of these roles. These possible roles for technology in the classroom include instructional technology vs. educational technology, computational thinking and programming, mathematical modeling, and science-specific technology.
The word “dataset” is not generally defined in relevant literature [22,23,24], but Schwortz and Burrows [6] (p. 3) suggest a definition of “any collection of data, often arranged in a spreadsheet”. Spreadsheets and other representations of data are important technological tools that students need to learn to use in the context of science [25], especially as modern technology and data storage often leave science researchers with larger amounts of data than can be analyzed individually [26]. Because of this revolution in scientific research, science education practice is increasingly including dataset education, and science education research is working to determine effective pedagogies [27]. However, students at all levels have difficulty with data analysis skills ranging from straightforward tasks such as graphing [28,29,30] to more nuanced analysis of data [31]. So, the questions of when and where students are being instructed in dataset skills, how this varies across different STEM disciplines, and how it is integrated with other STEM fields remains open. Similarly, it is not well known where STEM teachers learn these skills [20].
One possible context for technology in the classroom is instructional technology. This term is sometimes used to refer to technology used by the instructor only, such as using slideshow software as part of a lecture [32,33], while the term “educational technology” most often refers to technology used by the students in the process of learning a topic (AECT Definition and Terminology Committee, 2008, as quoted in [32,34]). These forms of technology are intended to help students learn the specific content within of the field of study—as distinct from the technology being the content and skills itself [32].
One way that technology could be the actual content and skills is computational thinking, which can be defined as a problem-solving process that encompasses “practices such as abstraction, modeling, and decomposition” ([35], (p. 3)), including data visualization and pattern recognition [36]. Programming is the process of breaking down a question into algorithms that can be performed by a computer to solve a problem [35,37], and is often associated with computational thinking. Dataset skills are separate from the skills for programming [38], but it is possible that there is an overlap with computational thinking [35,36,39,40].
Mathematical modeling is another way by which technological tools can be incorporated within a classroom. Math modeling can involve symbolic or numerical representations, physical objects, images [41], digital or electronic tools used for teaching [32], or the application of statistical analysis to data [11,42]. Dataset usage fits into this, as it requires a description of phenomena, using numbers [41] and visualization of the data [43].
Lastly, science-specific technologies must fall into one of three categories: “data collection” and analysis, “simulations and modeling tools”, or “online collaborative tools” ([44], (p. 214)), and can include programs created solely for science education on specific topics, or online scientific resources available to the general public [45]. Pre-service teachers are expected to understand and design lesson plans including science-specific technologies to enhance science content knowledge and pedagogy [46]. However, datasets are not a phenomenon limited only to the natural sciences, nor even to STEM, as they are used in the social sciences, or to keep track of inventory and household budgets, and more.
Multiple uses of technology have been discussed, but the use of large datasets has not been previously categorized as one of these. Not only have datasets not found a specific home within the “T” of STEM, but few relevant sources even define the word “dataset” (e.g., [22,23,24]). Schwortz and Burrows [6] (p. 3) suggest a definition of “any collection of data, often arranged in a spreadsheet”. Spreadsheets are important technological tools that students need to learn to use in the context of science [25], and this work attempts to determine how precisely teachers use datasets within the context of technology in integrated STEM.

2.3. Authentic STEM

Authentic STEM is the teaching practice of guiding students in the skills that scientists would use in their real-world practice [47]. Students engaging in authentic STEM ask questions, work collaboratively, and reflect on their learning [48]. Datasets are being used as authentic STEM in a number of classroom settings, including astronomy [6] and environmental science [43]. Astronomy-based PD especially holds promise for providing authentic STEM experiences [5]. However, while authentic STEM is often cited as a way to approach the integration of STEM [13], it may not be the ideal approach in all settings and cultural contexts [49].
Understanding learners’ attitudes and goals may help us to better determine when authentic STEM can be useful. These attitudes include whether participants are attempting to learn the material for themselves, or if they are simply trying to complete the assignment and move on.

2.4. Sensemaking vs. the “Classroom Game”

While examining the dataset activity in the study context, the authors noticed teacher sensemaking. Sensemaking is the process by which learners construct explanations and internalize new information [50,51]. It is a collaborative process requiring discourse between learners and as such fits well with a social constructivist theoretical framework [49,52,53].
At the other extreme are learners who “play the classroom game,” and these learners put their effort towards completing the bare minimum required to receive a grade they feel is sufficient [54]. Learners with this mindset may employ sensemaking to a limited extent with the goal of receiving a grade or pleasing a teacher [55].
Teachers perform sensemaking not only as regards the content they are teaching, but also how the content fits into their classroom and their overall curriculum [56,57]. However, they are put in a place of tension between needing to teach to a test often using standards (the classroom game) and wanting to encourage students to explore (or engage in sensemaking) [55]. One possible route is for teacher PD activities to focus on their own sensemaking within the context of content standards [12,55].

2.5. Equity and Gender

In addition to integrated STEM and technology, the authors of this study observed some complexities of gendered interactions. This paper uses the terms “sex” and “gender” interchangeably to refer to social roles of individuals, and the inevitable biases they face as a result (see Section 3, on feminist social constructivism). The distinctions and overlaps between gender and sex are complex [58], but unfortunately a full discussion is beyond the scope of this paper.
Although the percentage of females in STEM is increasing, it still remains male-dominated [58]. Females still receive messaging indicating that science is not for them, but instead is a field for males [59]. Many students are aware of the impact of gender and other inequities from both the larger society, and within their academic careers [60]. In addition, females have not been making gains in the engineering and technology workforce [61]. The literature shows that female secondary and post-secondary students experience a lower sense of self-efficacy than their male peers despite similar or higher levels of achievement in STEM [62,63,64].
Teaching how to use technology in primary and secondary schools is increasingly a focus in science standards [12] as a skill-based practice, but this could come with an “emotional cost” that disproportionately falls upon underprivileged students [65]. These students may come into the technology-enhanced classroom with an expectation of failure, which then influences their actual success [65]. However, in contrast, Buck et al. [58] postulate that the integration of technology into other STEM subjects gives female students and other underprivileged students opportunities and can act to mitigate gender inequities.
In mixed-sex groups, males interact with computers more than females [66,67]. Since students who interact with the computers more learn the concepts more [66], this gendered difference may be one of many small contributions to gender imbalance in the workforce [61]. In addition, there is a gap in the literature of understanding how in-service, pre-collegiate STEM teachers learn to work with technology in an integrated setting so that they may teach their students [68].

2.6. Partnerships and Mentoring

Lastly, in the study’s groups, beyond integrated STEM, technology use, and gender, the authors detected participant actions of partnering and mentoring. The goal of teaching is learning, and learning requires a collaboration between learner and instructor [69,70]. Teacher PD involves collaboration between each teacher and the PD instructor as well as peer-to-peer collaboration, but by extension also implies the collaboration between the teacher and their students [71]. Both partners need to benefit from a partnership, even when the partners have a power differential such as in a mentoring situation [70,72,73].
In this study, some in-service teacher participants took on the role of peer mentors, and this role highlights the importance of partnerships and some of the potential motivators in their actions. Additionally, this showcases the relative positioning of participants. Importantly, within interactions, positioning is the process by which individuals use their discourse to create their self-identity, including their position within the hierarchies of society [74]. Positions are relative roles and power status; individuals can propose positions for themselves or for others [75,76]. Positioning plays an important role in the development of science identity of females starting as young as kindergarten, and thus teachers’ modeling is key to setting examples for students [77].

3. Theoretical Framework: Feminist Social Constructivism

In this study, the authors used a feminist social constructivism framework. Constructivism focuses on how individual learners make meaning of the materials to which they are exposed [53,78]. With social constructivism, researchers seek to describe how learners construct their shared knowledge, as well as how they together build and sustain shared activities [78,79]. Feminism as a theoretical framework is utilizing the lens that learners are influenced by structural “inequities shaping the lives of women” [78], (p. 689), and a researcher using this framework seeks out the forms and sources of inequity that stand as barriers to all learners, not just females [80].
Researchers recognize the need for a merged perspective combining the strengths of both social constructivism, and of feminism [80,81]. While learners build their own systems of understanding which shape the world around them (constructivism), they do so within the constraints of structural inequities that they cannot help but perpetuate (feminism). While females are trying to find their own place within both society and science (feminism) [82], they are also working together to try and build their knowledge of science content (social constructivism), and the activity of science (a discourse analysis viewpoint) [79]. Feminist social constructivism can be viewed either as adding a feminist viewpoint to existing social constructivist discourse [80], or as adding social constructivism to existing feminist discourse [83]. These theoretical frameworks are complementary, filling in the missing pieces for each other, and both are critical to understand learning.

4. The Study: Materials, Methods, and Analysis

The authors of this research study investigated the positioning of in-service STEM teachers during a PD workshop using datasets, while determining whether and how they integrated different STEM fields. The authors analyzed the group discussions of five in-service STEM teachers as they worked with an astronomy dataset in a lab-like group setting. This group was purposefully chosen from 15 total groups as an exemplar of the behaviors of all the groups. The authors used this one group as a case study [84], with the case serving as an instrumental case that touches upon the many topics of the 15 groups [84,85]. The authors further discuss the methods below, starting with the research questions and continuing with the sample and setting, materials and experimental procedure, and ending with the analysis before moving on to the next section of results.

4.1. The Gap in the Literature

How teachers learn to work with technology in an integrated STEM setting [46,68,86], or integrate technology into their teaching [20], is a growing research field. Recent studies in this space are emerging [87,88,89,90]. In addition, more strategies are needed to reduce the leaky pipeline of females leaving STEM [1,2].

4.2. Research Questions

The purpose of this study was to investigate the discourse of in-service STEM teachers as they learned to work with datasets in astronomy, as an expansion of existing literature on integrated STEM, gender issues in STEM education, and mentoring partnerships. As such, the below questions were developed to investigate their experience.
  • How do in-service STEM teachers in a PD activity position themselves with respect to each other, and how does their use of the computer reflect their positioning?
  • How does the technology use of these in-service teachers fit into definitions of technology within STEM?
  • What does in-service teacher discourse during the PD reveal about integrating STEM disciplines?

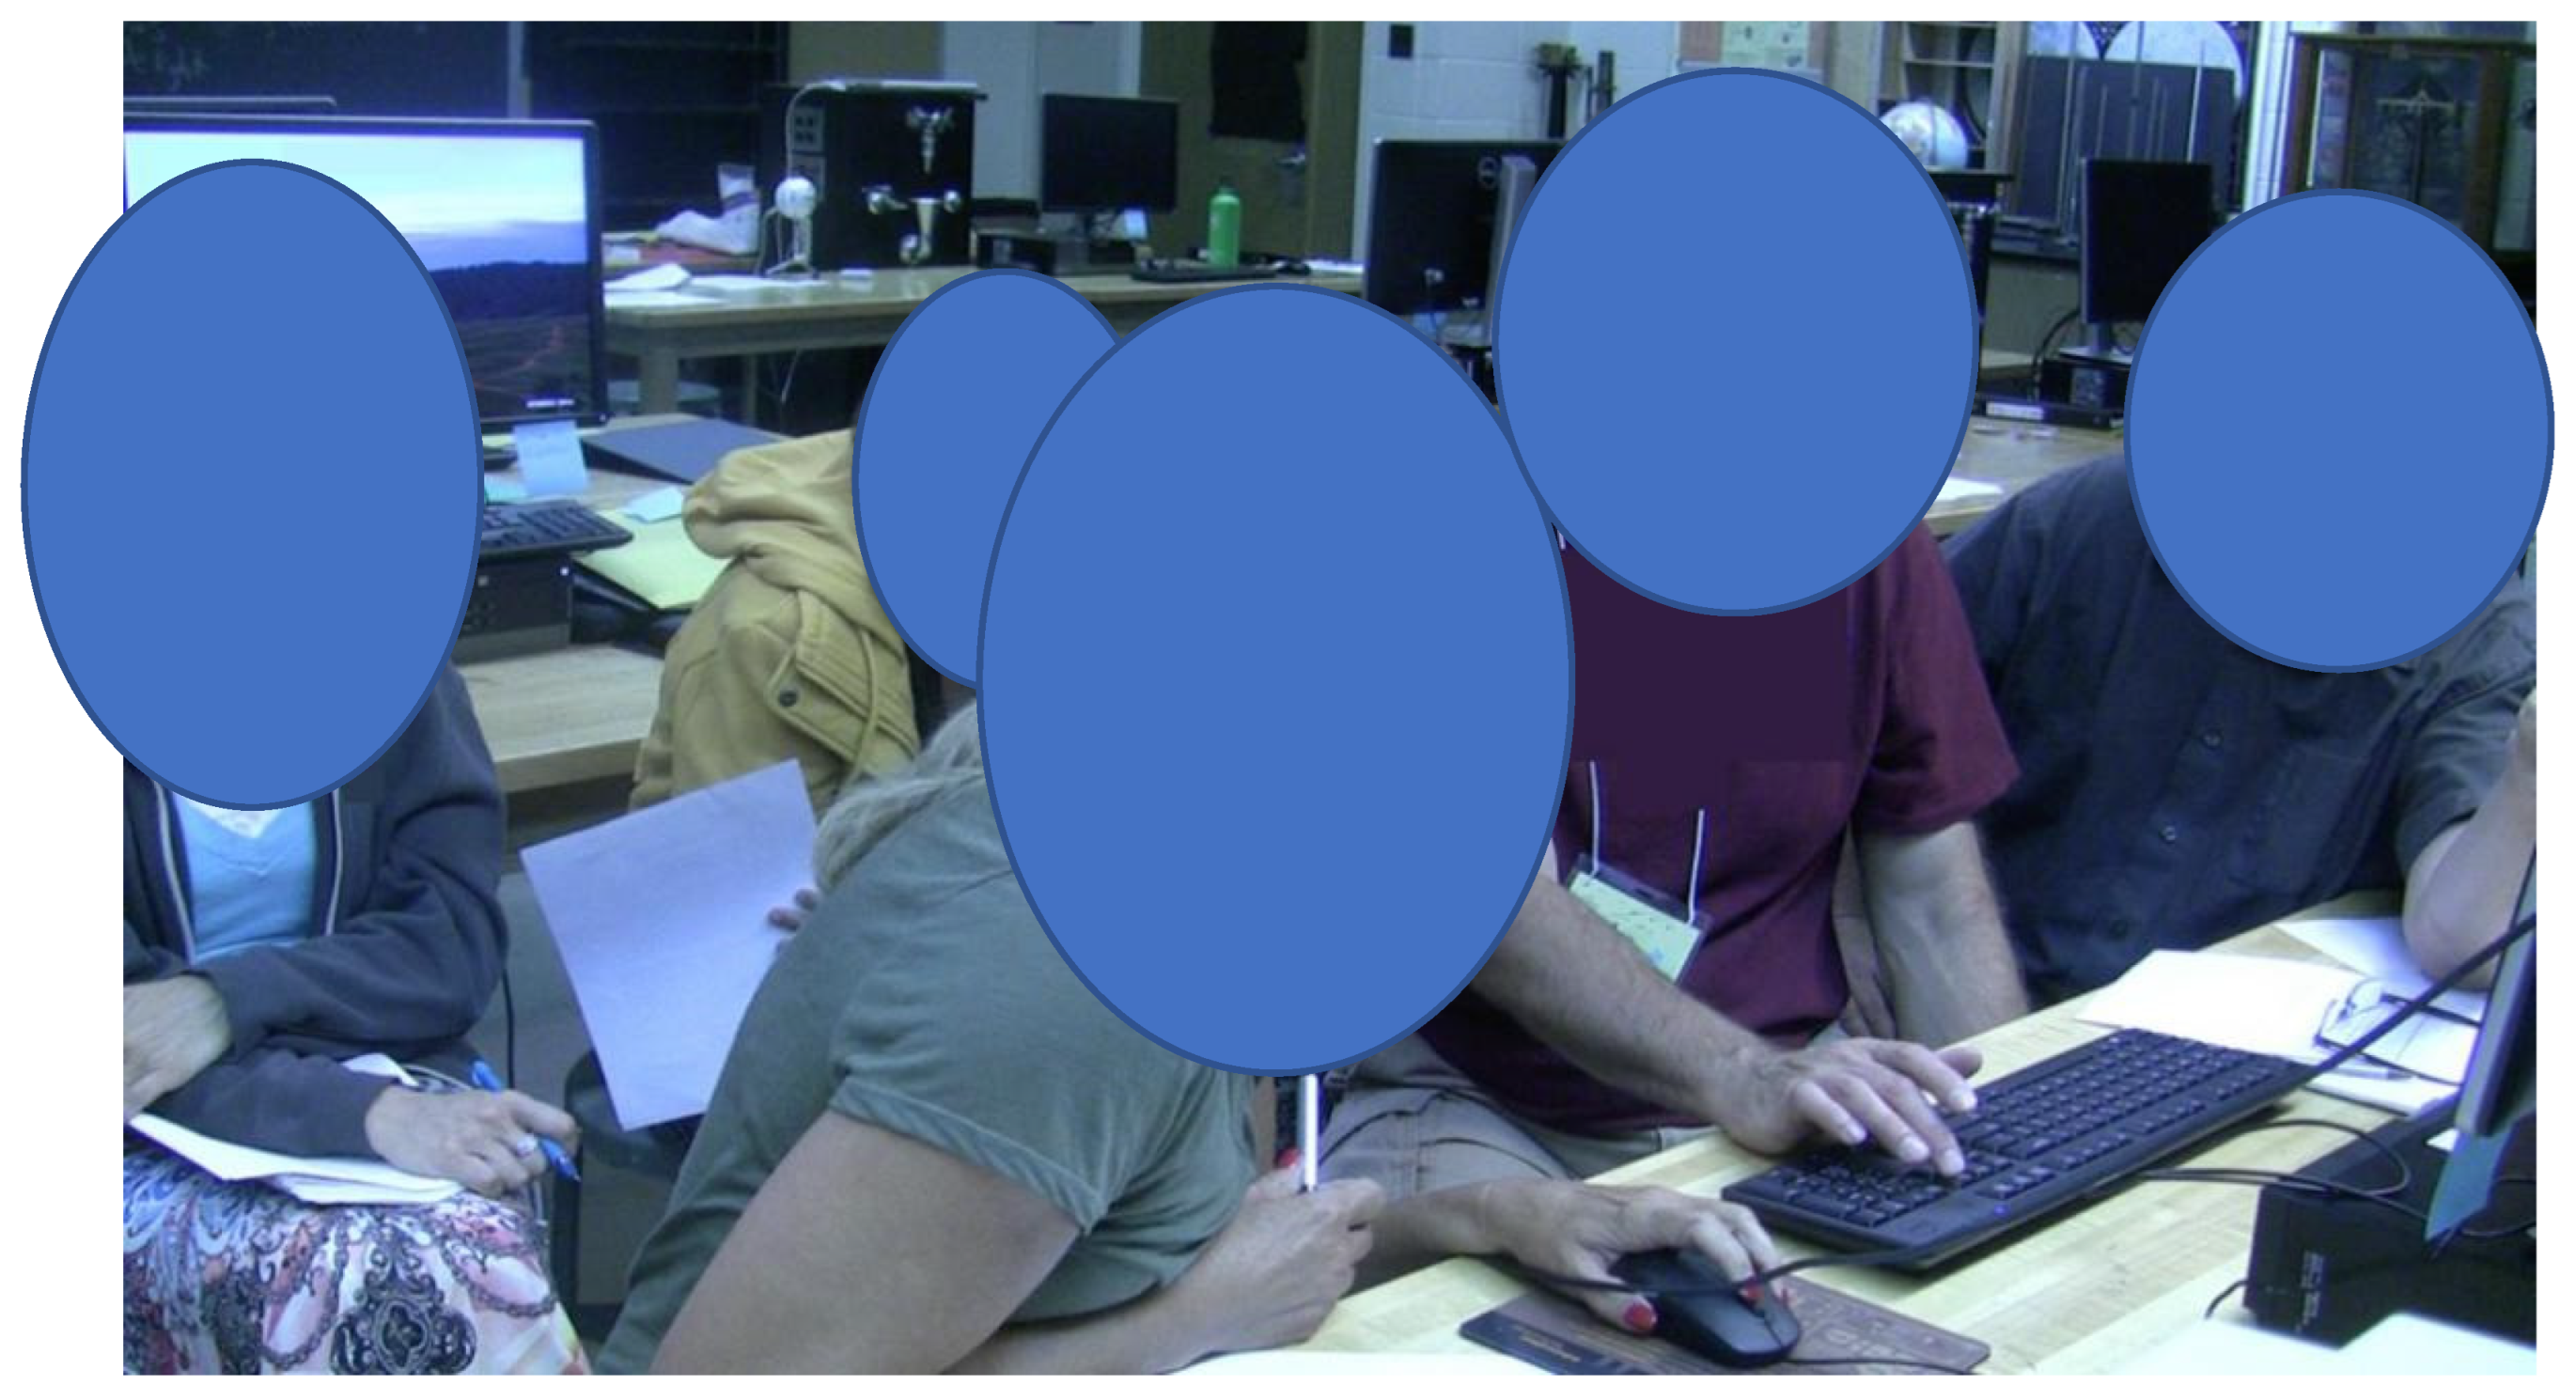
4.3. Sample and Setting

The participants in this project were five in-service primary and secondary STEM teachers participating in an astronomy-themed PD session at a large research university in Western USA (purposefully chosen from 15 other groups as an exemplar). These participants’ education and experience are listed in Table 1, along with pseudonyms. Participants signed consent forms to participate in this study, including audio and video recordings.
This grouping of five participants was self-selected: these five individuals were strangers to each other and were among the few participants who did not already know each other from previous workshops. They selected a larger group size than most other groups due to the limitations of available recording equipment. The group selected for analysis was larger than most other groups, and the size led to limited participant control of the computer (not all participants could control the computer at the same time), which afforded an examination of how computer usage played into positioning.
A total of 43 individuals split into 15 groups were recorded as part of the larger study. The themes discussed in the literature review were found in a number of the groups; the particular group selected for this paper exhibited all these themes, and thus was chosen as a single group that could exemplify these themes.

4.4. Materials and Experimental Procedure

This research study was approved by the university’s Institutional Review Board (IRB or ethics board). All participants signed informed consent forms, and were given the opportunity to withdraw at any time. Participants worked in self-selected groups, influenced by some of them knowing each other from previous days of this PD session and other PD sessions.
While in the groups, the participants were given a 200-entry astronomical dataset in the form of a spreadsheet (Google Sheets), where each row was a different object, and each column was a different descriptor. These objects were quasars, a type of active galaxy, which are extremely bright. The descriptors were the name of each object as a numerical ID, right ascension and declination (aka RA and dec, coordinates on the sky equivalent to latitude and longitude on the Earth), redshift (a measure of the distance), and radio magnitude (a measure of whether the quasar has jets). These data came from the publicly available Sloan Digital Sky Survey, as presented by Schneider et al. [91] and Shen et al. [92].
This activity consisted of three phases intended to guide participants through the data analysis tasks performed by astronomers in analyzing these datasets. These included tasks such as graphing [28,29,30], data visualization [43], pattern recognition [36], and even simply looking at the numbers [41]. These tasks were split into three phases with participants turning in their results on each phase before receiving the instructions for the next phase. This was intended to allow for participants to discover their own meaning in the numbers before being guided to create standard graphs as their end products. These end products included an XY scatter plot of the coordinates on the sky (representing where they are found in the sky), a histogram of the redshift (representing how close they are to Earth), and a histogram of the radio magnitude (representing whether these galaxies tend to have jets).
Google Sheets was chosen as the platform for participants to analyze the data for a number of reasons, including the following.
Dataset of 200 objects chosen to reduce chance of participants analyzing the data one datapoint at a time.
  • Population unlikely to know IDL, Python, etc., so programming not a feasible option.
  • Goal of the project is examining dataset skills, not programming skills.
  • Google Sheets makes it easier to create histograms than MS Excel.
Schwortz and Burrows provide more detail about the activity, and an overview of participants via a mixed methods study [6], while this article uses discourse analysis and positioning theory to look at one participant group in more depth.

4.5. Data Sources

The authors used observational field notes, in the form of recordings, as the main data collection method. While the participants worked in groups, they were audio and video recorded, which was then transcribed. Video was recorded on one camera, and audio was recorded with four separate microphones placed near the participants. Audio was transcribed for the text (words). The analyzed group worked together on this activity for two hours. The data analyzed were the transcripts of the audio recording and verification of the transcripts by watching the recordings.

4.6. Analysis

Discourse analysis is the research method of analyzing the use of words to determine what structures and systems the speakers are supporting or creating [79]. It has been used extensively to understand STEM textbooks, students, teachers, and practicing scientists [93,94,95,96,97,98,99,100]. Yet there is room for more insight as researchers identified discourse analysis as a specific methodology which is lacking in the realm of teacher PD [5].
Discourse analysis was performed using qualitative data analysis software (NVivo), both looking for the six a priori themes that were found in previous work [6] and discussed in the literature review—(1) integrated STEM, (2) the role of technology in STEM, (3) authentic STEM as best practice, (4) sensemaking and the “classroom game”, (5) equity and gender, and (6) mentoring as a form of partnership—as well as emergent ideas [101].
Discourse analysis has been shown to have a role within a larger analysis (including positioning theory) of qualitative data, when studying a group of students working together on an integrated STEM activity [76]. In this study the authors used Gee’s [79] approach to determining “Discourses with a capital D”, by searching for the participants’ positioning, use of sensemaking and the classroom game, and for evidence of integrating STEM.
While much of the data analysis involved “unmotivated looking” [101] rather than specific coding for themes, the authors did code for the themes discussed in the literature review: integrated STEM, STEM and technology, authentic STEM as best practice, sensemaking vs. the classroom game, equity and gender, and partnerships (including mentoring).

4.7. Limitations

There were several limitations to this study. One was that the analyzed group was purposefully chosen as an exemplar group and self-selected, not matched by the research team. Second, because limitations of recording equipment led participants to self-select into a larger group than they would have otherwise, this may have affected the group dynamics. A group this size working with a single computer may inevitably have inequitable positioning “baked in” to the group size. It could be fruitful to repeat this work with a purposeful, smaller group with a single computer, or a purposeful, similar size group with more than the one computer. Thirdly, participants’ awareness that they were being recorded likely influenced their word choices and behaviors. Fourth, the authors cannot distinguish between multiple possible sources of the observed power structure, including gender, level of teacher education (such as how many degrees or what level of degree), content area of teacher education (STEM vs. education), and grade level of the teacher. Related to this limitation, fifth, the researchers did not record the group prior to sitting down at the computer, so there is no evidence as to how the group decided who would control the computer before they began to do so.
Regarding limitations in the design of this project, it was not designed to investigate programming, but it was found that participants showed evidence of using computational thinking skills, which has some overlap with programming. In addition, while there may be an intuitive assumption that a group this large would inevitably exhibit inequitable usage of the computer; this is an assumption that needs to be substantiated with evidence. While inequitable computer usage has been seen in non-teacher post-secondary mixed-sex groups [67], such evidence has not been presented for in-service teachers.

5. Results

This section discusses the participants’ positioning, group dynamics, and a shift in dynamics partway through the activity. In addition, the authors examine participants’ discourse for evidence of sensemaking vs. “the classroom game”, and for evidence of integrated STEM. The full codes discovered through this one case are listed in Table 2, and the literature review (above) was built around these codes that were discovered.
Next, individual stories are provided for reader insight and connection to the conclusions that the authors display.

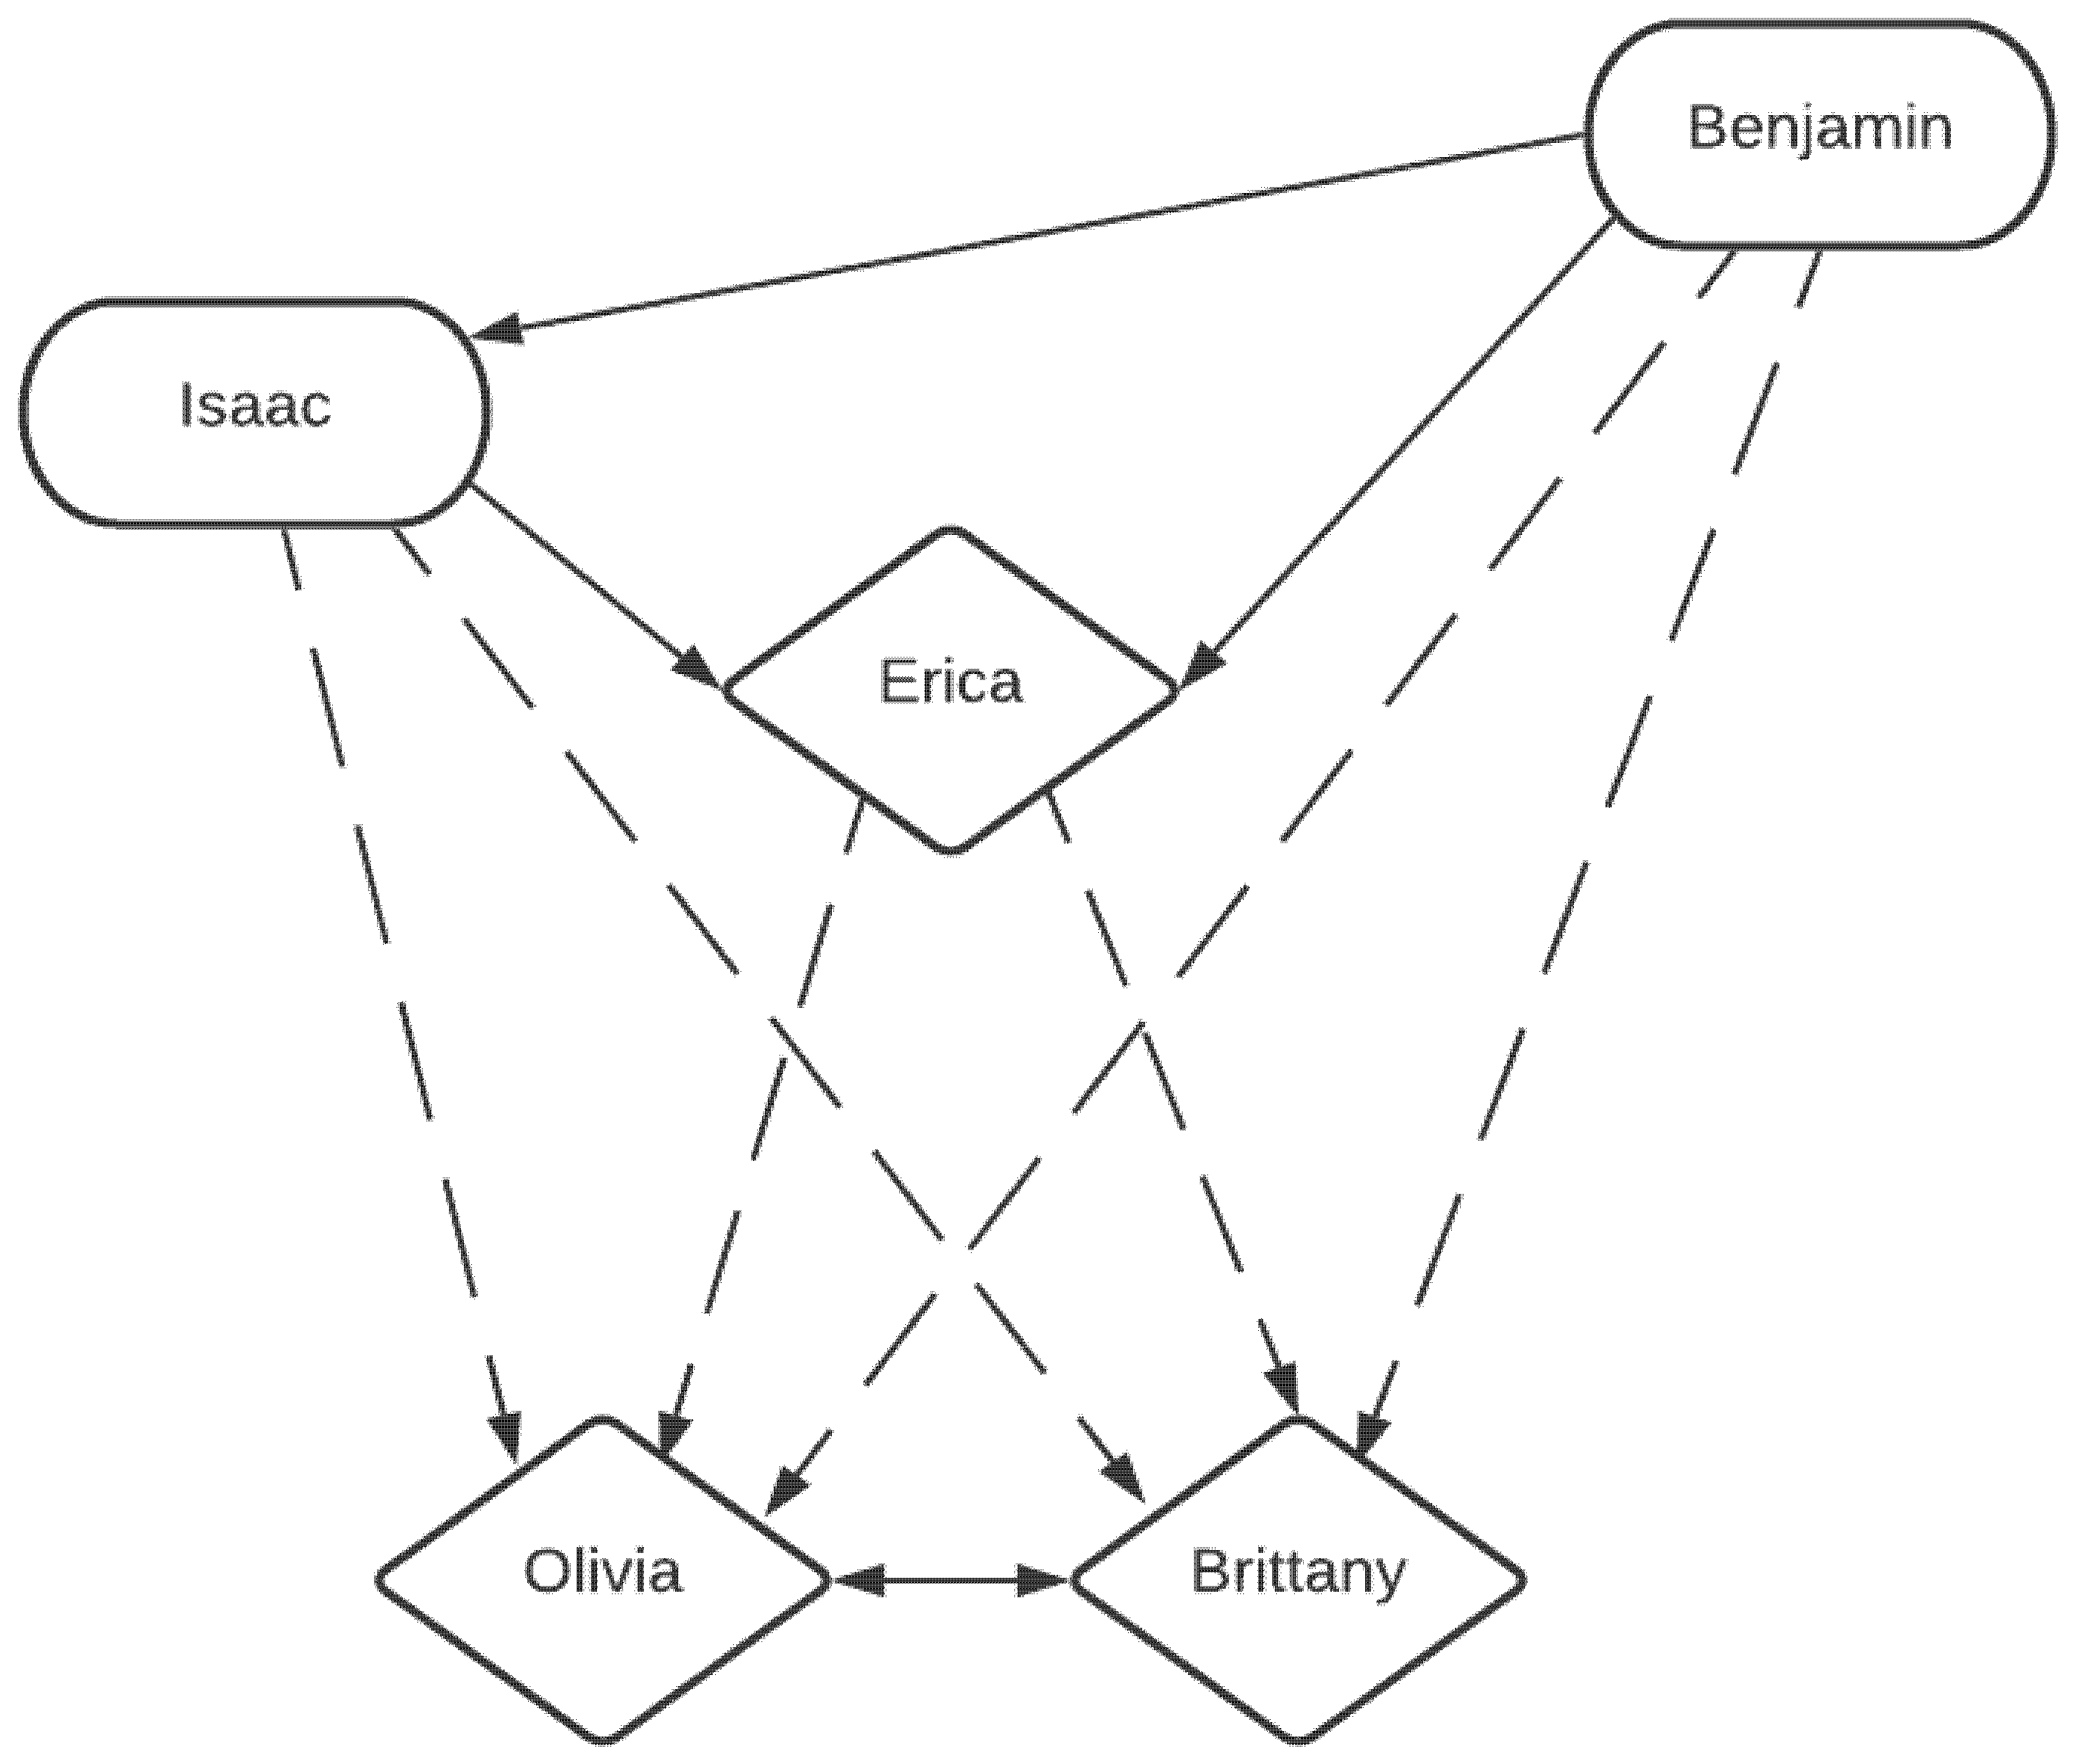
5.1. Benjamin: The Mentor Teacher

Benjamin positioned himself as a mentor teacher and introduced the use of a free planetarium program (Stellarium) as a way for his peers to visualize the astronomical concepts of coordinates on the sky. Erica and Isaac reinforced this positioning by asking Benjamin questions that would allow him to show his knowledge, so they could learn from him.
Benjamin emphasized discourse of being a teacher. He tried to put not only his learning, but also the learning of his group members, into the context of how their students would react. Below he explains to his group how students would understand magnitude and brightness.
Benjamin: That would be my question. If you hand this to a student, some of them, they don’t have, if they have an idea of magnitude, they would basically say—so brightness is the same on all these? Zero is a value of magnitude.
Benjamin engaged in sensemaking about different units for the angle of a complete circle (i.e., 360 degrees vs. 24 h). His portion of this discussion is below.
Benjamin: Why does right ascension go to 359? It shouldn’t. It should only go for 24 h.
[other discussion]
Benjamin: So 90 degrees should be roughly… 9 h. Let’s find something that’s close to that, like 12 h. That should be close to 180 degrees. So there it is.
He introduced the planetarium software to the group’s computer usage to try and help his group members make connections between the interdisciplinary STEM content they were learning, and how their students would see it.
Benjamin: A surveyor’s scope, which is what the orange lines [show], is going to change all day long because the Earth is rotating. We can’t do astronomy like that because we have to have— tell me where it is in the sky every single time. And that’s what the blue lines are. The right ascension and the declination.
Benjamin: So the blue lines are like latitude and longitude on a regular [globe].
Here Benjamin makes connections between many interdisciplinary STEM concepts, including coordinates in astronomy, and surveying and coordinates in geography. Elsewhere, he demonstrated how he integrates STEM in his classroom, across multiple science fields (geography and astronomy), between science and math, and using a technological tool to do so. He discussed technical writing standards as a way to connect STEM to the language arts.

5.2. Isaac: The Second-in-Command

Isaac accepted Benjamin’s positioning himself as superior and positioned himself as superior to Erica. His interactions with Benjamin were either short answers or questions, or more lengthy joking around. He mostly did not interact with the three females, other than incidentally with Erica while she and Isaac answered Benjamin’s prompts. For example, when Benjamin was trying to demonstrate the planetarium software to the group, they had an exchange as follows.
Benjamin: The other thing I guess you could do, you could go through and say if we plotted all these, we could find out where, what section of the sky this was taken in. But it does from, what, 2 down to what?
Isaac: 360 dec.
Benjamin: We looked completely in a circle. We looked from plus 0 down to −0 zero, This plus 0 is going to be the North Pole. Minus zero is going to roughly be the South Pole. So are we looking at all sections of the sky?
Isaac: You’re talking about declination?
Benjamin: Yep.
Erica: Is that why these are negative? Negative numbers are in the southern hemisphere?
Isaac: —above our…
Benjamin: The negative numbers would be in the celestial southern hemisphere. Not our southern hemisphere.
Isaac: —above the celestial equator or below the celestial equator?
Isaac’s learner-discourse contributions were often on topics related to math, such as above where he chimed in on topics related to angles. Elsewhere, Isaac observed that the objects were ordered by their location east/west in the sky, discussing units, or trying to understand the ranges of values. Isaac fluently shifted between thinking in terms of math, and in terms of the scientific meaning behind this math.
Isaac: They just ordered this table according to right ascension. They could have done it according to declination. And if they would have—well, we did sort it by declination—oops. If we order it by declination, luckily the right ascension is attached to it and it automatically adjusts. Now you can see the right ascension is all gobbledygook order.
Erica: Those are really high numbers. Why are they—Oh, because you said that’s going around.
[Benjamin and Isaac both talking at once] full circles
Isaac: These, if it’s basically a hemisphere, be zero to 90, but it’s not quite the full [sphere]—
Benjamin: So that would be the next thing I would notice.
Isaac: Not quite the full hemisphere?
Isaac alternated between sensemaking and the classroom game. As part of the classroom game, Isaac kept the group on task by reading the instructions aloud, sometimes with humorous comments.

5.3. Erica: The Learner and Go-Between

Erica positioned herself as learning from Benjamin and Isaac and asked many questions. To start, her discourse was that of a learner, and she asked questions of Benjamin and occasionally Isaac as a student would a teacher.
Erica, following Benjamin’s model, discussed modifying the activity for her students.
Erica: …make them [her students] do data like on the spreadsheet and then just create 25 of those, instead of having 200 to deal with.
Erica often focused on sensemaking. In the below quote, she was reasoning through the use of the word “trend” as used by Benjamin and Isaac.
Erica: Yeah, you guys spent all that time looking for trends or you were looking for correlations between one variable and another. And you couldn’t find any. I’m not sure what the word “trend” is referring to. Is it just a pattern with the numbers or a trend of actual science happening with these quasars? That word “trend” means something different to me.
She showed evidence of putting this in context of not just lessons in science, but also interdisciplinary lessons, as primary school teachers generally teach all subjects in her district.
Erica: So if I was doing this in class with younger kids in science, I’d want them to be using terms like columns and the rows and say the words and actually [be] writing down the RA and declination. Especially if I was going to put this as a writing assignment. Want to be sure I had a list of all the vocabulary I’d want them to use or or even a science writing paragraph. I would also have had those vocabulary words.

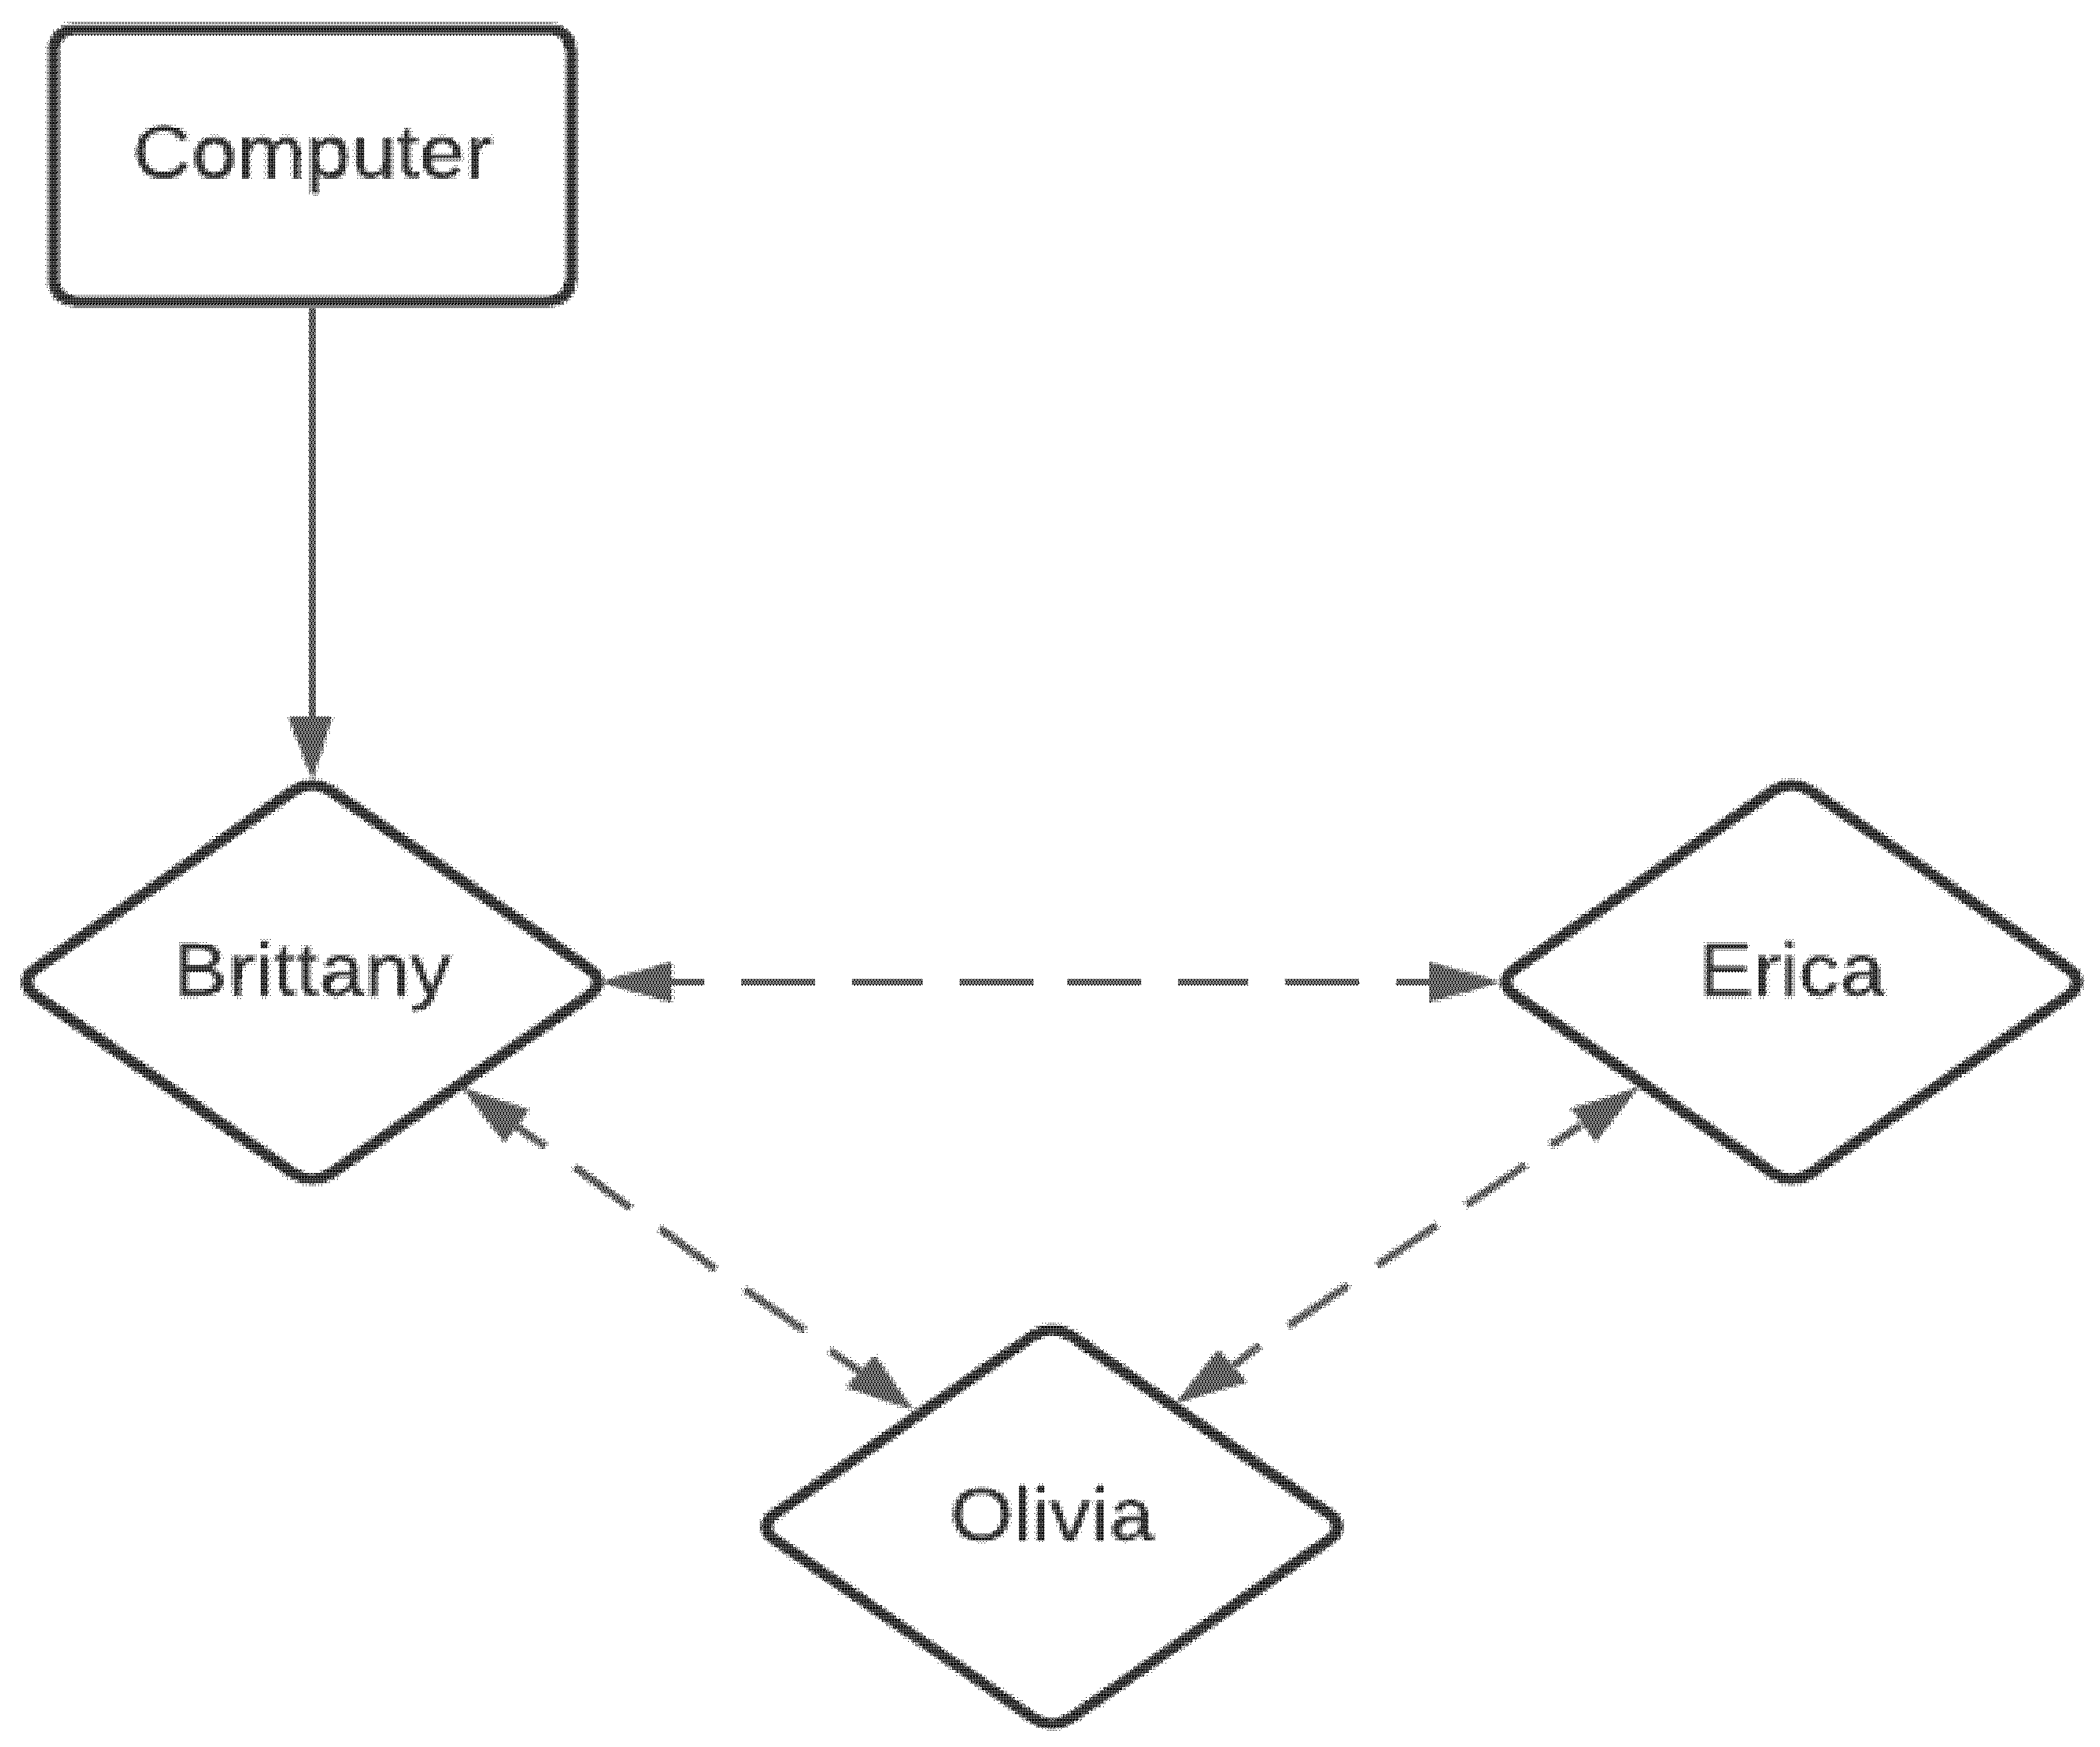
5.4. Olivia and Brittany: The Unknowns in the Back

Olivia and Brittany ceded nearly all power in the group by primarily talking with each other. For most of the session, Olivia and Brittany sat farther from the computer, never touched the computer, and never interacted with the two males and Erica. They talked throughout this time as shown in the video, but only to each other, and their words were inaudible in the recording. In fact, their inaudibility itself was a theme in the transcript of their discussion; over the course of three minutes, there were five instances where Olivia and Brittany were talking with each other but inaudible in the recording. Their body language placed them as equals despite the lack of supporting audio.
The rare times that Brittany and Olivia did contribute to the conversation of the group at the computer, their approach was generally very straightforward and less exploratory, focused on achieving the specific activity tasks given rather than attempting to learn the ideas as a whole.
Benjamin: So without graphing it, what would you say about this then?
Brittany: We just talked about each individual category as you guys were discussing it. What is ______. So we have values from 2 to 359 ________ very few have jets [inaudible]
Benjamin: So you just write up a summary?
Olivia: Summarized each category.
Brittany and Olivia were using a learner discourse, as they tried to complete the assignment efficiently by playing the classroom game. Benjamin’s tone, however, was dismissive of their contributions, and he quickly turned the conversation back towards a teacher-like discourse, and his own process of sensemaking.

5.5. The Group Dynamic

Throughout the first hour and 20 min of the recording, Benjamin, Isaac, and Erica worked together with Isaac and Benjamin dominating the conversation, with Erica unengaged. Benjamin explained to the group the meaning of right ascension and declination (coordinates in the sky, akin to latitude and longitude) using the free planetarium software that he used with his students. He was explaining this primarily in response to questions by Erica, but Isaac was also alternating between asking questions of Benjamin to learn more himself and explaining ideas to Erica. Benjamin (and Isaac to a lesser extent as well) often put his explanations in terms of “this is what you should know as the teacher, this is what you should expect your students to be able to figure out, and this is how you can get them there”.
Benjamin: I was going to show you, if we can step away from this a minute. If this has got you confused—
Erica: Yes, it is.
Benjamin: —go back to Stellarium. So that you understand what those numbers are. So this is an astronomy program. If you hold your mouse and let’s click on the cloud and turn the sun off. So this is like the night sky from a certain location. If we strip away the atmosphere, this is what it would look like.
Benjamin: If I turn on this one, this is called the equatorial grid. This is the RA and the dec. If you just drag your screen down, it should take you all the way up and see what it’s laid off of, how it’s laid out. It’s laid off—
Isaac: North Star.
Benjamin: It’s all laid off the North Star. Okay. So some kid might ask you-- and if you notice, it’s got these units of degrees, of 11 h, 12 h. So the hours are really like longitude lines and the degrees of declination are like latitude lines.
Erica: Can you go to real places on the Earth?
Benjamin: Yes, you can. But here’s something I want to show you. Most kids might try to tie this to what’s called 0 to 360 degrees like you see in a surveyor’s scope.
Separately, Oliva and Brittany talked only to each other, though they did listen to the other three teachers. The group behaved as if it were two separate groups: Benjamin, Isaac, and Erica in one group with a computer, and Olivia and Brittany in a second group without a computer, and able to only observe the first group’s computer work.
Figure 1 shows the relative positions of the five group members, and the direction in which authority flowed.

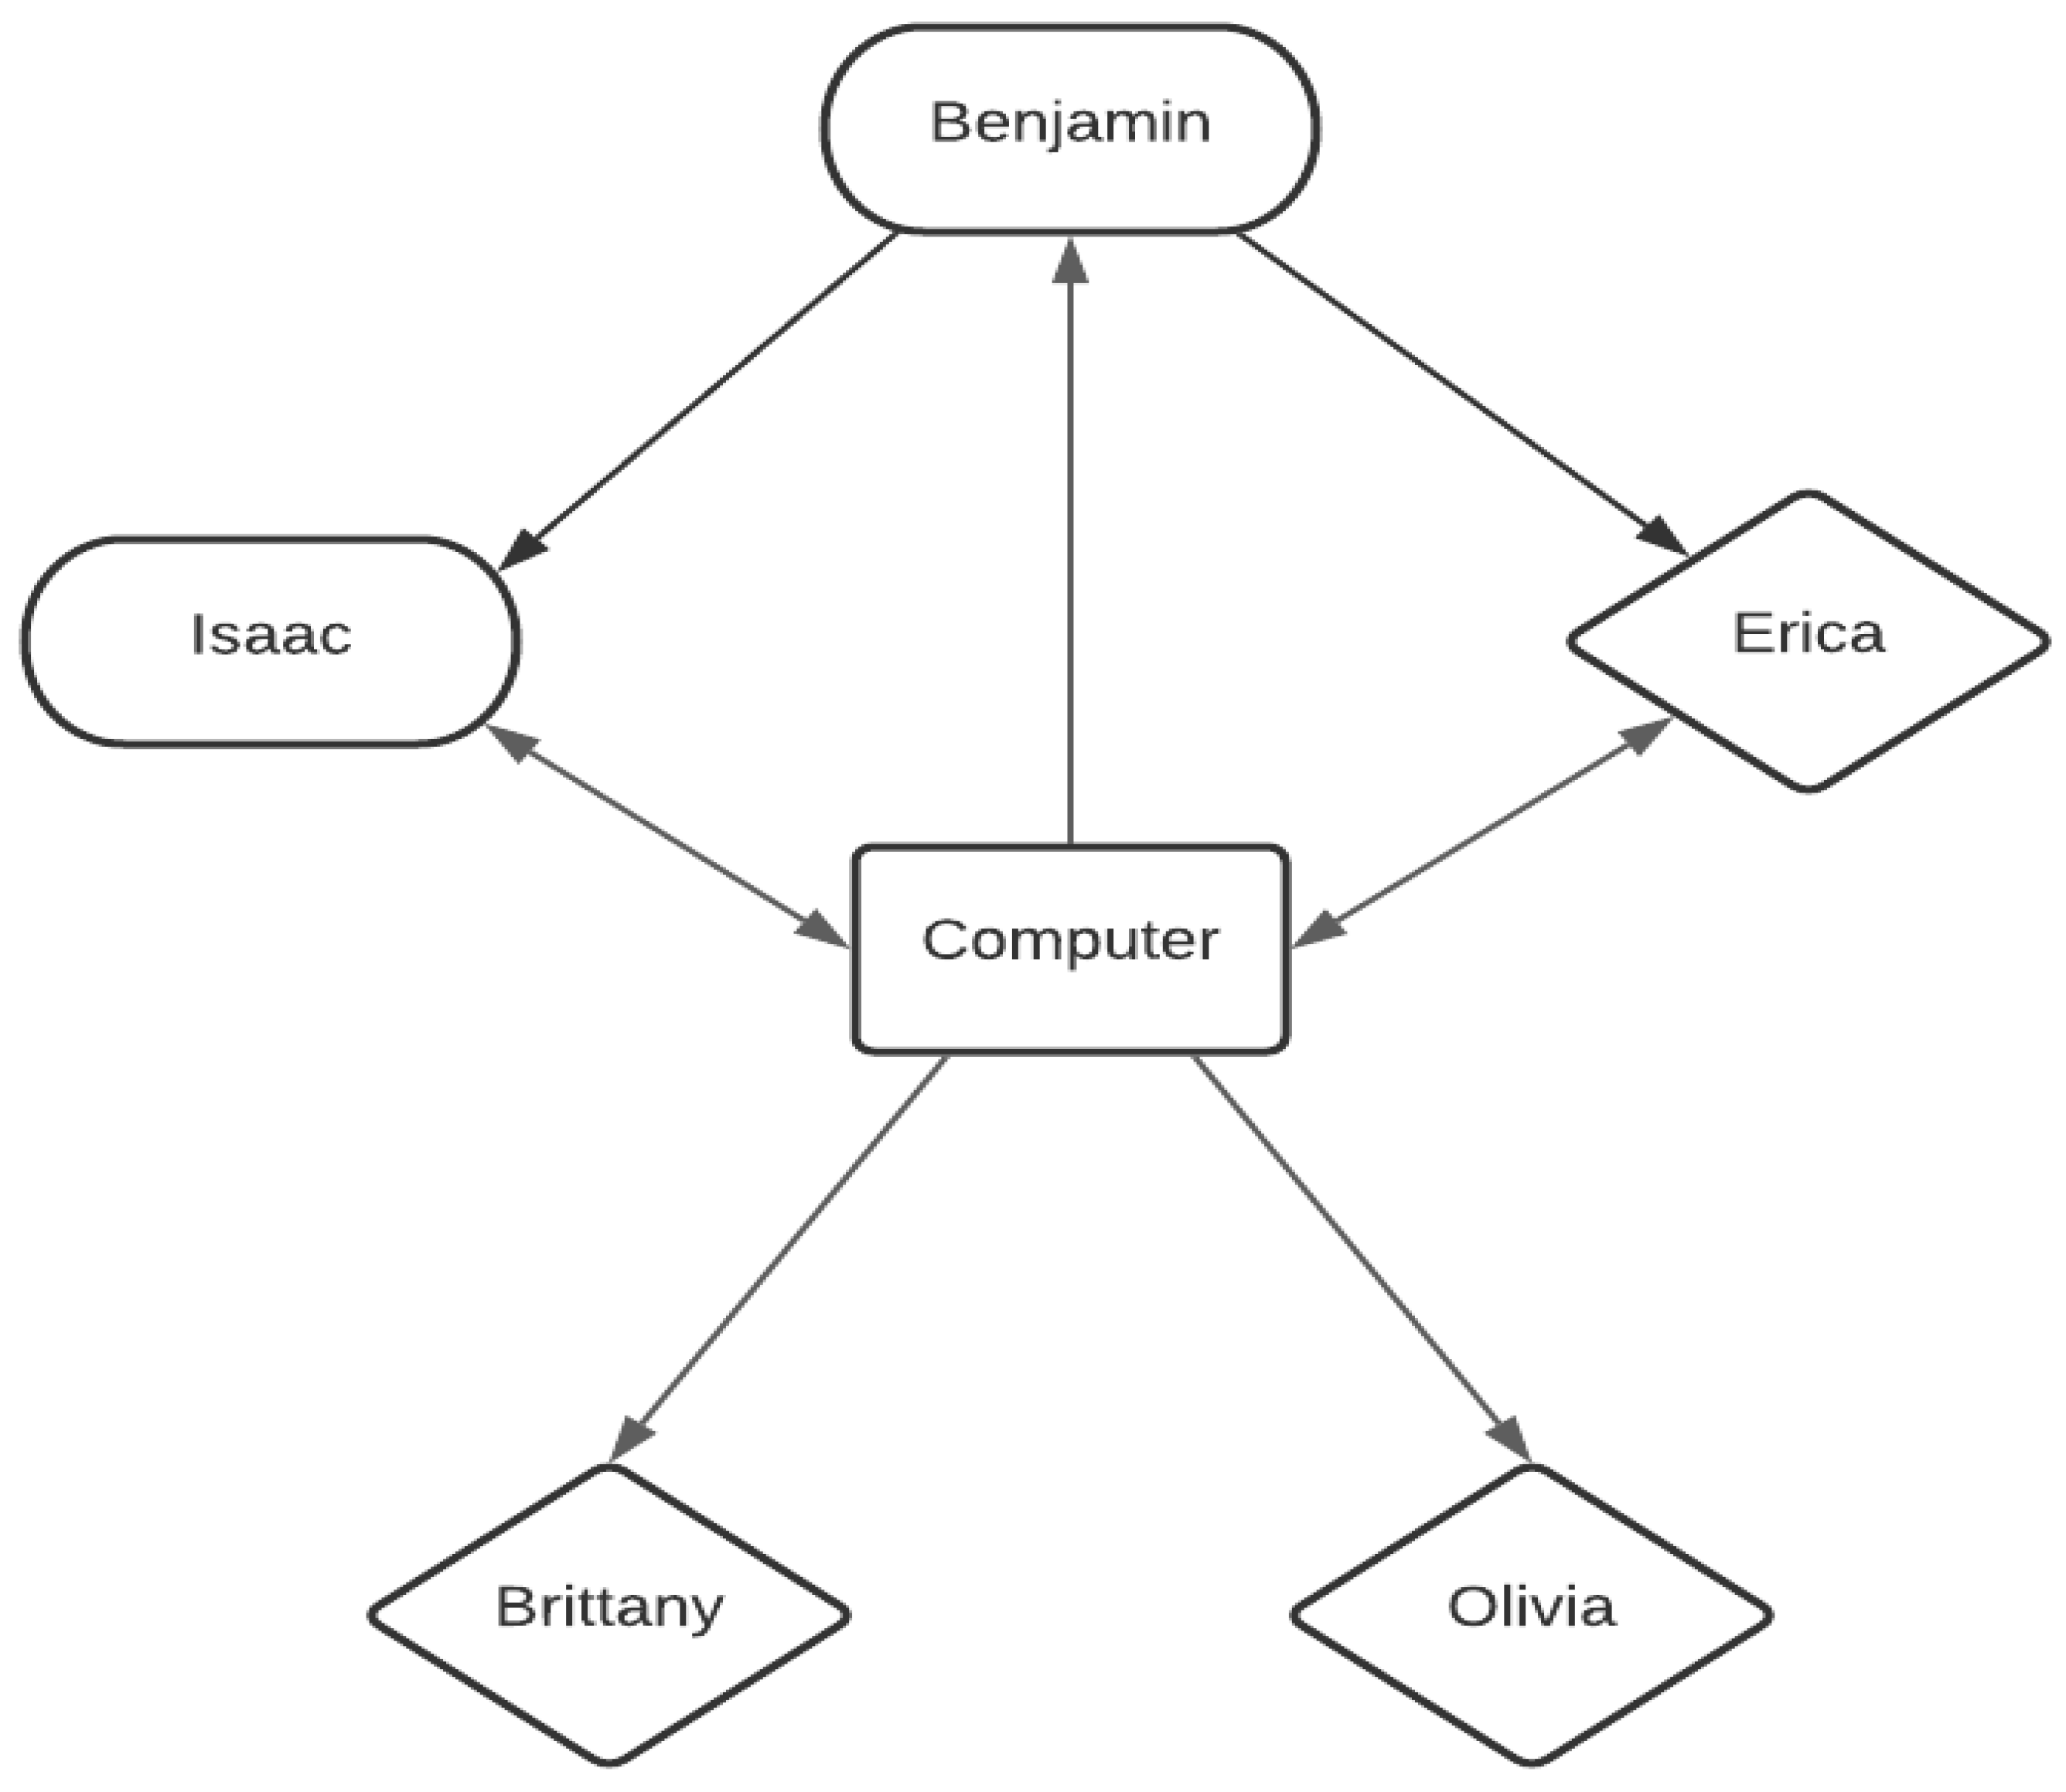
5.6. The Role of the Computer

Benjamin did not control the computer at any point in time, instead choosing to tell Isaac and Erica what to do on the computer. He positioned himself as instructing them in how to use the technology, and even moved them from working with the spreadsheet, to the planetarium program where he was more of an expert.
Isaac frequently controlled the computer and asked some questions. Erica interacted with the computer a little less frequently than Isaac, and there were instances where she and Isaac would together control different aspects of the computer. In Figure 2, Erica can be seen controlling the mouse, while Isaac uses the keyboard.
Olivia and Brittany did not touch the computer at all, though all participants looked at the screen and discussed what they were seeing. Figure 3 shows how control of the computer supported the positioning of the group, as Benjamin instructed Isaac and Erica in how to use the computer, and they then interacted with it.
The planetarium program served as a focal point for the group’s work on sensemaking about the coordinate system and redshift. It is a piece of science-specific technology, and the group members were using it to understand numbers and coordinates (math concepts).

5.7. The Bathroom Break: The Exception That Proves the Rule

At one hour and 21 min into the session, the two males and Erica were floundering in their progress and began trying things randomly to see what would happen. Brittany tried to give suggestions, breaking her previous pattern of sitting back quietly, but the group controlling the computer did not listen to her. The males decided they needed a break and left to use the bathroom at the same time. Brittany moved closer towards the computer, while Erica turned around to talk with her and Olivia, for the first time, as shown in Figure 4 and the quote below.
Erica: So, the best graph that we noticed would have been the redshift. Sense of it. Its distance away.
Brittany: Like _________ taking ____ and mapping it out ______ coordinates with the RA and dec. Then ____ each point, with its redshift values _____ additional object. Then either color code or somehow label if it had _________ radio magnitude or __________ just kind of simplify some of the data. And that’s what I did. __ at all.
Brittany: I don’t know [Google Sheets]. Maybe Excel.
The dynamics between the remaining three females were completely different than with the males in the group. They positioned themselves as equals, posing questions to each other, discussing possible answers, and building their knowledge cooperatively without hierarchy. None of the females touched the computer, but Brittany repeatedly referred to things on the screen when making her points, as shown in Figure 5.
During the five minutes without the males, Erica and Brittany worked more efficiently towards the goals of the assignment than the male-dominated sub-group had done. Olivia worked with them as well but was more soft-spoken and farther from the microphone, so her contributions were not recorded. The conversation style of these three females shifted from the previously mostly alternating discussion where one participant tried to construct their own knowledge individually and then explain to their group members, to a more overlapping style where the group members are constructing knowledge together.
Benjamin returned from his bathroom break a few minutes later and checked in with Brittany to see what they had figured out. She reported on both their work while the males were absent, but also what they had discussed while the males were present.
Brittany: I don’t know. We were having a hard time with this. We were thinking of our 4th graders and how to connect this while you guys are actually analyzing—[laughter]
Benjamin: How would you?
Brittany: I don’t know. The only thing that we talked about was like mapping the data out since you would have the coordinates with the RA and the dec. Then just label each point with its redshift value since the original object… seeing that number. Then maybe color coding, it has radio magnitude or it doesn’t, just using different colors. Then they can map them out and see where they’re falling on the map. So they have that visual.
Brittany correctly made connections between the science of astronomy, of geography, and with math, but before she could get any further than this, Isaac returned. His arrival interrupted Brittany’s work, with Benjamin and Isaac beginning to joke around, and the previous pattern of Isaac, Benjamin, and Erica dominating the computer and audio recording resumed.
In this interaction, Brittany said that she had been playing the classroom game when working with Olivia. However, the authors interpreted the women’s interactions as using sensemaking as part of their playing the classroom game.

5.8. Integrated STEM Discourse

With the exception of Olivia, all of the teachers discussed STEM in an integrated manner, as shown in Table 3. All participants except Olivia discussed declination and right ascension, which were included within the handout of the assignment. Mathematics was discussed in three separate manners: regarding units of time and degrees, understanding tables (such as rows, columns, and sorting them), and math modeling using graphs and color coding for visualization. None of the participants explicitly discussed engineering, and only Benjamin and Isaac explicitly discussed technology—Benjamin as shown in Table 3, Isaac in the below quote.
Isaac: You’ve got ascension and declination both, so how are you going to plot it to both? We did plot against right ascension; we plotted against declination separately. But to go one, you’d have to do range plotting though some of the histograms do that for you. But I tried to change the range on one of them the bar width and it wouldn’t let me. So, whatever. That’s exactly where I was going to go next, was go broader or go narrower on that and see if there was a trend there, but it wouldn’t let us.
When discussing non-STEM content areas, geography concepts were used by both Brittany and Benjamin. Brittany compared maps and graphs, while Benjamin explicitly referred to latitude, longitude, and surveyors’ scopes. Erica extensively discussed language arts, including using science vocabulary words within writing assignments or while talking.

6. Discussion and Conclusions

Using discourse analysis [79] and positioning theory [75,76], the authors investigated three questions revolving around positioning, the usage of technology, and integrated STEM within a case study [84,85] of teachers during a professional development STEM dataset activity. Overall, the in-service teacher participants showed positioning based on multiple factors (including years of teaching experience, subject area and grade level taught, and gender), technology use in relation to the dataset but also in simulation and modeling, and focused on integrated STEM spaces and other disciplinary areas.

6.1. Question 1: Positioning

This study found that the group established a power differential with the two males being the most vocal and active and taking on group mentor roles, and the females being least vocal and taking more passive roles. This aligned not only with existing societal gendered power dynamics, but also with levels of experience, content areas, and age levels of their students. This positioning was primarily established by one of the males and actively supported by the other male and one of the females, while the other two females ceded all power in the group. Participants used the computer to support their positioning, as a focal point of their discussions, and as guidance in their sensemaking of the content and how it would fit into their curriculum.
The more senior teachers assisted the more junior teachers with both content knowledge, and pedagogical content knowledge (PCK). However, they did not assist the most junior teachers with the hands-on skills of using spreadsheets on computers. Therefore, the positioning of the more senior teachers prevented the most junior teachers from using the computer themselves and improving on these technological skills. This group could instead have chosen to rotate control of the computer, for example, but did not choose to do so. However, the group’s decision to have the mid-level participants control the computer (Isaac and Erica), and not the most senior teacher (Benjamin), is of interest. This decision may have been the result of an intersection of both experience with computers and with the content, but more investigation in this area is warranted.

6.2. Question 2: Use of Technology in STEM

The participants used two computer programs during this activity: a planetarium program (Stellarium), and an online spreadsheet (Google Sheets), and these two programs hold multiple roles of technology.
The planetarium program can be considered a science-specific technology and was brought into the conversation as a simulation and modeling tool [44]. The mentor teacher, Benjamin, used the program to educate his peers on specific topics [45] related to coordinates in the sky, and explained how he uses the program in his own teaching [46]. In this way, the program was also used as instructional technology when used by Benjamin [32,33], and as educational technology when the participants used the program themselves [32,34]. Thus, this planetarium program fit multiple models of using technology within the classroom.
The spreadsheet program to analyze the data was also used in multiple ways. Because this program was used by the participants as learners in the PD classroom, it can be considered instructional technology [32,33]. It was used for data visualization, which is usually considered a form of mathematical modeling [43], and also to analyze the data [11,42]. Since Krauss and Prottsman [36] also consider data visualization and pattern recognition to be important computational thinking skills, this usage of the spreadsheet program may have also fallen into computational thinking. This spreadsheet program fits the Hsu and Sharma [44] descriptors of science-specific technologies as involving data analysis and online collaborative tools. However, it is worth noting that a number of participants in other groups revealed prior experience with spreadsheets in other contexts (such as budgeting and financial analysis, and stock inventory), meaning that while spreadsheets may fit this description of “science-specific technology,” they are not actually specific to science.
These teachers used the two programs on the computer in multiple modes of technology usage within STEM, including educational and instructional technology, and for data visualization and analysis, which are both mathematical modeling and computational thinking. There was no evidence of these teachers taking the computational thinking a further step to programming, and the science-specific technology evidence is inconclusive.

6.3. Question 3: Integrated STEM

The participants discussed connections between astronomical coordinates and geographical coordinates, integrating different science disciplines. They shifted between the scientific meaning of the coordinates, and mathematical approaches to the numbers, integrating across STEM. And they discussed building students’ technical writing skills, integrating out from STEM to other fields.
As a group, the teachers integrated one science discipline (astronomy), mathematics (angles, time, graphical representations), technology (such as computational thinking including using a computer to visualize data), and two non-STEM disciplines (geography and language arts). This does not fit within the Burrows and Slater [20] iSTEM model, which does not include non-STEM fields. Perhaps the iSTEM model could be expanded with two additional dimensions or qualifiers: one for integration of technology, and one for integration of non-STEM topics.
Overall, science (e.g., astronomy), technology (e.g., datasets), engineering (e.g., simulation), and mathematics (e.g., modeling) were discussed by the in-service teachers in addition to other disciplinary areas (e.g., geography).

6.4. Summary

The evidence of this study shows that teachers in this group established positions based upon their years of experience, grade level, and gender, which served to both mentor the teachers in the middle, but also exclude the teachers with the least experience. These teachers approached datasets as a combination of technology and math, even when the activity was science focused, and they did integrate all aspects of STEM, as well as subjects outside STEM.

7. Future Research

Educational researchers still do not understand all the mechanics by which STEM students learn how to “do gender” [66] (p. 2). Additional studies are needed on whether students observe teachers’ gendered power dynamics between themselves; to explore teachers’ power dynamics when separating out the factors of gender, educational attainment, etc.; and whether they do this same positioning in situations other than PD. Further studies into the power structure of group usage of computers in STEM would help to better clarify whether status based on gender, experience, or content area is more likely to dominate these decisions. Since the literature shows that the self-efficacy of female students is lower than that of their male peers despite similar or higher levels of achievement in STEM [94,95,96], future research to help distinguish between these multiple factors among in-service teachers could be beneficial.
The teachers in this study often integrated writing and communication into the STEM space, which leads to the importance of utilizing skills and practices from all disciplines. Teacher educators, teachers, and educational researchers should have a working knowledge of integrated STEM categorization frameworks to further enhance offerings for maximum benefits. In addition, further work needs to be performed to determine how teachers perform sensemaking and integration across the disciplines.
This study was performed using an astronomical dataset from the Sloan Digital Sky Survey. More work needs to be done with teachers working with different datasets, for example, environmental studies may prove to be an inherently interdisciplinary field similar to astronomy. It could be fruitful to study teachers working with other open-access datasets, such as the University of Wyoming Data Corral (https://datacorral.uwyo.edu/, accessed on 24 January 2022).
Additionally, future work could focus on determining which specific aspects of dataset usage promote integrated STEM learning.

8. Implications

Integrated STEM frameworks might not specifically address the use of technology, nor distinguish between integrating within STEM, and often do not address integrating STEM with non-STEM [18,20]. Participants in this study integrated astronomy (science), mathematics, technology, geography (science or social science), and communication skills. Integrating at least two disciplines can be categorized as a Level Two [20], but since science, mathematics, and technology were highlighted, this study’s activity is more in line with Level Three categorization.
With these results, the authors offer a few recommendations to consider in addition to focusing on integrated STEM frameworks. This work showcases that during PD, teachers working in groups do form a hierarchy. Higher education faculty members running PD workshops for teachers may wish to:
  • Confront this hierarchy, and there are approaches to this end.
  • Assign teachers to work in smaller groups (fewer than five individuals) which may encourage all individuals to participate and thus reduce the “unknowns in the back” phenomenon.
  • Assign homogeneous groups, that is, single sex, similar years of experience, age group of their students, and subject areas, which may reduce the formation of power structures based on these characteristics; however, it does not directly challenge these power structures, and there may be other reasons to prefer assigning heterogeneous groups, or allowing self-selection of groups.
  • Arrange activities including the use of computers with one computer per one teacher, however this is not an option for all PD instructors, and even if it is an option, doing so may negatively impact collaboration between the teachers. If PD is taking place over a prolonged period (such as multiple days, whether contiguous or with gaps between the days), the teachers could be encouraged to rotate who controls the computer on each day.
These strategies may also be worth trying with other populations such as primarily through post-secondary students, as has been previously recommended by the authors [6]. Primary and secondary teachers themselves may wish to become more aware of their gendered interactions with their peers, especially where they can be observed by students, but more research needs to be done in a school setting to see whether and how students observe these interactions.
This study begins to address the gap in the literature of how STEM teachers learn to work with technology in an integrated STEM setting, and some strategies are shown for addressing power structures during PD. Evidence was presented that teachers approach datasets as a combination of technology and math, even when set with a science focus. Professional development workshops involving datasets in STEM content areas can be used to aid teachers with integrated STEM processes and activities.
The last words on the transcript were spoken by Benjamin. He perfectly encapsulated both the hierarchy that the group established, and the flaws to this hierarchy when he said, “We should have listened to the elementary teachers. They’re always right”. By excluding Olivia and Brittany from the majority of the group’s work, the group did not hear their voices and lost their contributions.

Author Contributions

Conceptualization, A.C.S. and A.C.B.; methodology, A.C.S. and A.C.B.; validation, A.C.S.; formal analysis, A.C.S.; investigation, A.C.S. and A.C.B.; resources, A.C.S. and A.C.B.; data curation, A.C.S.; writing—original draft preparation, A.C.S.; writing—review and editing, A.C.S. and A.C.B.; visualization, A.C.S.; supervision, A.C.B.; project administration, A.C.S.; funding acquisition, A.C.B. All authors have read and agreed to the published version of the manuscript.

Funding

This research was funded in part by the Wyoming Department of Education under LASSI grant #WY140202, and by the US National Science Foundation SWARMS grant #1339853 and EPSCoR K-12 EOD grant #1655726. Any opinions, findings, conclusions, or recommendations expressed in this material are those of the authors and do not necessarily reflect the views of the National Science Foundation.

Institutional Review Board Statement

The study was conducted in accordance with the Declaration of Helsinki and approved by the Institutional Review Board of the University of Wyoming (protocol # 20140530AS0045, approved 30 May 2014).

Informed Consent Statement

Informed consent was obtained from all subjects involved in the study.

Data Availability Statement

The data are not publicly available due to IRB privacy concerns.

Acknowledgments

The authors would like to thank the participants of this study, the University of Wyoming Department of Physics and Astronomy and Quinsigamond Community College for their support of this research, and our transcriber, Barbara Bogart.

Conflicts of Interest

The authors declare no conflict of interest. The funders had no role in the design of the study; in the collection, analyses, or interpretation of data; in the writing of the manuscript, or in the decision to publish the results.

References

  1. Hill, C.; Corbett, C.; St Rose, A. Why So Few?: Women in Science, Technology, Engineering, and Mathematics; AAUW: Boston, MA, USA, 2010. [Google Scholar]
  2. Microsoft. Why Europe’s Girls Aren’t Studying STEM; Microsoft Philanthropies: Redmond, WA, USA, 2017. [Google Scholar]
  3. Berwick, C. Keeping Girls in STEM: 3 Barriers, 3 Solutions. 2019. Available online: https://www.edutopia.org/article/keeping-girls-stem-3-barriers-3-solutions (accessed on 26 October 2021).
  4. Shapiro, M.; Grossman, D.; Carter, S.; Martin, K.; Deyton, P.; Hammer, D. Middle School Girls and the “Leaky Pipeline” to Leadership. Middle Sch. J. 2015, 46, 3–13. [Google Scholar] [CrossRef]
  5. Burrows, A.C.; Borowczak, M.; Myers, A.; Schwortz, A.C.; McKim, C. Integrated STEM for teacher professional learning and development: “I need time for practice”. Educ. Sci. 2021, 11, 21. [Google Scholar] [CrossRef]
  6. Schwortz, A.C.; Burrows, A.C. Authentic science experiences with STEM datasets: Post-secondary results and potential gender influences. Res. Sci. Technol. Educ. 2020, 39, 347–367. [Google Scholar] [CrossRef]
  7. Bailey, J.M. Astronomy Education Research: Developmental History of the Field and Summary of the Literature; National Research Council Board on Science Education: Washington, DC, USA, 2011. [Google Scholar]
  8. Tesfaye, C.L.; White, S. High School Physics Teacher Preparation; American Institute of Physics: College Park, MD, USA, 2012. [Google Scholar]
  9. Physics Teacher Education Coalition (PhysTEC). The Shortage of Physics Teachers. 2020. Available online: https://phystec.org/teacher-shortage (accessed on 29 August 2021).
  10. Committee on STEM Education. Charting a Course for Success: America’s Strategy for STEM Education; National Science & Technology Council: Washington, DC, USA, 2018.
  11. Council of Chief State School Officers. Common Core State Standards Math; National Governors Association Center for Best Practices: Washington, DC, USA, 2010. [Google Scholar]
  12. National Research Council. Next Generation Science Standards: For States, by States; National Academies Press: Washington, DC, USA, 2013. [Google Scholar]
  13. Achieve. Connecting Science Standards with Assessment: A Snapshot of three Countries’ Approaches—England, Hong Kong, and Canada; Achieve: Washington, DC, USA, 2010. [Google Scholar]
  14. Achieve. International Science Benchmarking Report: Taking the Lead in Science Education: Forging Next-Generation Science Standards; Achieve: Washington, DC, USA, 2010. [Google Scholar]
  15. Gao, X.; Li, P.; Shen, J.; Sun, H. Reviewing assessment of student learning in interdisciplinary STEM education. Int. J. STEM Educ. 2020, 7, 24. [Google Scholar] [CrossRef]
  16. Struyf, A.; De Loof, H.; Boeve-de Pauw, J.; Van Petegem, P. Students’ engagement in different STEM learning environments: Integrated STEM education as promising practice? Int. J. Sci. Educ. 2019, 41, 1387–1407. [Google Scholar] [CrossRef]
  17. Guzey, S.S.; Caskurlu, S.; Kozan, K. Integrated STEM pedagogies and student learning. In Handbook of Research on STEM Education; Johnson, C.C., Mohr-Schroeder, M.J., Moore, T.J., English, L.D., Eds.; Taylor & Francis: New York, NY, USA, 2020; pp. 65–75. [Google Scholar]
  18. Moore, T.J.; Johnston, A.C.; Glancy, A.W. STEM integration: A synthesis of conceptual frameworks and definitions. In Handbook of Research on STEM Education; Johnson, C.C., Mohr-Schroeder, M.J., Moore, T.J., English, L.D., Eds.; Taylor & Francis: New York, NY, USA, 2020; pp. 3–16. [Google Scholar]
  19. Jackson, C.; Tank, K.M.; Appelgate, M.H.; Jurgenson, K.; Delaney, A.; Erden, C. History of integrated STEM curriculum. In Handbook of Research on STEM Education; Johnson, C.C., Mohr-Schroeder, M.J., Moore, T.J., English, L.D., Eds.; Taylor & Francis: New York, NY, USA, 2020; pp. 169–183. [Google Scholar]
  20. Burrows, A.; Slater, T. A Proposed Integrated STEM Framework for Contemporary Teacher Preparation. Teach. Educ. Pract. 2015, 28, 318–330. [Google Scholar]
  21. Thuy, N.T.T.; Bien, N.V.; Quy, D.X. Fostering Teachers’ Competence of the Integrated STEM Education. J. Penelit. Dan Pembelajaran IPA 2020, 6, 166. [Google Scholar] [CrossRef]
  22. Abello, J.; Pardalos, P.; Resende, M. (Eds.) The Preface. In Handbook of Massive Data Sets; Kluwer Academic Publishers: Dordrecht, The Netherlands, 2002. [Google Scholar]
  23. Brunner, R.J.; Djorgovski, S.G.; Prince, T.A.; Szalay, A.S. Massive datasets in astronomy. In Handbook of Massive Data Sets; Abello, J., Pardalos, P., Resende, M., Eds.; Kluwer Academic Publishers: Dordrecht, The Netherlands, 2002. [Google Scholar]
  24. Leskovec, J.; Rajaraman, A.; Ullman, J.D. Mining of Massive Datasets; Cambridge University Press: Cambridge, UK, 2011. [Google Scholar]
  25. Campbell, T.; Abd-Hamid, N.H. Technology use in science instruction (TUSI): Aligning the integration of technology in science instruction in ways supportive of science education reform. J. Sci. Educ. Technol. 2013, 22, 572–588. [Google Scholar] [CrossRef]
  26. Cheruvelil, K.S.; Soranno, P.A. Data-Intensive Ecological Research Is Catalyzed by Open Science and Team Science. BioScience 2018, 68, 813–822. [Google Scholar] [CrossRef]
  27. Anderson, J.O.; Lin, H.S.; Treagust, D.F.; Ross, S.P.; Yore, L.D. Using large-scale assessment datasets for research in science and mathematics education: Programme for International Student Assessment (PISA). Int. J. Sci. Math. Educ. 2007, 5, 591–614. [Google Scholar] [CrossRef]
  28. Berg, C.; Boote, S. Format Effects of Empirically Derived Multiple-Choice Versus Free-Response Instruments When Assessing Graphing Abilities. Int. J. Sci. Math. Educ. 2017, 15, 19–38. [Google Scholar] [CrossRef]
  29. Gültepe, N. Reflections on high school students’ graphing skills and their conceptual understanding of drawing chemistry graphs. Kuram Uygul. Egit. Bilimleri 2016, 16, 53–81. [Google Scholar] [CrossRef]
  30. Jackson, D.F.; Edwards, B.J.; Berger, C.F. Teaching the design and interpretation of graphs through computer-aided graphical data analysis. J. Res. Sci. Teach. 1993, 30, 483–501. [Google Scholar] [CrossRef]
  31. Wallace, R.M.C.; Kupperman, J.; Krajcik, J.; Soloway, E. Science on the web: Students online in a sixth-grade classroom. J. Learn. Sci. 2000, 9, 75–104. [Google Scholar] [CrossRef]
  32. Kilty, T.J. Technology Integration and Science Education: An Instructional Design and Technology Perspective. University of Wyoming. 2019. Available online: https://search-proquest-com.libproxy.uwyo.edu/docview/2385176771?accountid=14793 (accessed on 24 September 2020).
  33. Reiser, R.A. What Field Did You Say You Were in? Defining and Naming Our Field. In Trends and Issues in Instructional Design and Technology, 3rd ed.; Reiser, R.A., Dempsey, J.V., Eds.; Pearson: Boston, MA, USA, 2012; pp. 1–7. Available online: http://catalogue.pearsoned.ca/assets/hip/us/hip_us_pearsonhighered/samplechapter/0132563584.pdf (accessed on 17 October 2020).
  34. Ng, O.-L.; Shi, L.; Ting, F. Exploring differences in primary students’ geometry learning outcomes in two technology-enhanced environments: Dynamic geometry and 3D printing. Int. J. STEM Educ. 2020, 7, 50. [Google Scholar] [CrossRef]
  35. K-12 Computer Science Framework. 2016. Available online: http://www.k12cs.org (accessed on 17 October 2020).
  36. Krauss, J.; Prottsman, K. Computational Thinking and Coding for Every Student: The Teacher’s Getting Started Guide; Corwin Press: Thousand Oaks, CA, USA, 2018. [Google Scholar]
  37. Heron, P.; McNeil, L. Phys21: Preparing Physics Students for 21st-Century Careers; Joint Task Force on Undergraduate Physics Programs: College Park, MD, USA, 2016. [Google Scholar]
  38. AAPT UCTF. AAPT Recommendations for Computational Physics in the Undergraduate Physics Curriculum. Ameri-can Association of Physics Teachers. 2016. Available online: https://www.aapt.org/Resources/upload/AAPT_UCTF_CompPhysReport_final_B.pdf (accessed on 5 March 2019).
  39. 40 Ridgway, R. Building Bridges with Computational Thinking|NSTA. Available online: https://www.nsta.org/science-scope/science-scope-aprilmay-2020/building-bridges-computational-thinking (accessed on 17 October 2020).
  40. Wiebe, E.; Kite, V.; Park, S. Integrating computational thinking in STEM. In Handbook of Research on STEM Education; Johnson, C.C., Mohr-Schroeder, M.J., Moore, T.J., English, L.D., Eds.; Taylor & Francis Group: New York, NY, USA, 2020; pp. 196–209. Available online: https://ebookcentral.proquest.com/lib/uwy/reader.action?docID=6186714 (accessed on 25 October 2020).
  41. Hjalmarson, M.A.; Holincheck, N.; Baker Courtney, K.; Galanti, T.M. Learning models and modeling across the STEM disciplines. In Handbook of Research on STEM Education; Johnson, C.C., Mohr-Schroeder, M.J., Moore, T.J., English, L.D., Eds.; Taylor & Francis: New York, NY, USA, 2020; pp. 223–233. [Google Scholar]
  42. National Research Council. New Worlds, New Horizons in Astronomy and Astrophysics; National Research Council: Washington, DC, USA, 2010. Available online: http://sites.nationalacademies.org/bpa/bpa_049810 (accessed on 20 November 2018).
  43. Resnick, I.; Kastens, K.A.; Shipley, T.F. How students reason about visualizations from large professionally collected data sets: A study of students approaching the threshold of data proficiency. J. Geosci. Educ. 2018, 66, 55–76. [Google Scholar] [CrossRef]
  44. Hsu, P.-S.; Sharma, P. A case study of enabling factors in the technology integration change process. J. Educ. Technol. Soc. 2008, 11, 213–228. [Google Scholar]
  45. Kersaint, G.; Ritzhaupt, A.D.; Liu, F. Technology to enhance mathematics and science instruction: Changes in teacher perceptions after participating in a yearlong professional development program. J. Comput. Math. Sci. Teach. 2013, 33, 73–101. [Google Scholar]
  46. Morrell, P.; Rogers, M.P.; Pyle, E.; Roehrig, G.; Veal, W. 2020 NSTA/ASTE Standards for Science Teacher Preparation; National Science Teaching Association: Arlington, VA, USA, 2020. [Google Scholar]
  47. Burrows, A.C.; DiPompeo, M.A.; Myers, A.D.; Hickox, R.C.; Borowczak, M.; French, D.A.; Schwortz, A.C. Authentic science experiences: Pre-collegiate science educators’ successes and challenges during professional development. Probl. Educ. 21st Century 2016, 70, 59–73. [Google Scholar] [CrossRef]
  48. Spuck, T. Putting the “authenticity” into science learning. In Einstein Fellows: Best Practices in STEM Education; Spuck, T., Leigh, J., Eds.; Peter Lang: New York, NY, USA, 2014; pp. 118–157. [Google Scholar]
  49. Gao, S.; Wang, J.; Zhong, Z. Influence of science instruction reform on academic performance of eighth grade students in Chinese inner-Mongolia autonomous region. Comp. J. Comp. Int. Educ. 2018, 48, 879–895. [Google Scholar] [CrossRef]
  50. Odden, T.O.; Russ, R.S. Defining sensemaking: Bringing clarity to a fragmented theoretical construct. Sci. Educ. 2019, 103, 187–205. [Google Scholar] [CrossRef] [Green Version]
  51. Weick, K.E.; Sutcliffe, K.M.; Obstfeld, D. Organizing and the process of sensemaking. Organ. Sci. 2005, 16, 409–421. [Google Scholar] [CrossRef] [Green Version]
  52. Coburn, C.E. Collective sensemaking about reading: How teachers mediate reading policy in their professional communities. Educ. Eval. Policy Anal. 2001, 23, 145–170. [Google Scholar] [CrossRef] [Green Version]
  53. Vygotsky, L. Mind in Society: The Development of Higher Psychological Processes; Harvard University Press: Cambridge, MA, USA, 1978. [Google Scholar]
  54. Reeves, T.C. The classroom game. Acad. Quest. 2001, 14, 21–30. [Google Scholar] [CrossRef]
  55. Hutchison, P.; Hammer, D. Attending to student epistemological framing in a science classroom. Sci. Educ. 2010, 94, 506–524. [Google Scholar] [CrossRef]
  56. März, V.; Kelchtermans, G. Sensemaking and structure in teachers’ reception of educational reform. A case study on statistics in the mathematics curriculum. Teach. Teach. Educ. 2013, 29, 13–24. [Google Scholar] [CrossRef]
  57. Spillane, J.P.; Reiser, B.J.; Reimer, T. Policy implementation and cognition: Reframing and refocusing implementation research. Rev. Educ. Res. 2002, 72, 387–431. [Google Scholar] [CrossRef] [Green Version]
  58. Buck, G.A.; Francis, D.C.; Wilkins-Yel, K.G. Research on gender equity in STEM education. In Handbook of Research on STEM Education; Johnson, C.C., Mohr-Schroeder, M.J., Moore, T.J., English, L.D., Eds.; Taylor & Francis: New York, NY, USA, 2020; pp. 289–299. [Google Scholar]
  59. Wade-Jaimes, K. ‘STEM girls should be’: A discourse analysis of school structures and their impact on African American, middle school girls’ positioning in science. Discourse Stud. Cult. Politics Educ. 2020, 42, 828–839. [Google Scholar] [CrossRef]
  60. Dancy, M.; Rainey, K.; Stearns, E.; Mickelson, R.; Moller, S. Undergraduates’ awareness of White and male privilege in STEM. Int. J. STEM Educ. 2020, 7, 52. [Google Scholar] [CrossRef]
  61. Corbett, C.; Hill, C. Solving the Equation: The Variables for Women’s Success in Engineering and Computing; AAUW: Washington, DC, USA, 2015. [Google Scholar]
  62. Ellis, J.; Fosdick, B.K.; Rasmussen, C. Women 1.5 Times More Likely to Leave STEM Pipeline after Calculus Compared to Men: Lack of Mathematical Confidence a Potential Culprit. PLoS ONE 2016, 11, e0157447. [Google Scholar] [CrossRef]
  63. Riegle-Crumb, C.; King, B.; Grodsky, E.; Muller, C. The more things change, the more they stay the same? Prior achievement fails to explain gender inequality in entry into STEM college majors over time. Am. Educ. Res. J. 2012, 49, 1048–1073. [Google Scholar] [CrossRef] [Green Version]
  64. Stearns, E.; Bottia, M.C.; Giersch, J.; Mickelson, R.A.; Moller, S.; Jha, N.; Dancy, M. Do Relative Advantages in STEM Grades Explain the Gender Gap in Selection of a STEM Major in College? A Multimethod Answer. Am. Educ. Res. J. 2020, 57, 218–257. [Google Scholar] [CrossRef]
  65. Ball, C.; Huang, K.-T.; Rikard, R.V.; Cotten, S.R. The emotional costs of computers: An expectancy-value theory analysis of predominantly low-socioeconomic status minority students’ STEM attitudes. Inf. Commun. Soc. 2019, 22, 105–128. [Google Scholar] [CrossRef] [Green Version]
  66. Day, J.; Stang, J.B.; Holmes, N.G.; Kumar, D.; Bonn, D.A. Gender gaps and gendered action in a first-year physics laboratory. Phys. Rev. Phys. Educ. Res. 2016, 12, 020104. [Google Scholar] [CrossRef]
  67. Stoilescu, D.; Egodawatte, G. Gender differences in the use of computers, programming, and peer interactions in computer science classrooms. Comput. Sci. Educ. 2010, 20, 283–300. [Google Scholar] [CrossRef]
  68. Corp, A.; Fields, M.; Naizer, G. Elementary STEM teacher education: Recent practices to prepare general elementary teachers for STEM. In Handbook of Research on STEM Education; Johnson, C.C., Mohr-Schroeder, M.J., Moore, T.J., English, L.D., Eds.; Taylor & Francis: New York, NY, USA, 2020; pp. 337–348. [Google Scholar]
  69. Burrows, A.C. Secondary Teacher and University Partnerships: Does Being in a Partnership Create Teacher Partners?—ProQuest. Retrieved 15 February 2016. 2011. Available online: http://search.proquest.com.libproxy.uwyo.edu/docview/894265674?pq-origsite=summon (accessed on 15 February 2016).
  70. Schwortz, A.C.; Burrows, A.C.; Guffey, S.K. Mentoring partnerships in science education. Educ. Action Res. 2017, 25, 630–649. [Google Scholar] [CrossRef] [Green Version]
  71. Burrows, A.C. Partnerships: A Systemic Study of Two Professional Developments with University Faculty and K-12 Teachers of Science, Technology, Engineering, and Mathematics. Probl. Educ. 21st Century 2015, 65, 28–38. Available online: http://journals.indexcopernicus.com/abstract.php?icid=1163178 (accessed on 16 October 2018). [CrossRef]
  72. Lefever-Davis, S.J. Two sides of a partnership: Egalitarianism and empowerment in school-university partnerships. J. Educ. Res. 2007, 100, 204–210. [Google Scholar] [CrossRef]
  73. Stringer, H. Navigating the Power Differential. GradPSYCH 2016, 14, 35–37. Available online: https://www.apa.org/gradpsych/2016/01/power-differential (accessed on 26 October 2021).
  74. McVee, M.B. Postitioning theory: Affordances for educational researchers. In Sociocultural Positioning in Literacy: Exploring Culture, Discourse, Narrative, & Power in Diverse Educational Contexts; McVee, M.B., Brock, C.H., Glazier, J.A., Eds.; Hampton Press, Inc.: Cresskill, NJ, USA, 2003; pp. 1–21. [Google Scholar]
  75. Harré, R.; Van Lagenhove, L. Introducing positioning theory. In Positioning Theory: Moral Contexts of Intentional Action; Harré, R., Van Lagenhove, L., Eds.; Blackwell Publishing Ltd.: Oxford, UK, 1999; pp. 14–31. [Google Scholar]
  76. Wieselmann, J.R.; Keratithamkul, K.; Dare, E.A.; Ring-Whalen, E.A.; Roehrig, G.H. Discourse Analysis in Integrated STEM Activities: Methods for Examining Power and Positioning in Small Group Interactions. Res. Sci. Educ. 2020, 51, 113–133. [Google Scholar] [CrossRef]
  77. McVee, M.B.; Swenson, J.; English, K.; Shanahan, L. A review of theory and methods for sociocultural research in science and engineering education. J. Adolesc. Adult Lit. 2020, 64, 360–363. [Google Scholar] [CrossRef]
  78. Koro-Ljungberg, M.; Yendol-Hoppey, D.; Smith, J.J.; Hayes, S.B. (E)pistemological Awareness, Instantiation of Methods, and Uninformed Methodological Ambiguity in Qualitative Research Projects on JSTOR. Educ. Res. 2009, 39, 687–699. [Google Scholar] [CrossRef]
  79. Gee, J.P. How to Do Discourse Analysis: A Toolkit; Routledge: New York, NY, USA, 2011. [Google Scholar]
  80. Roychoudhury, A.; Tippins, D.J.; Nichols, S.E. Gender-inclusive science teaching: A feminist-constructivist approach. J. Res. Sci. Teach. 1995, 32, 897–924. [Google Scholar] [CrossRef]
  81. Riger, S. Epistemological debates, feminist voices: Science, social values, and the study of women. Am. Psychol. 1992, 47, 730–740. [Google Scholar] [CrossRef]
  82. Godec, S. Sciencey girls: Discourses supporting working-class girls to identify with science and its potential for examining social equity issues in science education. Educ. Sci. 2018, 8, 19. [Google Scholar] [CrossRef] [Green Version]
  83. Fiaccadori, E. The Question of ‘Nature’: What Has Social Constructionism to Offer Feminist Theory? Goldsmiths; University of London: London, UK, 2006. [Google Scholar]
  84. Creswell, J.W. Qualitative Inquiry & Research Design: Choosing Among Five Approaches; SAGE Publications: Los Angeles, CA, USA, 2013. [Google Scholar]
  85. Stake, R. The Art of Case Study; SAGE Publications: Thousand Oaks, CA, USA, 1995. [Google Scholar]
  86. Ellis, J.; Wieselmann, J.; Sivaraj, R.; Roehrig, G.; Dare, E.; Ring-Whalen, E. Toward a productive definition of technology in science and STEM education. Contemp. Issues Technol. Teach. Educ. 2020, 20, 472–496. [Google Scholar]
  87. Burrows, A.C.; Swarts, G.P.; Hutchison, L.; Katzmann, J.M.; Thompson, R.; Freeman, L.; Schanke, A.; Kilty, T.; Reynolds, T. Finding spaces: Teacher education technology competencies (TETCs). Educ. Sci. 2021, 11, 733. [Google Scholar] [CrossRef]
  88. Ntemngwa, C.; Oliver, J.S. The implementation of integrated science technology, engineering and mathematics (STEM) instruction using robotics in the middle school science classroom. Int. J. Educ. Math. Sci. Technol. 2018, 6, 12–40. [Google Scholar] [CrossRef] [Green Version]
  89. Thibaut, L.; Ceuppens, S.; De Loof, H.; De Meester, J.; Goovaerts, L.; Struyf, A.; Boeve-de Pauw, J.; Dehaene, W.; Deprez, J.; De Cock, M.; et al. Integrated STEM Education: A Systematic Review of Instructional Practices in Secondary Education. Eur. J. STEM Educ. 2018, 3, 2. [Google Scholar] [CrossRef]
  90. Yildirim, B.; Sahin-Topalcengiz, E.; Arikan, G.; Timur, S. Using Virtual Reality in the Classroom: Reflections of STEM Teachers on the Use of Teaching and Learning Tools. J. Educ. Sci. Environ. Health 2020, 6, 231–245. [Google Scholar] [CrossRef]
  91. Schneider, D.P.; Hall, P.B.; Richards, G.T.; Strauss, M.A.; Vanden Berk, D.E.; Anderson, S.F.; Brandt, W.N.; Fan, X.; Jester, S.; Gray, J.; et al. The Sloan Digital Sky Survey Quasar Catalog. IV. Fifth Data Release. Astron. J. 2007, 134, 102–117. [Google Scholar] [CrossRef] [Green Version]
  92. Shen, Y.; Richards, G.T.; Strauss, M.A.; Hall, P.B.; Schneider, D.P.; Snedden, S.; Bizyaev, D.; Brewington, H.; Malanushenko, V.; Malanushenko, E.; et al. A catalog of quasar properties from Sloan Digital Sky Survey Data Release 7. Astrophys. J. Suppl. Ser. 2011, 194, 45. [Google Scholar] [CrossRef]
  93. Åkerblom, D.; Lindahl, M. Authenticity and the relevance of discourse and figured worlds in secondary students’ discussions of socioscientific issues. Teach. Teach. Educ. 2017, 65, 205–214. [Google Scholar] [CrossRef]
  94. Bazzul, J. Critical discourse analysis and science education texts: Employing Foucauldian notions of discourse and subjectivity. Rev. Educ. Pedagog. Cult. Stud. 2014, 36, 422–437. [Google Scholar] [CrossRef]
  95. Doran, Y.J. The Discourse of Physics: Building Knowledge through Language, Mathematics and Image; Routledge: New York, NY, USA, 2018. [Google Scholar]
  96. Hao, J. Analyzing Scientific Discourse from a Systemic Functional Linguistic Perspective: A Framework for Exploring Knowledge Building in Biology; Routledge: New York, NY, USA, 2020. [Google Scholar]
  97. Kranzfelder, P.; Bankers-Fulbright, J.L.; García-Ojeda, M.E.; Melloy, M.; Mohammed, S.; Warfa, A.R. The Classroom Discourse Observation Protocol (CDOP): A quantitative method for characterizing teacher discourse moves in undergraduate STEM learning environments. PLoS ONE 2019, 14, e0219019. [Google Scholar] [CrossRef] [Green Version]
  98. Lee, S.C.; Irving, K.E. Development of two-dimensional Classroom Discourse Analysis Tool (CDAT): Scientific reasoning and dialog patterns in the secondary science classes. Int. J. STEM Educ. 2018, 5, 5. [Google Scholar] [CrossRef]
  99. Tofel-Grehl, C.; Callahan, C.M.; Nadelson, L.S. Comparative analyses of discourse in specialized STEM school classes. J. Educ. Res. 2017, 110, 294–307. [Google Scholar] [CrossRef] [Green Version]
  100. Volkwyn, T.S.; Airey, J.; Gregorcic, B.; Heijkenskjöld, F. Transduction and science learning: Multimodality in the physics laboratory. Des. Learn. 2019, 11, 16–29. [Google Scholar] [CrossRef]
  101. Paulus, T.; Lester, J. Using ATLAS.ti for a discourse analysis study of blogging in an educational context. In Proceedings of the ATLAS.ti User Conference 2013: Fostering Dialog on Qualitative Methods, ATLAS.ti User Conference, Berlin, Germany, 12–14 September 2013. [Google Scholar]
Figure 1. Flowchart showing participant positioning in the full group, with Benjamin in front, then Isaac, then Erica, and Olivia and Brittany in the back. Solid arrows indicate who talks with each other (IBE, and separately OB), dashed arrows indicate people talking at other people (IBE at OB), and dotted arrows show computer usage (B and E).
Education 12 00084 g001
Figure 2. Photo of full group of participants. From left, back row: Olivia and Brittany sitting farther from the computer and looking at it and the participants closer to the computer; front row: Erica sitting at the desk, holding the mouse, and looking at the computer along with Benjamin; Isaac sitting at the desk, typing on the keyboard with one hand, and looking at the computer; Benjamin sitting at the desk, gesturing with one hand, and looking at the computer and other participants.
Education 12 00084 g002
Figure 3. Flowchart of computer usage in the full group, with Benjamin in the front, then Isaac and Erica, and Olivia and Brittany in the back. Arrows from a computer to a person indicate that the person is receiving information from the computer (looking at the screen). Arrows from a person to a computer indicates the person is interacting with the computer. Benjamin did not directly interact with the computer but instructed Isaac and Erica on how they should do so.
Education 12 00084 g003
Figure 4. Photo of female participants while males went to the bathroom. From left, back row: Olivia and Brittany sitting farther from the computer; front row: Erica sitting at the desk. No one is touching the computer. Olivia looks down at her paper. Brittany is talking animatedly, leaning forward towards Erica, and gesturing with one hand. Erica leans back away from the desk to listen to Brittany.
Education 12 00084 g004
Figure 5. Flowchart showing positioning and computer usage between the three female participants when the males left the group. None of the females touched the computer, but Brittany often looked at the computer and referred to items on the computer screen. All three females discussed as peers.
Education 12 00084 g005
Table 1. Participants’ genders, level of education, and STEM teacher experience.
Name (Pseudonym)Sex/GenderEducationSTEM Teacher Experience
BenjaminMale3 Bachelor’s degrees10 years science, plus public outreach at NASA
IsaacMaleBachelor’s degree + 40 graduate credits21 years math
EricaFemaleBachelor’s degree + graduate creditsElementary and middle school math
OliviaFemaleBachelor’s degreeElementary school 1 year
BrittanyFemaleBachelor’s degree1 year STEM
Table 2. Alphabetical list of codes.
Codes and Subcodes
  • Affect and motivation
    • Profanity
    • Self-deprecation
2.
Astronomy misconceptions
3.
Authentic STEM as best practice
4.
Awareness of being recorded
5.
Equity and gender
  • Ability and gender
  • Gender roles
  • Sexual innuendos
6.
Integrated STEM
7.
Keeping group on task
8.
Nature of science
  • Date = imperfect description of reality
  • Objective reality exists
  • Science = describing reality
9.
Partnerships (mentoring, collaboration)
  • Constructed knowledge
  • Mentee motivating mentor
  • Mentor guiding
  • Socially constructed knowledge
10.
Sensemaking
  • Teachers thinking of students
  • Technical skills
11.
STEM and technology
  • Dataset skills
Table 3. Examples of integrated STEM discourse. Text font is used to indicate which parts of the quote are associated with which aspects of STEM, with an underline indicating science, italics for technology, bold engineering, and strikethrough math, as shown in the right column. Olivia did not exhibit any integrated STEM discourse.
QuoteIntegrated STEM Elements
Benjamin: It’s all laid off the North Star. Okay. So, some kid might ask you—and if you notice, it’s got these units of degrees, of 11 h, 12 h. So the hours are really like longitude lines and the degrees of declination are like latitude lines.
  • Science: North Star and degrees of declination (astronomy)
  • Technology: entire quote is regarding the planetarium program Stellarium
  • Engineering: (none)
  • Math: units, degrees, time
  • Other: latitude and longitude (geography)
Isaac: They just ordered this table according to right ascension. They could have done it according to declination. And if they would have—well, we did sort it by declination—oops. If we order it by declination, luckily the right ascension is attached to it and it automatically adjusts. Now you can see the right ascension is all gobbledegook order.
  • Science: right ascension and declination (astronomy)
  • Technology: (none)
  • Engineering: (none)
  • Math: sorting (tables)
  • Other: (none)
Erica: So if I was doing this in class with younger kids in science, I’d want them to be using terms like columns and the rows and say the words and actually [be] writing down the RA and declination. Especially if I was going to put this as a writing assignment. Want to be sure I had a list of all the vocabulary I’d want them to use or or even a science writing paragraph. I would also have had those vocabulary words.
  • Science: RA and declination (astronomy), explicitly mentions science
  • Technology: (none)
  • Engineering: (none)
  • Math: columns and rows (tables)
  • Other: science vocabulary words and writing assignments (language arts)
Brittany: We talked about was like mapping the data out since you would have the coordinates with the RA and the dec. Then just label each point with its redshift value since the original object… seeing that number. Then maybe color coding, it has radio magnitude or it doesn’t, just using different colors. Then they can map them out and see where they’re falling on the map. So they have that visual.
  • Science: RA, declination, redshift, radio magnitude (astronomy)
  • Technology: (none)
  • Engineering: (none)
  • Math: maps as a type of graph, using color coding for visualization
  • Other: mapping (geography)
Publisher’s Note: MDPI stays neutral with regard to jurisdictional claims in published maps and institutional affiliations.

