1. Introduction
Bitcoin is the first and the most important cryptocurrency. It is a ledger application based on blockchain, cryptography and peer-to-peer technology. In the field of financial technology, many mathematical models are developed to forecast Bitcoin’s future price. These models can provide investment advice for quantitative investors.
Similar to other assets, such as stocks [
1,
2] and commodities, Bitcoin price forecasts are a series of continuous predictions because Bitcoin prices also change over time. One major difference between Bitcoin and a stock is that stocks trade only at certain times on weekdays, but the Bitcoin market typically operates around the clock, and investors can buy or sell Bitcoin all day, which may result in Bitcoin price fluctuations at unpredictable times. We can learn the stock price prediction method and use it to predict the price of Bitcoin. To address the time series problem of Bitcoin prices, two types of models have mainly been used in previous works: traditional time series models, such as autoregressive comprehensive moving average (ARIMA) [
3] and generalized autoregressive conditional heterovariance (GARCH) [
4]. Another is machine learning models, such as random forest (RF), and deep learning networks, such as recurrent neural networks (RNN), long short-term memory (LSTM), and gated recurrent units (GRU) [
5].
According to a study by the American Institute of Economic Research (AIER), globally influential news and sentiment can drive large fluctuations in the price of Bitcoin [
6]. Some research uses sentiment analysis based on Twitter data to predict the price of Bitcoin [
5,
7]. It is effective to explore people’s reactions to Bitcoin from tweets since Twitter is an incredibly rich source of information about how people are feeling about a given topic. Previous research methods of sentiment analysis based on Bitcoin-related comments can be divided into two types: dictionary-based methods, such as valence aware dictionary and sentiment reasoner (VADER) [
8], and machine learning-based methods, such as RF [
7], hard voting classifiers [
5], deep learning-based classifiers [
9], and other specific analyzers [
10].
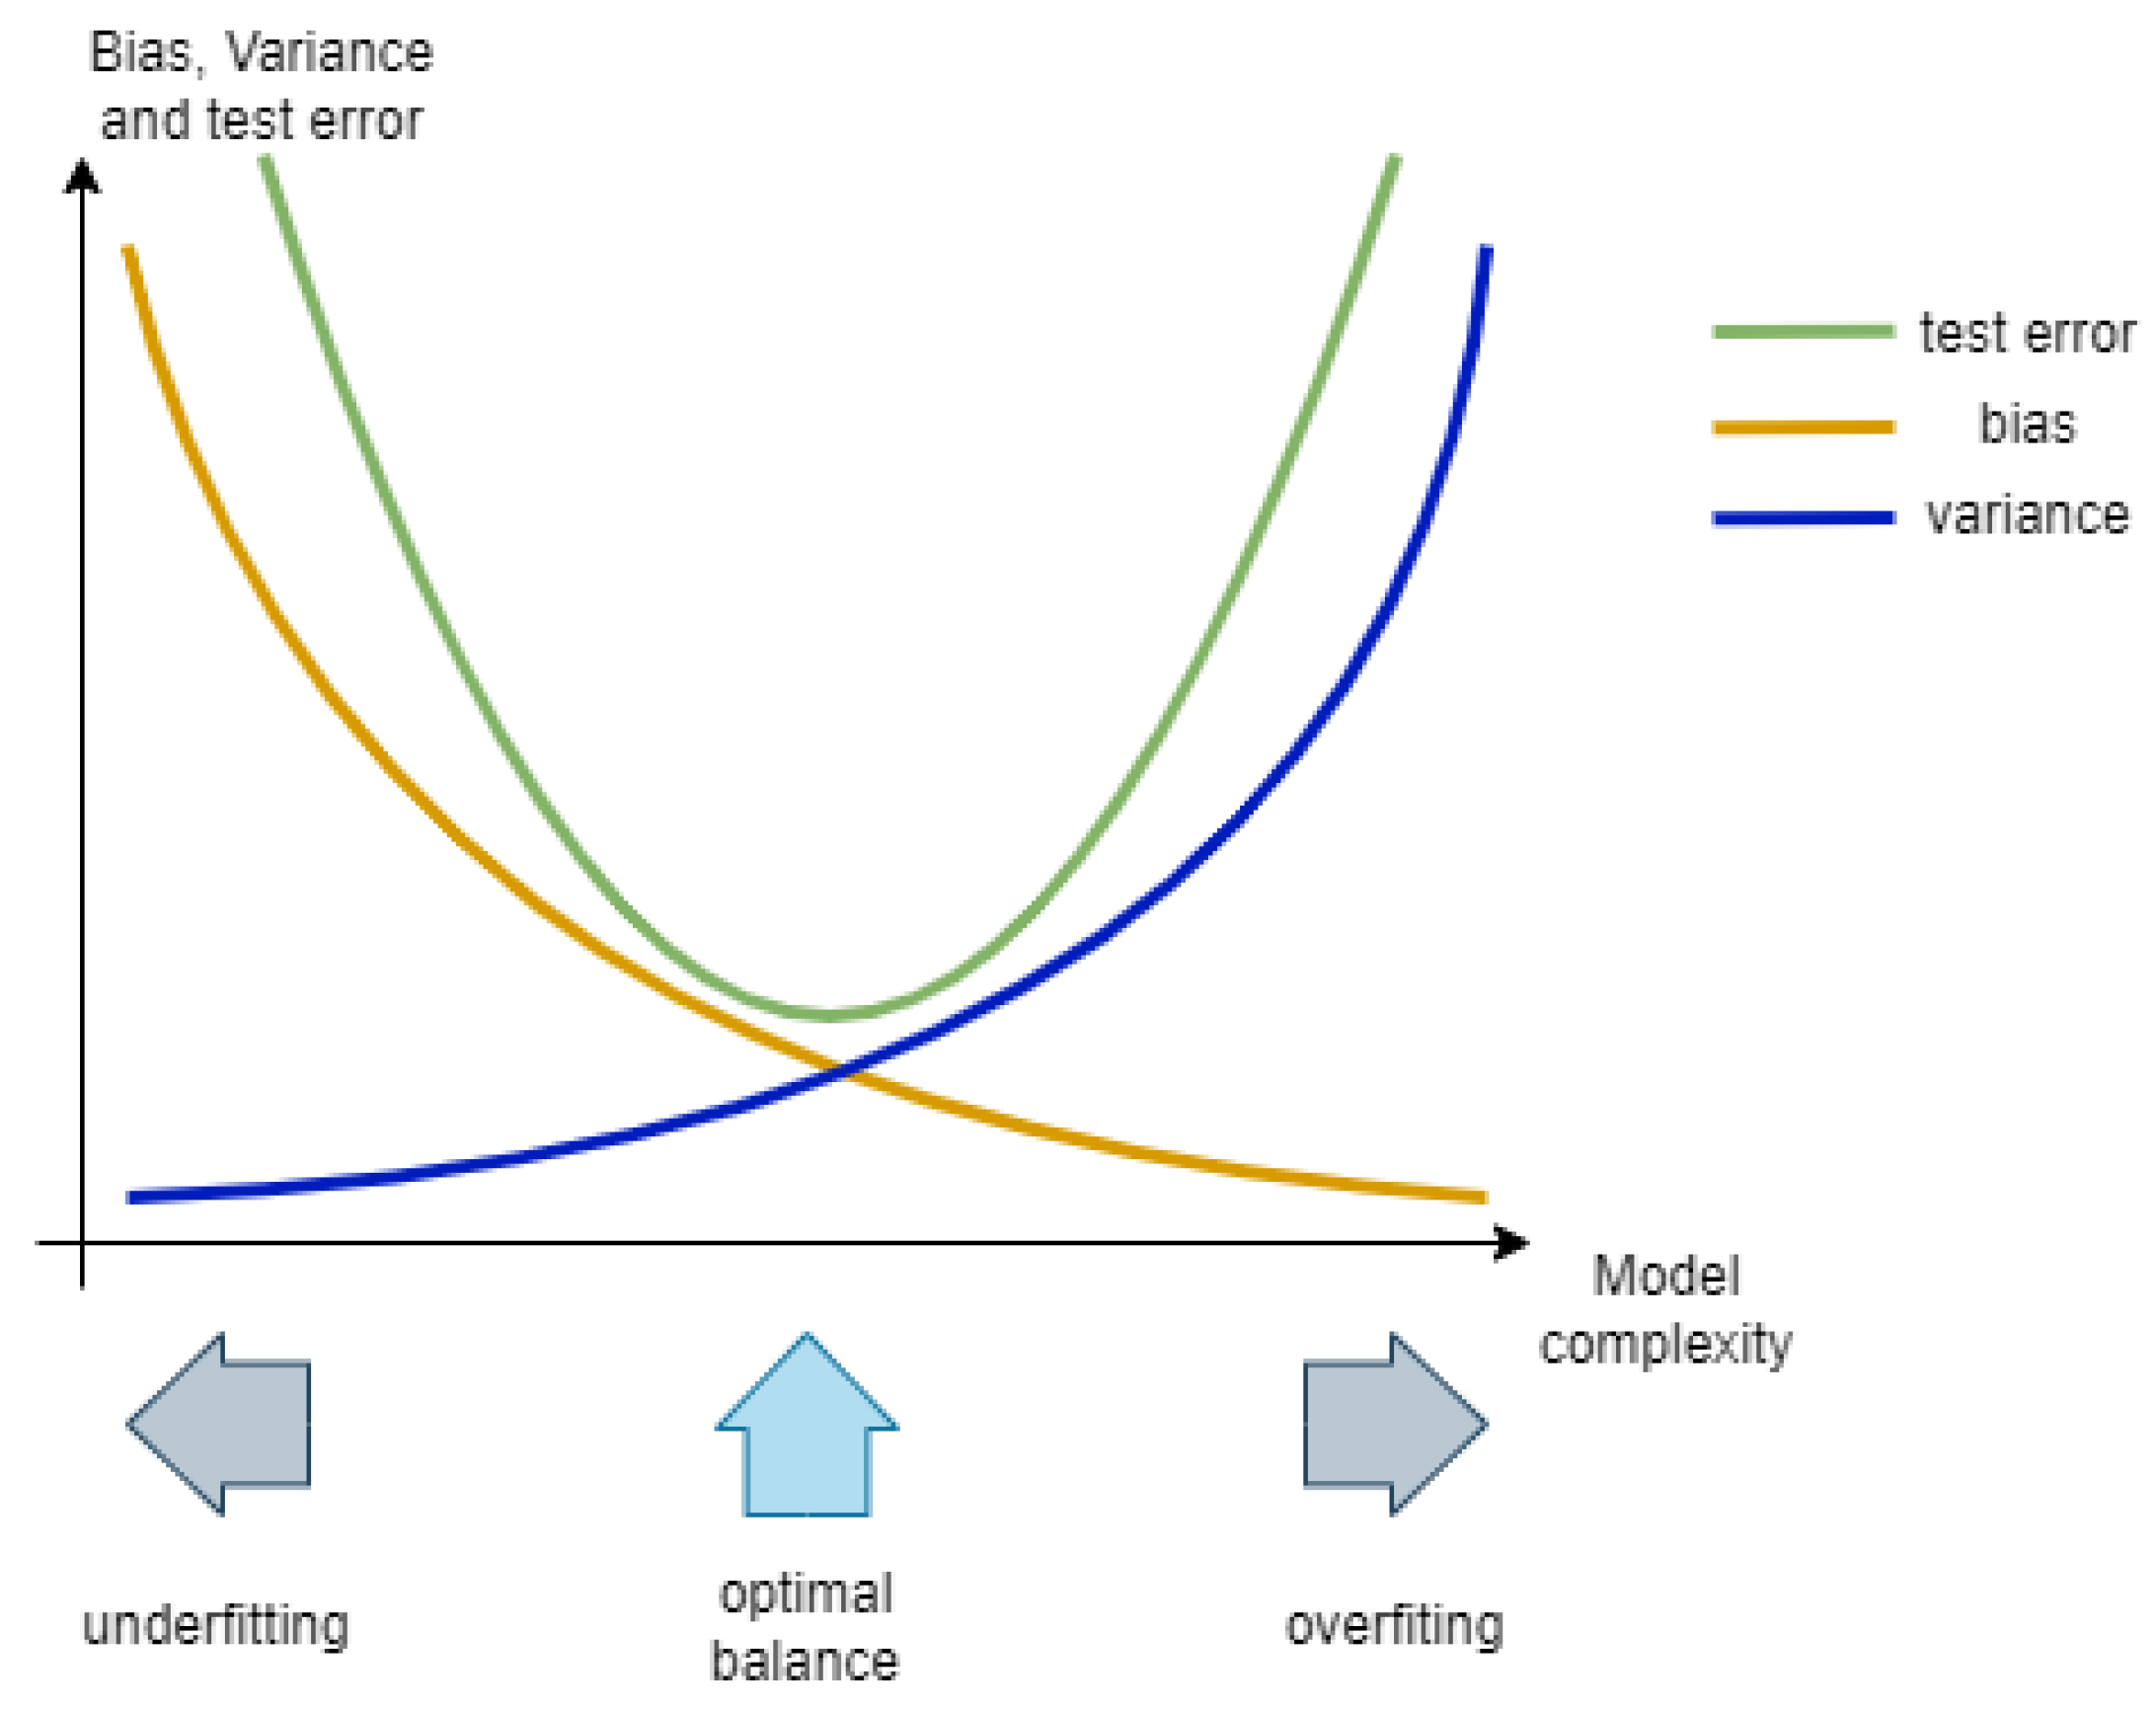
However, the current research still has some limitations: Firstly, in most previous works, only historical data are used as the input data of the prediction model, which ignores that prices are also affected by unexpected factors in price data. Secondly, sentiment analysis simply categorizes every tweet or comment as positive, neutral or negative and then creates a simple statistic, which loses much emotional detail and is not conducive to learning how different levels of sentiment affect prices. Thirdly, a single model such as ARIMA, LSTM, or GRU, is employed by most previous methods. To solve the existing limitations, this paper proposed following aspects: Firstly, considering the financial nature of Bitcoin, we added the most commonly used technical indicators in traditional finance as predicting input. Secondly, instead of using a simple statistical method to categorize the mood trend of tweets, we used a linguistic method to process tweets about Bitcoin, which proved it brought a higher accuracy. Thirdly, to improve the prediction results, a stacking ensemble Deep Learning, combining LSTM and GRU, was trained to forecast the price of the next time interval. The major steps are as follows. We proposed to use linguistic sentiment analysis to categorize tweets and a stacking ensemble deep learning model to forecast the price of the next time interval based on sentiment trend of tweets and technical indicators. It combines multiple models to add a bias to the final prediction result, which will be offset by the variance of the neural network, making the prediction of the model less sensitive to the details of training data.
The rest of this paper is organized as follows:
Section 2 shows the previous related work;
Section 3 shows the whole methodology of this paper, including the data acquisition step, data preprocessing step and stacking ensemble prediction model;
Section 4 lists all the experimental results and compares our method with common methods;
Section 5 draws the conclusion of this paper.
2. Related Work
Many previous studies can mainly be divided into three main models and three main data categories. The three models include: (1) statistical methods; (2) machine learning; (3) ensemble learning. The three main data types are as follows: (1) price data, including opening, highest, lowest, closing, trading volume, number of trades, quote asst volume and other data; (2) technical indicators based on price data and indicators derived from market technical statistics, such as moving average convergence divergence (MACD) and relative strength index on balance volume (RSI OBV) statistics; (3) sentiment indicators refer to the indicators calculated after natural language processing of text data from social media during a certain time period; (4) other related data, such as blcokchain hashrate, number of online nodes, active address, Google trends and other financial indexes.
Early research into the price prediction of bitcoin were mostly based on the statistical method. P. Katsiampa et al. [
11] used price data, and certain types of GARCH models have been used to calculate the daily closing prices between 18 July 2010 and 1 October 2016. As a result of the paper, AR-CGARCH is the best model. S. Roy et al. [
4] used price data and performed ARIMA, autoregressive (AR), and moving average (MA) models on the time series dataset. The results of this paper used the ARIMA model to predict the price of Bitcoin with an accuracy rate of 90.31%. Therefore, it can be said that the best results are obtained using ARIMA. Ayaz et al. [
12] used price data and only used the ARIMA algorithm to predict the price of Bitcoin. To find the lowest mean square error (MSE), the researchers used different fitting functions in the ARIMA algorithm and found that the lowest MSE = 170,962.195. Because it avoids the use of scaling functions, this result is different from those of other studies. In a recent paper [
13], it proposed a general method of user behavior analysis and knowledge pattern extraction based on social network analysis. This method extracts relevant information from the blockchain transaction data in a specified period, carries out statistics and builds an ego network, and extracts important information such as active transaction addresses and different user groups. Using Ethereum blockchain data from 2017–2018, the method was proved to be able to identify bubble speculators. In 2021, R. K. Jana et al. [
14] proposed a regression framework based on differential evolution to predict bitcoin. They first decomposed the original sequence into granular linear and nonlinear components using maximum overlapping discrete wavelet transform, and then fitted polynomial regression with interaction (PRI) and support vector regression (SVR) on both linear and nonlinear components to obtain the component-wise projections.Apart from the previously introduced statistical methods, Jong-Min Kim et al. [
15] proposed to use linear and nonlinear error correction models to predict bitcoin log returns, and compared with neural network, ARIMA and other methods. The experiment was verified with the price data from 1 January 2019 to 27 August 2021. The results showed that the error correction model was the best in all evaluation indexes, and MAE was as low as 1.84, while other comparison models were all above 3.2. They also ran a Granger causality test on 14 cryptocurrencies.
Over the past few decades, major advances in machine learning have allowed more accurate methods to spread across the field of quantitative finance. A Bayesian neural network model that uses blockchain information to predict the price of Bitcoin was proposed by Jang et al. in 2017 [
16]. Specifically, they use price data, blockchain data, economic indices, currency exchange rates and more. Four methods were trained for price prediction using price data, including logistic regression, support vector machine, RNN and ARIMA models in [
17]. As far as the prediction accuracy of these four methods is concerned, ARIMA only has a 53% return on the next day’s price prediction, and the long-term performance is poor, such as using the price prediction of the last few days to predict the price of the next 5–7 days. The RNN consistently obtains an approximate accuracy of 50% for up to 6 days. It does not violate the assumptions of the logistic regression-based model; it can accurately classify only when there is a separable hyperplane with 47% accuracy. The support vector machine has an accuracy rate of 48%. Shen et al. [
18] used price data for training the GARCH, simple moving average (SMA) and RNN (GRU) models. The GRU model performs better than the SMA model with the lowest root MSE (RMSE) and mean absolute error (MAE) ratios. Some researchers used price data, technical indicators and a complex neural network called CNN-LSTM [
19]. Compared with a single CNN and a single LSTM model, the results are slightly improved, with the MAE reaching 209.89 and the RMSE reaching 258.31. The stochastic neural network model has also been used to predict the price of cryptocurrency [
20]. The model introduces layer-wise randomness into the observed neural network feature activation to simulate market fluctuations. It used market transaction data, blockchain data, and Twitter and Google Trends data. A latest research on cryptocurrencies by Wołk [
21] used Google Trends and Twitter to predict the price of cryptocurrencies by distinctive multimodal scheme. However, they used textual data mechanically, unlike our article, which considers linguistic approaches to textual data. In 2021, Jagannath et al. [
22] proposed a Bitcoin price prediction method using data features of users, miners, and exchanges. They also propose jSO adaptive deep neural network optimization algorithm to speed up the training process. The model uses Bitcoin data from 2016 to 2020 for training and testing. The MAE value of LSTM is 2.90, while the MAE value of this method is 1.89, thus effectively reducing the MAE value. A novel price prediction model WT-CATCN was proposed in 2021 by Haizhou Guo et al. [
23]. It utilizes Wavelet Transform (WT) and Casual Multi-Head Attention (CA) Temporal Convolutional Network (TCN) to predict cryptocurrency prices. The data input of the model is divided into three categories: blockchain transaction information, exchange information, and Google Trends. Considering how widespread cryptocurrency information has become, Loginova proposed a bitcoin price direction prediction method in 2021 that combined the sentiment analysis model JST and TS-LDA [
24]. They used market trading data as well as text data from Reddit, CryptoCompare and Bitcointalk. The model was verified by using the data from 20 February 2017 to 6 April 2019. The accuracy of the model using JST and TS-LDA was 57%, which was improved compared with the same model that was not used. For Dogecoin, which has a huge market cap, Sashank Sridhar et al. proposed a multi-head attention-based encoder–decoder model for a transformer model to predict its price [
25]. It is verified using real DOGE hourly transaction data from 5 July 2019 to 28 April 2021, with an R-squared value of 0.8616 for the model. A more complex hybrid framework, DL-GuesS, was proposed by Raj Parekh et al. for cryptocurrency price prediction [
26]. This framework takes into account its interdependence with other cryptocurrencies and market sentiment. The model uses transaction data from different cryptocurrencies as input, along with Twitter text. The model was validated using Bitcoin Cash data from March 2021 to April 2021, and the model MSE value was as low as 0.0011.
Ensemble learning is also a popular method for forecasting. Using this approach, researchers have been able to improve the accuracy and stability of predictions. Ahmed Ibrahim [
27] used price and sentiment data to predict Bitcoin prices by constructing an XGBoost-Composite integrated model. A paper using price data to compare different ensemble models, including averaging, bagging, and stacking was written in 2020 [
28]. Among them, stacking has the best performance, but the blending ensemble was not used in the paper. Other researchers used price data and integrated LSTM models after training for different lengths of time (days, hours, and minutes) to obtain an integrated model that was superior to each individual model [
29].
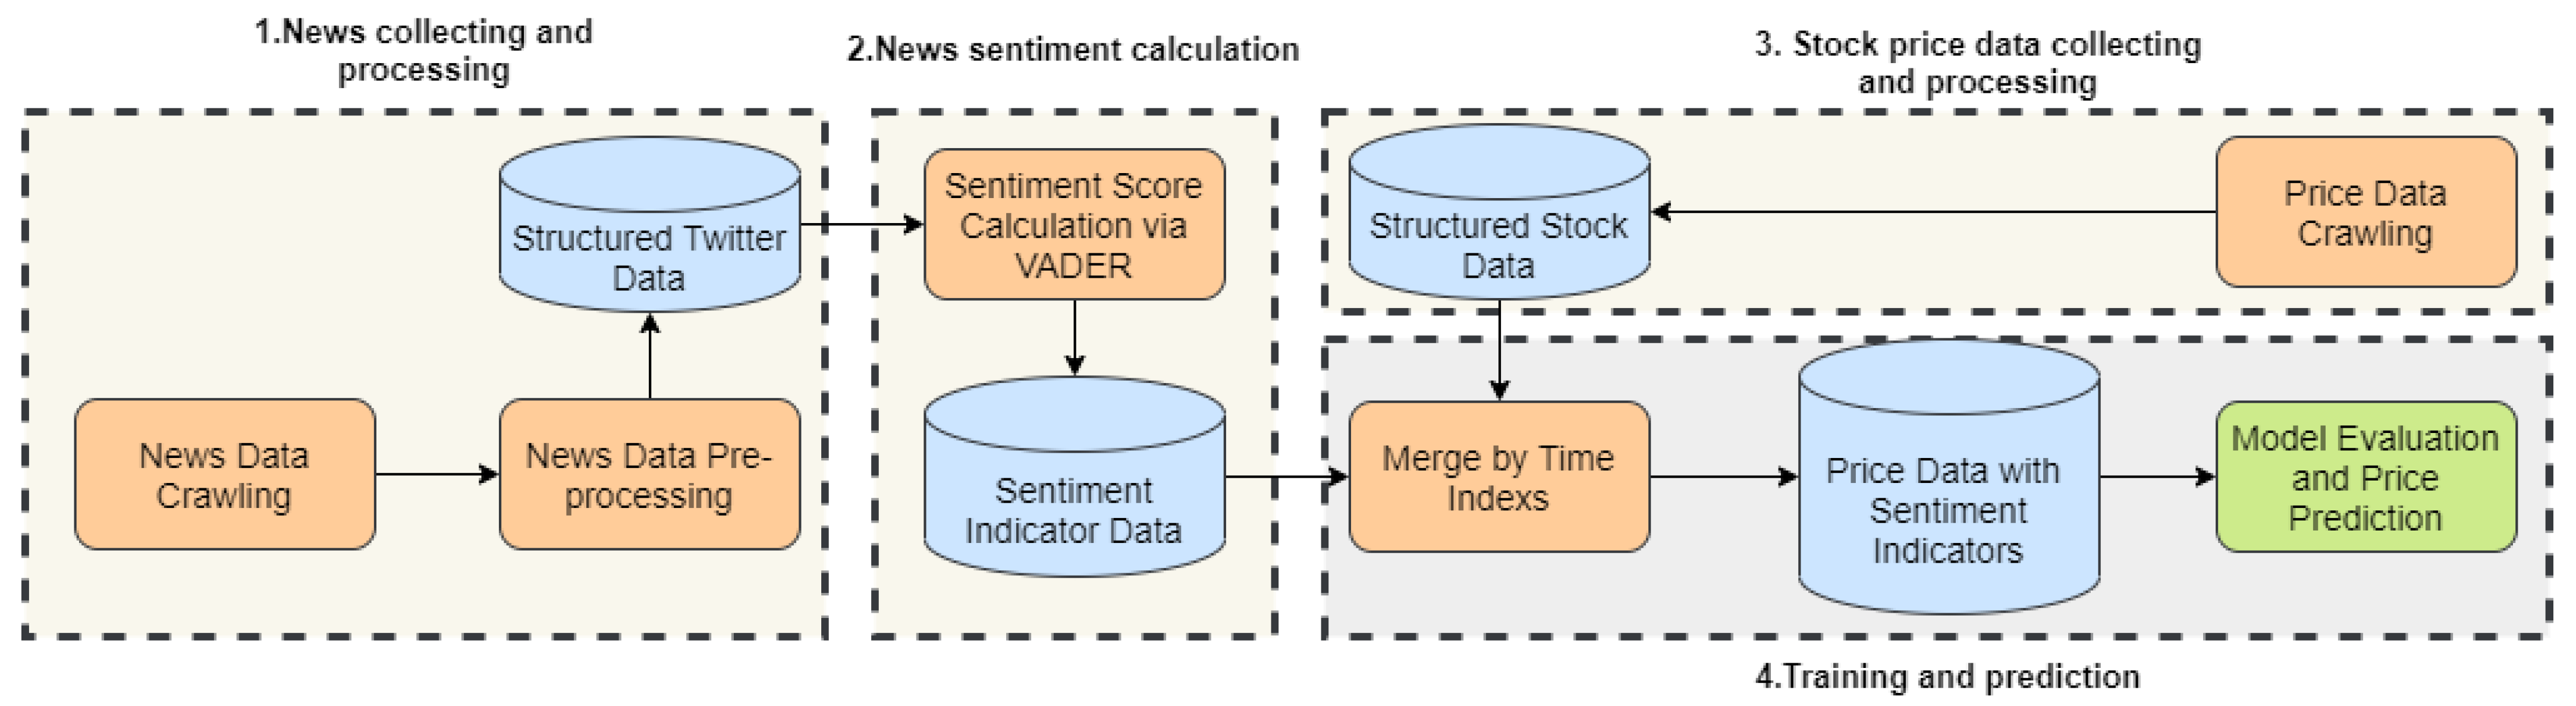
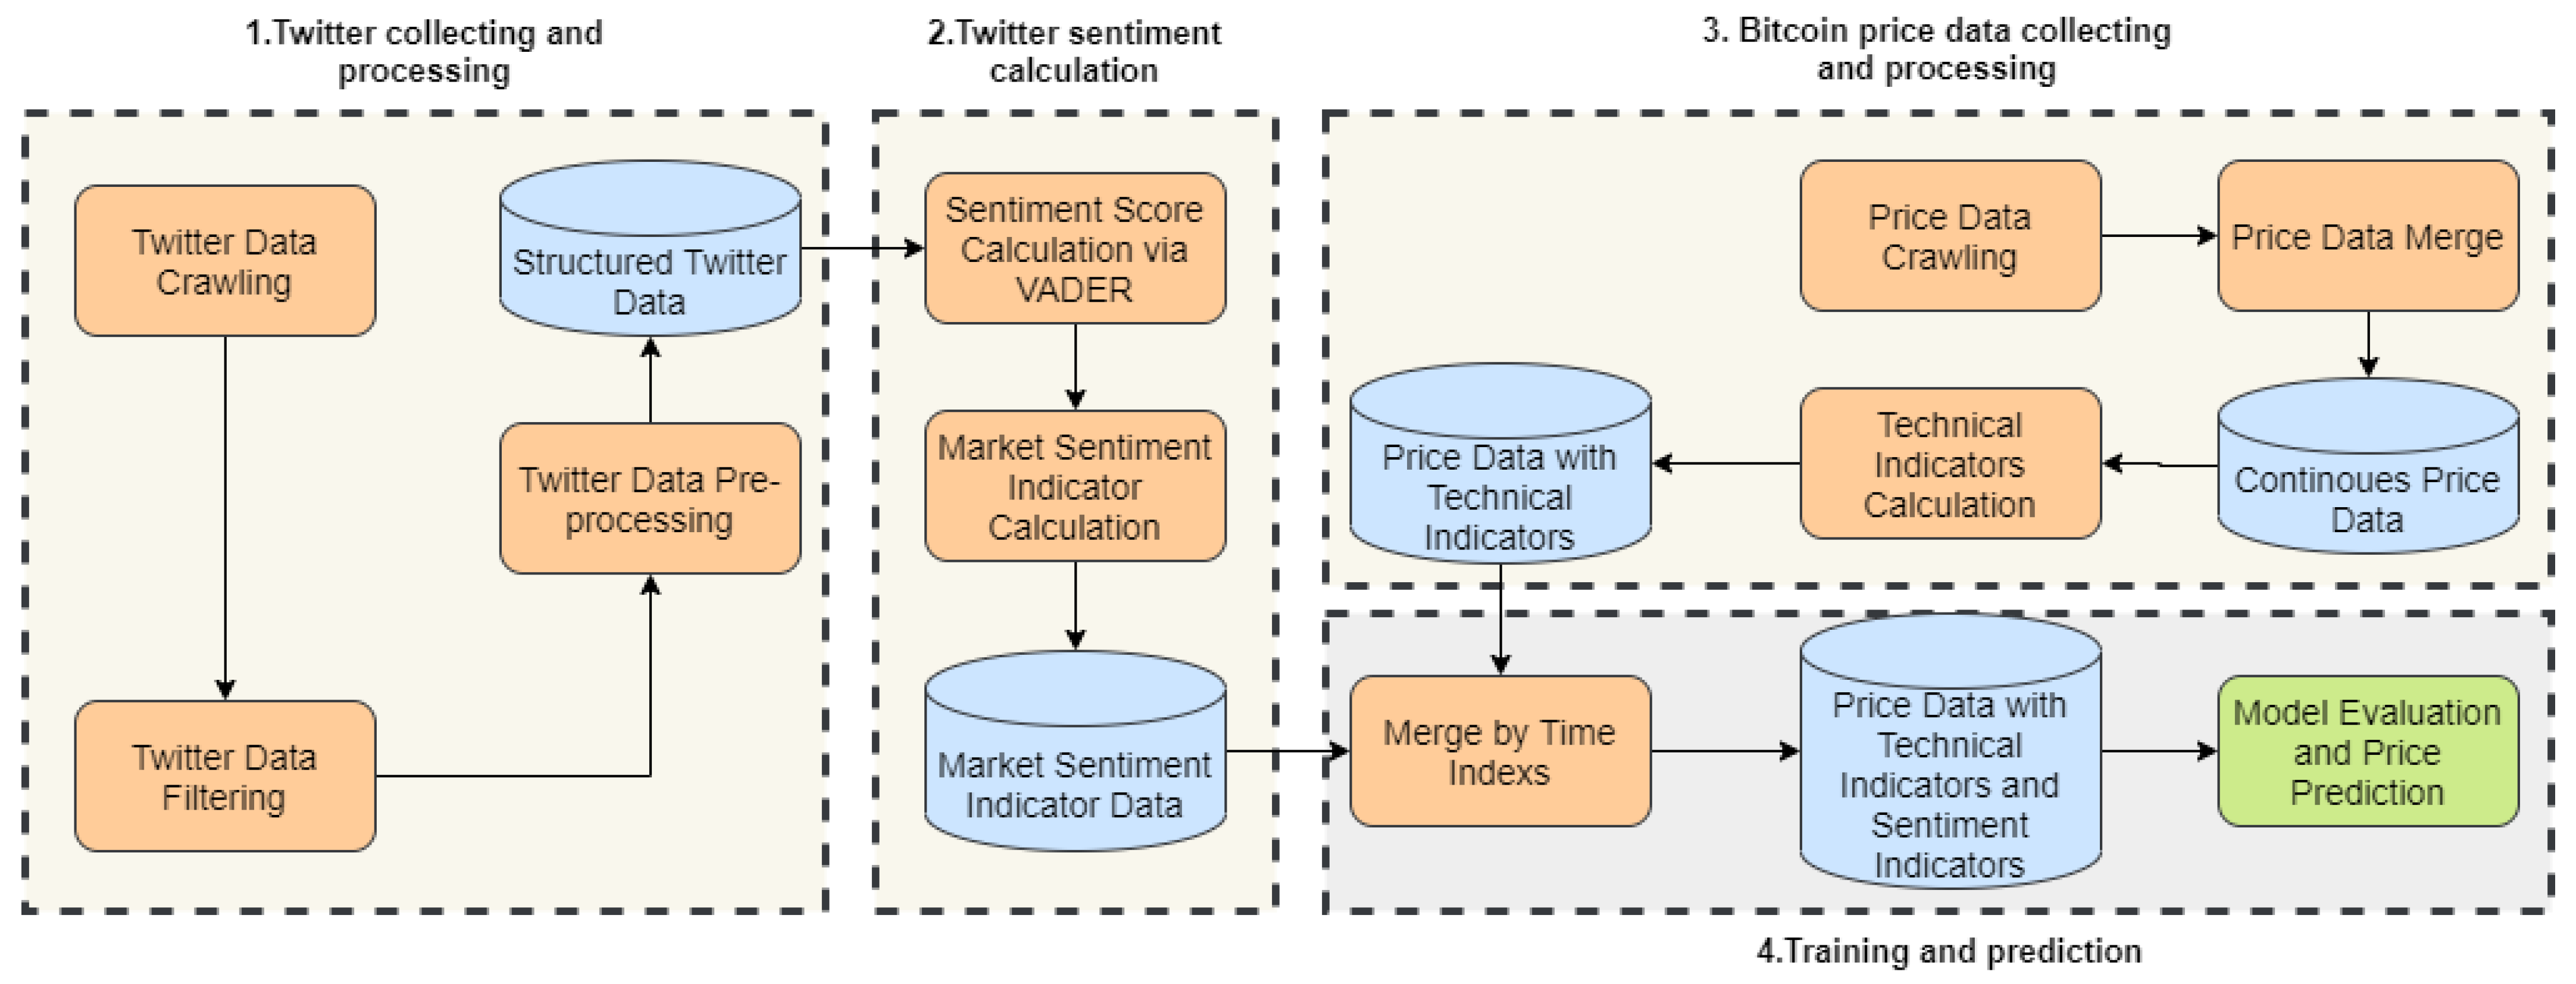
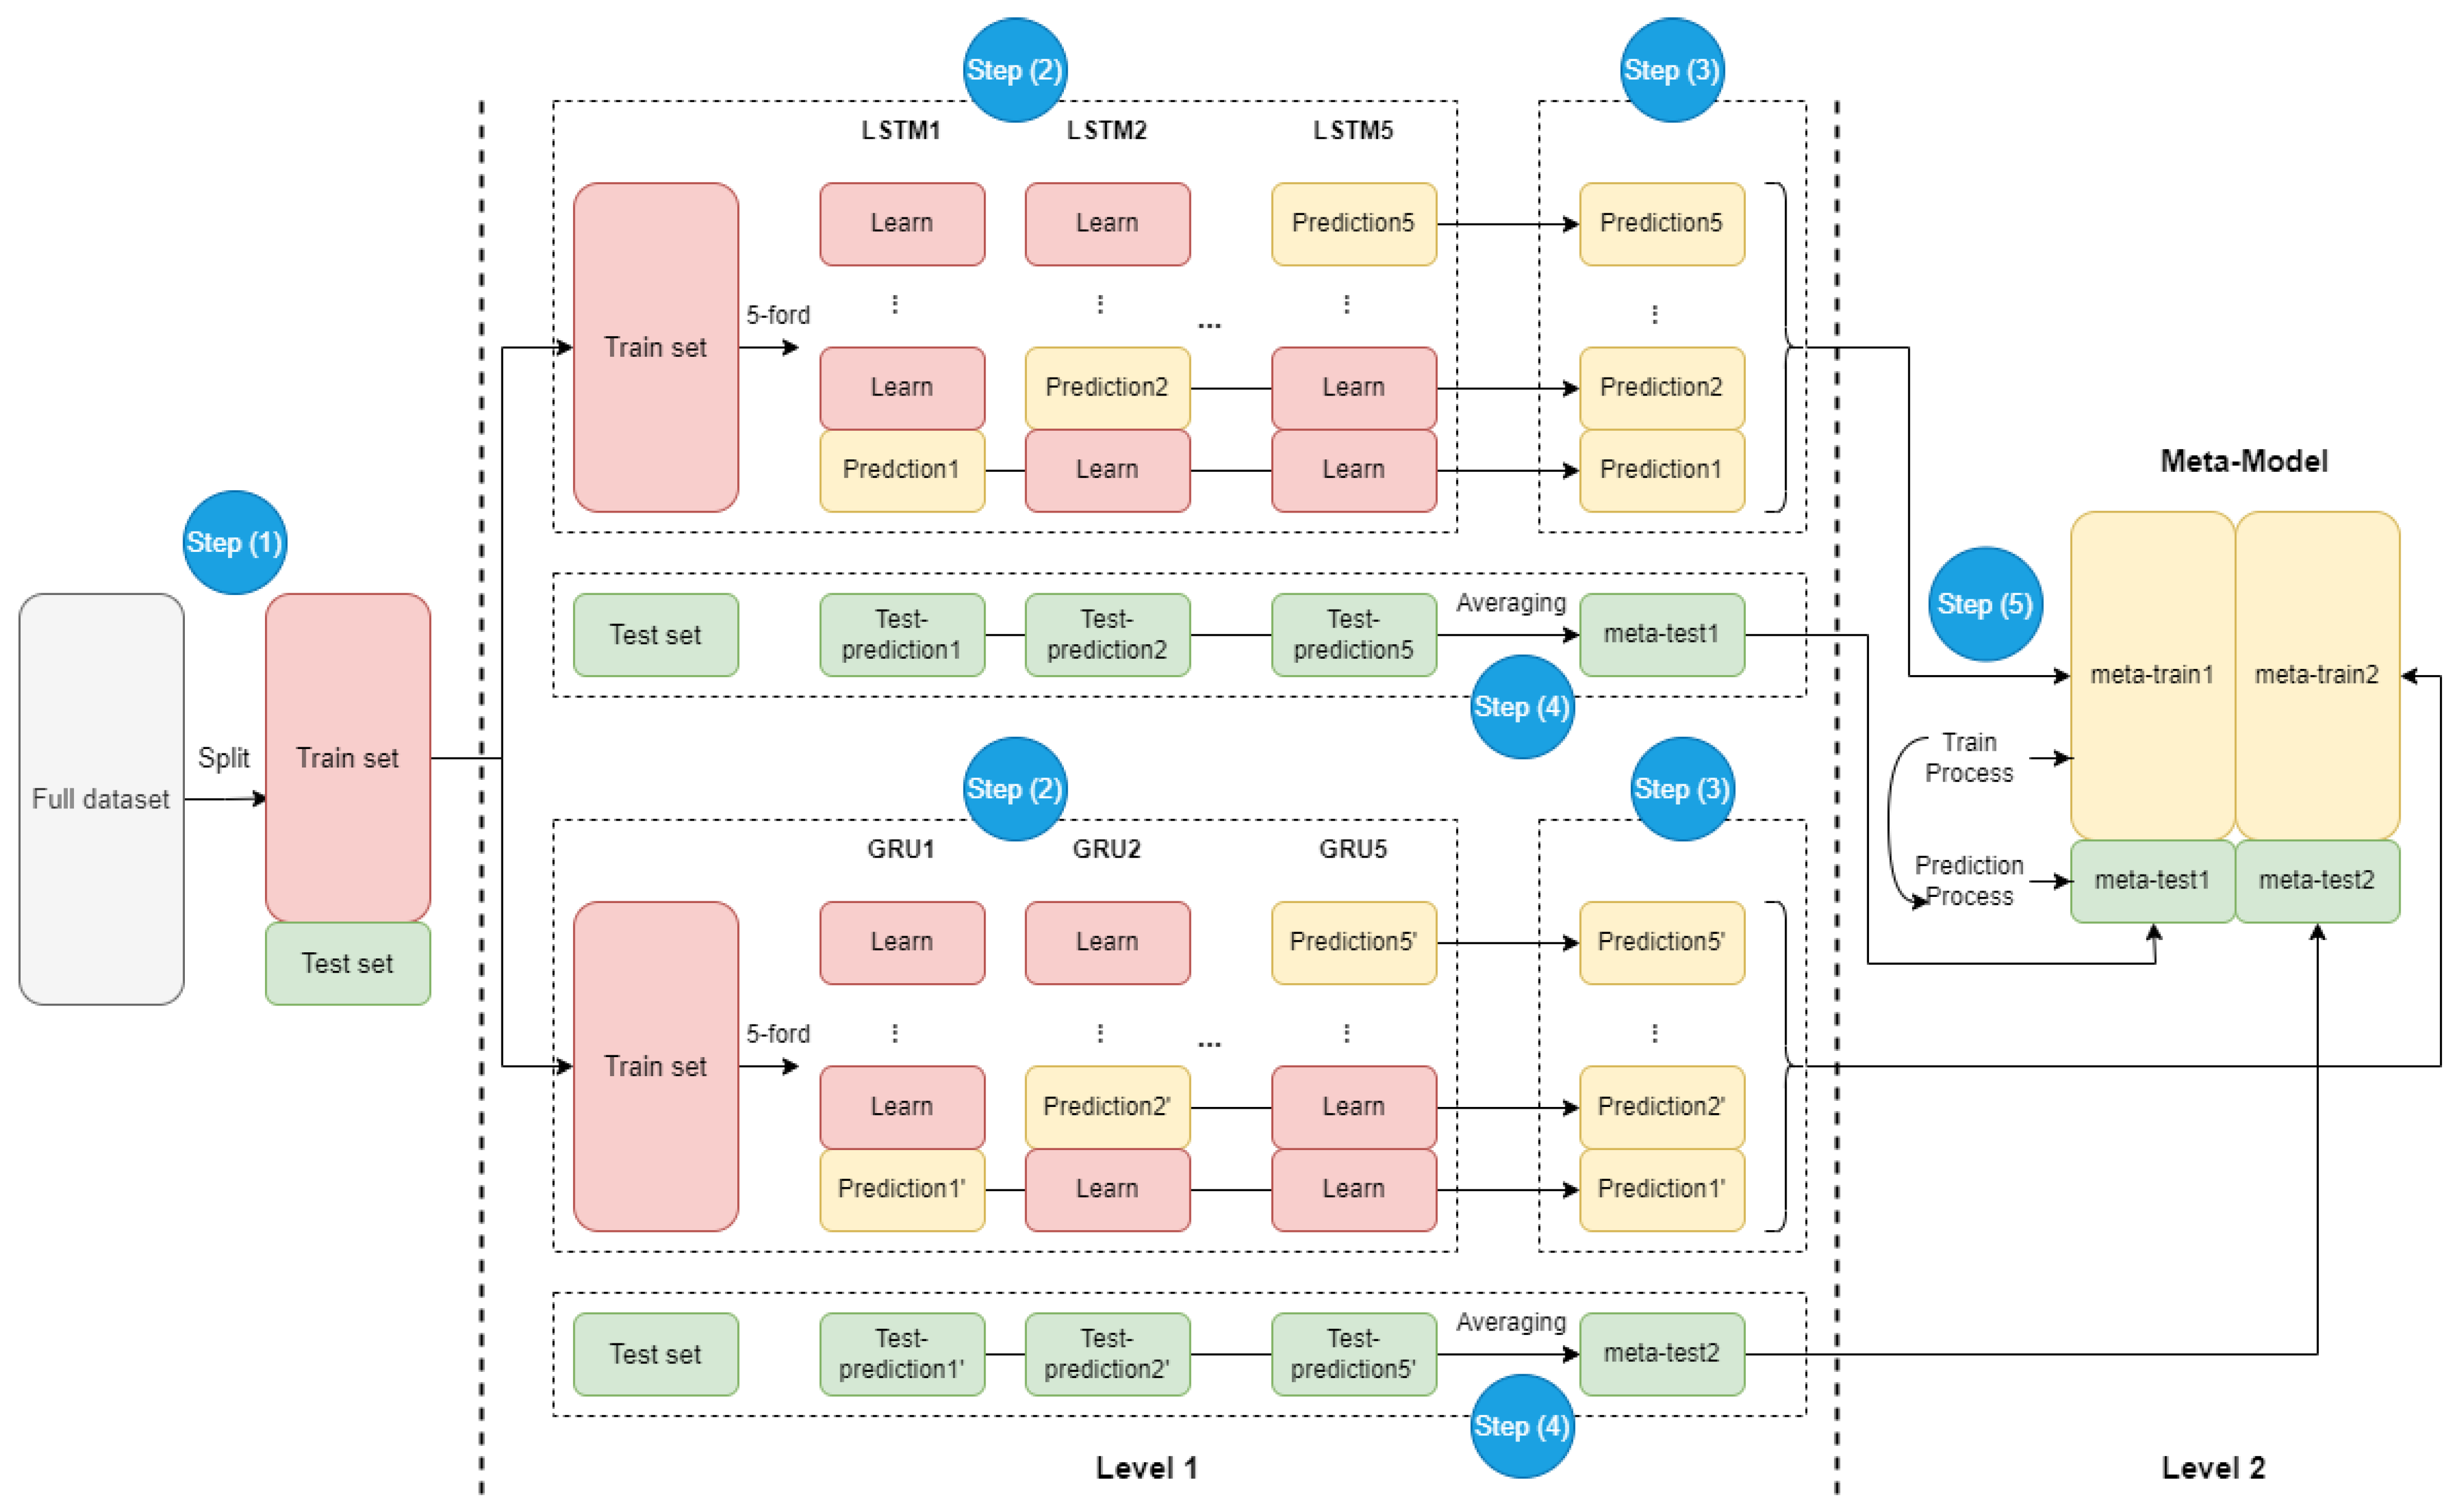
Mainly inspired by Li and Pan [
1], whose workflow is shown in
Figure 1, this paper designs a series of methods to avoid these current limitations: (1) more data sources are used as input; (2) linguistic methods are used for sentiment analysis to replace the simple statistical methods used in most papers; (3) one kind of ensemble model is used for training and prediction.
However, due to different data sources, the methods proposed in this paper are somewhat different from those proposed in Li [
1]. The differences of specific data sources are as follows:
There is less news about digital currency than stocks, which means there are not many reports about digital currency in the news, which is not enough to support our real-time prediction, so we chose social media.
Digital currencies are traded 24 h a day and comments on Twitter are live 24 h a day, so real-time comments on Twitter can be very effective for price forecasting.
Li’s work uses two data sources, price and news, to predict price. Considering the financial properties of digital currency, we use price, comments on Twitter and technical indicators to predict price.
Data preprocessing methods are also different: The text data used in Li [
1], namely news data, does not need to be cleaned and can be scored directly by VADER. Moreover, the Twitter data we obtain from crawlers is very dirty, such as pictures, links, etc., which need to be cleaned.
4. Result Evaluation
In this section, the proposed method is used to forecast the Bitcoin closing price. We implement the proposed method using the TensorFlow deep learning framework on TITAN RTXs through the Python programming language. Many trials of simulation experiments are conducted to determine the parameters of the model.
The comparative experiments in this paper are divided into two categories: the first is to compare the performance of different models; the other is to compare the performance of different categories of data combinations in the forecast.
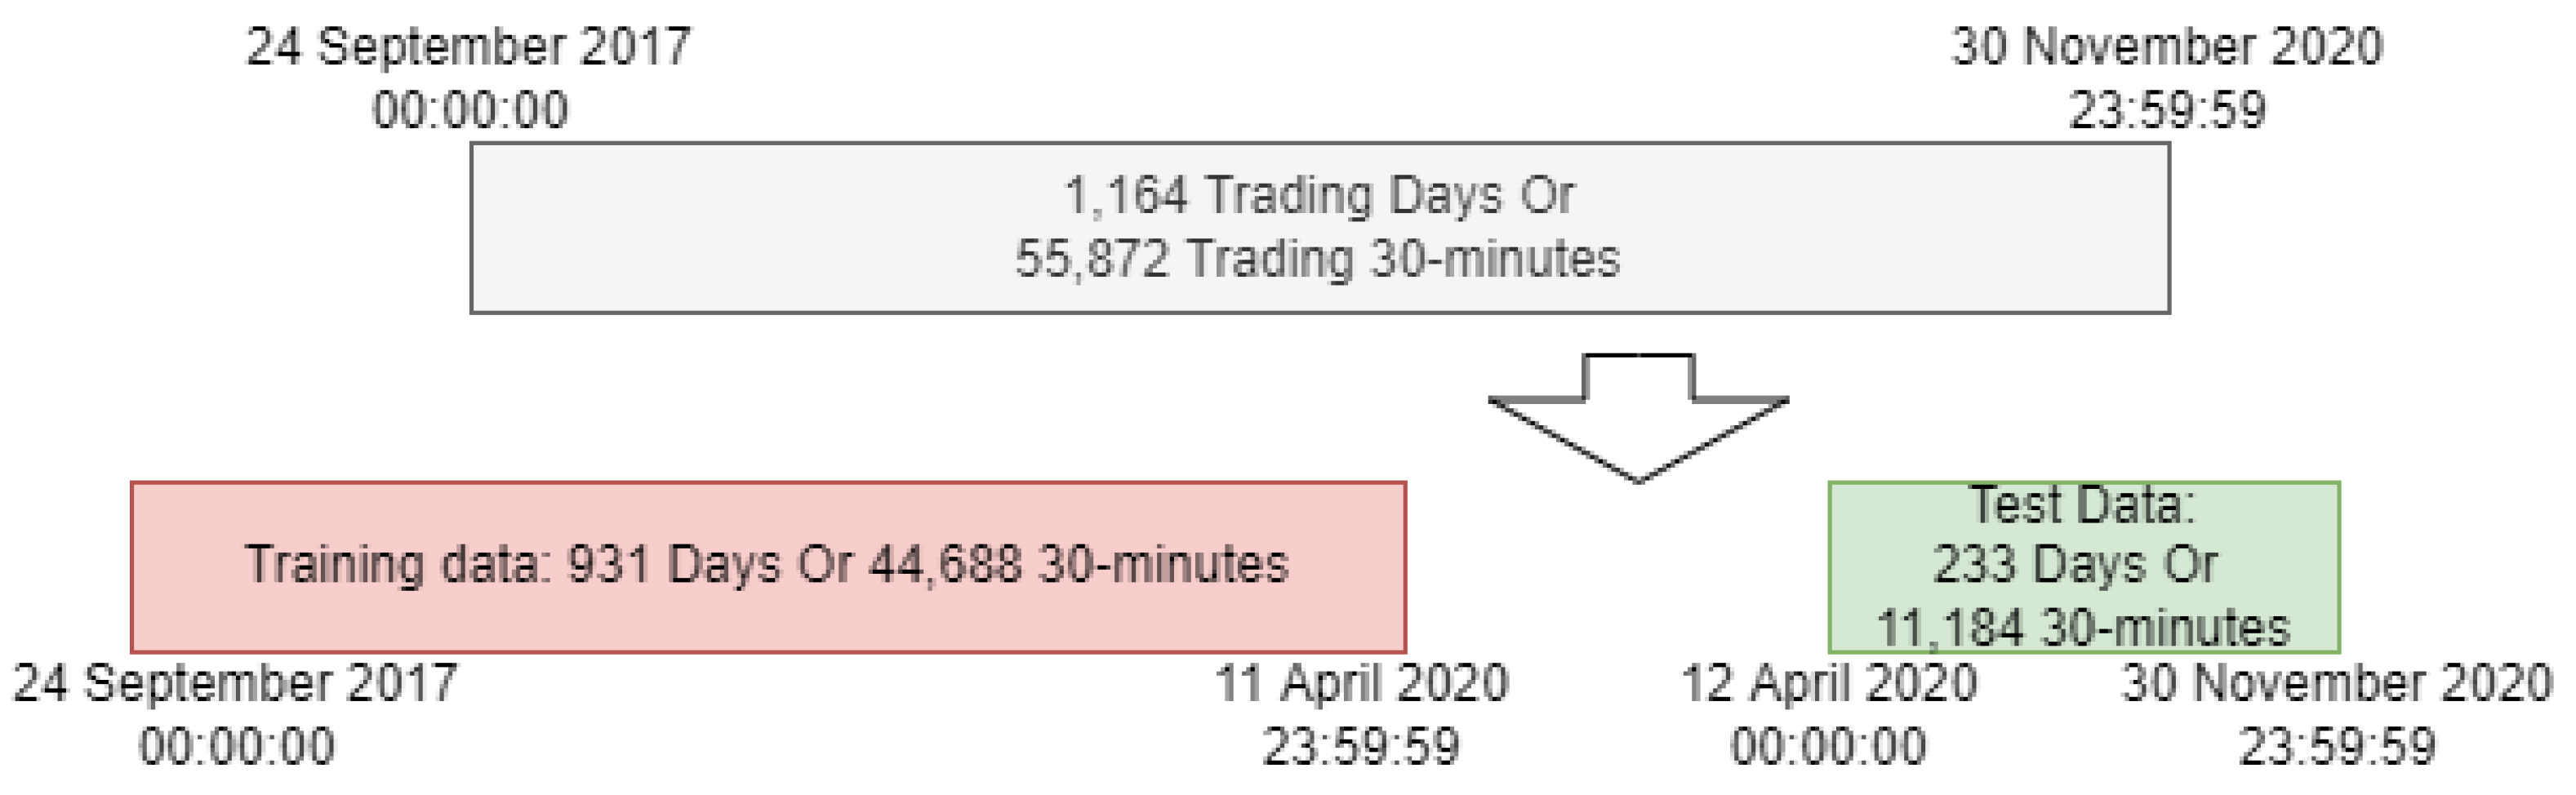
As shown in
Figure 7, the whole data is divided into two parts: training data, and testing data. The training data is from 24 September 2017 to 11 April 2020, which is used to train the weak learners in level 1; the testing data is from 12 April 2020 to 30 November 2020, which is used to make the final prediction.
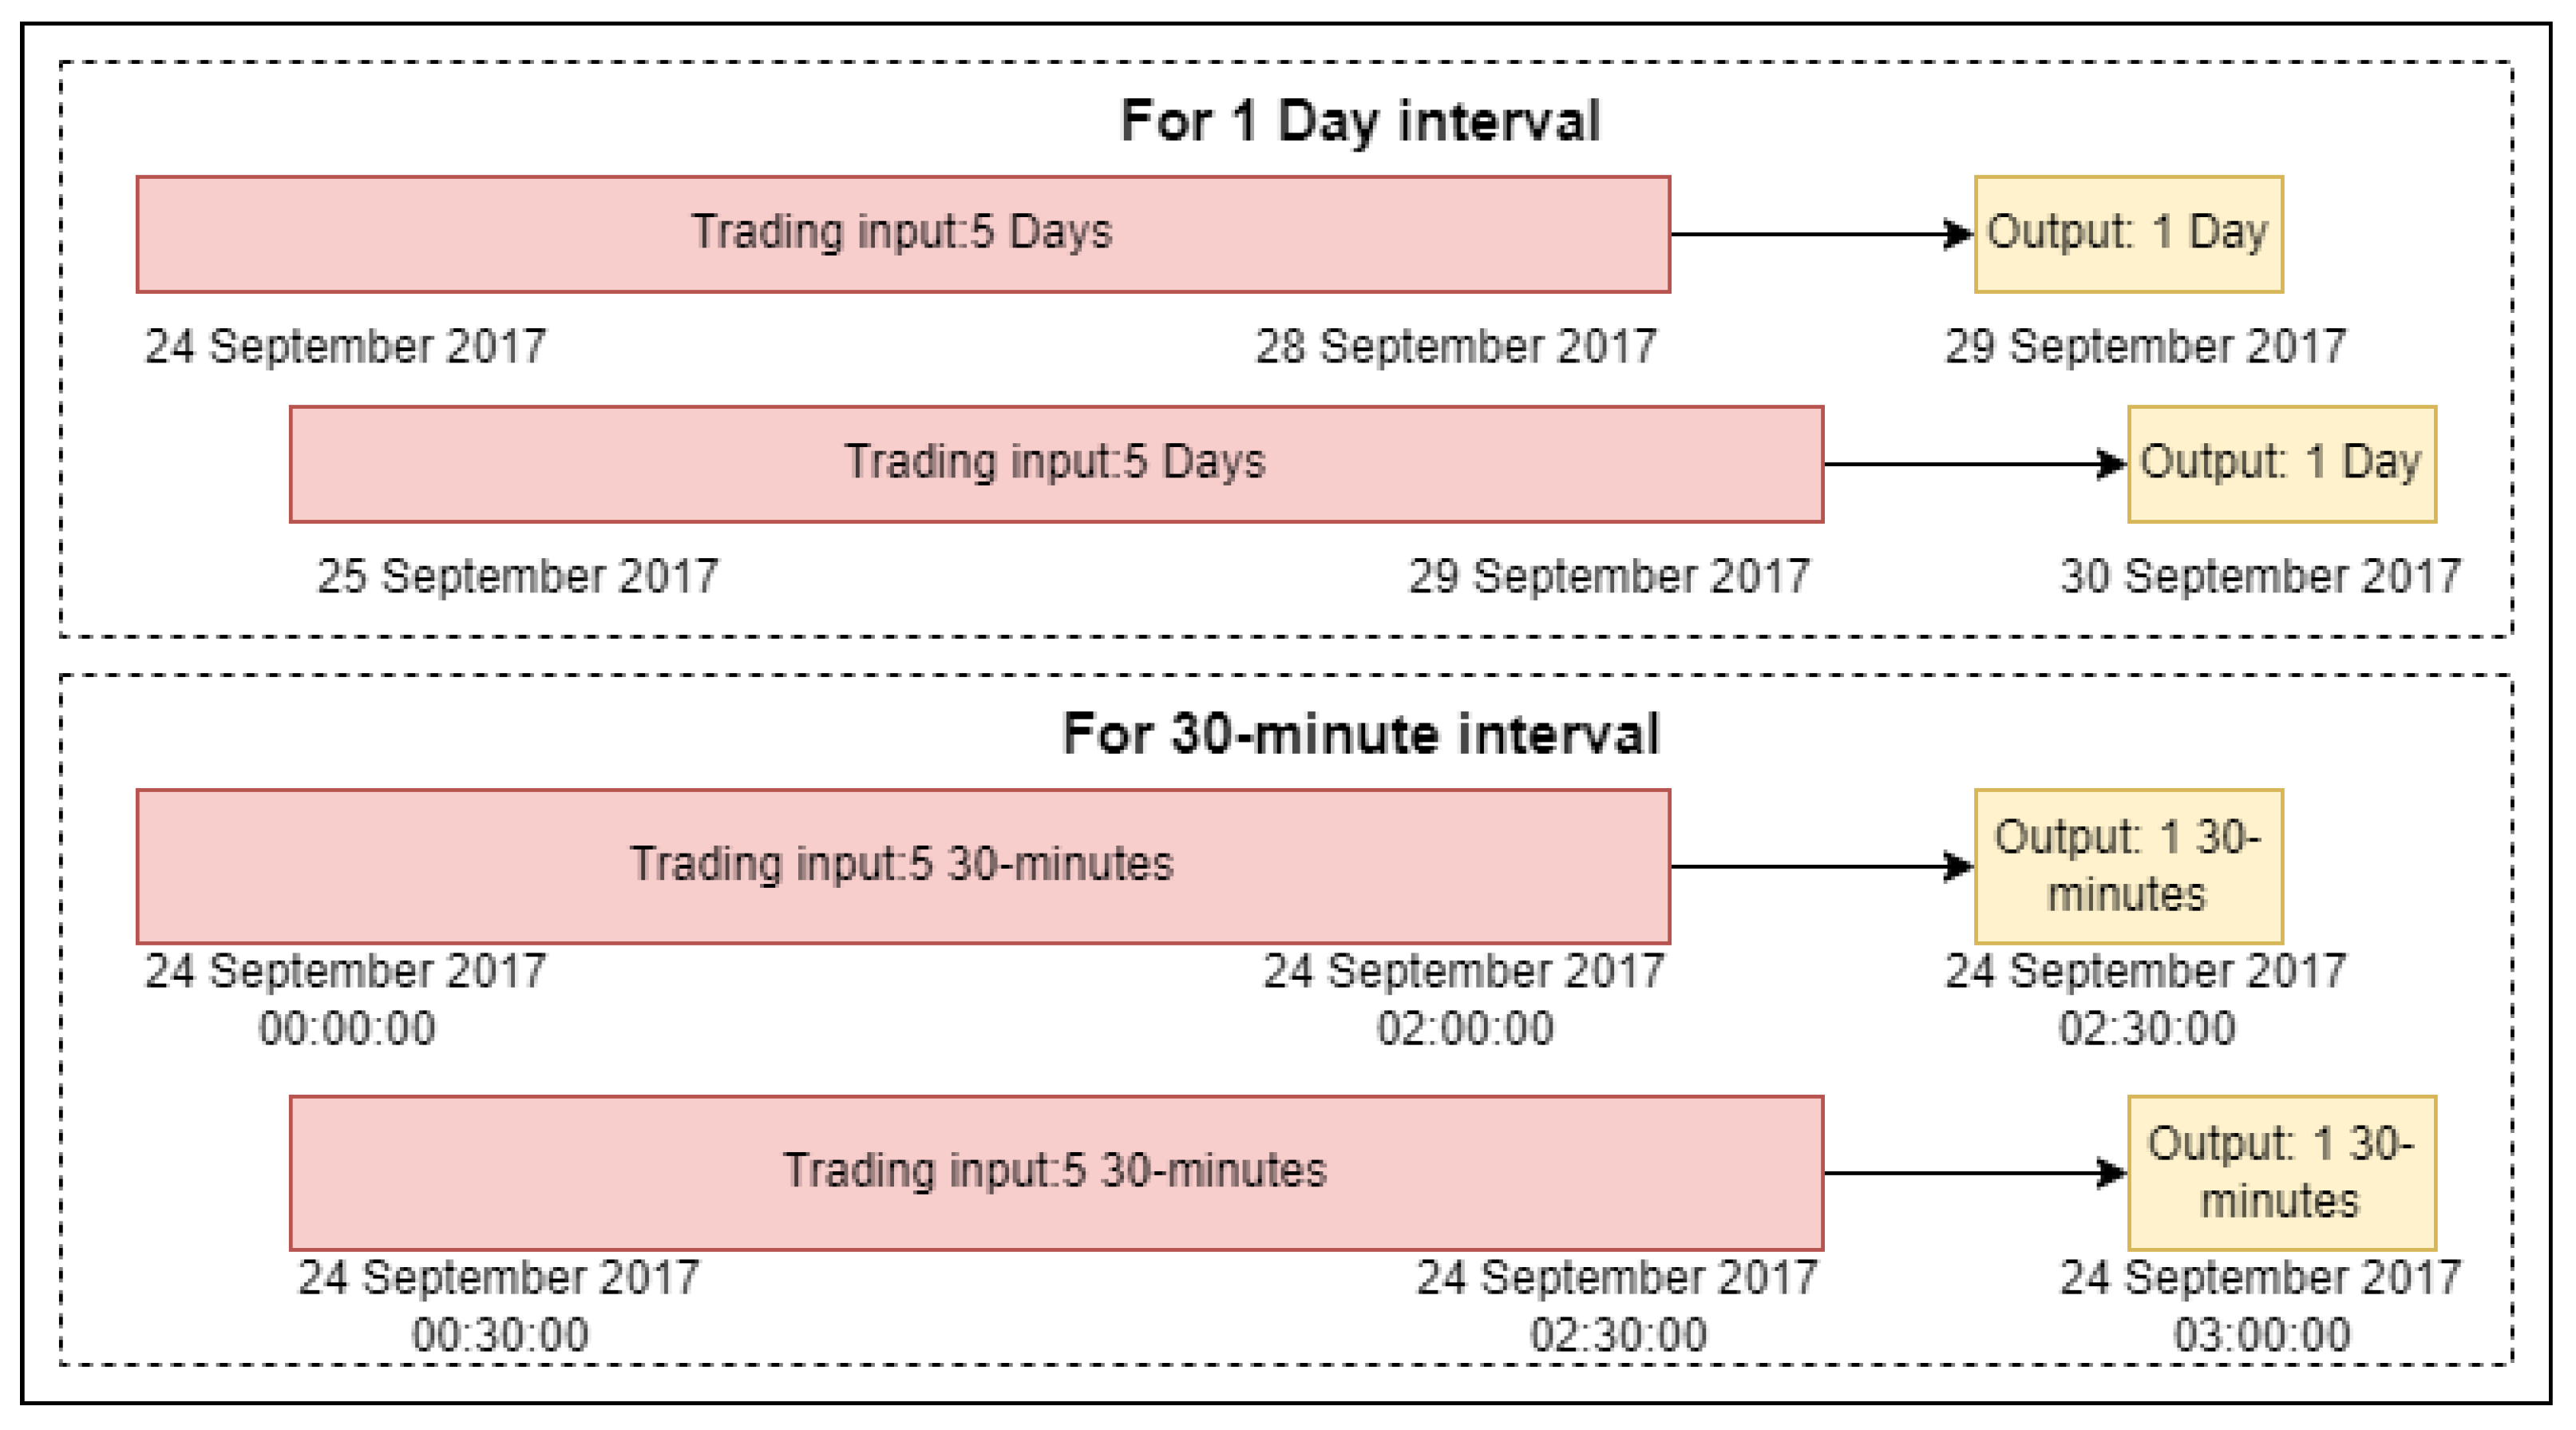
A rolling window with 5 steps is used in these financial time series data, as shown in
Figure 8. In addition, technical indicators and sentiment indicators are calculated as data sources.
Table 2 lists the input features for Bitcoin price prediction from the price data sector, technical indicator sector, and sentiment indicator sector.
The training duration of models are show in
Table 3. Stacking ensemble model training on 30 min interval data only costs about 27 min because of the GPU.
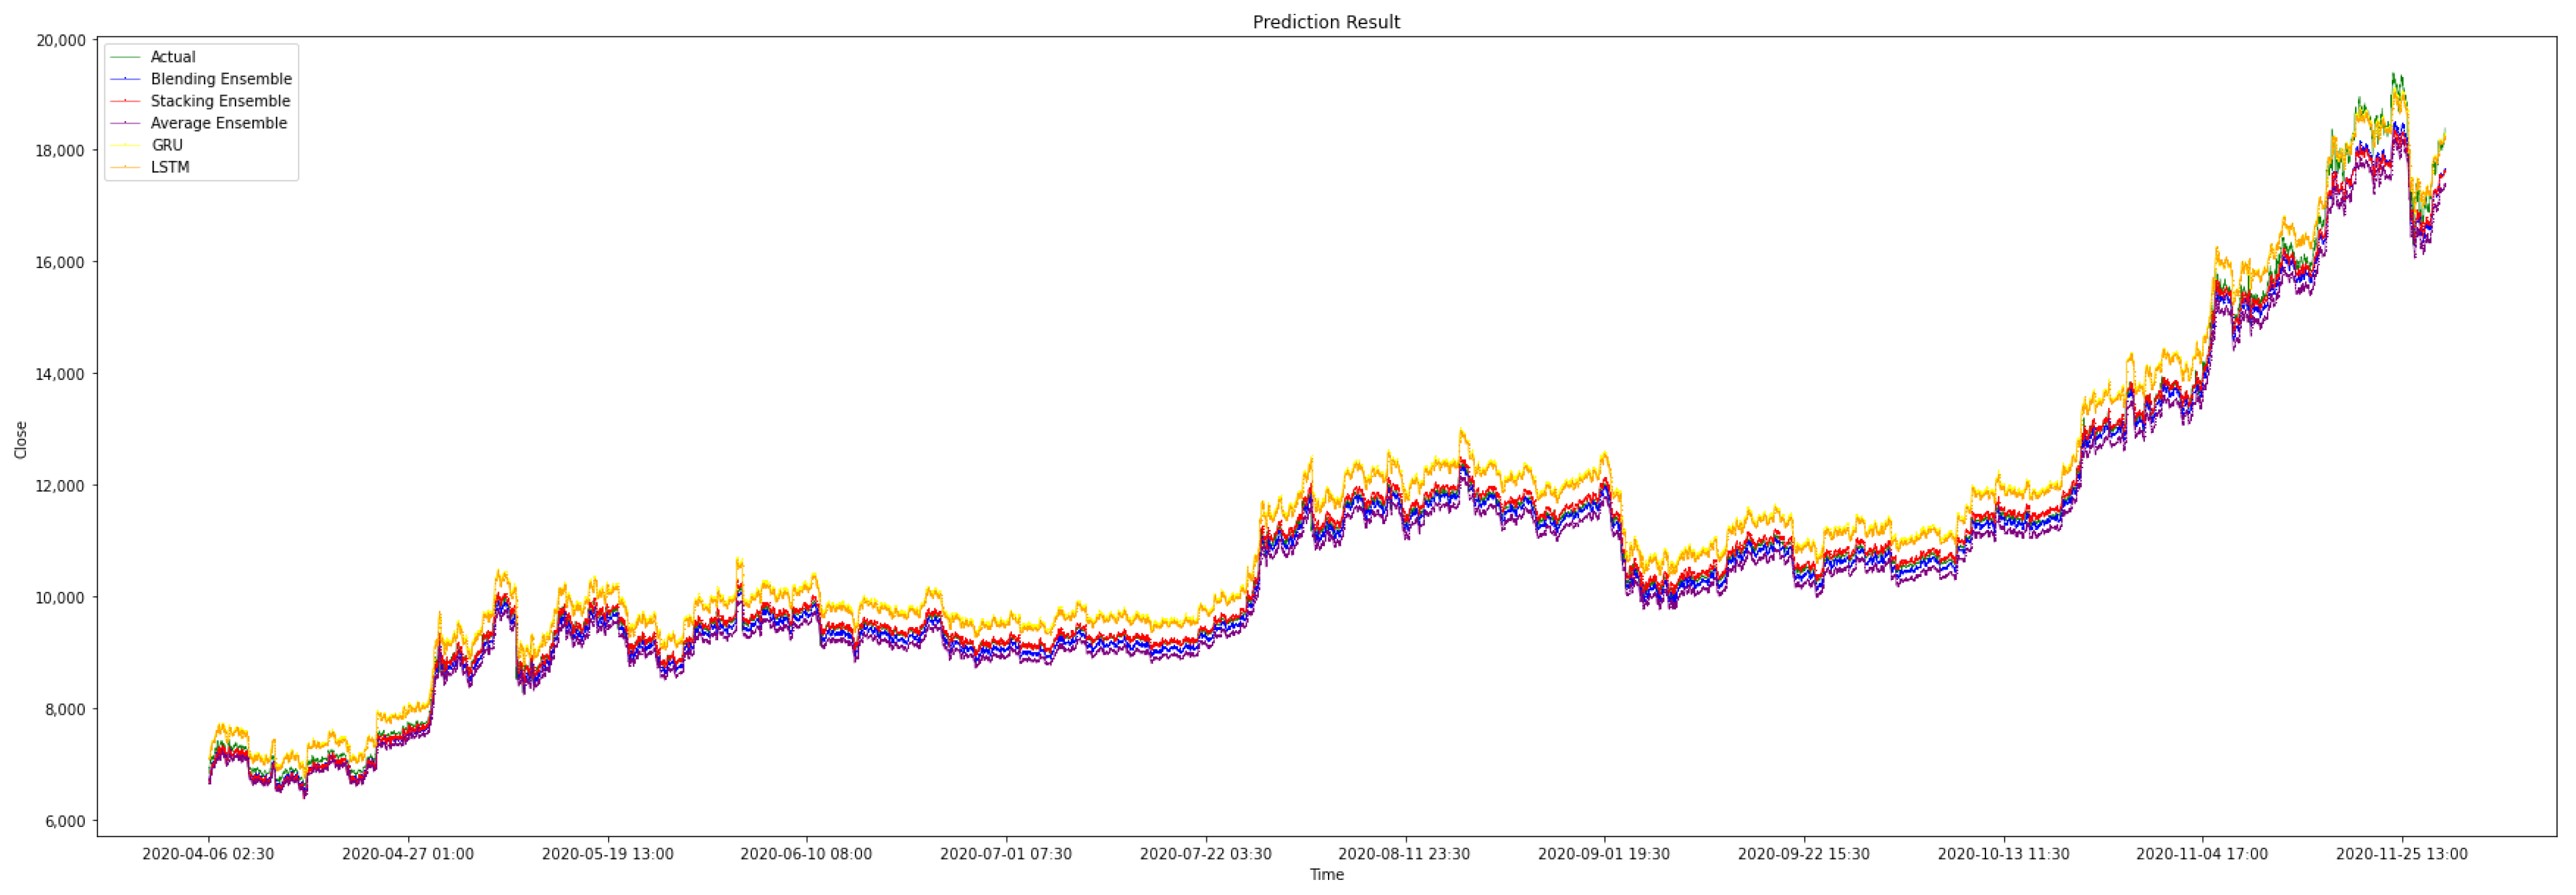
The first part is the experiments that compare the different models. The compared models include not only neural network models, such as LSTM and GRU, but also average ensemble (AE) and blending ensemble (BE). Both LSTM and GRU are single models that can be used for prediction. They are essential components of our ensemble models. The average ensemble model takes the average of the sum of the LSTM and GRU results as the final result. The MAE, MSE, MAPE, sMAPE, and MDA are used to evaluate the performance results of the proposed method and other models. All our results are shown in the
Table 4 and
Table 5.
As shown in
Table 6, the proposed stacking ensemble model has amazing performance in the MAE, MSE, and MDA evaluation categories. In MAPE evaluation, the proposed stacking ensemble model is the best compared with the other models on the 30 min time interval, but on the 1-day time interval, the blending ensemble obtains the best MDA score. In general, the proposed stacking ensemble model outperforms other models in most cases.
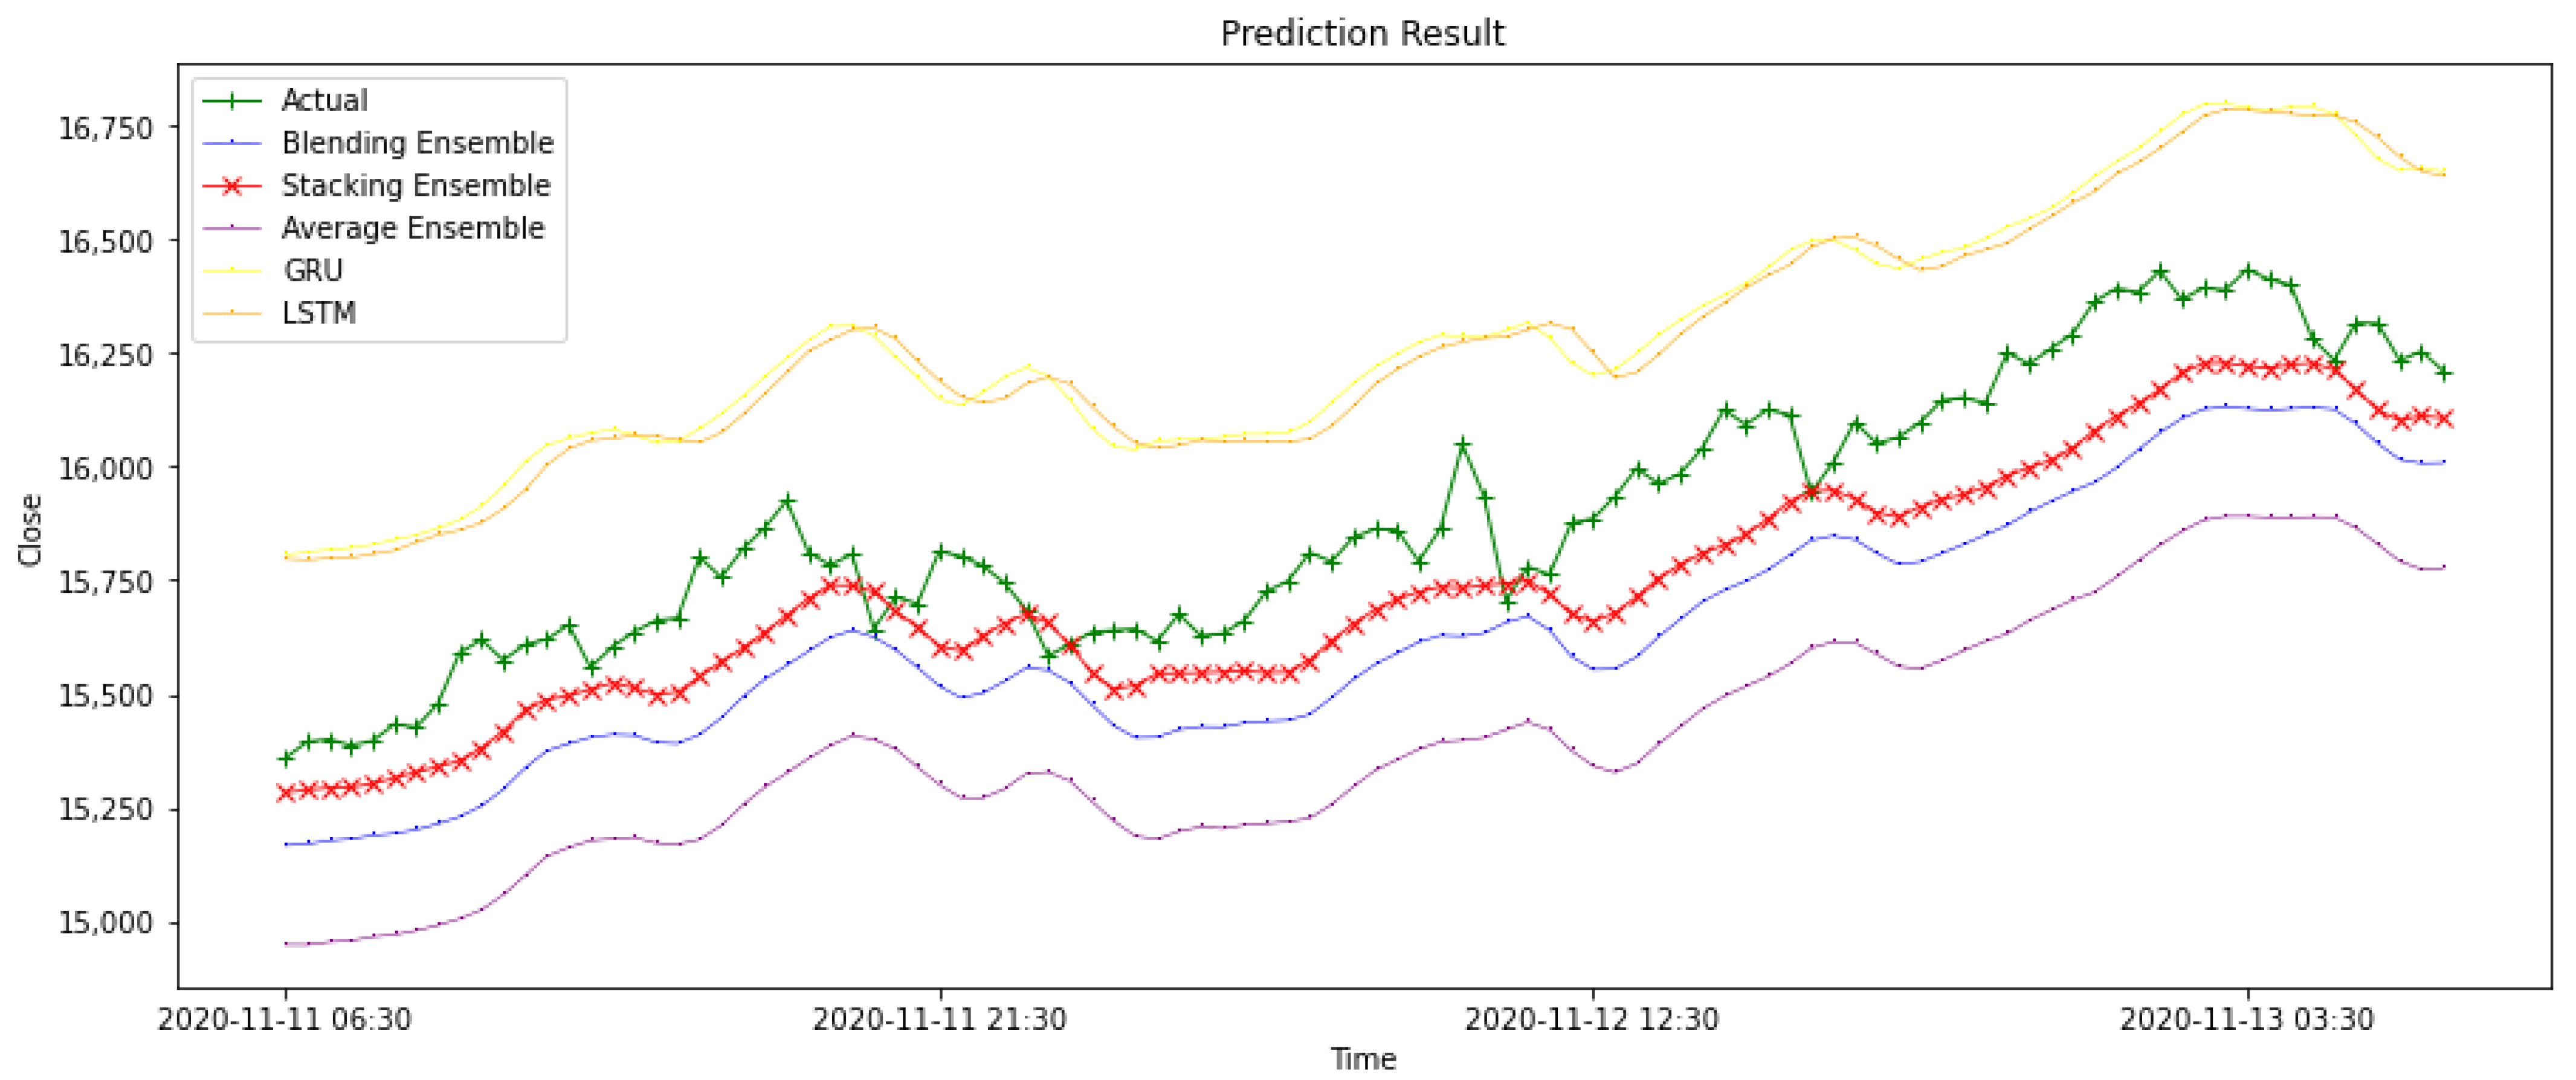
Figure 9 shows the results of the different models on the testing data.
Figure 10 is part of
Figure 9, the result of stacking ensemble model is marked ‘X’ and the actual value is marked ‘+’ to illustrate performance of models. The graph visually illustrates that the prediction results of the stacking ensemble model are closer to the actual closing price, and the shape of the prediction line is more identical to the shape of the actual line.
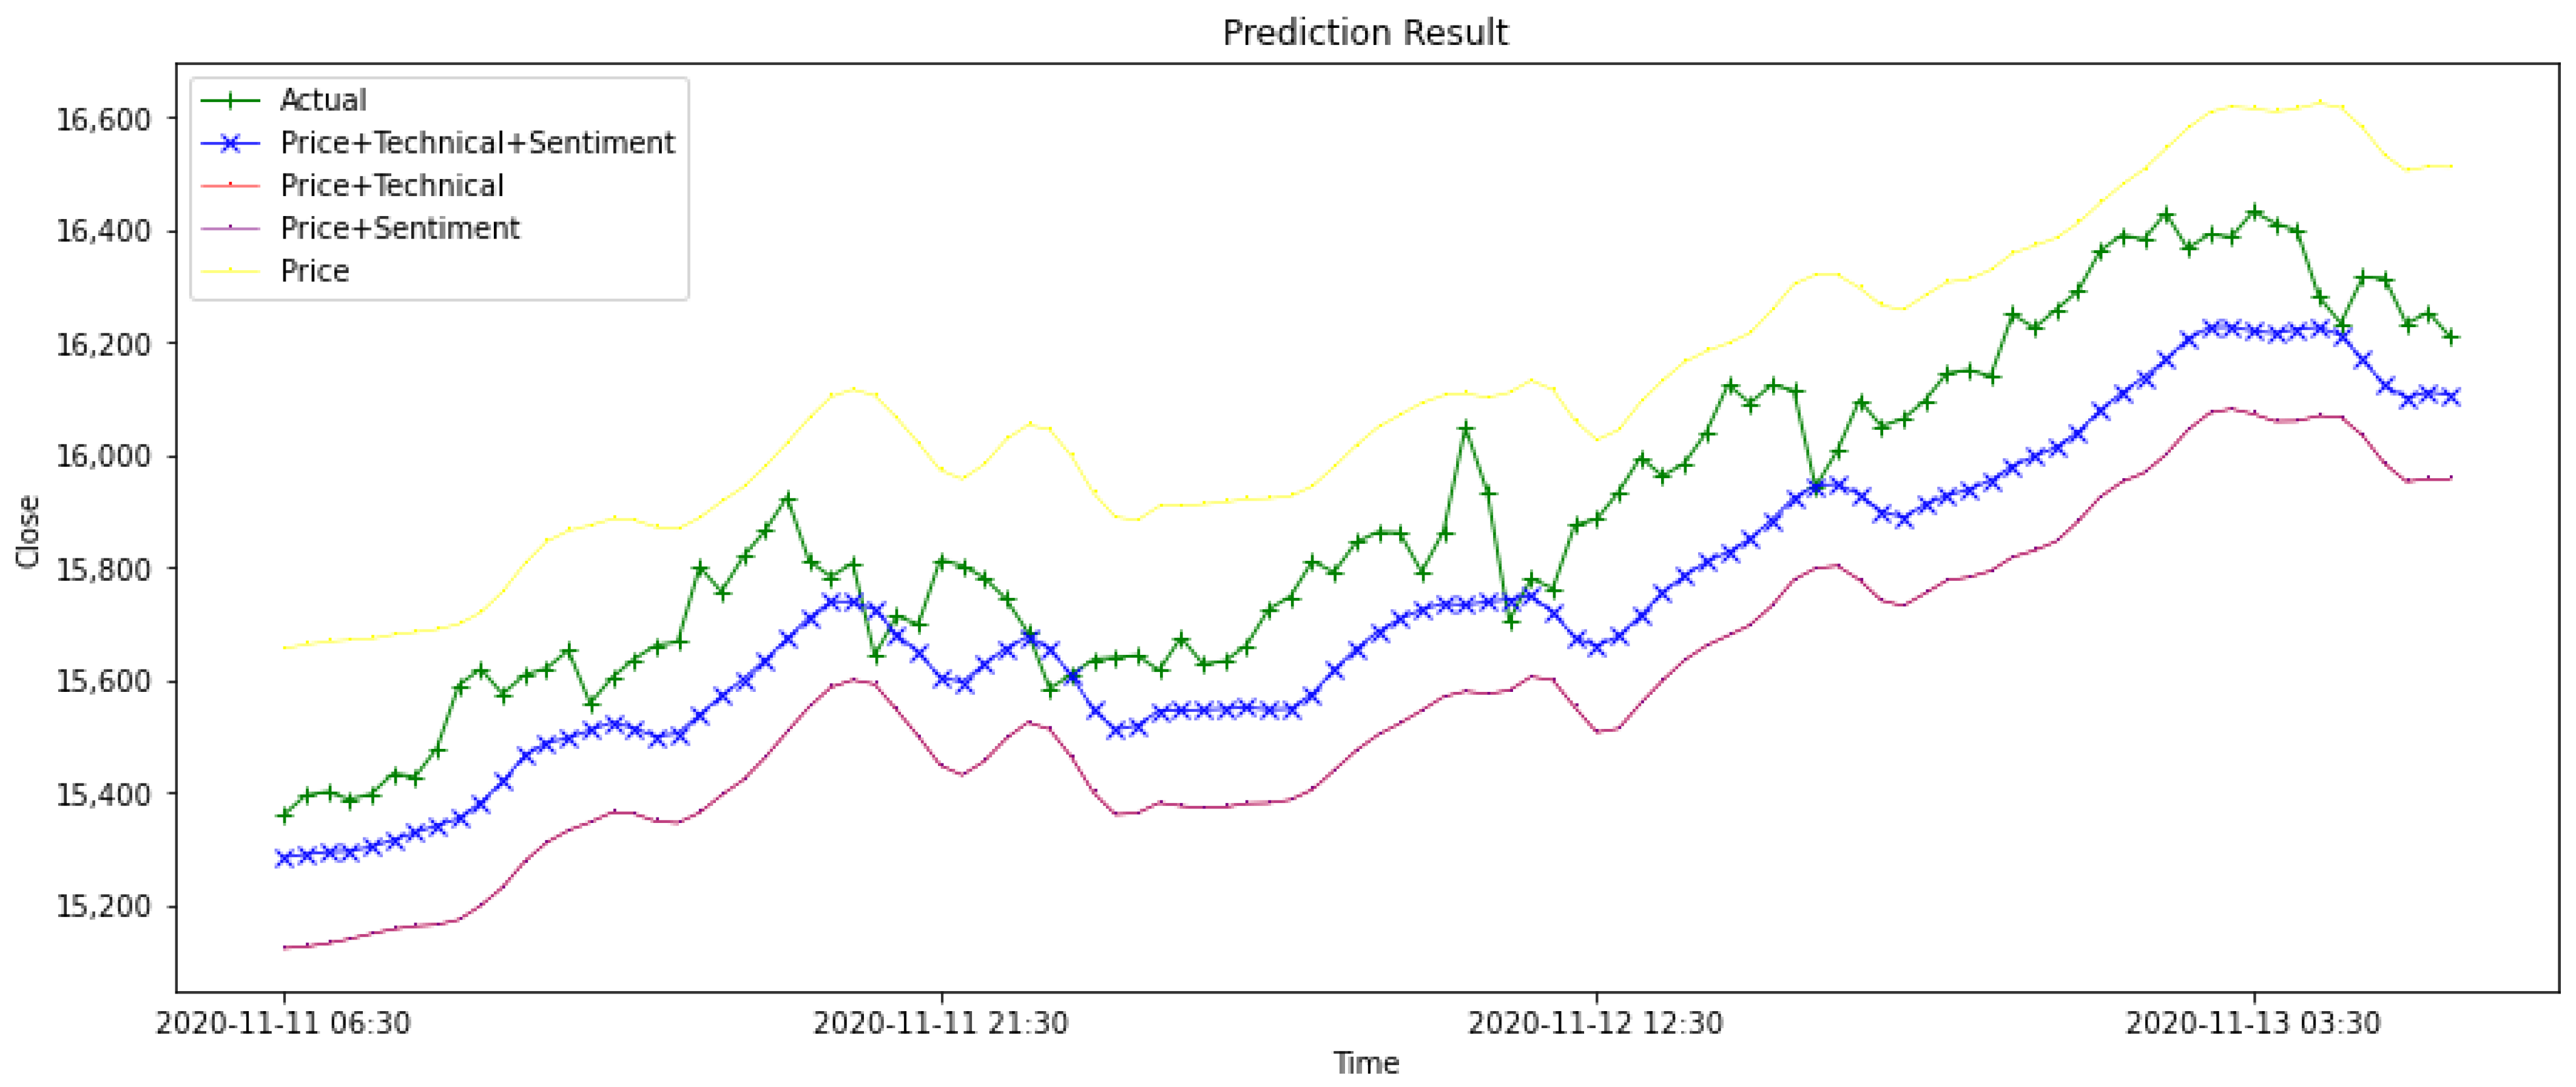
The second part is the comparative experiments with different data combinations. It is shown in
Table 7 that, for different time intervals, the data combinations that produce optimal performance are not necessarily the same. Specifically, when the data interval is one day, the combination of price data and technical indicators has better prediction performance than other data combinations since it obtains the best value of 492.90 among all the 1-day interval data combinations. The combination of price data, technical indicators, and sentiment indicators outperforms the other combinations for time intervals of 30 min, since it obtains the best value of 88.74 among all data combinations for 30-min intervals.
Experiments show that, in most cases, the combination of price data, technical indicators and sentiment indicators outperforms the data combination in previous articles. We can conclude that the richness of the input data used in the prediction can improve the accuracy of the prediction.
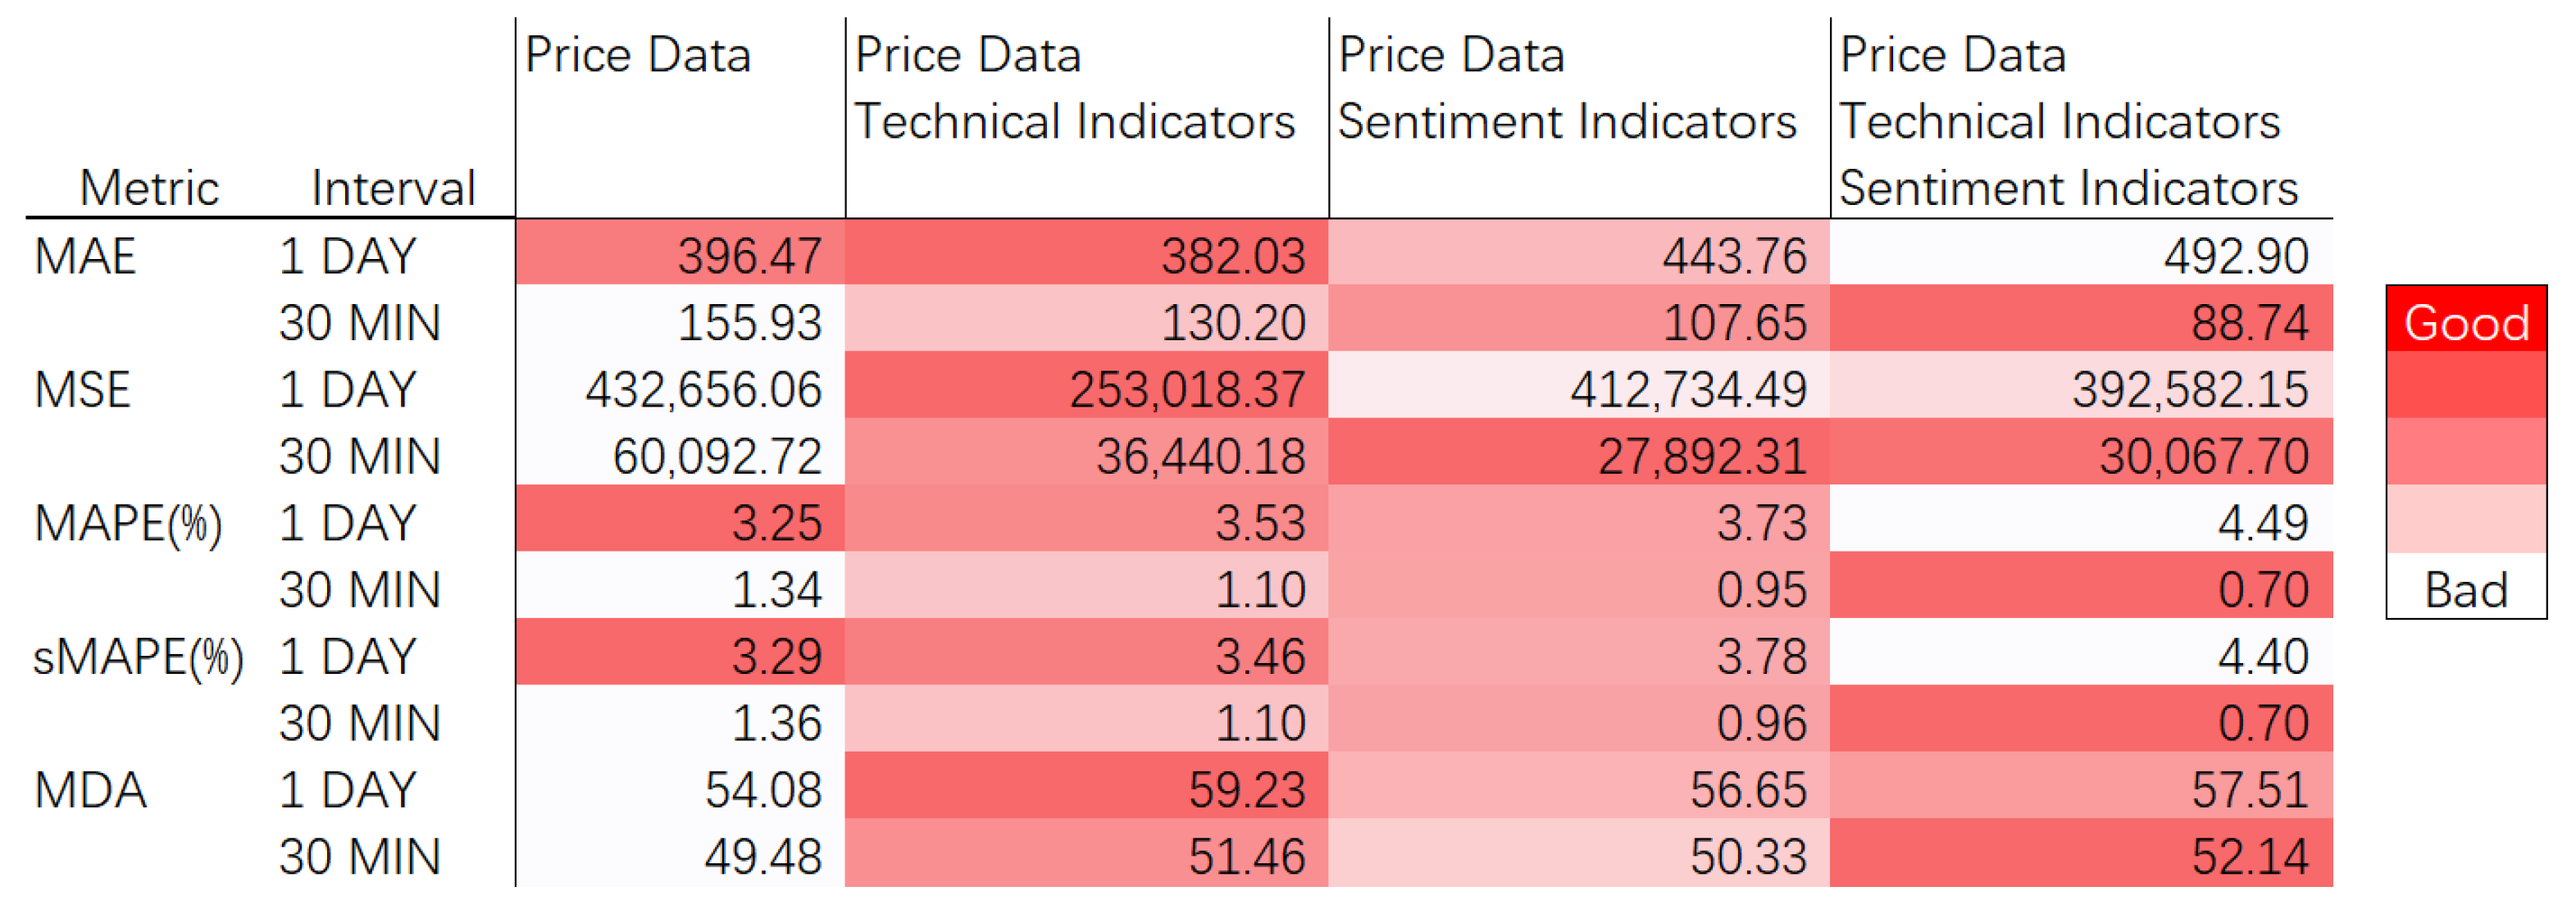
Furthermore, other metrics are shown in
Figure 11. The better the prediction obtained with the data combination, the redder the values are; the worse the prediction obtained with the data combination, the whiter its values are. The combination of price data and technical indicators achieves the best performance for 1-day intervals, and the combination of price data, technical indicators and sentiment indicators achieves the best performance for 30 min intervals. From our experiments, we found that price data with technical indicators are better for short-term predictions, such as predicting the next-day prices; however, price data with sentiment indicators are better for extra-short-term predictions, such as predicting the prices in the next 30 min.
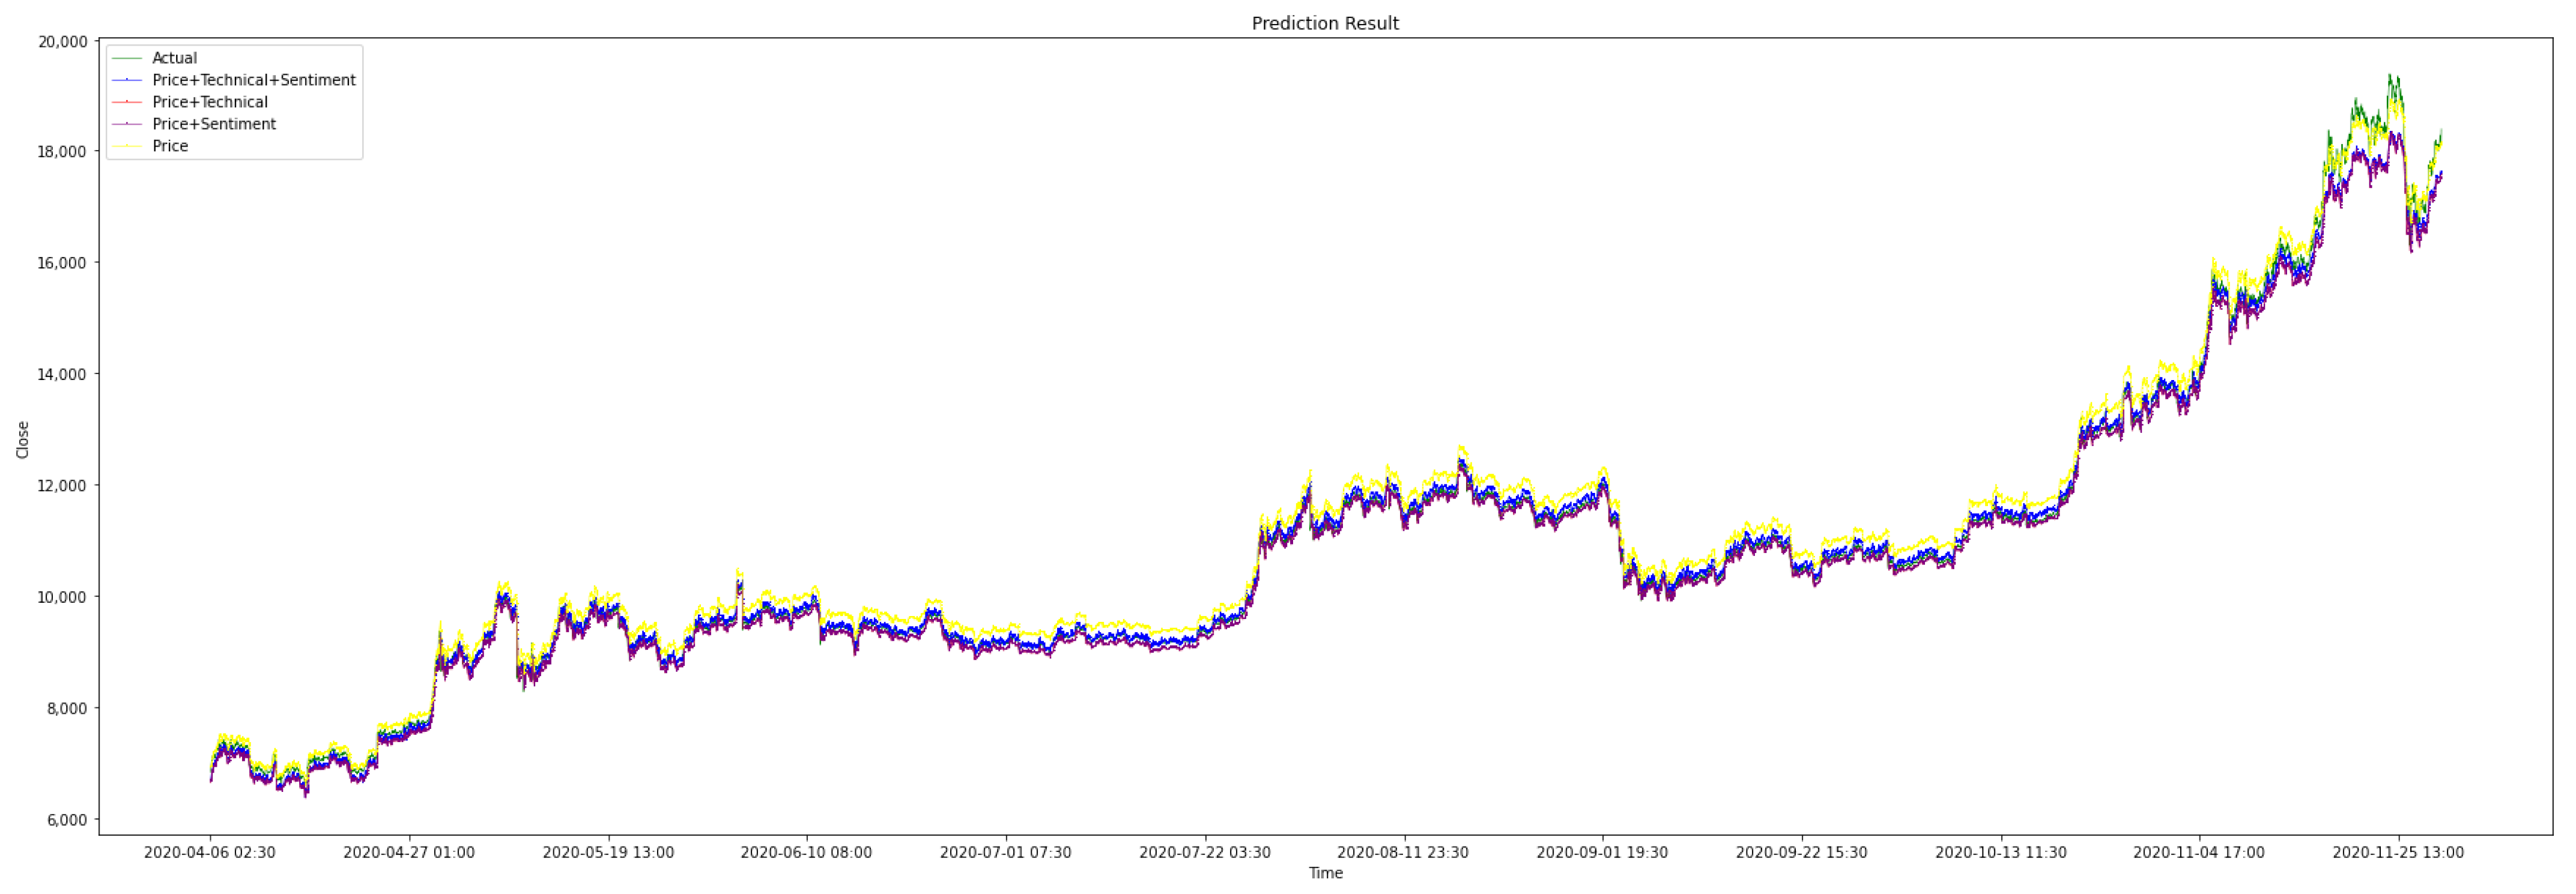
Figure 12 shows the testing data with different data combinations.
Figure 13 is part of
Figure 12, the result of using all data is marked ‘X’ and the actual value is marked ‘+’ to illustrate performance of data combinations. The graph visually illustrates that, for the stacking ensemble model, the accuracy of the prediction results depends on whether it is used for short-term prediction or long-term prediction. Generally, the combination of price data and technical indicators is better for short-term prediction, and the combination of price data, technical indicators and sentiment indicators is better for extra short-term prediction.
At present, in the research field of Bitcoin price prediction, there are several difficulties limiting the fair comparison of the new proposed method and previous methods: (1) the data format is diverse and difficult to unify; (2) the data acquisition methods are different, and the versions are different; (3) some implementation details are not mentioned in the theses of previous studies; (4) the source code is hard to obtain and run in new environments. Therefore, we briefly compare the results of previous related work with our newly proposed method in
Table 8.
Specially, the data combination of price and sentiment indicators under the 1-day time internal can be considered as the variant of Li and Pan’s proposed method [
1] in our experiments. By this way, it is shown that our proposed method has got the improvement from Li and Pan’s proposed method.
Bitcoin price data and social media text data are presented in different formats due to different providers or acquisition tools. Most of the methods in this paper only read data in one of the formats. For data formats other than the specified format, additional processing work is required.
As there are no standard open data for Bitcoin price prediction, all researchers collect data on their own. At present, there are several major trading platforms that provide their own transaction data for Bitcoin price data. The version differences among Bitcoin’s social media texts, such as those on Twitter or Reddit, are even more serious because the collection tools are different and the collection times are different. For example, a tweet that was published yesterday may be deleted by the author today. Then, the data version collected today is not the same as the data version collected yesterday.
There are many parameters and implementation details in modeling and model training. In a deep neural network, the structure of each layer has many parameters. However, these parameters are not all written in the original theses for good reasons. Moreover, there are many details in modeling, such as the split of training and test data and some shuffle operations to prevent overfitting of the model. These details can also be missing due to the lengths of the theses and the focus of the topics. The lack of this information makes it difficult to reproduce previous methods solely by the theses themselves.
If one is fortunate enough to obtain the source code with the author’s consent, there will still be environmental and operational difficulties. We know that many machine learning and statistical toolkits are updated very frequently. A piece of code can run under the package version used by the author at the time, but it may not be able to run smoothly under a new version. In addition, it is also possible that the running result is different from the author’s result due to the inability to obtain the same running environment as the author.
5. Conclusions
The price of Bitcoin often fluctuates wildly, inspired by the work of Li and Pan [
1], we propose an ensemble deep method, which combines two RNNs, to predict the future price and price movement of Bitcoin based on the combination of historical transaction data, tweet sentiment indicators and technical indicators. It is worth noting that we crawled two datasets at different time intervals: 1 day and 30 min. Because of the financial attribute of cryptocurrency, four evaluation indicators, the MSE, the MAE, the MAPE, and the sMAPE, are used to measure the price prediction performance, and the movement direction accuracy (MDA) is used to measure the price movement prediction. Two types of comparative experiments are conducted in this research: experiments that compare different models and experiments that compare the impact of different data combinations on forecast prices. The results show that in the same situation, a stacking ensemble can help with fewer training resources and better performance, and social media sentiment analysis makes a greater contribution to extra short-term price prediction than to short-term price prediction.
Prediction models and input data sources have great room for improvement in the future. First, the model can be optimized from the three aspects of the model framework, model size and optimization process to improve prediction performance [
44]. For the model framework, we can consider changing the model types and activation function. For the model size, the width and number of hidden layers are two potential values where we can make adjustments. For optimization, the proper setting of the hyperparameters is essential. Second, the inclusion of other data sources may improve the existing forecasting accuracy. In this research, we consider the historical transaction data, sentiment trends of Twitter, and technical indicators. However, there may be other potential factors, including regulatory and legal matters, competition between Bitcoin and other cryptocurrencies, and the supply and demand of Bitcoin. In addition, the microexpressions of cryptocurrency investors during trading can also be considered potential factors affecting cryptocurrency prices. Third, we can also dynamically change the size of the window according to different data types. For example, news is not published as quickly as social media comments, such as tweets. Therefore, we can set different window sizes for data with different update frequencies and study the long-term or short-term influences on prices. Experiments based on the proposed model can be extended to research on the price prediction of other cryptocurrencies. The new bitcoin price prediction model proposed by us provides a reference for practitioners to avoid their potential risks in trading. In addition, researchers can develop better regulatory measures and laws by studying the relationship 429 between opinion analysis on social media and price movements of cryptocurrencies.


