1. Introduction
A structural approximation method was developed and applied to high contrast composites in [
1,
2,
3] and summarized in the books [
4,
5]. It is based on the discretization of heterogeneous structure when the discrete network (graph) is constructed in accordance with the high contrast inclusions embedded in a composite. The corresponding asymptotic analysis justifies the structural approximation method and demonstrates the precision of its applications. The local fields estimated by continuous methods confirm the derived approximations [
6,
7] and used as initial approximations to get accurate analytical expressions for the local fields [
8].
In the present paper, we pay attention to two-dimensional composites with perfectly conducting non-overlapping disks randomly located in the plane. We are interested in constructive results concerning the effective properties which can be found for a representative cell with many inclusions by effective numerical procedures. The proper application of the corresponding Monte Carlo method with a large number of computational experiments is discussed in [
9,
10]. Advantages and drawbacks of various approaches are discussed in [
9,
10,
11].
Dilute and densely packed composites may be considered to be two extreme classes of dispersed composites. Recent results devoted to small and moderate concentrations can be found in [
12,
13,
14]. The theory of percolation describes the dependence of the effective conductivity on the concentration of inclusions when the zero conductivity becomes infinite at the threshold point. The structural approximation holds near the percolation threshold when the gap between inclusions is small but finite. Analytical formulas for the interparticle flux are derived and justified in the framework of structural approximation [
4,
5]. These formulas and examples demonstrate how to estimate the effective conductivity for a given structure. To investigate random composites we have to apply statistical methods to construct the proper representative cell and perform the necessary computer simulations. This is the main task of the present paper. The problem is formulated in terms of the graph energy and based on the formulas for the local flux derived in [
4,
5]. The corresponding algorithms are developed and simulations performed for various statistical distributions of densely packed disks. It is worth noting that in the opposite extreme case of vanishing concentration we come to the traditional methods of stochastic geometry [
15].
The procedure of structural approximation in this case consists of two steps. First, the centers of disks are considered to be vertices
A connected with the neighbor ones by edges
E. This yields a graph
, double periodic in our case. Next, a boundary value problem for the discrete Laplace equation on the graph
G is solved and the energy of the graph is determined. Usually, the Voronoi tessellation [
16] serves as the criterion of neighborhood. The effective conductivity of the considered composite is defined and calculated as the energy transported per unit cell (per unit time).
In [
4,
5], a representative cell was taken as a rectangle
Q with the sides parallel to the coordinate system. The external flux is modeled by constant potentials given on the opposite sides of
Q parallel to the
axis. The normal flux on the sides parallel to the
axis vanishes. The Voronoi tessellation besides the disks includes mutually disjoint segments located on the boundary
. These segments are called pseudo-disks and they form a partition of
.
The considered structural approximation was extended to periodic heterogeneous structures in [
17] to be consistent with the theory of homogenization. A two-dimensional composite is considered to be a doubly periodic structure on the plane. The fundamental parallelogram
formed by the fundamental translation vectors
and
is now considered to be a representative cell. The set of vertexes
in
generates the double periodic set
where
and
run over the set of integer numbers
. An example is displayed in Figure 3 below. The vertexes
yields a double periodic Voronoi tessellation. It is worth noting that it differs from the Voronoi tessellation constructed for the finite set
A with pseudo-disks.
In the present paper, we follow the general theory of structural approximation [
4,
5] in the version of periodic composites [
17]. A computational method is developed to study various random distributions of
A in the periodicity cell. The proper statistical methods are used to simulate random composites. First, following the RVE (representative volume element) theory [
9] and algorithms developed in [
18] we simulate various distributions of disks. Next, the corresponding networks are constructed. They determine classes of graphs called the random Delaunay graphs associated to the considered probabilistic distribution. The effective conductivity is calculated as the energy of graph. The obtained results are statistically worked out. They demonstrate the clear dependence of the effective conductivity on the distribution of disks.
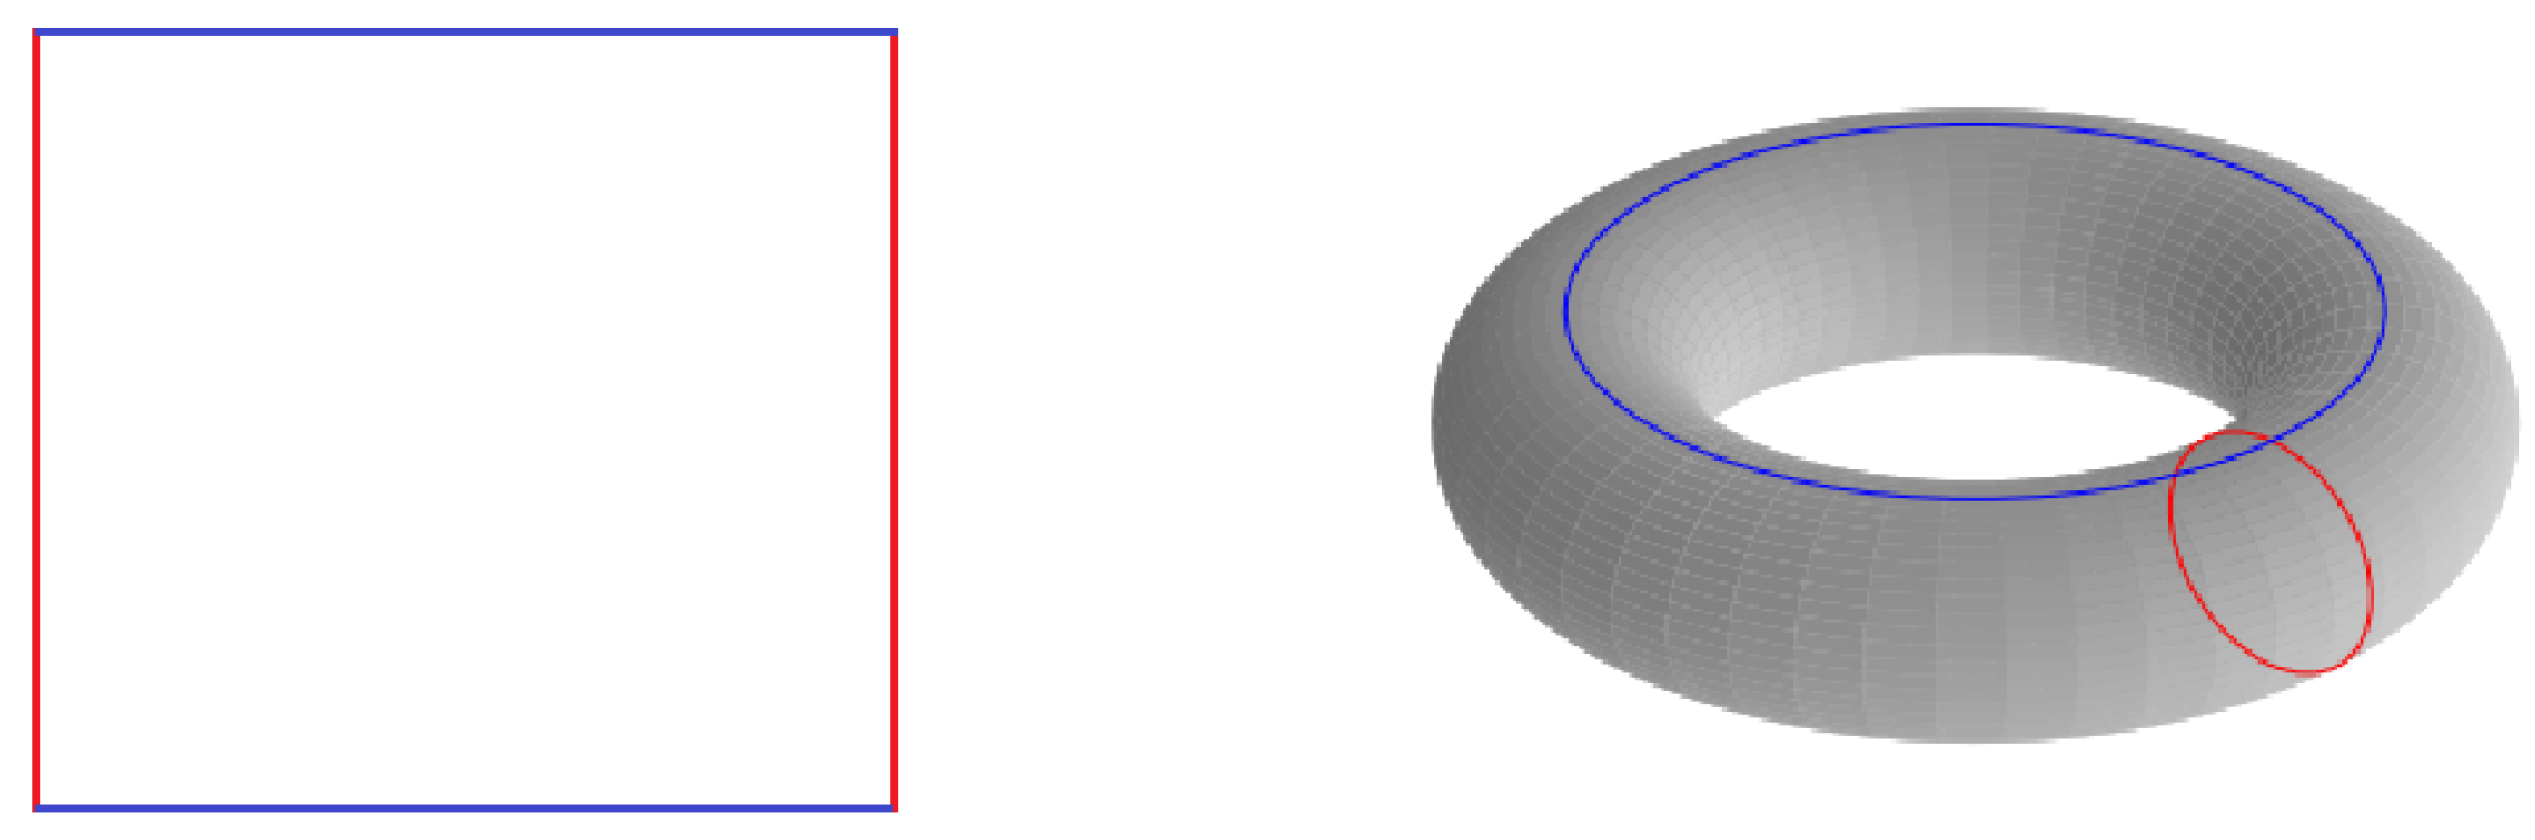
2. Double Periodic Voronoi Tessellation
Consider the fundamental parallelogram
span on the vectors
It assumed that the area of
is normalized to unity, hence
. Introduce the metric when the distance between two points
has the form
where the standard Cartesian distance is used in the right part. Therefore, the opposite sides of
are welded by pairs. This yields the plane torus displayed in
Figure 1.
Let a set of points
A is fixed in the cell
. The vertexes
yields the double periodic Voronoi tessellation displayed in
Figure 2 for the square cell
.
We now outline computer implementation of toroidal Voronoi tessellation and Delaunay triangulation. First, take
, nine copies of the initial set
A, as illustrated in
Figure 3. Second, construct the Euclidean Voronoi tessellation and Delaunay triangulation for this set
B using the standard Delaunay and Voronoi implementations available in the SciPy package [
19]. A multiplied domain contains
points which results in a certain slowdown in computing both structures. Nevertheless the increase of the number of points is linear which makes it negligible in the relatively small datasets (up to a few thousand points).
The double periodic graph is obtained from the finite graph constructed for the set B by deleting some vertexes and edges in the following way. The set of vertexes is taken as A. Take only such an edge of which has an end point of A. The double periodic pairs of the obtained edges are identified. Hereafter, only double periodic graphs are considered.
3. Energy of Graph
Besides the geometrical features discussed above we introduce the energy of a graph following [
4,
5]. It is worth noting that the considered energy corresponds to the total energy passing through the double periodic graph
. The vertexes
A can be considered to be perfectly conducting inclusions embedded in a conducting matrix with the normalized unit conductivity. The considered structure models a two-dimensional (fibrous) composite. The conductivity can be considered to be thermal, electric or as permeability of porous media etc. More precisely, all the stationary two-dimensional physical processes governed by Laplace’s equation can be considered. For definiteness, we consider the stationary heat conduction. Then, the introduced below energy is the total heat passing through the periodicity cell in a unit of time. Of course, it consists of the heat passing through the edges of graph.
We follow the theory of structural approximation developed for densely packed composites [
4,
5]. Introduce the gap between the vertexes
and
where the metric (
2) is used. The set of gaps is introduced only for the edges of the graph
. The interparticle flux interaction is estimated through the gap distance
where
g is a convex positive function. This function for Laplace’s equation becomes [
4,
5]
In the case of equal disks, (
5) generalizes the famous Keller formula [
20]
where
. One can see that
tends to infinity when the gap
tends to zero.
Introduce the set of potentials
. Every
corresponds to the temperature at the point
. It is worth noting that the potential is defined up to an arbitrary additive constant. Therefore, only the differences
will determine the heat flux in the considered discrete structure. It is convenient to introduce the function
defined on the set
in such a way that
. The considered structure is doubly periodic. This implies that the heat flux passing through the structure is also doubly periodic but the function
is only quasi-periodic, i.e., it has constant jumps per a periodicity cell [
9]. These jumps are usually fixed as a difference of temperatures along a vector
q which determines the external flux applied in a fixed direction. Consider for definiteness the vector
. Then
where
and
denote the
x-coordinate of the fundamental vectors (
1).
Let a graph
be fixed. Introduce the summation over all its edges
where
means that the vertexes
and
are connected by an edge. One can see that the summation (
8) contains every term twice.
The local energy between
and
is equal to
. The total energy per cell can be found from the sum
Here,
(
), and
is equal to
, if the vertex
belongs to the cell
. If the vertex lies in a neighbor cell, i.e., the edge intersect a side of
, this value becomes
for some numbers
. This dependence corresponds to the quasi-periodicity of the potential
satisfying the relation (
7).
The formula (
9) determines the energy per cell. Hence, it is equal to the effective conductivity up to a multiplier. It is worth noting that the energy depends on the structure of the graph
. The constants
(
) are unknown and have to be found from the minimization of energy. The constants
are linearly related to
by (
10) with the prescribed constants
and
. Therefore, the expression (
9) is a quadratic form in the variables
(
).
The existence of the minimal energy follows form its representation as the sum of convex functions
. The minimization is not unique, since addition of the same constant to a solution
u yields the same value of energy. The uniqueness holds, for instance, if we put
. Calculating the partial derivatives from (
9) on
(
) and equating them to zero leads to the system of linear algebraic equations
This is a non-homogeneous system with a unique solution [
17]. After After finding its solution we substitute the result into (
9) and find the required energy.
Remark 1. The term "energy of a graph" is frequently used for the sum of the absolute values of the eigenvalues of the adjacency matrix. We think that it is another value not reduced to the energy used in the present paper. Though, the comparison of these energies may lead to inequalities useful in applications.
4. Simulation of Random Structures and Graphs
Diversity of the real two-phase dispersed structures implies diversity of the theoretical distributions of inclusions. Though we consider circular inclusions, their arbitrary locations allow forming clusters of various shapes. Technological processes can include the addition of moderator leading to attraction or repulsion of particles to spontaneously generated clusters [
21,
22]. We simulate points
A by random walks in combination with three distance distributions which model various interactions among particles. Separate simulations are performed by RSA (Random Sequential Adsorption). In the present section, we follow the disks generation algorithm developed in [
18] and used in the further simulations. The main idea is outlined below, and the details can be found in [
18]. The difference consists in the regimes of moderate concentrations investigated in [
18] and densely packed disks simulated in the present paper.
First, the set
A is defined inside cell
so that points are placed on a regular lattice or generated as a result of Random Sequential Adsoprtion procedure [
18,
23]. These points represent centers of disks. To produce a new distribution from
A with varying degree of clustering, each point is shifted, where the shift is parametrized by an angle
(direction) and a distance. Both parameters are chosen at random with following constraints: both angle
and distance are randomly sampled and the distance is limited so that after performing the shift, the new location does not collide with any of the remaining disks. Distributions used for the distance sampling are shown in
Figure 4 and called the
Z-distributions. The process described above is a particular case of the Markov random walks.
The exact procedure for the input data A can be split into two main steps:
Calculate parameters of a shift (vertex motion): randomly choose an angle uniformly distributed in the interval and a distance using a selected distance probability distribution.
Perform a shift of a vertex in the chosen direction on the chosen distance.
The particular classes of
Z-distribution different by the distance probability distributions are displayed in
Figure 5. Three types of the pair particles interactions are used in simulation: neutral (
), attractive (
) and repulsive (
). They generate models with various degrees of clustering. In the present paper, three classes of distance disks distributions, respectively, three classes of graphs are studied. The distance probabilistic distribution between the points
A is independent of the distribution of
A in the cell. Each class consists of 100 locations of 256 disks whose centers are placed inside the cell
.
To gain some intuition in the resulting differences of disks distributions aside from their formal description, we present
Figure 4 illustrating sample visualizations.
The class can be characterized as the relatively regular distribution of disks, as opposed to the classes and which clearly display the higher degree of clusterization. Visual differentiation between and classes appears to be more challenging, especially without examining any additional samples.
Assuming that in the result of the initial experiment the set of data described in the paragraph above shows a correlation between graph energy and disks distribution, an additional set of data is required to conduct further analysis and validate if any other type of distribution (in the sense of points generated with a different procedure) shows a corresponding relation. For this purpose, the RSA distribution previously used as an input data for the process of generating clustered distributions, is treated here as an independent class of disks arrangement and hence as a direct source of graph vertexes.
The last class of distribution contains the hexagonal lattice shown in
Figure 6 which yields optimal packing in the sense of the highest disks density. With the fully deterministic points placement it serves as a certain point of reference for the random distributions described above.
6. Discussion and Conclusions
In the present paper, we extend the theory of structural approximations to double periodic structures represented by the plane torus. The results are applied to determine the effective conductivity of densely packed disks. Various statistical simulations of non-overlapping disks are discussed. They model the degree of clusterization illustrated in
Figure 4 and
Figure 5. The obtained results demonstrate that the effective conductivity as the energy of graph clearly differs for different classes of graphs. The considered classes of graphs are strongly (statistically) related to distributions of disks based on their pair-particles
Z-distributions. Therefore, we develop a method for passing directly from a pair particles distribution to the effective conductivity of random composites. This method can be considered to be an alternative approach to the distributions based on the spatial correlation functions. Statistical two-point distribution functions are commonly used for the representation of microstructures and also for homogenization of two-phase composites. However, their applications give too approximate estimations of effective properties in some cases since higher order correlations are not taken into account. Actually, two-point distribution functions simulate various media depending on different computer implementations. This assertion is clearly explained on the theoretical level in [
9,
10]. One can find practical applications based on the implemented protocols and their impact on the macroscopic properties in [
22,
24,
25,
26] and other works cited therein.
The obtained results develop the theory of structural approximations to random media. It is shown that the geometrical distribution of composites, as an amount of information, remains in the Delaunay graph. The effective properties of composites are clearly distinguished after the corresponding data processing. The measure of the similarity of distributions using energy is beyond the scope of this paper, but it is a potentially interesting direction for further research on the role of energy in the characterization and classification of graphs and distributions of this type. Here, we mention the suggestion [
10] (formula (2.40)) for such a measure as an entropy-like irregularity measure.


