Article

Neural Network Modelling for Prediction of Zeta Potential

1
Department of Chemistry, Faculty of Science, University of Ostrava, 30. Dubna 22, 701 03 Ostrava, Czech Republic
2
Department of Informatics and Computers, Faculty of Science, University of Ostrava, 30. Dubna 22, 701 03 Ostrava, Czech Republic
*
Author to whom correspondence should be addressed.
Mathematics 2021, 9(23), 3089; https://doi.org/10.3390/math9233089
Submission received: 8 November 2021 / Revised: 27 November 2021 / Accepted: 29 November 2021 / Published: 30 November 2021

Abstract

:
The study is focused on monitoring the influence of selected parameters on the zeta potential values of titanium dioxide nanoparticles. The influence of pH, temperature, ionic strength, and mass content of titanium dioxide in the suspension was assessed. More than a thousand samples were measured by combining these variables. On the basis of results, the model of artificial neural network was proposed and tested. The authors have rich experiences with neural networks applications and this case shows that the neural network model works with a very high prediction success rate of zeta potential. Clearly, pH has the greatest effect on zeta potential values. The influence of other variables is not so significant. However, it can be said that increasing temperature results in an increase in the value of the zeta potential of titanium dioxide nanoparticles. The ionic force affects the zeta potential depending on the pH; in the vicinity of the isoelectric point, its effect is negligible. The effect of the mass content of titanium dioxide in the suspension is absolutely minor.

Graphical Abstract

1. Introduction

The zeta potential is an electric charge that arises on the surface of a particle that comes in contact with an aqueous solution. As a result, an electric charge is generated on the surface as a result of local free electrons in the solution, which tend to rearrange into a non-zero charged region that exists near the particle–solution interface. The arrangement of charges at the solid–liquid interface and the equilibrium between the counterions in the liquid is usually referred to as an electric bilayer. It is a compact thin layer of ions immediately next to the surface of a charged solid particle. The ions of this layer are immobile due to the strong electrostatic attractive force. The ions in the solution outside this layer move freely. The zeta potential is the electrostatic potential at the boundary dividing the compact layer and the diffusion layer. Zeta potential is a designation for the electrokinetic potential in colloidal systems, which acts at the interface between the surface layer of the particle and the surrounding fluid. Knowledge of the zeta potential can be used in the preparation of the desired suspensions, which can reduce the time in the preparation of test substances and can also serve to predict the long-term stability of solutions. Zeta potential measurement is one of the simplest and most direct methods for characterizing the surface of charged colloidal systems. Knowledge of the value of the zeta potential, but also knowledge of the parameters that affect it, allows us to purposefully influence the stability of colloidal systems. This is crucial in many fields, such as construction [1,2,3], water treatment [4,5], pigment production [6,7], mineral processing [8,9], beverage production [10,11], and many more. Zeta potential is measured indirectly; in most cases, electrophoretic mobility is measured. The electrokinetic potential is affected by a number of quantities. The most important of these is the surface charge [12,13]. The determination of the zeta potential value is always linked to the pH of the aqueous medium [14,15,16,17]. Other parameters that affect the zeta potential of the particles include temperature [14,15,18], ionic strength [15], presence and valence of other ions in solution, presence of other substances such as surfactants [19,20,21], weight fraction of particles in dispersion [18], method of treatment such as sonication [19], and more. From the above, it is clear that measuring the zeta potential requires precise knowledge of all ambient conditions and can be quite time-consuming. For this reason, ways are being sought to at least partially replace the experiment with mathematical modelling.
Artificial neural networks have also been used in the natural sciences for several decades [22,23,24]. Artificial neural networks are used in the field of colloid chemistry to predict stability [25], thermal conductivity [26,27], viscosity [26], particle size [28], density [27], zeta potential [25,29,30,31,32,33,34], and also ophthalmic flexible nano-liposomes [35]. Other modelling methods, Monte Carlo [36], models based on DLVO theory [37], multi regression analysis [34,38], molecular simulations [12], and others [39] are used to predict the zeta potential.
When using artificial neural networks, the variables that have the greatest influence on the value of the zeta potential are most often used as inputs. The number of these inputs varies from two to five. There is almost always a pH between the inputs [25,29,30,34], then the ionic strength [30,34], temperature [25], valence of ions in solution [30,31,34], mass fraction of solid phase [25], concentration [28,33], particle size [29] appear.
One of the important areas in which zeta potential prediction can be useful is dispersions in which nanoparticles are present. In many areas, it is desirable to avoid agglomeration and to keep the dispersion stable. There are also fields in which, on the contrary, coagulation brings benefits, such as water purification or water treatment. It is the zeta potential that plays a key role in the stability of such systems. One of the most produced nanomaterials is titanium dioxide. The dependence of the zeta potential of TiO2 on the pH of the solution, but also the influence of other parameters, is the subject of a number of studies [16,36,40,41,42].
The aim of this work was to use experimental data for the construction and testing of an artificial neural network, and then use this network to predict the zeta potential of titanium dioxide nanoparticles in an environment that will be characterized by specific values of pH, temperature, ionic strength, and mass content of titanium dioxide in suspension.

2. Proposal for Experiments

This chapter is divided into two main parts. The first part is devoted to the experimental determination of the zeta potential of titanium dioxide. The measurement took place under different conditions, the influence of pH, temperature, solid phase concentration and ionic strength was monitored. The obtained data were subsequently used for the construction and testing of neural networks. Experimental conditions are described in detail in both sections.

2.1. Materials

Nanoparticle oxide TiO2 was used as the commercial product purchased from Sigma Aldrich (Burlington, MA, USA). The size of particles was under 100 nm and the specific surface area was 58 m2 g−1. All other used chemicals (NaOH, HCl, etc.) were of the highest purity grade available from commercial sources.

2.2. Zeta Potential Measurements

All zeta potential measurements were performed on a Zetasizer Nano ZS (Malvern Instruments Ltd., Great Malvern, UK). A total of four variables were monitored. The effect of pH was monitored from 2 to 12, i.e., a total of 11 discrete values. Another parameter was temperature, the following values were monitored: 20 °C, 30 °C, 40 °C, 50 °C and 60 °C. The measurement was performed in a potassium chloride solution having molar concentrations: 1 mol L−1, 0.3 mol L−1, 0.1 mol L−1, 0.03 mol L−1 and 0.01 mol L−1. The last variable was the content of nanoparticles in the solution, specific values were: 10 mg L−1, 50 mg L−1, 100 mg L−1, 250 mg L−1, and 500 mg L−1. The total number of measurements was therefore: 11 × 5 × 5 × 5 = 1375, the value of the zeta potential that was further worked on was the average of three measurements. Suspensions were prepared in flasks and the pH was adjusted with hydrochloric acid and sodium hydroxide. The flasks were placed in a tempered bath at the appropriate temperature. The pH was regularly checked and adjusted as needed. After 24 h, the flasks were placed in an ultrasonic bath and sonicated for 5 min. A sample was pipetted into the measuring cuvette, which was then placed back in the ultrasonic bath for one minute. Subsequently, the cuvette was inserted into the measuring space, the measurement conditions, including the temperature, were set and the zeta potential was measured.
Zetasizer Nano ZS uses Laser Doppler Velocimetry to determine electrophoretic mobility:
μ e = V E
where μe is electrophoretic mobility (μm cm V−1 s−1), V is particle velocity (μm s−1) and E is electric strength (V cm−1).
The zeta potential can be calculated from the μe by the Henry equation:
ζ = 3 · μ e · η 2 ε r · ε 0 · F ( κ r )
where εr is relative permittivity, ε0 is permittivity of vacuum, ζ is zeta potential (mV), F(κr) is Henry’s function, and η is viscosity (cP) of liquid medium at experimental temperature. Henry’s function includes κ, co-called Debye–Hückel parameter (or reciprocal double layer thickness) and r, which is the hydrodynamic radius of particles.
Debye–Hückel parameter is calculated by:
κ = ( 2000 · F 2 ε r · ε 0 · R · T ) 1 2 · I
where F is Faraday constant, R is gas constant (J mol−1 K−1), T temperature (K), I is ionic strength (mol L−1).
Ionic strength is calculated by:
I = 1 2 i = 1 n c i · z i 2
where ci is molar concentration of ion i (mol L−1) and zi is the charge number of that ion.
From the above equations, it is clear that the value of the zeta potential is influenced by environmental factors, but also by the method of measurement and instrument settings, respectively. The composition of the electrolyte affects the zeta potential to a large extent, on the one hand by adsorption and, on the other, by compressing the electric double layer. Adsorption of the mainly highly mobile ions H+ and OH occurs on the surface of the particles; we are talking here about the effect of pH, which is absolutely essential for the zeta potential. With a higher concentration of ions and also with their higher valence, the ionic strength increases (Equation (4)). The ionic force directly affects the thickness of the electric bilayer: the higher the ionic strength, the thinner the bilayer (Equation (3)). The ions present in the solution act on the electric bilayer and compress it. The size of the thickness of the electric bilayer then affects the value of the hydrodynamic diameter of the particle and thus Henry’s function. Henry’s function takes values from 1.0 to 1.5. The value 1.5 holds if the product κr approaches infinity (infinitely thin double layer), we call it Smoluchowski approximation. The value of 1.0 of Henry’s function is called the Hückel approximation. In this case, the product κr is close to zero (infinitely thick double layer). It is clear from Equation (3) that the temperature also has an effect on the Debye–Hückel parameter. The influence of ionic strength and temperature should be taken into account when setting up the instrument (Zetasizer Nano ZS), so that the electrophoretic mobility is converted to a zeta potential according to the correct approximation. When converting electrophoretic mobility to zeta potential, the value of disperse viscosity also has an effect. This may be partially affected by the presence of a large number of nanoparticles (high concentration). At high concentrations of nanoparticles, the optical conditions of the dispersion that the laser beam passes through during measurement also change.

2.3. Proposal of an Artificial Neural Network Architecture for Prediction

In order to predict the zeta potential, our research took advantage of a multi-layer neural network with an adaptation algorithm—backpropagation. In the experiments, we used a network architecture with a 17–12–1 topology (i.e., 17 input, 12 hidden, and 1 output neuron), see Figure 1. The neurons in the given layer were not interconnected, but the neighboring layers were completely interconnected (i.e., the input and hidden layer, hidden and output layer). The architecture of the neural network should match the complexity of the problem to be solved: the number of training patterns, their inputs and outputs, and the structure of the relationships they describe. Obviously, a small network cannot solve a complicated problem. On the other hand, while a rich architecture will often allow the finding of the global minimum of the error function during learning, the computational complexity of adaptation increases with more weights. Thus, it is clear that there is an optimal topology that is rich enough to be able to solve a given problem and not too large to correctly generalize the necessary relationships between inputs and outputs. Basic heuristics for determining the maximum number of neurons in the hidden layers of a neural network can be found, for example, in [43], which is considered to be one of the best practice-oriented books. We used this publication [43] in determining the number of hidden neurons.
Prior to creating a training and testing set, 1375 samples were measured. In the case of quantities T, I, c, the data were measured only in discrete values. The training set then contained 80% of randomly selected samples, i.e., 1100 samples. The significance of neurons in the input layer corresponds to the components of the input vector of the training set, which is described in detail in Table 1. The input vector of the training set contained 17 values. It is described in detail in Table 1 and shown in Figure 1. Two components pH and 1-pH of an input vector are a guarantee that equal emphasis is placed on each value, because the backpropagation algorithm usually has a tendency to put less emphasis on inputs near zero. The neural network output is a value of the zeta potential (Zeta_NN), ranging in the interval [−1, 1]. These values were transformed for the needs of the neural network and then converted back to real values in the interval [−60, 70].
The neural network was adapted by the backpropagation method [44] with the following parameters:
  • Activation function is the hyperbolic tangent;
  • Learning coefficient α = 0.3 for the first 5000 learning cycles, then it decreases to α = 0.2 ;
  • Momentum μ = 0 .

3. Results and Discussions

The third chapter is again divided into two parts. The first part presents the results of experimental monitoring of the zeta potential of titanium dioxide nanoparticles. The effects of pH, temperature, nanoparticle content, and ionic strength are discussed. The results are compared with the literature. The second part presents the results of neural network testing, mainly in the form of regression statistics.

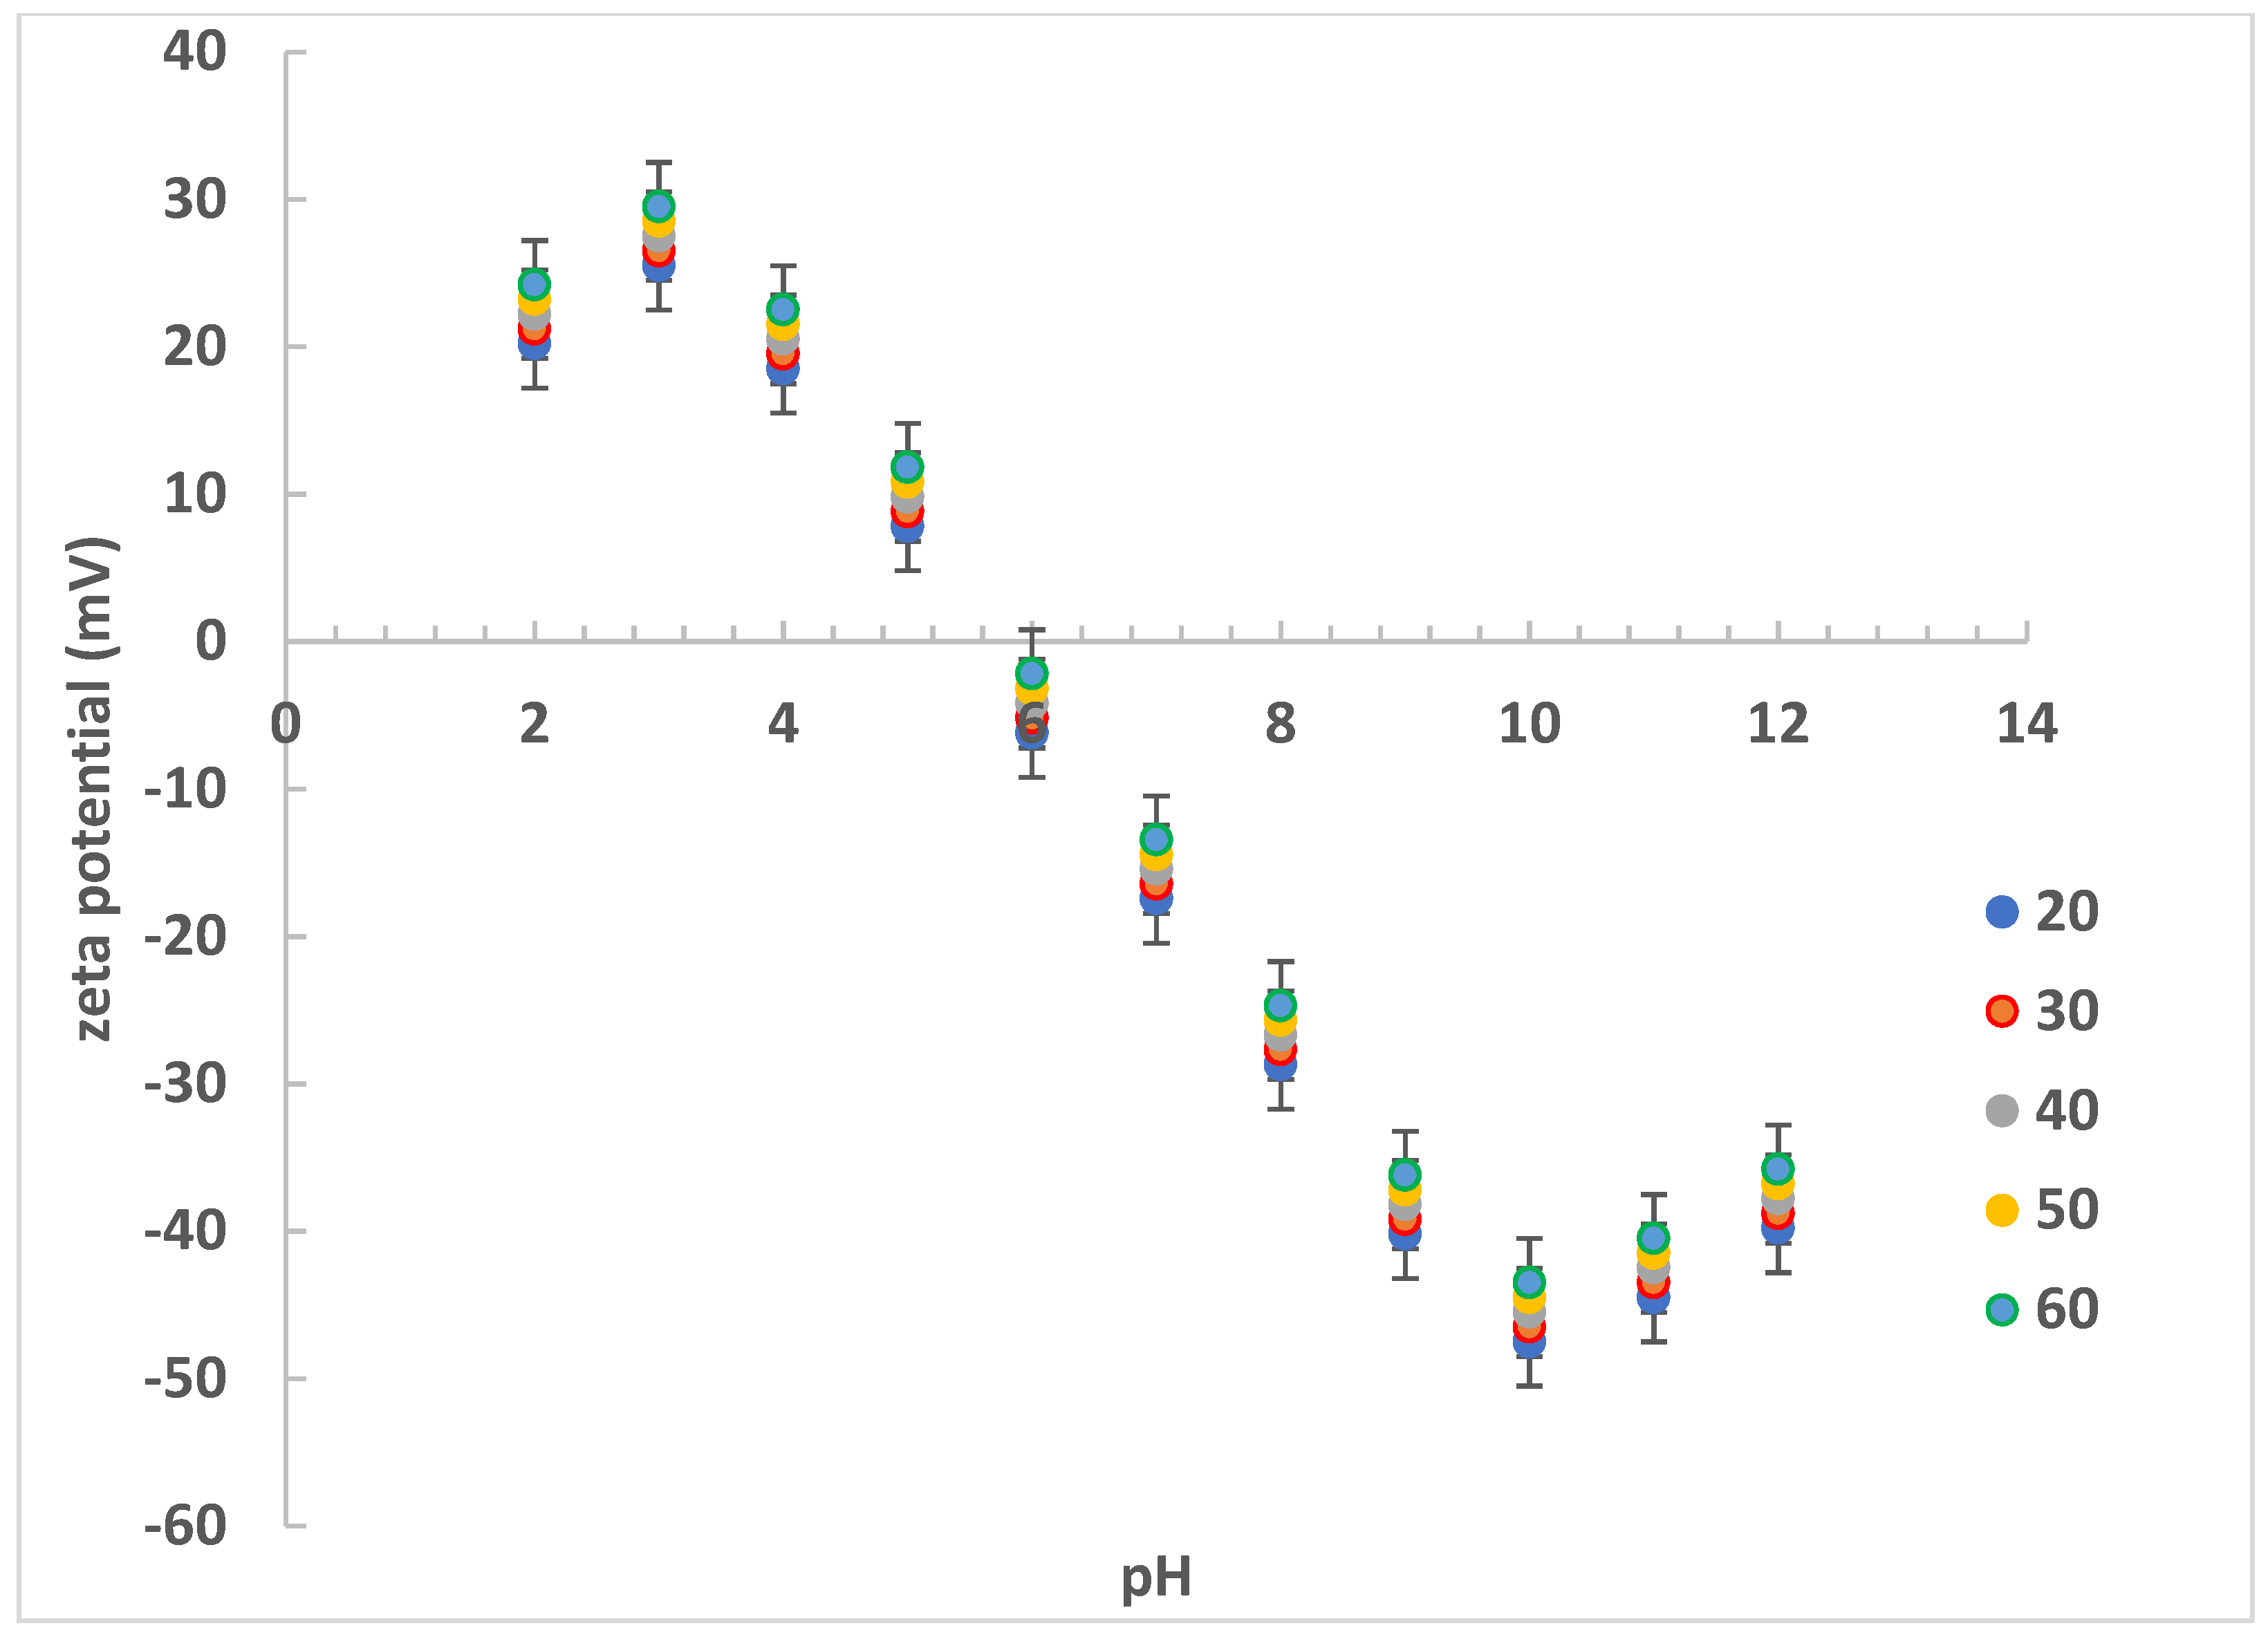
3.1. Experimental Zeta Potential

In evaluating the experimental values, we based our evaluation on the well-known fact that pH values have the greatest influence on the zeta potential. Figure 2, Figure 3 and Figure 4 always show the effect of pH on the zeta potential, while the effect of another variable, i.e., temperature, ionic strength, or nanoparticle concentration, is observed. Figure 2 shows the effect of nanoparticle content in the dispersion. For the other two variables, mean values were selected from the measured range—in this case, temperature 40 °C and ionic strength 0.01 mol L−1.
The effect of the content of nanoparticles in the dispersion appears to be negligible in the given range used. No significant differences were found, either at other temperature levels or at other values of ionic strength. The value of the isoelectric point (IEP) is around the pH value of 5.8 and the change in the concentration of nanoparticles did not fundamentally change the IEP. In some works, the effect of nanoparticle concentration on the zeta potential is described [41,42]. The authors describe a more significant effect at lower concentrations, the simultaneous effect of ionic strength is also mentioned. One of the reasons why different values are measured is the specific adsorption of HCO3 on the surface of nanoparticles and thus the shift of the charge towards negative values. From a physical point of view, there is no reason for the same particles, under the same conditions, to have different values of the zeta potential simply because their number in the dispersion differs. With this parameter, it is therefore necessary to take into the account the very essence on which the measurement of electrophoretic mobility is based.
Temperature affects a number, if not all, of the quantities that affect the zeta potential. Temperature as a variable appears directly in the equation for calculating the Debye–Hückel parameter (Equation (3)). The dependence of the zeta potential on pH at different temperatures is shown in Figure 3.
Temperature affected the zeta potential more significantly compared with the content of nanoparticles in the dispersion. The temperature effect was approximately the same at all pH values. With higher temperature, the value of the zeta potential increased, as a result of which, the isoelectric point also shifted. For a temperature of 20 °C, the IEP value was pH 5.8; at the highest temperature, the IEP value increased slightly to a value of approximately 5.95. This change in IEP cannot be considered significant. Temperature affects the viscosity: with increasing temperature, the viscosity decreases, and, if the correct value is not fitted to (Equation (1)), an incorrect value of electrophoretic mobility, and thus zeta potential, may be found (Equation (2)). As the temperature rises, the pH decreases, the equilibrium in the autoprotolytic reaction of water changes. Although the pH value was maintained at a constant value, a small change in the final preparation of the sample for the measurement, and in the measurement itself, cannot be ruled out. In the literature, the effect of temperature is considered negligible, or the zeta potential increases with increasing temperature, but only under certain, specific conditions [14,15,18].
Similar to temperature, the ionic strength also has an immediate effect on the value of the hydrodynamic diameter of the particle (Equation (2)). Electrolyte ions can adsorb on the surface of the particle and alter the zeta potential in this way. If this does not happen, the ionic strength should not have a direct effect on the zeta potential. Incorrect values can be obtained by choosing the wrong approximation, not taking into the account the thickness of the electrical bilayer. The effect of ionic strength on the zeta potential is shown in Figure 4.
The effect of ionic strength is practically negligible in the region of the isoelectric point. In the extreme regions of pH, the effect of ionic strength is more significant, the most likely explanation is an increase in surface charge density or compression of the double layer [12,14]. When assessing the influence of individual parameters, the other two were always at a constant value. Some tools of mathematical modelling were used to comprehensively assess the influence of all variables. The aim is to capture the synergistic/antagonistic effect of pH, temperature, concentration, and ionic strength on the zeta potential of titanium dioxide nanoparticles.

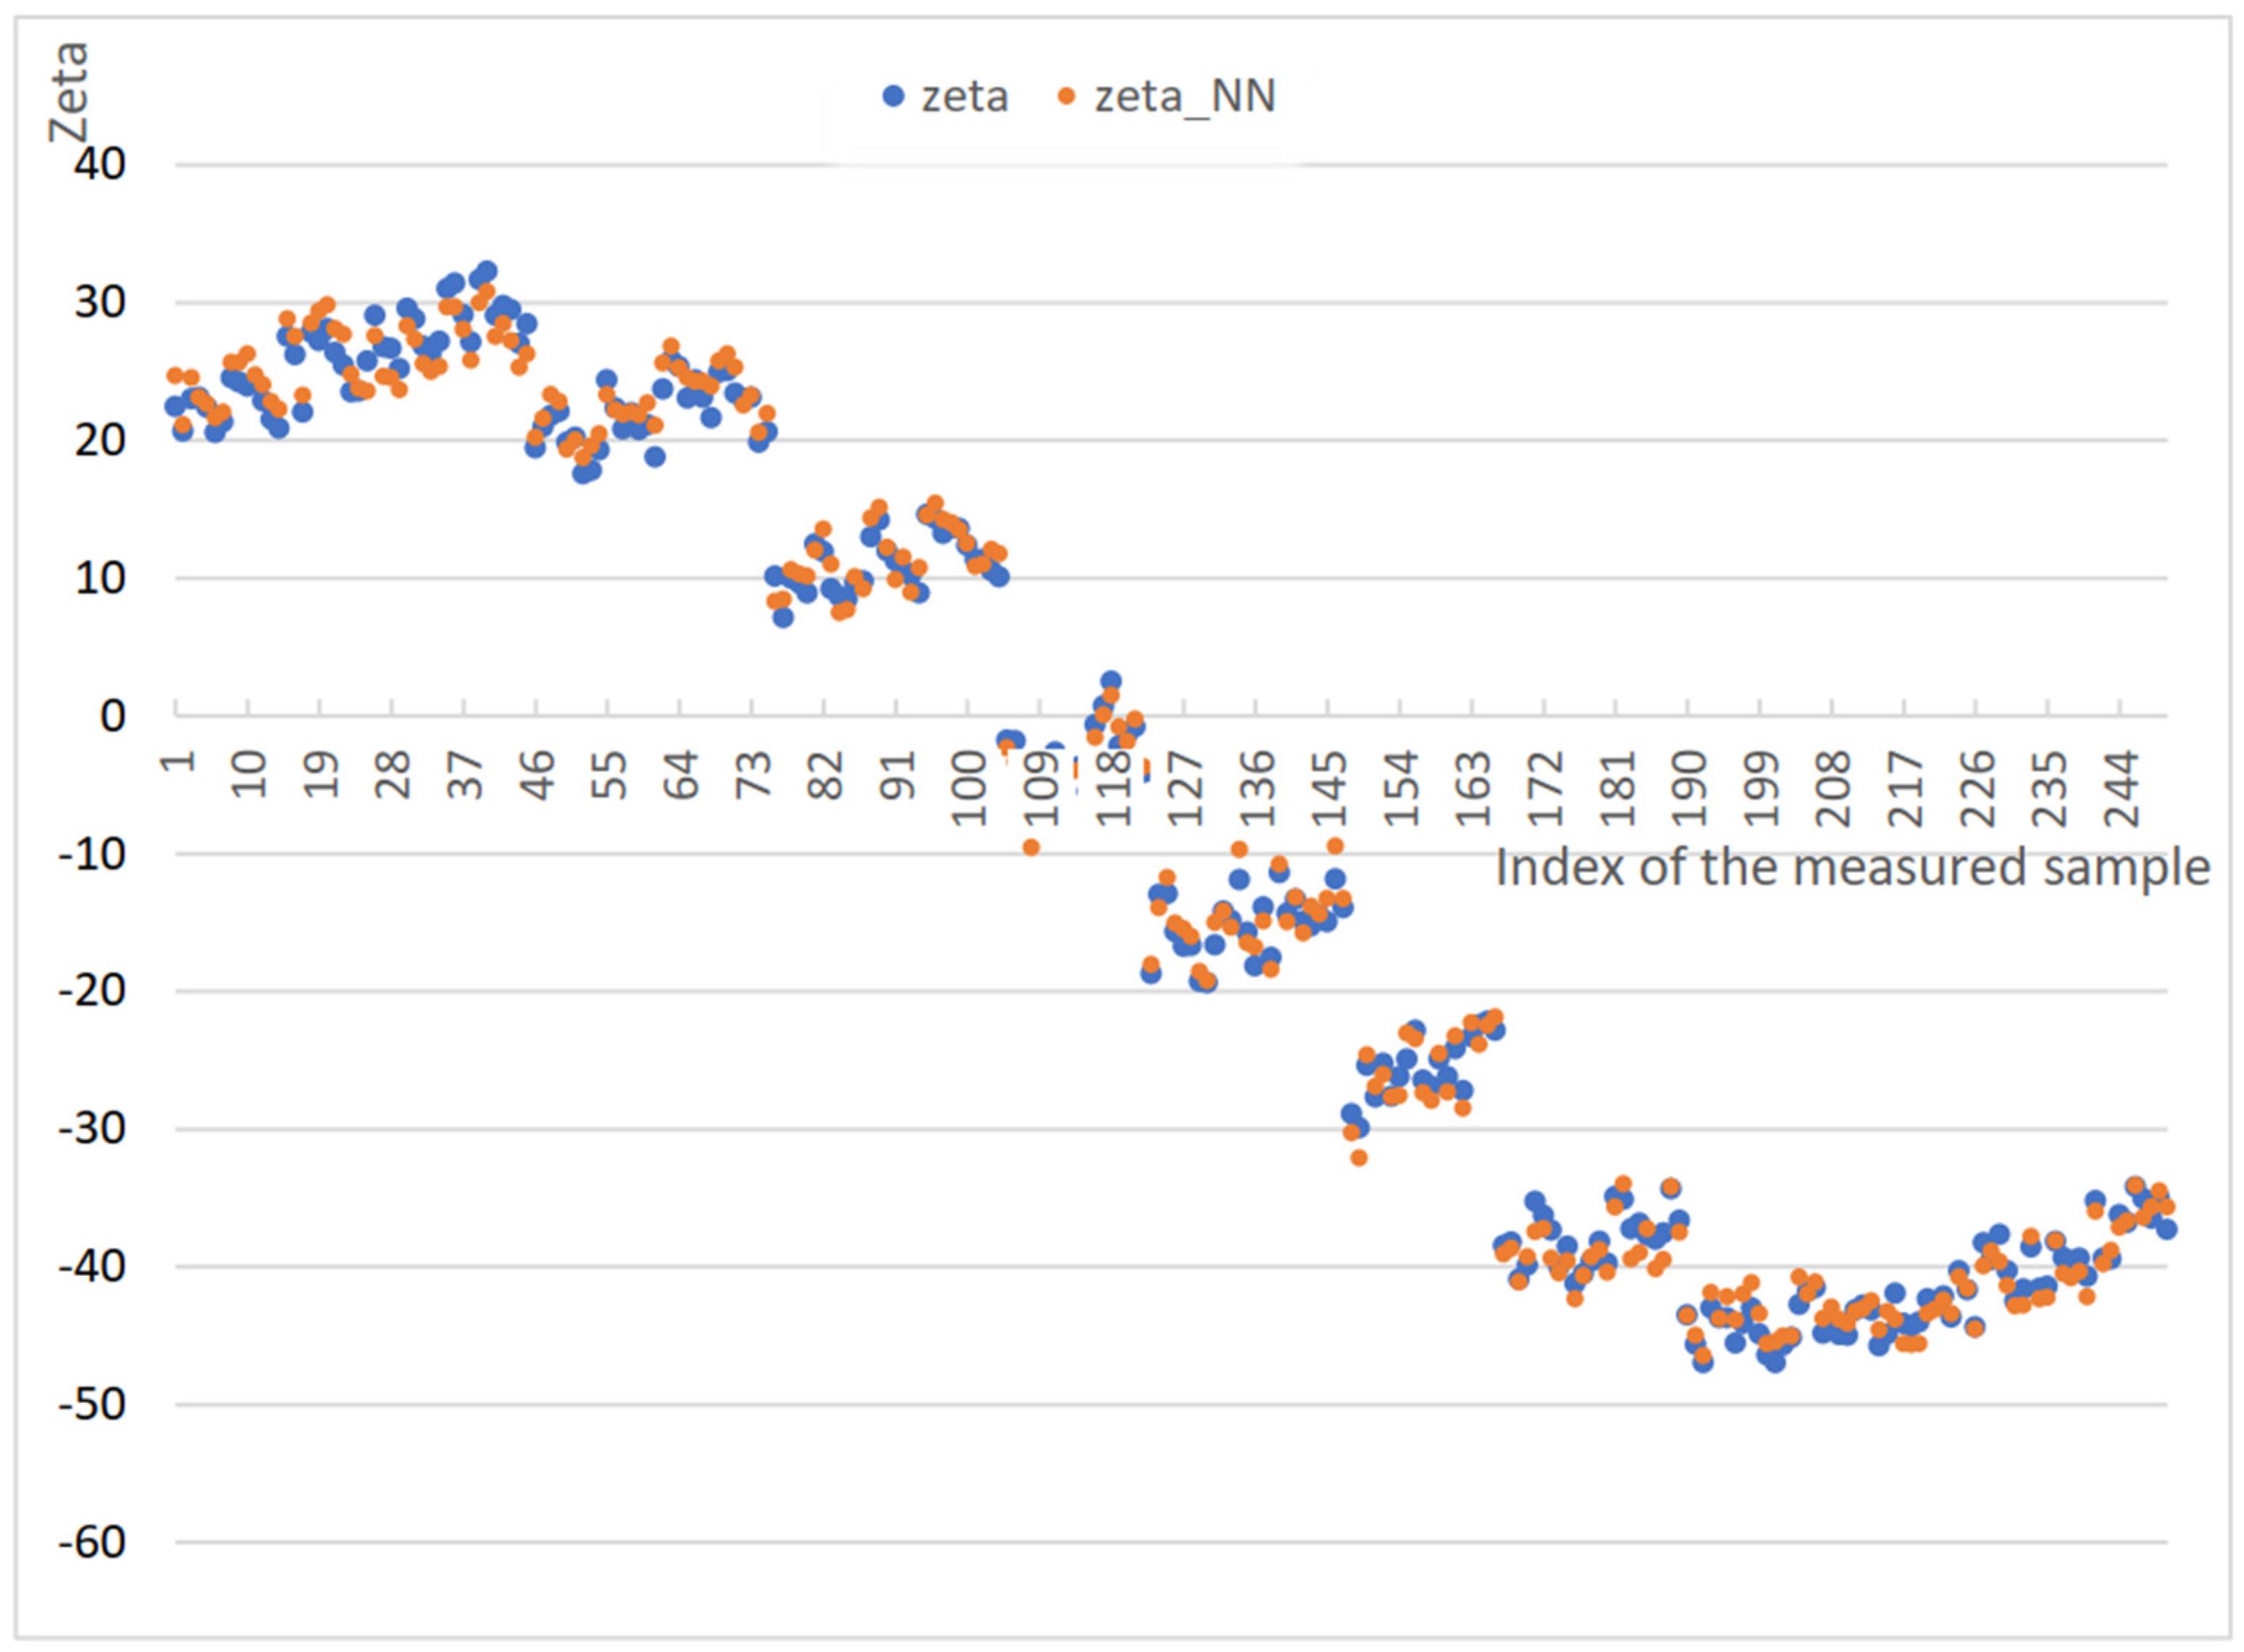
3.2. Artificial Neural Network

In order to create the test set, we used n = 250 randomly selected samples out of the total number of 1375 measured samples. Figure 5 and Figure 6 show the neural network outputs. Figure 5 graphically depicts experimental outputs of the neural network prediction of the zeta potential values (zeta_NN) and measured zeta potential values (zeta). The x axis shows the sample number that was randomly selected. Figure 6 graphically depicts experimental outputs of the neural network prediction of the zeta potential values (vertical axis: Zeta_NN) and measured zeta potential values (horizontal axis: Zeta).
The black dotted line (Figure 6) depicts the linear dependence line of Z e t a _ N N = ( Z e t a _ N N 1 , Z e t a _ N N 2 , ,   Z e t a _ N N n ) , whose equation is (5). The value is 1.005149. This value is a point estimation of the regression coefficient. More accurate, however, is the interval estimation determining that the direction ranges between 0.999724363 and 1.010574 with a 95% confidence.
Z e t a _ N N i = 0.101 + 1.0051 · Z e t a i  
The confidence value R2 is then the determination coefficient (6), i.e., the second power of the correlation coefficient R. The value of R2 is greater the larger the regressor (Zeta) the greater the variability of the dependent variable (Zeta_NN).
  R 2 = 1 S r e z S y y
where S r e z is the sum of squares of data deviations from mean y ¯ ( y i represents the regression estimate of the i-th observation)
  S r e z = i = 1 n ( y i y i ) 2
and
  S y y = i = 1 n ( y i y ¯ ) 2
The experimental outputs from the neural network on the test set, which contained 250 randomly selected samples, are presented in Table 2 and Table 3. Table 2 presents values that characterize the linear regression (Figure 6). The correlation coefficient is R = 0.99907 and the confidence value is R2 = 0.998141. Both of these values are close to one and indicate a strong linear dependence between the Zeta_NN and Zeta variables. Thus, it can be said that the proposed neural network captures the data 99.8%.
Table 3 represents the ANOVA table, in which is the result of testing hypothesis H0: all regression coefficients except the absolute term are zero, i.e., the value of the independent variable has no effect on the value of the dependent variable. Here, we test the statistical significance of the coefficients of the neural network model as a whole (the null hypothesis that all regression coefficients except the absolute term are zero is tested). If the F-significance value is less than the chosen significance level (0.05 in our case), then the model is significant. In our case, this value is close to zero, therefore the proposed neural model is significant and reflects the real data. For this purpose, we used the ANOVA (analysis of variance) test available in Excel.

4. Comparison with Other Academic Works

Table 4 presents a comparison with other academic works. It should be noted here that the comparison aims to show that artificial neural network models are used to predict the same or similar parameters as TiO2. Each of the mentioned approaches [19,30,32,34] can be used for zeta potential prediction, however it always depends on the training data set that is available. The comparison shows that the construction of our neural network model (from available training data) for the zeta potential prediction shows the best results. The authors of these works used various neural network models for various or similar parameters predictions: MLP represents Multi-Layer Perceptron, SVM represents Support Vector Machines, and GRNN represents General Regression Neural Network.

5. Conclusions

Due to time and technical reasons, it is not possible to experimentally measure the investigated quantity under all conditions. This problem affects many industries, such as mineral processing, pigment production, construction, pharmaceuticals, and many others. Wherever colloidal suspensions are prepared, it is very important to evaluate their stability. The quantity that makes this possible is the zeta potential. Predicting zeta potential can save time and money. In practice, therefore, mathematical-statistical methods are used, which serve to estimate the physical quantity. One of the tools is also artificial neural networks, which were also used in this work and the authors have rich experiences with neural networks applications within different research fields. The designed and tested artificial neural network was able to estimate with great reliability the values of the zeta potential of a suspension of titanium dioxide nanoparticles, affecting the influence of four variables: temperature, ionic strength, mass content of titanium dioxide nanoparticles, and especially pH. The advantage of using the artificial neural network is the determination of zeta potential values “between” the values that were experimentally determined with high reliability. This means that the main feature when using a neural network is the ability to generalize. Thus, the neural network is able to predict beyond the specified and realistically verified range of values that were used to learn of the network. For example, for prediction with NN, we can enter a temperature value of 26 degrees Celsius, which was not actually measured, but the neural network predicts it very accurately. Our artificial neural network designed works with the following statistical parameters: topology is 17–12–1, activation function is the hyperbolic tangent, learning coefficient α = 0.2–0.3, and momentum μ = 0. It was concluded that such a created artificial neural network model exhibited high performance. No prediction is one hundred percent successful, and even methods of artificial neural networks hit to their limits. The main shortcoming of the use of NN is the process of learning the neural network, it is very poorly predicted beyond the extreme limits of our values, from which NN was learned, because there will be a higher prediction error.

6. Highlights

  • The artificial neural network is a good tool for predicting the zeta potential of nanoparticles;
  • The use of an artificial neural network allows for the determination of zeta potential values also for such conditions that cannot be realized;
  • Prediction of zeta potential using an artificial neural network can save time and resources.

Author Contributions

Conceptualization, R.M. and E.V.; methodology, M.K. and E.V.; software, R.J.; validation, R.J., E.V., R.M and M.K.; data curation, R.M.; writing—original draft preparation, E.V.; R.M., R.J. and M.K.; writing—review and editing, E.V., M.K.; visualization, R.J.; All authors have read and agreed to the published version of the manuscript.

Funding

This works was supported by University of Ostrava grants SGS16/PrF/2021 and SGS09/PrF/2021.

Conflicts of Interest

The authors declare no conflict of interest.

References

  1. Liu, Q.; Chen, Z.; Yang, Y. Study of the Air-Entraining Behavior Based on the Interactions between Cement Particles and Selected Cationic, Anionic and Nonionic Surfactants. Materials 2020, 13, 3514. [Google Scholar] [CrossRef]
  2. Ferrari, L.; Kaufmann, J.; Winnefeld, F.; Plank, J. Interaction of cement model systems with superplasticizers investigated by atomic force microscopy, zeta potential, and adsorption measurements. J. Colloid Interface Sci. 2010, 347, 15–24. [Google Scholar] [CrossRef]
  3. Plank, J.; Hirsch, C. Impact of zeta potential of early cement hydration phases on superplasticizer adsorption. Cem. Concr. Res. 2007, 37, 537–542. [Google Scholar] [CrossRef]
  4. Morfesis, A.; Jacobson, A.M.; Frollini, R.; Helgeson, M.; Billica, J.; Gertig, K.R. Role of Zeta (ζ) Potential in the Optimization of Water Treatment Facility Operations. Ind. Eng. Chem. Res. 2009, 48, 2305–2308. [Google Scholar] [CrossRef]
  5. Fazullin, D.D.; Mavrin, G.V.; Shaikhiev, I.G. Particle Size and Zeta Potential Changes in the Disperse Phase of Water-Emulsified Waste Waters in Different Treatment Stages. Chem. Technol. Fuels Oils 2015, 51, 501–505. [Google Scholar] [CrossRef]
  6. Fang, K.; Gao, H.; Sun, F.; Chen, W.; Xie, R.; Cai, Y. Effect of glass transition temperatures and zeta potentials of cationic copolymer latexes on pigment dyeing. Fibers Polym. 2017, 18, 2255–2260. [Google Scholar] [CrossRef]
  7. Abidi, N.; Semhi, K.; Trabelsi-Ayadi, M. Removal of anionic dye from textile industries’ effluents by using Tunisian clays as adsorbents. Ζeta potential and streaming-induced potential measurements. Comptes Rendus Chim. 2019, 22, 113–125. [Google Scholar] [CrossRef]
  8. Fuerstenau, D.W. Zeta potentials in the flotation of oxide and silicate minerals. Adv. Colloid Interface Sci. 2005, 114, 9–26. [Google Scholar] [CrossRef] [PubMed]
  9. Multani, R.S.; Williams, H.; Johnson, B.; Li, R.; Waters, K.E. The effect of superstructure on the zeta potential, xanthate adsorption, and flotation response of pyrrhotite. Colloids Surf. A Physicochem. Eng. Asp. 2018, 551, 108–116. [Google Scholar] [CrossRef]
  10. Speers, R.A.; Durance, T.D.; Tung, M.A.; Tou, J. Colloidal properties of flocculent and nonflocculent brewing yeast suspensions. Biotechnol. Prog. 1993, 9, 267–272. [Google Scholar] [CrossRef]
  11. Li, J.; Joung, H.J.; Lee, I.W.; Chen, X.; Park, H.J. The influence of different water types and brewing durations on the colloidal properties of green tea infusion. Int. J. Food Sci. Technol. 2015, 50, 2483–2489. [Google Scholar] [CrossRef]
  12. Biriukov, D.; Fibich, P.; Předota, M. Zeta Potential Determination from Molecular Simulations. J. Phys. Chem. C 2020, 124, 3159–3170. [Google Scholar] [CrossRef]
  13. Ovanesyan, Z.; Aljzmi, A.; Almusaynid, M.; Khan, A.; Valderrama, E.; Nash, K.L.; Marucho, M. Ion–ion correlation, solvent excluded volume and pH effects on physicochemical properties of spherical oxide nanoparticles. J. Colloid Interface Sci. 2016, 462, 325–333. [Google Scholar] [CrossRef] [PubMed] [Green Version]
  14. Vinogradov, J.; Jackson, M.D.; Chamerois, M. Zeta potential in sandpacks: Effect of temperature, electrolyte pH, ionic strength and divalent cations. Colloids Surf. A Physicochem. Eng. Asp. 2018, 553, 259–271. [Google Scholar] [CrossRef]
  15. Liu, X.; Mäki-Arvela, P.; Aho, A.; Vajglova, Z.; Gun’ko, V.M.; Heinmaa, I.; Kumar, N.; Eränen, K.; Salmi, T.; Murzin, D.Y. Zeta Potential of Beta Zeolites: Influence of Structure, Acidity, pH, Temperature and Concentration. Molecules 2018, 23, 946. [Google Scholar] [CrossRef] [Green Version]
  16. Shih, Y.H.; Liu, W.S.; Su, Y.F. Aggregation of stabilized TiO2 nanoparticle suspensions in the presence of inorganic ions. Environ. Toxicol. Chem. 2012, 31, 1693–1698. [Google Scholar] [CrossRef]
  17. Marsalek, R. Particle Size and Zeta Potential of ZnO. APCBEE Procedia 2014, 9, 13–17. [Google Scholar] [CrossRef] [Green Version]
  18. Suganthi, K.S.; Rajan, K.S. Temperature induced changes in ZnO–water nanofluid: Zeta potential, size distribution and viscosity profiles. Int. J. Heat Mass Transf. 2012, 55, 7969–7980. [Google Scholar] [CrossRef]
  19. Asadi, A.; Asadi, M.; Siahmargoi, M.; Asadi, T.; Andarati, M.G. The effect of surfactant and sonication time on the stability and thermal conductivity of water-based nanofluid containing Mg(OH)2 nanoparticles: An experimental investigation. Int. J. Heat Mass Transf. 2017, 108, 191–198. [Google Scholar] [CrossRef]
  20. Mucha, M.; Maršálek, R.; Bukáčková, M.; Zelenková, G. Interaction among clays and bovine serum albumin. RSC Adv. 2020, 10, 43927–43939. [Google Scholar] [CrossRef]
  21. Marsalek, R.; Pospisil, J.; Taraba, B. The influence of temperature on the adsorption of CTAB on coals. Colloids Surf. A Physicochem. Eng. Asp. 2011, 383, 80–85. [Google Scholar] [CrossRef]
  22. Peterson, K.L. Artificial Neural Networks and Their use in Chemistry. In Reviews in Computational Chemistry; John Wiley & Sons, Inc.: Hoboken, NJ, USA, 2007; pp. 53–140. [Google Scholar]
  23. Duch, W.; Diercksen, G.H.F. Neural networks as tools to solve problems in physics and chemistry. Comput. Phys. Commun. 1994, 82, 91–103. [Google Scholar] [CrossRef]
  24. Zupan, J.; Novič, M.; Ruisánchez, I. Kohonen and counterpropagation artificial neural networks in analytical chemistry. Chemom. Intell. Lab. Syst. 1997, 38, 1–23. [Google Scholar] [CrossRef]
  25. Kazemi-Beydokhti, A.; Azizi Namaghi, H.; Asgarkhani, H.; Zeinali Heris, S. Prediction of stability and thermal conductivity of sno2nanofluid via statistical method and an artificial neural network. Braz. J. Chem. Eng. 2015, 32, 903–917. [Google Scholar] [CrossRef] [Green Version]
  26. Karimipour, A.; Ghasemi, S.; Darvanjooghi, M.H.K.; Abdollahi, A. A new correlation for estimating the thermal conductivity and dynamic viscosity of CuO/liquid paraffin nanofluid using neural network method. Int. Commun. Heat Mass Transf. 2018, 92, 90–99. [Google Scholar] [CrossRef]
  27. Kannaiyan, S.; Boobalan, C.; Nagarajan, F.C.; Sivaraman, S. Modeling of thermal conductivity and density of alumina/silica in water hybrid nanocolloid by the application of Artificial Neural Networks. Chin. J. Chem. Eng. 2019, 27, 726–736. [Google Scholar] [CrossRef]
  28. Hashad, R.A.; Ishak, R.A.H.; Fahmy, S.; Mansour, S.; Geneidi, A.S. Chitosan-tripolyphosphate nanoparticles: Optimization of formulation parameters for improving process yield at a novel pH using artificial neural networks. Int. J. Biol. Macromol. 2016, 86, 50–58. [Google Scholar] [CrossRef]
  29. Tekeli, F.N. Application of artificial neural networks for Zeta potential of copolymer. Bulg. Chem. Commun. 2017, 49, 146–150. [Google Scholar]
  30. Yukselen, Y.; Erzin, Y. Artificial neural networks approach for zeta potential of Montmorillonite in the presence of different cations. Environ. Geol. 2008, 54, 1059–1066. [Google Scholar] [CrossRef]
  31. Asadi, A.; Moayedi, H.; Huat, B.B.; Boroujeni, F.Z.; Parsaie, A.; Sojoudi, S. Prediction of Zeta Potential for Tropical Peat in the presence of different Cations using Artificial Neural Networks. Int. J. Electrochem. Sci. 2011, 6, 1146–1158. [Google Scholar]
  32. Li, H.; Chen, F.; Cheng, K.; Zhao, Z.; Yang, D. Prediction of Zeta Potential of Decomposed Peat via Machine Learning: Comparative Study of Support Vector Machine and Artificial Neural Networks. Int. J. Electrochem. Sci. 2015, 10, 6044–6056. [Google Scholar]
  33. Imanparast, F.; Faramarzi, M.A.; Paknejad, M.; Kobarfard, F.; Amani, A.; Doosti, M. Preparation, optimization, and characterization of simvastatin nanoparticles by electrospraying: An artificial neural networks study. J. Appl. Polym. Sci. 2016, 133, 43602. [Google Scholar] [CrossRef]
  34. Erzin, Y.; Yukselen, Y. The Use of Neural Networks for the Prediction of Zeta Potential of Kaolinite. Math. Geosci. 2009, 41, 779–797. [Google Scholar] [CrossRef]
  35. Zhao, F.; Lu, J.; Jin, X.; Wang, Z.; Sun, Y.; Gao, D.; Li, X.; Liu, R. Comparison of response surface methodology and artificial neural network to optimize novel ophthalmic flexible nano-liposomes: Characterization, evaluation, in vivo pharmacokinetics and molecular dynamics simulation. Colloids Surf. B Biointerfaces 2018, 172, 288–297. [Google Scholar] [CrossRef]
  36. Liu, H.H.; Lanphere, J.; Walker, S.; Cohen, Y. Effect of hydration repulsion on nanoparticle agglomeration evaluated via a constant number Monte–Carlo simulation. Nanotechnology 2015, 26, 045708. [Google Scholar] [CrossRef] [PubMed]
  37. Bouhaik, I.S.; Leroy, P.; Ollivier, P.; Azaroual, M.; Mercury, L. Influence of surface conductivity on the apparent zeta potential of TiO2 nanoparticles: Application to the modeling of their aggregation kinetics. J. Colloid Interface Sci. 2013, 406, 75–85. [Google Scholar] [CrossRef] [Green Version]
  38. Bukackova, M.; Rusnok, P.; Marsalek, R. Mathematical Methods in the Calculation of the Zeta Potential of BSA. J. Solut. Chem. 2018, 47, 1942–1952. [Google Scholar] [CrossRef]
  39. Jiang, Y.; Sulgani, M.T.; Ranjbarzadeh, R.; Karimipour, A.; Nguyen, T.K. Hybrid GMDH-type neural network to predict fluid surface tension, shear stress, dynamic viscosity & sensitivity analysis based on empirical data of iron(II) oxide nanoparticles in light crude oil mixture. Phys. A Stat. Mech. Its Appl. 2019, 526, 120948. [Google Scholar]
  40. Hasani Bijarbooneh, F.; Zhao, Y.; Kim, J.H.; Sun, Z.; Malgras, V.; Aboutalebi, S.H.; Heo, Y.U.; Ikegami, M.; Dou, S.X. Aqueous Colloidal Stability Evaluated by Zeta Potential Measurement and Resultant TiO2 for Superior Photovoltaic Performance. J. Am. Ceram. Soc. 2013, 96, 2636–2643. [Google Scholar] [CrossRef]
  41. Gómez-Merino, A.I.; Rubio-Hernández, F.J.; Velázquez-Navarro, J.F.; Aguiar, J. Assessment of ζ-potential in TiO2 aqueous suspensions: A comparative study based on thermodynamic and rheological methods. Ceram. Int. 2015, 41, 5331–5340. [Google Scholar] [CrossRef]
  42. Wang, N.; Hsu, C.; Zhu, L.; Tseng, S.; Hsu, J.P. Influence of metal oxide nanoparticles concentration on their zeta potential. J. Colloid Interface Sci. 2013, 407, 22–28. [Google Scholar] [CrossRef] [PubMed]
  43. Masters, T. Practical Neural Network in C++; Academic Press: Cambridge, MA, USA, 1993. [Google Scholar]
  44. Rojas, R. Neural Networks; Springer: Berlin/Heidelberg, Germany, 1996. [Google Scholar]
Figure 1. Neural network topology including distribution of the input and output vector components.
Mathematics 09 03089 g001
Figure 2. Dependence of zeta potential on pH for different values of nanoparticle concentrations in dispersion: Temperature 40 °C, ionic strength 0.01 mol L−1. Blue 10 mg L−1, red 50 mg L−1, gray 100 mg L−1, yellow 250 mg L−1, and green 500 mg L−1.
Mathematics 09 03089 g002
Figure 3. Dependence of zeta potential on pH for different values of temperatures: Concentration of nanoparticles 100 mg L−1, ionic strength 0.01 mol L−1. Blue 20 °C, red 30 °C, gray 40 °C, yellow 50 °C and green 60 °C.
Mathematics 09 03089 g003
Figure 4. Dependence of zeta potential on pH for different values of ionic strength: Concentration of nanoparticles 100 mg L−1, temperature 20 °C. Blue 0.0001 mol L−1, red 0.001 mol L−1, gray 0.01 mol L−1, yellow 0.1 mol L−1, and green 1 mol L−1.
Mathematics 09 03089 g004
Figure 5. Experimental outputs: neural network predicted values of the zeta potential (Zeta_NN) and measured values of the zeta potential (Zeta).
Mathematics 09 03089 g005
Figure 6. Experimental outputs: neural network predicted values of the zeta potential (Zeta_NN) and measured values of the zeta potential (Zeta). The black dotted line shows a connecting line of the linear trend.
Mathematics 09 03089 g006
Table 1. Input and output vector components of the training set.
QuantityValuesNN RepresentationNumber of Neurons
Input vectorpHrange 2–12.29Transformed to interval [−1, 1]1
1-pH Transformed to interval [−1, 1]1
T20, 30, 40, 50, 60Binarized, values 0 or 15
I0.01; 0.05; 0.1; 0.5; 1Binarized, values 0 or 15
c10; 50; 100; 250; 500Binarized, values 0 or 15
Output vectorZeta_NN[−60, 70]Transformed from interval [−1, 1]1
Table 2. Regression statistics.
Correlation coefficient R0.99907
The coefficient of determination R20.99814
Number of measurements250
Table 3. Regression statistics.
SS
(Sum of Squares)
MS
(Mean Square)
FSignificance of F
Regression190,807.8190,807.8133,178.75660
Residues355.31441.432719
Total191,163.1
Table 4. Comparison with other academic works.
Model (Test Set)Neural NetworkThe Coefficient of Determination R2
Our approachTiO2MLP0.998
Yukselen, Y.; Erzin, Y. [30]Montmorillonite—SaltMLP0.947
Montmorillonite—Heavy Metal0.902
Asadi, A. et al. [19]PeatMLP0.9504
Lia, H. et al. [32]Decomposed PeatSVM0.923
GRNN0.923
Erzin, Y.; Yukselen, Y. [34]the kaolinite—SaltMLP0.992
the kaolinite—Heavy Metal0.996
Publisher’s Note: MDPI stays neutral with regard to jurisdictional claims in published maps and institutional affiliations.

