

Testing of Motor Coordination in Degenerative Neurological Diseases


Abstract
:1. Introduction
2. Materials and Methods
2.1. Description of the Mobile App
- The measurement “Spiral Deviation” is the ratio of the area between two lines of the spiral test to the screen size multiplied by 10,000. With this value, the clinician can draw the right conclusions about the ability of the patient to lead the line of the spiral. More specifically, the malfunction of the fingers is observed due to tremor and in combination with the above two measurements, the symptoms of bradykinesia, tremor, and malfunction are examined by the clinician.
- The measurement “Time” relates to the total time needed by the patient to complete the spiral test. A long time for a patient to complete the task is directly associated with the stage of the PD disease, as described in previously mentioned works.
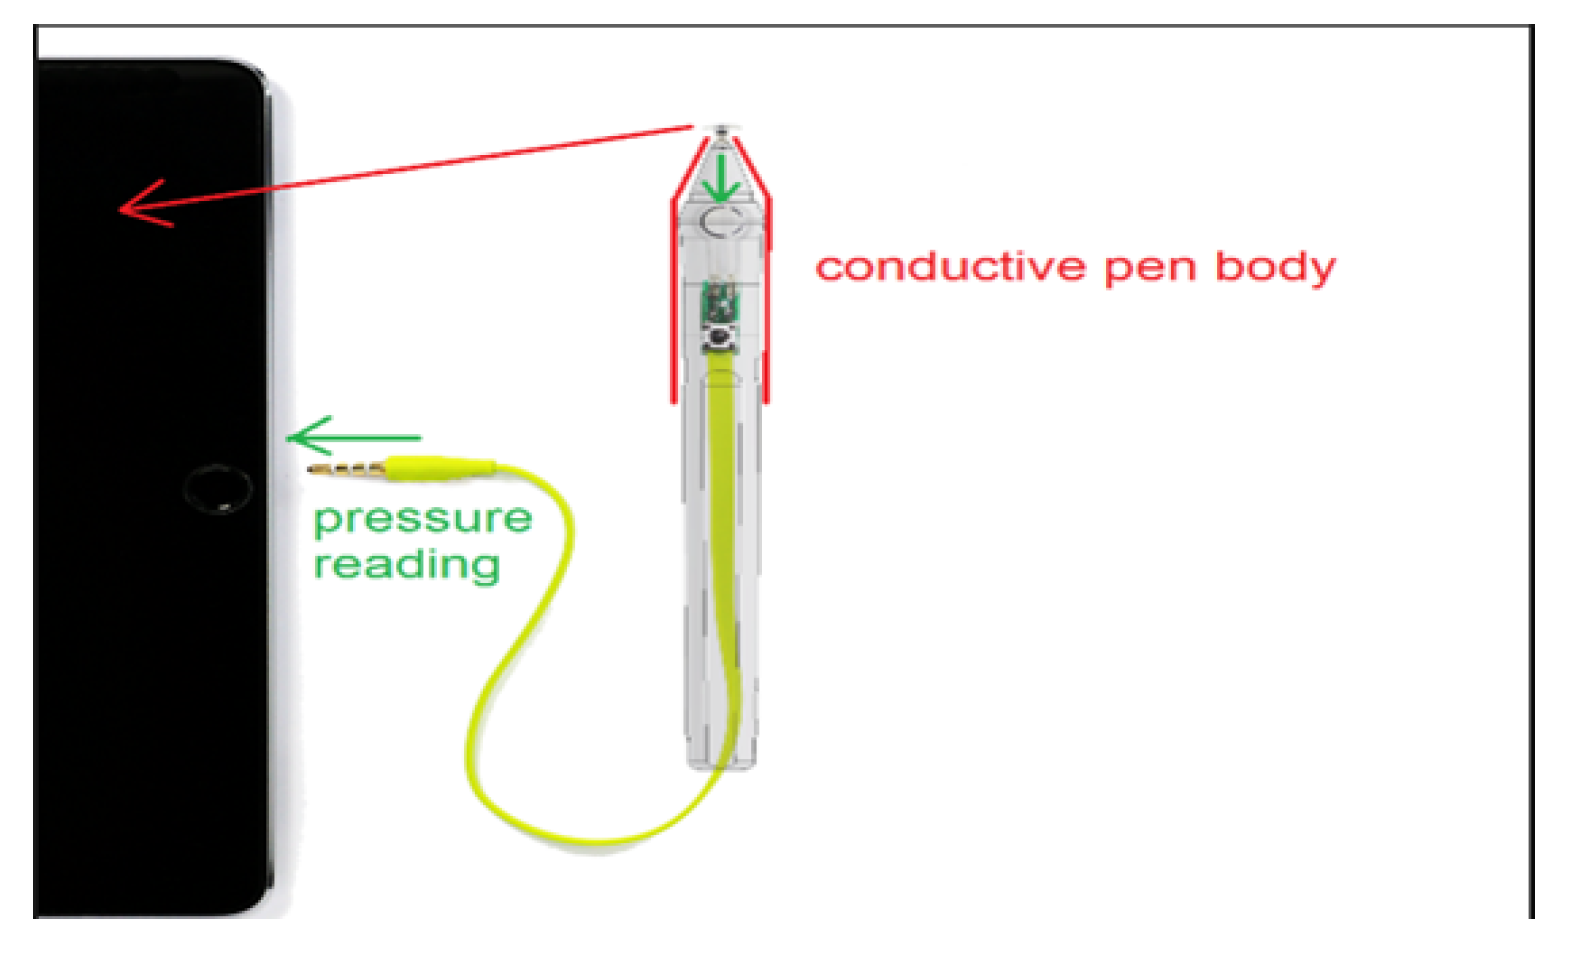
- The calculation “Pen Pressure” relates to the exercised pressure by the patient. If the pressure is greater than the expected one (as derived by tests by healthy users), then the line is more intense, red, and thicker, whereas if the exercised pressure is weak then the color of the line approaches the pink color, as in the Figure above. If the patient has tremor at a great scale, the exercised pressure, which is expected by the pen on the tablet will be weaker, so the patient will try to increase the pressure to achieve the stability of the pen.
2.2. Application Program Design
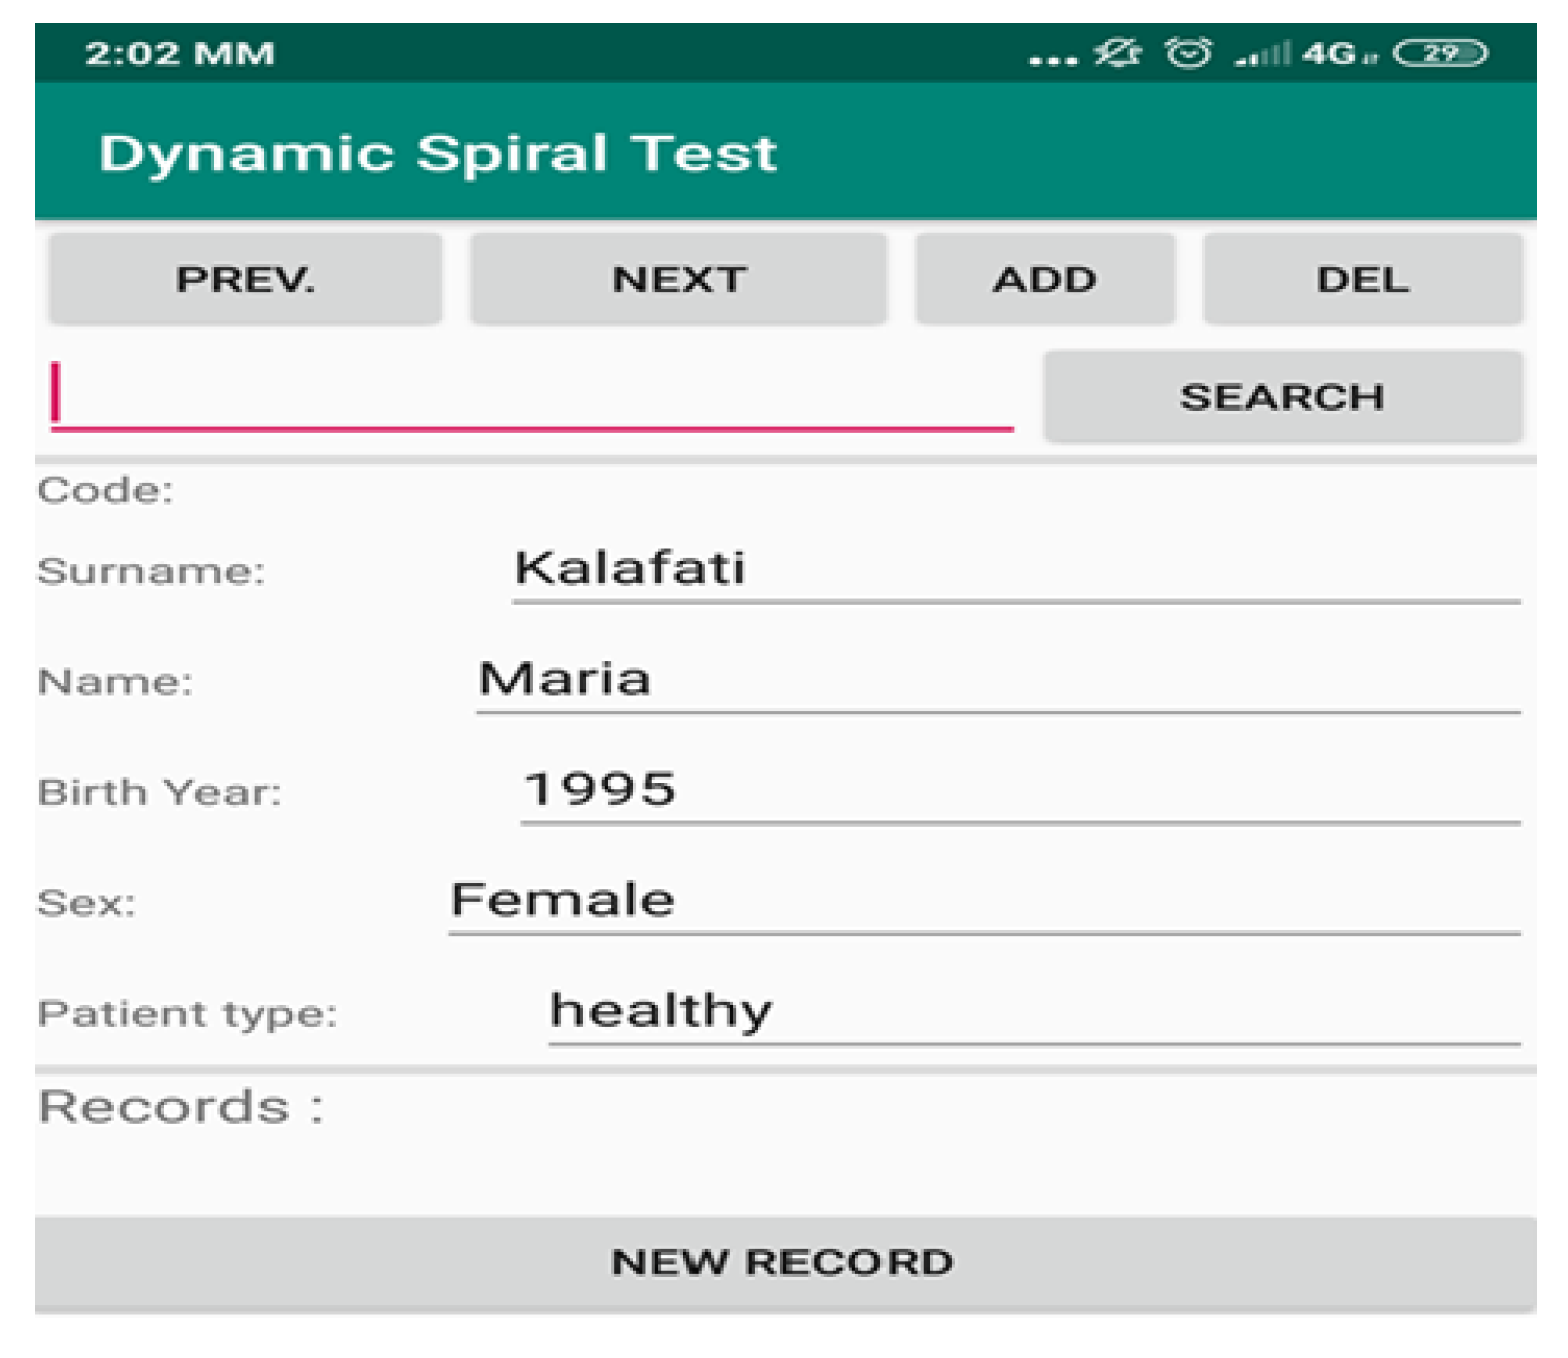
- The first part handles the graphic user interface (GUI). It uses Android SDK functions and consists of two screens, the one that shows the patient’s data and the other the spiral sketch graph (API level 29). This approach is the most popular and common way for Android App development, supported by Google Inc., Mountain View, CA, USA.
- The second part is responsible for the calculation of the surface between the curve drawn by the patient and the spiral displayed on the screen (Spiral Deviation). A special algorithm is used for this. For each point of the curve drawn by the patient (curve with red color in screenshot) the application stores the following values: x position, y position, time in milliseconds, pressure on this point, and its spiral angle. The Spiral angle is a value that starts with the value of 90 (the polar angle of the first point) and it is increased by 720 degrees (two full circles up to the final point). In this way, each point of the patient’s curve is related to a point of the test spiral. The calculation of the spiral deviation uses the distance of these two points.
- The third part is responsible for acquiring and displaying the relative pressure values of the Sonar pen as sampled from the Tablet’s microphone input.
- A fourth part is aimed to generate a dedicated audio signal/tone, which is forward to the stereo audio output (L-R) of the Tablet. This signal is used to implement the battery-less pressure sensing of the Sonar Pen.
- Finally, a fifth part is used to store and fetch data from internal storage.
2.3. The Pressure Pen
2.4. Assessment of the Test Procedure for the PD Patients
3. Results
- In Table 1, which is organized as follows, the independent variable is HEALTH (indicating whether the tests were performed by PD patients or healthy individuals) and dependent values are Standard Deviation (SD in %), Total Time (TT in sec), and Pen Pressure (PP as a number corresponding to the sum of the pixels multiplied by the difference of the force applied force (Newton—N) to the typical pen pressure (1.4–1.5 N)—the bigger the number the higher the pressure in many points, while typical handwriting pressure tends to zero) separately:
- In Table 2, for PD patients the mean value of SD was 33.175 and for healthy was 29.833. As expected, PD patients present a greater deviation in SD value in drawing test, as result of the tremor and difficulty in moving of the hand of the disease. Additionally, the mean value of the TT variable, for PD patients, is 20.13 while for healthy it is 12.73. The total time to complete the spiral test is quite longer in the patient, as opposed to the healthy controls due to bradykinesia and other motor symptoms of Parkinson’s disease. In PD patients the mean PP is 47,696.11 and for healthy it is 0.02. Because of the motor symptoms of the disease, PD patients exercise significantly greater pressure in their attempt to complete the dynamic spiral test in comparison with the healthy controls, who have no difficulties.For SD: Testing for comparison of sample variances: Levene’s Test for Equality of Variances (H0: variances do not differ). From the importance of this control Sig. = 0.286 > 0.05 we conclude that there is no significant difference in variances and therefore we conclude that variances do not differ. The significance of the test is Sig. = 0.211 > 0.05 we conclude that the variance SD does not depend from the health. The results are not statically significant. Thus, we infer that both of healthy controls and patients present spiral deviation of the dynamic spiral test of our application. From our sample it follows that the SD does not depend on whether you are healthy or PD patient.For TT: Testing for comparison of sample variances: Levene’s Test for Equality of Variances (H0: variances do not differ). From the importance of this control Sig. = 0.235 > 0.05 we conclude that there is no significant difference in variances and therefore we conclude that variances do not differ. Because the significance of the test is Sig. = 0.008 < 0.05 we reject the null hypothesis and conclude that the total time depend from the health and there is a statistically significant difference in the value of TT between patients and healthy. Indeed, once again we confirm that patients need more time to complete the dynamic spiral test in relation with healthy subjects.For PP: Testing for comparison of sample variances: Levene’s Test for Equality of Variances (H0: variances do not differ). From the importance of this control Sig. = 0.00 < 0.05 we conclude that there is a significant difference in variances and therefore we conclude that variances differ. From the statistical analysis we observe that the the significance of the test is Sig = 0.00 < 0.05, so the pen pressure depends from whether is healthy control or PD patient. Actually, there is a statistical difference between healthy and patients regarding the variable PP.
- In Table 3, only PD patients are analyzed and the age is considered as the independent variable, while SD, TT, PP are dependent variables (separately).
- The results for the age variable are summarized in Table 4: For people aged 50–60 years, the mean SD is 37.87 while for 40–50 years it is 28.48. Here, we can conclude that the age affects the SD of the patients and is probably due to the fact as the age group increases, the tremor and the other motor symptoms, such as instability, are increased too.For people aged 50–60 years, the mean of the TT variable is 20.82 while for the 40–50 years old it is 19.43. We notice that the longer a patient has been affected by the disease, despite being under the influence of medication, the more complicated it is to complete the test, and therefore it takes longer to complete the dynamic spiral test.For people aged 50–60 years, the average of the PP variable is 59,088.37 while for 40–50 years it is 36,303.85. As it is mentioned above, and at this point we observe that the greater age group needs more pressure to performing the dynamic spiral test. We come to the conclusion that although medication reduces and exacerbates the symptoms of the disease, it appears from our analysis that over time all three variables are affected. For SD: Testing for comparison of sample variances: Levene’s Test for Equality of Variances (H0: variances do not differ). From the importance of this control Sig. = 0.740 > 0.05 we conclude that there is no significant difference in variances and therefore we conclude that variances do not differ. The significance of the test is Sig. = 0.015 < 0.05, thus we conclude that the variance of SD depends from the age of patients there is a statistically significant difference in the value of SD between the patient group of 50–60 years and patient group of age between 40–50. Actually, as the age of the patients increases, we notice that the value of the spiral deviation increases too.For TT: Testing for comparison of sample variances: Levene’s Test for Equality of Variances (H0: variances do not differ). From the importance of this control Sig. = 0.511 > 0.05 we conclude that there is no significant difference in variances and therefore we conclude that variances do not differ. The significance of the test is Sig. = 0.753 > 0.05 and we make the conclusion that there is no statistically significant difference in the value of TT between 50-60 years and 40-50. The SD variance does not depend from the age of the patient.For PP: Testing for comparison of sample variances: Levene’s Test for Equality of Variances (H0: variances do not differ). From the importance of this control Sig. = 0.281 > 0.05 we conclude that there is no significant difference in variances and therefore we conclude that variances do not differ. The significance of the test is Sig. = 0.146 > 0.05, so we conclude that the PP variance does not depend from the age group of patients.
- In Table 5, only PD patients are analyzed and the sex is considered as the independent variable, while SD, TT, PP are dependent variables.
- The results for the sex variable are summarized in Table 6: For women, the mean of SD is 35.28 while for men it is 32.13. The women present a little greater SD in comparison with men.For women, the mean of TT is 18.33 while for men it is 21.03.For women, the average PP is 45,035.05 while for men it is 49,026.64.From these three valuable variables emerge the conclusion that the symptoms of the disease affect a greater percentage of women compared to men. However, in women, the development of symptomatic PD may be delayed by higher physiological striatal dopamine levels, possibly due to the activity of estrogens. This could explain the epidemiological observations of a lower incidence and higher age at onset in women. Women also presented more often with tremor which, in turn, is associated with milder motor deterioration and striatal degeneration. Taken together, these findings suggest a more benign phenotype in women with PD, according to [13]. So, combining these results with our conclusions, the treatment of Parkinson’s disease which is focused on oestrogens works more effectively on symptoms in men than in women although the disease occurs more in the male population.For SD: Testing for comparison of sample variances: Levene’s Test for Equality of Variances (H0: variances do not differ). From the importance of this control Sig. = 0.138 > 0.05 we conclude that there is no significant difference in variances and therefore we conclude that variances do not differ. The significance of the control is Sig. = 0.503 > 0.05 we conclude that there is no statistically significant difference in the value of SD between women patients and men patients. For TT: Testing for comparison of sample variances: Levene’s Test for Equality of Variances (H0: variances do not differ). From the importance of this control Sig. = 0.807 > 0.05 we conclude that there is no significant difference in variances and therefore we conclude that variances do not differ. The significance of the control is Sig. = 0.561 > 0.05 we conclude that there is no statistically significant difference in the value of TT between women and men in our sample. The value of TT does not depend from the sex of patients.For PP: Testing for comparison of sample variances: Levene’s Test for Equality of Variances (H0: variances do not differ). From the importance of this control Sig. = 0.799 > 0.05 we conclude that there is no significant difference in variances and therefore we conclude that variances do not differ. The significance of the control is Sig. = 0.820 > 0.05, so we conclude that there is no statistically significant difference in the value of PP between women and men in our sample.
- In Table 7, only healthy individuals are analyzed and the age is considered as the independent variable, while SD, TT, PP are dependent variables.
- The results for the age variable are summarized in Table 8:For people aged 50–60 years, the mean of SD is 30.00 while for 40–50 years it is 29.67.For people aged 50–60 years, the mean of the TT variable is 12.72 while for the 40–50 years old it is 12.73.For individuals aged 50-60 years, the mean of the PP variable is 0.01943 while for the age group 40–50 it is 0.1869.Comparing, the tables of the second case with the present case, where in both the age is the analyzing variable, we observe that exist an important difference in SD, TT and PP measurements, as we expected. Although the patients are under their medication for a long time, there is exist difficulties due to motor symptoms.For SD: Testing for comparison of sample variances: Levene’s Test for Equality of Variances (H0: variances do not differ). From the importance of this control Sig. = 0.277 > 0.05 we conclude that there is no significant difference in variances and therefore we conclude that variances do not differ. The importance of control is Sig. = 0.920 > 0.05. We make the conclusion that the SD variance does not depend from the age group of 40–50 and 50–60.For TT: Testing for comparison of sample variances: Levene’s Test for Equality of Variances (H0: variances do not differ). From the importance of this control Sig. = 0.219 > 0.05 we conclude that there is no significant difference in variances and therefore we conclude that variances do not differ. The significance of the test is Sig. = 0.996 > 0.05, so we conclude that there is no statistically significant difference in the value of TT between 50–60 years and 40–50.For PP: Testing for comparison of sample variances: Levene’s Test for Equality of Variances (H0: variances do not differ). From the importance of this control Sig. = 0.686 > 0.05 we conclude that there is no significant difference in variances and therefore we conclude that variances do not differ. The significance of the control is Sig. = 0.92 > 0.05 and we conclude that there is no statistically significant difference in PP value between 50–60 years and 40–50. The value of PP is not affected from the age group on healthy controls.
- In Table 9, only Healthy individuals are analyzed and the sex is considered as the independent variable, while SD, TT, PP are dependent variables.
- The results for the sex variable are summarized in Table 10:For women, the mean of SD is 30.50 while for men it is 29.17.For women, the mean of the TT variable is 13.20 while for men it is 12.25.For women, the mean of PP is 0.0214 while for men it is 0.0167.We observe that there is no significant difference between healthy men and womenFor SD: Testing for comparison of sample variances: Levene’s Test for Equality of Variances (H0: variances do not differ). From the importance of this control Sig. = 0.143 > 0.05 we conclude that there is no significant difference in variances and therefore we conclude that variances do not differ. The significance of the test is Sig. = 0.685 > 0.05 we conclude that there is no statistically significant difference in the value of SD between women and men. The SD variance does not depend from the sex of healthy controls.For TT: Testing for comparison of sample variances: Levene’s Test for Equality of Variances (H0: variances do not differ). From the importance of this control Sig. = 0.763 > 0.05 we conclude that there is no significant difference in variances and therefore we conclude that variances do not differ. The significance of the control is Sig. = 0.766 > 0.05 we conclude that there is no statistically significant difference in the value of TT between women and men. Thus, the TT value between women and men remains unaffected.For PP: Testing for comparison of sample variances: Levene’s Test for Equality of Variances (H0: variances do not differ). From the importance of this control Sig. = 0.323 > 0.05 we conclude that there is no significant difference in variances and therefore we conclude that variances do not differ. According the significance of the control is Sig. = 0.371 > 0.05, so we conclude that there is no statistically significant difference in the value of PP between women and men.
Visualization of the Statistical Analysis
4. Discussion and Conclusions
Author Contributions
Funding
Institutional Review Board Statement
Informed Consent Statement
Data Availability Statement
Conflicts of Interest
References
- Vazquez-Velez, G.E.; Zoghbi, H.Y. Parkinson’s Disease Genetics and Pathophysiology. Annu. Rev. Neurosci. 2021, 44, 87–108. [Google Scholar] [CrossRef] [PubMed]
- German, D.; Dubach, M.; Askari, S.; Speciale, S.; Bowden, D. 1-Methyl-4-phenyl-1,2,3,6-tetrahydropyridine-induced Parkinsonian syndrome in Macaca fascicularis: Which midbrain dopaminergic neurons are lost? Neuroscience 1988, 24, 161–174. [Google Scholar] [CrossRef]
- Aly, N.M.; Playfer, J.R.; Smith, S.L.; Halliday, D.M. A novel computer-based technique for the assessment of tremor in Parkinson’s disease. Age Ageing 2007, 36, 395–399. Available online: https://academic.oup.com/ageing/article-pdf/36/4/395/7291977/afm061.pdf (accessed on 3 August 2022). [CrossRef] [PubMed] [Green Version]
- Isenkul, M.; Sakar, B.; Kursun, O. Improved spiral test using digitized graphics tablet for monitoring Parkinson’s disease. In Proceedings of the 2nd International Conference on E-Health and TeleMedicine, Istanbul, Turkey, 22–24 May 2014; pp. 171–175. [Google Scholar] [CrossRef]
- Zham, P.; Kumar, D.K.; Dabnichki, P.; Poosapadi Arjunan, S.; Raghav, S. Distinguishing Different Stages of Parkinson’s Disease Using Composite Index of Speed and Pen-Pressure of Sketching a Spiral. Front. Neurol. 2017, 8, 435. [Google Scholar] [CrossRef] [PubMed]
- Aghanavesi, S.; Memedi, M.; Dougherty, M.; Nyholm, D.; Westin, J. Verification of a Method for Measuring Parkinson’s Disease Related Temporal Irregularity in Spiral Drawings. Sensors 2017, 17, 2341. [Google Scholar] [CrossRef] [PubMed] [Green Version]
- Gil-Martin, M.; Montero, J.M.; San-Segundo, R. Parkinson’s Disease Detection from Drawing Movements Using Convolutional Neural Networks. Electronics 2019, 8, 907. [Google Scholar] [CrossRef] [Green Version]
- Kamran, I.; Naz, S.; Razzak, I.; Imran, M. Handwriting dynamics assessment using deep neural network for early identification of Parkinson’s disease. Future Gener. Comput. Syst. 2021, 117, 234–244. [Google Scholar] [CrossRef]
- Kuosmanen, E.; Kan, V.; Visuri, A.; Boudjelthia, A.; Krizou, L.; Ferreira, D. Measuring Parkinson’s Disease Motor Symptoms with Smartphone-Based Drawing Tasks. In Proceedings of the Adjunct Proceedings of the 2019 ACM International Joint Conference on Pervasive and Ubiquitous Computing and Proceedings of the 2019 ACM International Symposium on Wearable Computers; Association for Computing Machinery: New York, NY, USA, 2019; pp. 1182–1185. [Google Scholar] [CrossRef] [Green Version]
- Lauraitis, A.; Maskeliunas, R.; Damasevicius, R.; Krilavicius, T. A Mobile Application for Smart Computer-Aided Self-Administered Testing of Cognition, Speech, and Motor Impairment. Sensors 2020, 20, 3236. [Google Scholar] [CrossRef] [PubMed]
- Ferleger, B.I.; Sonnet, K.S.; Morriss, T.H.; Ko, A.L.; Chizeck, H.J.; Herron, J.A. A tablet- and mobile-based application for remote diagnosis and analysis of movement disorder symptoms. In Proceedings of the 42nd Annual International Conference of the IEEE Engineering in Medicine & Biology Society (EMBC), Montreal, QC, Canada, 20–24 July 2020; pp. 5588–5591. [Google Scholar] [CrossRef]
- Pham, H.N.; Do, T.T.T.; Jie Chan, K.Y.; Sen, G.; Han, A.Y.K.; Lim, P.; Loon Cheng, T.S.; Nguyen, Q.H.; Nguyen, B.P.; Chua, M.C.H. Multimodal Detection of Parkinson Disease based on Vocal and Improved Spiral Test. In Proceedings of the 2019 International Conference on System Science and Engineering (ICSSE), Dong Hoi, Vietnam, 20–21 July 2019; pp. 279–284. [Google Scholar] [CrossRef]
- Haaxma, C.A.; Bloem, B.R.; Borm, G.F.; Oyen, W.J.G.; Leenders, K.L.; Eshuis, S.; Booij, J.; Dluzen, D.E.; Horstink, M.W.I.M. Gender differences in Parkinson’s disease. J. Neurol. Neurosurg. Psychiatry 2007, 78, 819–824. [Google Scholar] [CrossRef]


| HEALTH | N | MEAN | Std. Deviation | Std. Error Mean | |
|---|---|---|---|---|---|
| SD | PATIENTS | 12 | 33.1750 | 7.2267 | 2.0862 |
| (% pixels) | HEALTHY | 12 | 29.8333 | 5.3229 | 1.5366 |
| TT | PATIENTS | 12 | 20.1250 | 7.1106 | 2.0526 |
| (sec) | HEALTHY | 12 | 12.7250 | 5.1517 | 1.4872 |
| PP | PATIENTS | 12 | 47,696.1080 | 26,647.0019 | 7692.3269 |
| (N * pixels) | HEALTHY | 12 | 0.0191 | 0.0088 | 0.0026 |
| Levene’s Test | T-Test for Equality of Means | |||||||||
|---|---|---|---|---|---|---|---|---|---|---|
| for Equality | ||||||||||
| of Variances | 95% Confidence Interval of the Difference | |||||||||
| Mean | Std. Error | |||||||||
| F | Siq. | t | df | Sig. 1 | Difference | Difference | Lower | Upper | ||
| SD | Equal variances assumed | 1.195 | 0.286 | 1.290 | 22.000 | 0.211 | 3.3416 | 2.5909 | −2.0317 | 8.7150 |
| Equal variances not assumed | 1.290 | 20.221 | 0.212 | 3.3416 | 2.5909 | −2.0592 | 8.7426 | |||
| TT | Equal variances assumed | 1.490 | 0.235 | 2.919 | 22.000 | 0.008 | 7.4000 | 2.5347 | 2.1432 | 12.6567 |
| Equal variances not assumed | 2.919 | 20.054 | 0.008 | 7.4000 | 2.5347 | 2.1134 | 12.6865 | |||
| PP | Equal variances assumed | 28.269 | 0.000 | 6.200 | 22.000 | 0.000 | 47,696.0892 | 7692.3268 | 31,743.1797 | 63,648.9987 |
| Equal variances not assumed | 6.200 | 11.000 | 0.000 | 47,696.0892 | 7692.3268 | 30,765.3919 | 64,626.7865 | |||
| Age | N | MEAN | Std. Deviation | Std. Error Mean | |
|---|---|---|---|---|---|
| SD | 50–60 | 6 | 37.8667 | 5.18716 | 2.11765 |
| 40–50 | 6 | 28.4833 | 5.92973 | 2.42080 | |
| TT | 50–60 | 6 | 20.8167 | 8.00185 | 3.26674 |
| 40–50 | 6 | 19.4333 | 6.78636 | 2.77052 | |
| PP | 50–60 | 6 | 59,088.3666 | 20,674.8706 | 8440.4805 |
| 40–50 | 6 | 36,303.8500 | 28,691.5870 | 11,713.2913 |
| Levene’s Test | T-Test for Equality of Means | |||||||||
|---|---|---|---|---|---|---|---|---|---|---|
| for Equality | ||||||||||
| of Variances | 95% Confidence Interval of the Difference | |||||||||
| Mean | Std. Error | |||||||||
| F | Siq. | t | df | Sig. 1 | Difference | Difference | Lower | Upper | ||
| SD | Equal variances assumed | 0.116 | 0.740 | 2.917 | 10.00 | 0.015 | 9.3833 | 3.2163 | 2.2169 | 16.5497 |
| Equal variances not assumed | 2.917 | 9.83 | 0.016 | 9.3833 | 3.2163 | 2.1997 | 16.5669 | |||
| TT | Equal variances assumed | 0.464 | 0.511 | 0.323 | 10.00 | 0.753 | 1.3833 | 4.2833 | −8.1606 | 10.9273 |
| Equal variances not assumed | 0.323 | 9.74 | 0.754 | 1.3833 | 4.2833 | −8.1952 | 1.9619 | |||
| PP | Equal variances assumed | 1.300 | 0.281 | 1.578 | 10.00 | 0.146 | 22,784.5166 | 14,437.5519 | −9384.3538 | 54,953.3871 |
| Equal variances not assumed | 1.578 | 9.09 | 0.149 | 22,784.5166 | 14,437.5519 | −9826.3746 | 55,395.4080 | |||
| Sex | N | MEAN | Std. Deviation | Std. Error Mean | |
|---|---|---|---|---|---|
| SD | FEMALE | 4 | 35.2750 | 3.51888 | 1.75944 |
| MALE | 8 | 32.1250 | 8.54296 | 3.02039 | |
| TT | FEMALE | 4 | 18.3250 | 7.72933 | 3.86466 |
| MALE | 8 | 21.0250 | 7.14638 | 2.52663 | |
| PP | FEMALE | 4 | 45,035.0500 | 27,235.2282 | 13,617.6141 |
| MALE | 8 | 49,026.6375 | 28,139.7772 | 9948.9136 |
| Levene’s Test | T-Test for Equality of Means | |||||||||
|---|---|---|---|---|---|---|---|---|---|---|
| for Equality | ||||||||||
| of Variances | 95% Confidence Interval of the Difference | |||||||||
| Mean | Std. Error | |||||||||
| F | Siq. | t | df | Sig. 1 | Difference | Difference | Lower | Upper | ||
| SD | Equal variances assumed | 2.598 | 0.138 | 0.69 | 10.00 | 0.50 | 3.150 | 4.533 | −6.951 | 13.251 |
| Equal variances not assumed | 0.90 | 9.90 | 0.39 | 3.150 | 3.495 | −4.649 | 10.949 | |||
| TT | Equal variances assumed | 0.063 | 0.807 | −0.60 | 10.00 | 0.56 | 2.700 | 4.486 | −12.696 | 7.296 |
| Equal variances not assumed | −0.58 | 5.67 | 0.58 | 2.700 | 4.617 | −14.160 | 8.760 | |||
| PP | Equal variances assumed | 0.068 | 0.799 | −0.23 | 10.00 | 0.82 | −3991.587 | 17,067.735 | −42,020.872 | 34,037.697 |
| Equal variances not assumed | −0.23 | 6.29 | 0.82 | −3991.587 | 16,864.765 | −44,802.306 | 36,819.131 | |||
| Age | N | MEAN | Std. Deviation | Std. Error Mean | |
|---|---|---|---|---|---|
| SB | 50–60 | 6 | 30.0000 | 4.81664 | 1.96638 |
| 40–50 | 6 | 29.6667 | 6.25033 | 2.55169 | |
| TT | 50–60 | 6 | 12.7167 | 3.63891 | 1.48558 |
| 40–50 | 6 | 12.7333 | 6.71913 | 2.74307 | |
| PP | 50–60 | 6 | 0.0194 | 0.00919 | 0.00375 |
| 40–50 | 6 | 0.0187 | 0.00932 | 0.00381 |
| Levene’s Test | T-Test for Equality of Means | |||||||||
|---|---|---|---|---|---|---|---|---|---|---|
| for Equality | ||||||||||
| of Variances | 95% Confidence Interval of the Difference | |||||||||
| Mean | Std. Error | |||||||||
| F | Siq. | t | df | Sig. 1 | Difference | Difference | Lower | Upper | ||
| SD | Equal variances assumed | 1.321 | 0.277 | 0.103 | 10.00 | 0.920 | 0.3333 | 3.2214 | −6.8445 | 7.5111 |
| Equal variances not assumed | 0.103 | 9.39 | 0.920 | 0.3333 | 3.2214 | −6.9082 | 7.5748 | |||
| TT | Equal variances assumed | 1.716 | 0.219 | −0.005 | 10.00 | 0.996 | −0.0166 | 3.1195 | −6.9673 | 6.9340 |
| Equal variances not assumed | −0.005 | 7.70 | 0.996 | −0.0166 | 3.1195 | −7.2592 | 7.2259 | |||
| PP | Equal variances assumed | 0.174 | 0.686 | 0.139 | 10.00 | 0.892 | 0.0007 | 0.0053 | −0.0111 | 0.0126 |
| Equal variances not assumed | 0.139 | 9.99 | 0.892 | 0.0007 | 0.0053 | −0.0111 | 0.0126 | |||
| Sex | N | MEAN | Std. Deviation | Std. Error Mean | |
|---|---|---|---|---|---|
| SD | FEMALE | 6 | 30.5000 | 4.03733 | 1.64823 |
| MALE | 6 | 29.1667 | 6.70572 | 2.73760 | |
| TT | FEMALE | 6 | 13.2000 | 4.85551 | 1.98225 |
| MALE | 6 | 12.2500 | 5.85414 | 2.38994 | |
| PP | FEMALE | 6 | 0.0215 | 0.01024 | 0.00418 |
| MALE | 6 | 0.0167 | 0.00728 | 0.00297 |
| Levene’s Test | T-Test for Equality of Means | |||||||||
|---|---|---|---|---|---|---|---|---|---|---|
| for Equality | ||||||||||
| of Variances | 95% Confidence Interval of the Difference | |||||||||
| Mean | Std. Error | |||||||||
| F | Siq. | t | df | Sig. 1 | Difference | Difference | Lower | Upper | ||
| SD | Equal variances assumed | 2.526 | 0.143 | 0.417 | 10.00 | 0.685 | 1.3333 | 3.1954 | −5.7866 | 8.4533 |
| Equal variances not assumed | 0.417 | 8.204 | 0.687 | 1.3333 | 3.1954 | −6.0037 | 8.6703 | |||
| TT | Equal variances assumed | 0.096 | 0.763 | 0.306 | 10.00 | 0.766 | 0.9500 | 3.1050 | −6.9673 | 7.8684 |
| Equal variances not assumed | 0.306 | 9.669 | 0.766 | 0.9500 | 3.1050 | −6.0006 | 7.9006 | |||
| PP | Equal variances assumed | 1.080 | 0.323 | 0.937 | 10.00 | 0.371 | 0.0048 | 0.0051 | −0.0066 | 0.0162 |
| Equal variances not assumed | 0.937 | 9.027 | 0.373 | 0.0048 | 0.0051 | −0.0067 | 0.0164 | |||
Publisher’s Note: MDPI stays neutral with regard to jurisdictional claims in published maps and institutional affiliations. |
© 2022 by the authors. Licensee MDPI, Basel, Switzerland. This article is an open access article distributed under the terms and conditions of the Creative Commons Attribution (CC BY) license (https://creativecommons.org/licenses/by/4.0/).
Share and Cite
Kalafati, M.; Kakarountas, A.; Chroni, E. Testing of Motor Coordination in Degenerative Neurological Diseases. Healthcare 2022, 10, 1948. https://doi.org/10.3390/healthcare10101948
Kalafati M, Kakarountas A, Chroni E. Testing of Motor Coordination in Degenerative Neurological Diseases. Healthcare. 2022; 10(10):1948. https://doi.org/10.3390/healthcare10101948
Chicago/Turabian StyleKalafati, Maria, Athanasios Kakarountas, and Elisabeth Chroni. 2022. "Testing of Motor Coordination in Degenerative Neurological Diseases" Healthcare 10, no. 10: 1948. https://doi.org/10.3390/healthcare10101948