
Does the Disparity Patterning Differ between Diagnosed and Undiagnosed Hypertension among Adults? Evidence from Indonesia
 , , and
Abstract
:1. Background
2. Methods
2.1. Study Design
2.2. Independent Variables
2.3. Dependent Variables
2.4. Data Analysis
3. Results
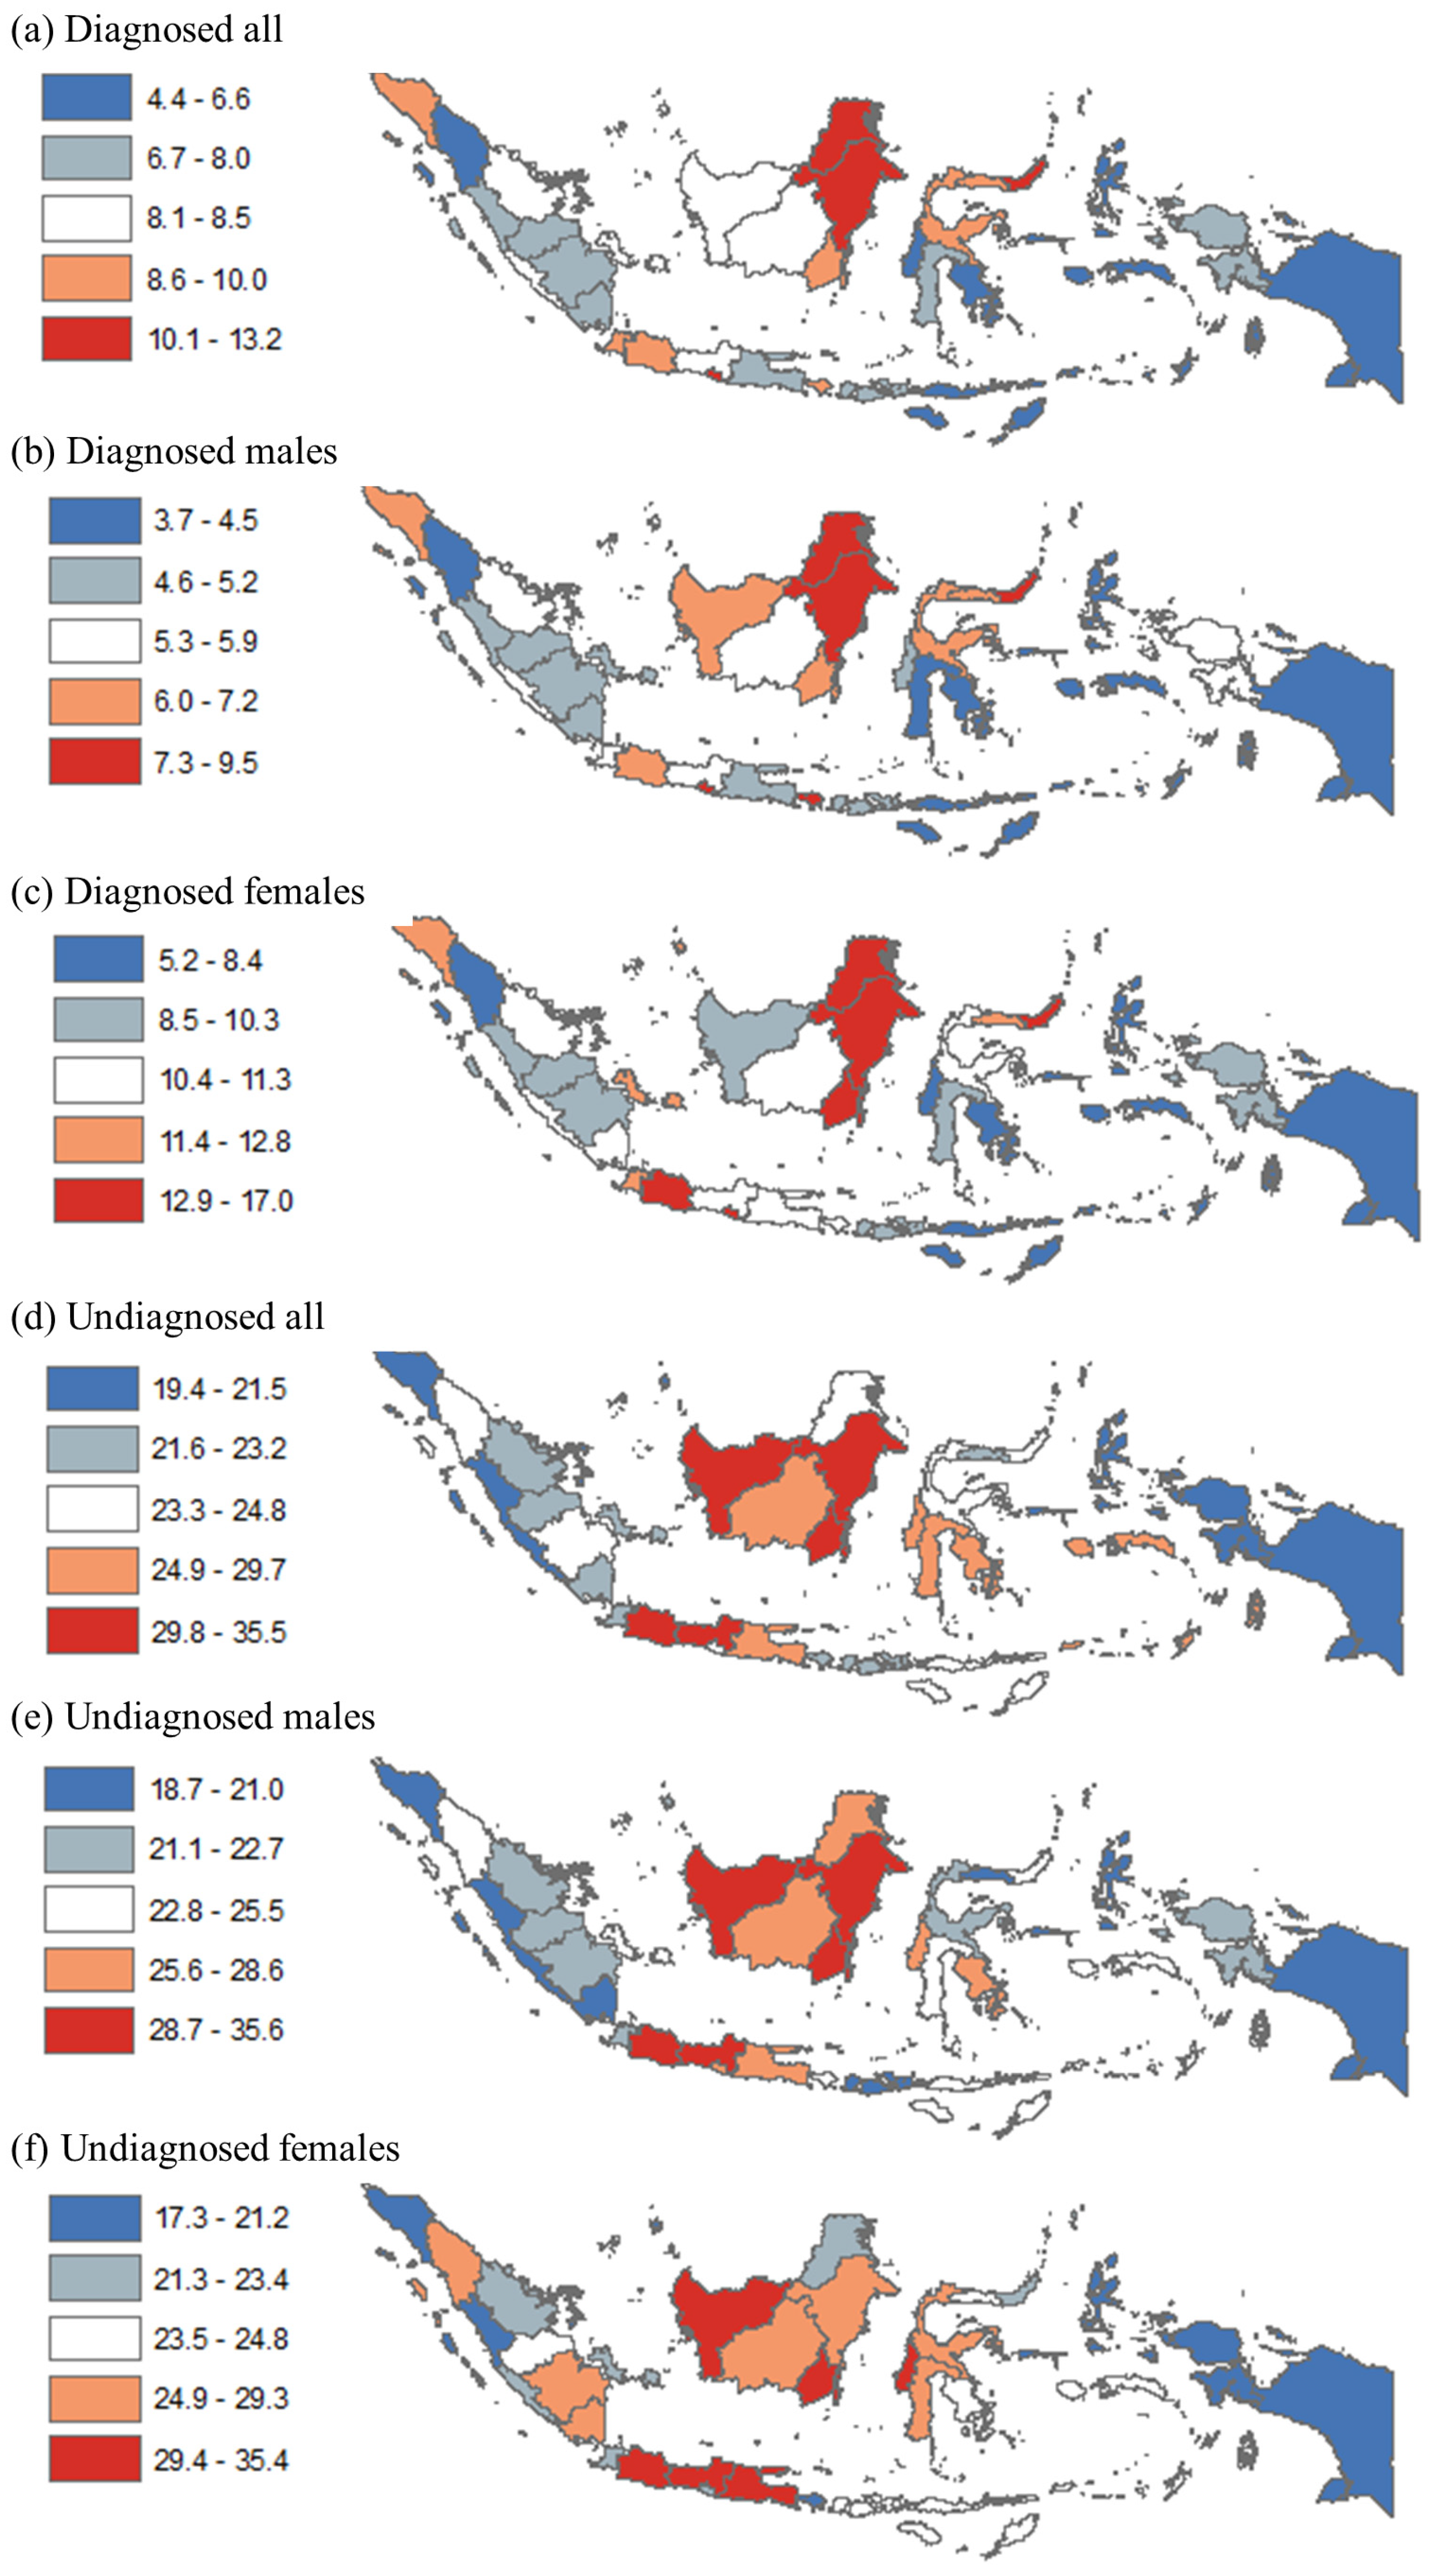
3.1. Analysis at the Provincial Level
3.2. Analysis at the District Level
4. Discussion
5. Conclusions
Author Contributions
Funding
Institutional Review Board Statement
Informed Consent Statement
Data Availability Statement
Conflicts of Interest
Appendix A. Map of Provinces in Indonesia

Appendix B. Regression Outputs for Urban/Rural Differences
| Diagnosed All | Diagnosed Males | Diagnosed Females | Undiagnosed All | Undiagnosed Males | Undiagnosed Females | |
| Coef | Coef | Coef | Coef | Coef | Coef | |
| Rural | Reference | |||||
| Urban | 1.24 ** | 1.28 ** | 1.09 * | −0.80 | 1.39 | −2.97 ** |
| Constant | 7.63 ** | 5.27 ** | 10.07 ** | 25.54 ** | 24.68 ** | 26.37 ** |
| Observations | ||||||
| R-squared | 513 | 511 | 512 | 514 | 514 | 514 |
Appendix C. Ten Districts with LOWEST Prevalence of Diagnosed and Undiagnosed Hypertension among Adults in Indonesia
| Prevalence | Province | Region | Urban | Poverty | Education | Pop (000) | |
| (a) Diagnosed all | |||||||
| Kab. Buton Tengah | 0.0% | Central Sulawesi | Sulawesi | Rural | 15% | 80% | 89 |
| Kab. Yahukimo | 0.3% | Papua | Papua | Rural | 39% | 12% | 181 |
| Kab. Intan Jaya | 0.4% | Papua | Papua | Rural | 43% | 9% | 46 |
| Kab. Dogiyai | 0.5% | Papua | Papua | Rural | 30% | 39% | 92 |
| Kab. Pegunungan Bintang | 0.6% | Papua | Papua | Rural | 31% | 21% | 72 |
| Kab. Lanny Jaya | 0.7% | Papua | Papua | Rural | 40% | 46% | 172 |
| Kab. Mambramo Raya | 0.7% | Papua | Papua | Rural | 30% | 51% | 21 |
| Kab. Buru Selatan | 1.0% | Maluku | Papua | Rural | 16% | 67% | 59 |
| Kab. Muna Barat | 1.2% | Southeast Sulawesi | Sulawesi | Rural | 14% | 71% | 77 |
| Kab. Jayawijaya | 1.2% | Papua | Papua | Rural | 39% | 67% | 206 |
| AVERAGE | 30% | 46% | 102 | ||||
| (b) Diagnosed males | |||||||
| Kab. Yahukimo | 0% | Papua | Papua | Rural | 39% | 12% | 181 |
| Kab. Pegunungan Bintang | 0% | Papua | Papua | Rural | 31% | 21% | 72 |
| Kab. Tolikara | 1% | Papua | Papua | Rural | 33% | 34% | 131 |
| Kab. Dogiyai | 1% | Papua | Papua | Rural | 30% | 39% | 92 |
| Kab. Lanny Jaya | 1% | Papua | Papua | Rural | 40% | 46% | 172 |
| Kab. Mambramo Raya | 1% | Papua | Papua | Rural | 30% | 51% | 21 |
| Kab. Intan Jaya | 1% | Papua | Papua | Rural | 43% | 9% | 46 |
| Kab. Jayawijaya | 1.1% | Papua | Papua | Rural | 39% | 67% | 206 |
| Kab. Teluk Wondama | 1.1% | West Papua | Papua | Rural | 33% | 39% | 30 |
| Kab. Halmahera Barat | 1.2% | North Maluku | Papua | Rural | 9% | 70% | 111 |
| AVERAGE | 33% | 39% | 106 | ||||
| (c) Diagnosed females | |||||||
| Kab. Buton Tengah | 0% | Southeast Sulawesi | Sulawesi | Rural | 15% | 80% | 89 |
| Kab. Yahukimo | 0% | Papua | Papua | Rural | 39% | 12% | 181 |
| Kab. Dogiyai | 0% | Papua | Papua | Rural | 30% | 39% | 92 |
| Kab. Mambramo Raya | 0% | Papua | Papua | Rural | 30% | 51% | 21 |
| Kab. Diyai | 0.4% | Papua | Papua | Rural | 43% | 51% | 69 |
| Kab. Lanny Jaya | 0.6% | Papua | Papua | Rural | 40% | 46% | 172 |
| Kab. Buru Selatan | 0.6% | Maluku | Papua | Rural | 16% | 67% | 59 |
| Kab. Muna Barat | 0.7% | Southeast Sulawesi | Sulawesi | Rural | 14% | 71% | 77 |
| Kab. Pegunungan Bintang | 1.0% | Papua | Papua | Rural | 31% | 21% | 72 |
| Kab. Jayawijaya | 1.3% | Papua | Papua | Rural | 39% | 67% | 206 |
| AVERAGE | 30% | 51% | 104 | ||||
| (d) Undiagnosed all | |||||||
| Kab. Puncak Jaya | 7% | Papua | Papua | Rural | 36% | 21% | 115 |
| Kab. Nduga | 10% | Papua | Papua | Rural | 38% | 9% | 94 |
| Kab. Tolikara | 10% | Papua | Papua | Rural | 33% | 34% | 131 |
| Kab. Asmat | 11% | Papua | Papua | Rural | 27% | 21% | 88 |
| Kab. Halmahera Tengah | 11% | North Maluku | Papua | Rural | 14% | 63% | 50 |
| Kab. Mimika | 12% | Papua | Papua | Rural | 15% | 67% | 201 |
| Kab. Sorong Selatan | 12% | West Papua | Papua | Rural | 19% | 56% | 43 |
| Kab. Simeulue | 12% | Aceh | Sumatera | Rural | 20% | 81% | 89 |
| Kab. Aceh Jaya | 12% | Aceh | Sumatera | Rural | 14% | 74% | 86 |
| Kab. Teluk Wondama | 13% | West Papua | Papua | Rural | 33% | 39% | 30 |
| AVERAGE | 25% | 46% | 93 | ||||
| (e) Undiagnosed males | |||||||
| Kab. Puncak Jaya | 6.8% | Papua | Papua | Rural | 36% | 21% | 115 |
| Kab. Halmahera Tengah | 9.4% | North Maluku | Papua | Rural | 14% | 63% | 50 |
| Kab. Keerom | 10.1% | Papua | Papua | Rural | 17% | 61% | 54 |
| Kab. Aceh Jaya | 10.1% | Aceh | Sumatera | Rural | 14% | 74% | 86 |
| Kab. Simeulue | 10.5% | Aceh | Sumatera | Rural | 20% | 81% | 89 |
| Kab. Dompu | 10.6% | West Nusa Tenggara | Papua | Rural | 12% | 70% | 238 |
| Kab. Nduga | 11.2% | Papua | Papua | Rural | 38% | 9% | 94 |
| Kab. Sumbawa | 11.6% | West Nusa Tenggara | Papua | Rural | 14% | 56% | 441 |
| Kab. Buton Tengah | 11.7% | Southeast Sulawesi | Sulawesi | Rural | 15% | 80% | 89 |
| Kab. Sorong Selatan | 11.8% | West Papua | Papua | Rural | 19% | 56% | 43 |
| AVERAGE | 20% | 57% | 130 | ||||
| (f) Undiagnosed females | |||||||
| Kab. Puncak Jaya | 6.2% | Papua | Papua | Rural | 36% | 21% | 115 |
| Kab. Nduga | 7.8% | Papua | Papua | Rural | 38% | 9% | 94 |
| Kab. Tolikara | 8.4% | Papua | Papua | Rural | 33% | 34% | 131 |
| Kab. Tambrauw | 9.6% | West Papua | Papua | Rural | 35% | 47% | 14 |
| Kab. Asmat | 10.0% | Papua | Papua | Rural | 27% | 21% | 88 |
| Kab. Mimika | 10.5% | Papua | Papua | Rural | 15% | 67% | 201 |
| Kab. Jayawijaya | 11.2% | Papua | Papua | Rural | 39% | 67% | 206 |
| Kab. Yahukimo | 11.3% | Papua | Papua | Rural | 39% | 12% | 181 |
| Kab. Mambramo Tengah | 11.4% | Papua | Papua | Rural | 37% | 54% | 46 |
| Kab. Boven Digul | 12.4% | Papua | Papua | Rural | 20% | 35% | 63 |
| AVERAGE | 32% | 37% | 114 |
Appendix D. Ten Districts with HIGHEST Prevalence of Diagnosed and Undiagnosed Hypertension among Adults in Indonesia
| Prevalence | Province | Region | Urban | Poverty | Education | Pop (000) | |
| (a) Diagnosed all | |||||||
| Kab. Sitaro Kepulauan | 20.8% | North Sulawesi | Sulawesi | Rural | 10% | 71% | 66 |
| Kota Tomohon | 17.7% | North Sulawesi | Sulawesi | Urban | 6% | 71% | 100 |
| Kab. Kep Talaud | 16.6% | North Sulawesi | Sulawesi | Rural | 10% | 71% | 89 |
| Kab. Natuna Kep | 16.5% | Riau Islands | Sumatera | Rural | 5% | 70% | 74 |
| Kab. Minahasa | 16.3% | North Sulawesi | Sulawesi | Rural | 7% | 65% | 329 |
| Kab. Anambas Kep | 15.6% | Riau Islands | Sumatera | Rural | 7% | 77% | 40 |
| Kab. Sumedang | 15.3% | West Java | Java | Rural | 10% | 43% | 1137 |
| Kab. Tanah Tidung | 14.4% | North Kalimantan | Kalimantan | Rural | 5% | 45% | 22 |
| Kab. Minahasa Selatan | 14.3% | North Sulawesi | Sulawesi | Rural | 9% | 62% | 205 |
| Kab. Karimun | 14.2% | Riau Islands | Sumatera | Rural | 7% | 70% | 225 |
| AVERAGE | 8% | 65% | 229 | ||||
| (b) Diagnosed males | |||||||
| Kota Tomohon | 15.8% | North Sulawesi | Sulawesi | Urban | 6% | 71% | 100 |
| Kab. Puncak Jaya | 15.2% | Papua | Papua | Rural | 36% | 21% | 115 |
| Kab. Sitaro Kepulauan | 14.2% | North Sulawesi | Sulawesi | Rural | 10% | 71% | 66 |
| Kab. Kep Talaud | 13.3% | North Sulawesi | Sulawesi | Rural | 10% | 71% | 89 |
| Kab. Mahakam Ulu | 13.2% | East Kalimantan | Kalimantan | Rural | 12% | 52% | 26 |
| Kab. Minahasa | 12.9% | North Sulawesi | Sulawesi | Rural | 7% | 65% | 329 |
| Kab. Gianyar | 11.5% | Bali | Java | Rural | 4% | 77% | 495 |
| Kab Klungkung | 11.2% | Bali | Java | Rural | 6% | 77% | 176 |
| Kab. Tanah Tidung | 11.0% | North Kalimantan | Kalimantan | Rural | 5% | 45% | 22 |
| Kab. Natuna Kep | 11.0% | Riau Islands | Sumatera | Rural | 5% | 70% | 74 |
| AVERAGE | 10% | 62% | 149 | ||||
| (c) Diagnosed females | |||||||
| Kab. Sitaro Kepulauan | 27.0% | North Sulawesi | Sulawesi | Rural | 10% | 71% | 66 |
| Kab. Anambas Kep | 22.4% | Riau Islands | Sumatera | Rural | 7% | 77% | 40 |
| Kab. Natuna Kep | 22.4% | Riau Islands | Sumatera | Rural | 5% | 70% | 74 |
| Kab. Sumedang | 20.9% | West Java | Java | Rural | 10% | 43% | 1137 |
| Kab. Minahasa Selatan | 20.3% | North Sulawesi | Sulawesi | Rural | 9% | 62% | 205 |
| Kab. Minahasa | 19.9% | North Sulawesi | Sulawesi | Rural | 7% | 65% | 329 |
| Kab. Kep Talaud | 19.7% | North Sulawesi | Sulawesi | Rural | 10% | 71% | 89 |
| Kota Tomohon | 19.6% | North Sulawesi | Sulawesi | Urban | 6% | 71% | 100 |
| Kab. Sangihe Kepulauan | 19.0% | North Sulawesi | Sulawesi | Rural | 12% | 55% | 130 |
| Kab. Hulu Sungai Utara | 19.0% | South Kalimantan | Kalimantan | Rural | 6% | 55% | 225 |
| AVERAGE | 8% | 64% | 239 | ||||
| (d) Undiagnosed all | |||||||
| Kab. Hulu Sungai Tengah | 43.2% | South Kalimantan | Kalimantan | Rural | 6% | 66% | 260 |
| Kab. Tabalong | 42.2% | South Kalimantan | Kalimantan | Rural | 6% | 61% | 239 |
| Kab. Mamasa | 40.8% | West Sulawesi | Sulawesi | Rural | 13% | 66% | 152 |
| Kab. Ciamis | 40.8% | West Java | Java | Rural | 7% | 51% | 1168 |
| Kota Madiun | 40.4% | East Java | Java | Urban | 4% | 80% | 175 |
| Kab. Cianjur | 40.2% | West Java | Java | Rural | 10% | 45% | 2243 |
| Kab. Barito Kuala | 39.1% | South Kalimantan | Kalimantan | Rural | 5% | 62% | 298 |
| Melawi | 38.6% | West Kalimantan | Kalimantan | Rural | 13% | 41% | 196 |
| Kab. Karo | 38.4% | North Sumatera | Sumatera | Rural | 9% | 74% | 389 |
| Kab. Kutai Barat | 38.4% | East Kalimantan | Kalimantan | Rural | 9% | 60% | 146 |
| AVERAGE | 8% | 61% | 527 | ||||
| (e) Undiagnosed males | |||||||
| Kota Madiun | 44.9% | East Java | Java | Urban | 4% | 80% | 175 |
| Kab. Tabalong | 43.6% | South Kalimantan | Kalimantan | Rural | 6% | 61% | 239 |
| Kab. Hulu Sungai Tengah | 42.5% | South Kalimantan | Kalimantan | Rural | 6% | 66% | 260 |
| Kab. Karo | 41.3% | North Sumatera | Sumatera | Rural | 9% | 74% | 389 |
| Kab. Kutai Barat | 41.1% | East Kalimantan | Kalimantan | Rural | 9% | 60% | 146 |
| Kota Banjarmasin | 40.5% | South Kalimantan | Kalimantan | Urban | 4% | 55% | 675 |
| Kota Singkawang | 40.4% | West Kalimantan | Kalimantan | Urban | 5% | 60% | 207 |
| Kab. Buton Selatan | 39.6% | Southeast Sulawesi | Sulawesi | Rural | 15% | 44% | 77 |
| Kab. Mamasa | 39.2% | West Sulawesi | Sulawesi | Rural | 13% | 66% | 152 |
| Kab. Barito Kuala | 39.2% | South Kalimantan | Kalimantan | Rural | 5% | 62% | 298 |
| AVERAGE | 8% | 63% | 262 | ||||
| (f) Undiagnosed females | |||||||
| Kab. Ciamis | 44.6% | West Java | Jawa | Rural | 7% | 51% | 1168 |
| Kab. Hulu Sungai Tengah | 43.9% | South Kalimantan | Kalimantan | Rural | 6% | 66% | 260 |
| Melawi | 43.0% | West Kalimantan | Kalimantan | Rural | 13% | 41% | 196 |
| Kab. Mamasa | 42.4% | West Sulawesi | Sulawesi | Rural | 13% | 66% | 152 |
| Kab. Cianjur | 41.9% | West Java | Jawa | Rural | 10% | 45% | 2243 |
| Kab. Tabalong | 40.7% | South Kalimantan | Kalimantan | Rural | 6% | 61% | 239 |
| Kab. Indramayu | 40.4% | West Java | Jawa | Rural | 12% | 56% | 1691 |
| Kab. Wonosobo | 40.4% | Central Java | Jawa | Rural | 18% | 45% | 777 |
| Kab. Nganjuk | 40.0% | East Java | Jawa | Rural | 12% | 63% | 1041 |
| Kota Batu | 39.8% | East Java | Jawa | Urban | 4% | 73% | 200 |
| AVERAGE | 10% | 57% | 797 |
Appendix E. Regression Outputs for Geographic and Socioeconomic Disparity in Diagnosed and Undiagnosed Hypertension
| Diagnosed All | Diagnosed Males | Diagnosed Females | Undiagnosed All | Undiagnosed Males | Undiagnosed Females | |
| Coef | Coef | Coef | Coef | Coef | Coef | |
| (a) All districts (N = 514) | ||||||
| Papua | Reference | |||||
| Java | 3.05 ** | 1.60 ** | 4.29 ** | 7.72 ** | 7.07 ** | 8.45 ** |
| Sumatera | 1.88 ** | 0.74 * | 2.95 ** | 1.32 | 0.06 | 2.70 ** |
| Kalimantan | 3.65 ** | 2.23 ** | 5.13 ** | 9.36 ** | 8.77 ** | 10.00 ** |
| Sulawesi | 2.77 ** | 1.53 ** | 3.93 ** | 3.91 ** | 3.49 ** | 4.36 ** |
| Income | ||||||
| Quintile 1 poor | Reference | |||||
| Quintile 2 | −0.20 | −0.41 | 0.03 | 2.10 ** | 1.76 * | 2.39 ** |
| Quintile 3 | 0.15 | −0.12 | 0.37 | 2.56 ** | 2.31 ** | 2.73 ** |
| Quintile 4 | 0.58 | 0.18 | 0.99 | 1.23 | 1.47 | 0.96 |
| Quintile 5 rich | 0.64 | 0.67 | 0.61 | 0.21 | 1.47 | −1.06 |
| Education | ||||||
| Quintile 1 least | Reference | |||||
| Quintile 2 | 0.59 | 0.09 | 1.00 * | −0.93 | −0.89 | −0.90 |
| Quintile 3 | 0.60 | 0.35 | 0.77 | −0.27 | 0.22 | −0.72 |
| Quintile 4 | 0.89 * | 0.54 | 1.16 * | −1.25 | −0.62 | −1.82 * |
| Quintile 5 most | 1.14 ** | 0.76 * | 1.44 ** | −0.65 | 0.45 | −1.73 * |
| (b) Urban (N = 97) | ||||||
| Papua | Reference | |||||
| Java | 3.47 ** | 2.30 ** | 4.51 ** | 7.42 ** | 7.38 ** | 7.68 ** |
| Sumatera | 1.42 | 0.84 | 1.94 * | 0.62 | −0.09 | 1.44 |
| Kalimantan | 3.99 ** | 3.11 ** | 4.87 ** | 8.44 ** | 9.12 ** | 7.81 ** |
| Sulawesi | 3.74 ** | 3.07 ** | 4.27 ** | 3.75 | 4.51 | 3.21 |
| Income | ||||||
| Quintile 1 poor | Reference | |||||
| Quintile 2 | 1.15 | 0.26 | 2.14 | −3.13 | −2.96 | −3.34 |
| Quintile 3 | 1.17 | 0.20 | 2.21 | −1.65 | −1.43 | −1.95 |
| Quintile 4 | −0.46 | −1.09 | 0.24 | −4.08 | −4.28 | −3.99 |
| Quintile 5 rich | 0.13 | −0.41 | 0.78 | −3.43 | −2.69 | −4.28 |
| Education | ||||||
| Quintile 1 least | n/a | n/a | n/a | n/a | n/a | n/a |
| Quintile 2 | Reference | |||||
| Quintile 3 | −0.79 | −0.42 | −1.13 | 0.70 | 1.38 | 0.05 |
| Quintile 4 | −0.15 | −0.13 | −0.12 | −0.52 | −0.08 | −0.90 |
| Quintile 5 most | −0.21 | −0.23 | −0.18 | 1.96 | 2.51 | 1.48 |
| (c) Rural (N = 417) | ||||||
| Papua | Reference | |||||
| Java | 3.07 ** | 1.56 ** | 4.34 ** | 7.89 ** | 7.26 ** | 8.57 ** |
| Sumatera | 2.00 ** | 0.78 * | 3.15 ** | 1.34 | 0.16 | 2.65 ** |
| Kalimantan | 3.78 ** | 2.33 ** | 5.28 ** | 9.31 ** | 9.18 ** | 9.51 ** |
| Sulawesi | 2.74 ** | 1.39 ** | 4.00 ** | 3.92 ** | 3.48 ** | 4.38 ** |
| Income | ||||||
| Quintile 1 poor | Reference | |||||
| Quintile 2 | −0.28 | −0.43 | −0.12 | 2.27 ** | 1.93 * | 2.57 ** |
| Quintile 3 | −0.03 | −0.24 | 0.15 | 2.72 ** | 2.25 * | 3.12 ** |
| Quintile 4 | 0.66 | 0.19 | 1.13 | 1.81 * | 1.76 | 1.81 |
| Quintile 5 rich | 0.38 | 0.33 | 0.49 | 0.71 | 0.75 | 0.67 |
| Education | ||||||
| Quintile 1 least | Reference | |||||
| Quintile 2 | 0.49 | −0.03 | 0.92 | −0.88 | −0.89 | −0.79 |
| Quintile 3 | 0.61 | 0.30 | 0.84 | −0.06 | 0.20 | −0.27 |
| Quintile 4 | 0.72 | 0.33 | 1.05 | −0.76 | −0.52 | −0.92 |
| Quintile 5 most | 1.15 * | 0.74 * | 1.54 * | −0.90 | −0.14 | −1.66 |
References
- WHO. Hypertension Fact Sheets; WHO: Geneva, Switzerland, 2021. [Google Scholar]
- NIHRD. Report of Riskesdas; NIHRD: Jakarta, Indonesia, 2018. [Google Scholar]
- Hussain, M.A.; Al Mamun, A.; Reid, C.; Huxley, R.R. Prevalence, Awareness, Treatment and Control of Hypertension in Indonesian Adults Aged ≥40 Years: Findings from the Indonesia Family Life Survey (IFLS). PLoS ONE 2016, 11, e0160922. [Google Scholar] [CrossRef] [Green Version]
- Lang, T.; Lepage, B.; Schieber, A.-C.; Lamy, S.; Kelly-Irving, M. Social Determinants of Cardiovascular Diseases. Public Health Rev. 2011, 33, 601–622. [Google Scholar] [CrossRef] [Green Version]
- Busingye, D.; Arabshahi, S.; Subasinghe, A.K.; Evans, R.G.; Riddell, M.A.; Thrift, A.G. Do the socioeconomic and hypertension gradients in rural populations of low- and middle-income countries differ by geographical region? A systematic review and meta-analysis. Int. J. Epidemiol. 2014, 43, 1563–1577. [Google Scholar] [CrossRef] [PubMed] [Green Version]
- Lee, H.Y. Socioeconomic Disparities in the Prevalence, Diagnosis, and Control of Hypertension in the Context of a Universal Health Insurance System. J. Korean Med. Sci. 2017, 32, 561–567. [Google Scholar] [CrossRef] [PubMed]
- Guerrero-Díaz, D.V.; Hernández-Vásquez, A.; Montoya-Rivera, W.C.; Rojas-Roque, C.; Chacón Díaz, M.A.; Bendezu-Quispe, G. Undiagnosed hypertension in Peru: Analysis of associated factors and socioeconomic inequalities, 2019. Heliyon 2021, 7, e07516. [Google Scholar] [CrossRef]
- Ahmed, S.; Tariqujjaman, M.; Rahman, M.A.; Hasan, M.Z.; Hasan, M.M. Inequalities in the prevalence of undiagnosed hypertension among Bangladeshi adults: Evidence from a nationwide survey. Int. J. Equity Health 2019, 18, 33. [Google Scholar] [CrossRef] [PubMed] [Green Version]
- Haider, M.R.; Gupta, R. Das Inequalities in Undiagnosed Hypertension Among Adult Population in Bangladesh: Evidence from a Nationally Representative Survey. High Blood Press. Cardiovasc. Prev. 2021, 29, 57–64. [Google Scholar] [CrossRef]
- Hasan, M.M.; Tasnim, F.; Tariqujjaman, M.; Ahmed, S.; Cleary, A.; Mamun, A. Examining the prevalence, correlates and inequalities of undiagnosed hypertension in Nepal: A population-based cross-sectional study. BMJ Open 2020, 10, e037592. [Google Scholar] [CrossRef] [PubMed]
- Cho, K.H.; Lee, S.G.; Nam, C.M.; Lee, E.J.; Jang, S.Y.; Lee, S.H.; Park, E.C. Disparities in socioeconomic status and neighborhood characteristics affect all-cause mortality in patients with newly diagnosed hypertension in Korea: A nationwide cohort study, 2002–2013. Int. J. Equity Health 2016, 15, 3. [Google Scholar] [CrossRef] [PubMed] [Green Version]
- Wild, L.E.; Walters, M.; Powell, A.; James, K.A.; Corlin, L.; Alderete, T.L. County-Level Social Vulnerability Is Positively Associated with Cardiometabolic Disease in Colorado. Int. J. Environ. Res. Public Health 2022, 19, 2202. [Google Scholar] [CrossRef]
- Kershaw, K.N.; Diez Roux, A.V.; Carnethon, M.; Darwin, C.; Goff, D.C.; Post, W.; Schreiner, P.J.; Watson, K. Geographic variation in hypertension prevalence among blacks and whites: The multi-ethnic study of atherosclerosis. Am. J. Hypertens. 2010, 23, 46–53. [Google Scholar] [CrossRef] [PubMed]
- Morenoff, J.D.; House, J.S.; Hansen, B.B.; Williams, D.R.; Kaplan, G.A.; Hunte, H.E. Understanding social disparities in hypertension prevalence, awareness, treatment, and control: The role of neighborhood context. Soc. Sci. Med. 2007, 65, 1853–1866. [Google Scholar] [CrossRef]
- Li, Y.; Wang, L.; Feng, X.; Zhang, M.; Huang, Z.; Deng, Q.; Zhou, M.; Astell-Burt, T.; Wang, L. Geographical variations in hypertension prevalence, awareness, treatment and control in China: Findings from a nationwide and provincially representative survey. J. Hypertens. 2018, 36, 178–187. [Google Scholar] [CrossRef]
- Yin, M.; Augustin, B.; Fu, Z.; Yan, M.; Fu, A.; Yin, P. Geographic Distributions in Hypertension Diagnosis, Measurement, Prevalence, Awareness, Treatment and Control Rates among Middle-aged and Older Adults in China. Sci. Rep. 2016, 6, 37020. [Google Scholar] [CrossRef] [PubMed]
- Laohasiriwong, W.; Puttanapong, N.; Singsalasang, A. Prevalence of hypertension in Thailand: Hotspot clustering detected by spatial analysis. Geospat. Health 2018, 13, 20–27. [Google Scholar] [CrossRef] [PubMed]
- Kusuma, D.; Kusumawardani, N.; Ahsan, A.; Sebayang, S.K.; Amir, V.; Ng, N. On the verge of a chronic disease epidemic: Comprehensive policies and actions are needed in Indonesia. Int. Health 2019, 11, 422–424. [Google Scholar] [CrossRef] [PubMed] [Green Version]
- Ayuningtyas, D.; Hapsari, D.; Rachmalina, R.; Amir, V.; Rachmawati, R.; Kusuma, D. Geographic and Socioeconomic Disparity in Child Undernutrition across 514 Districts in Indonesia. Nutrients 2022, 14, 843. [Google Scholar] [CrossRef] [PubMed]
- Bella, A.; Akbar, M.T.; Kusnadi, G.; Herlinda, O.; Regita, P.A.; Kusuma, D. Socioeconomic and Behavioral Correlates of COVID-19 Infections among Hospital Workers in the Greater Jakarta Area, Indonesia: A Cross-Sectional Study. Int. J. Environ. Res. Public Health 2021, 18, 5048. [Google Scholar] [CrossRef] [PubMed]
- Hapsari, D.; Nainggolan, O.; Kusuma, D. Hotspots and Regional Variation in Smoking Prevalence Among 514 Districts in Indonesia: Analysis of Basic Health Research 2018. Glob. J. Health Sci. 2020, 12, 32. [Google Scholar] [CrossRef]
- Ayuningtyas, D.; Kusuma, D.; Amir, V.; Tjandrarini, D.H.; Andarwati, P. Disparities in Obesity Rates among Adults: Analysis of 514 Districts in Indonesia. Nutrients 2022, 14, 3332. [Google Scholar] [CrossRef] [PubMed]
- Megatsari, H.; Kusuma, D.; Ernawaty, E.; Putri, N.K. Geographic and Socioeconomic Inequalities in Delays in COVID-19 Vaccinations: A Cross-Sectional Study in Indonesia. Vaccines 2022, 10, 1857. [Google Scholar] [CrossRef] [PubMed]
- Oktamianti, P.; Kusuma, D.; Amir, V.; Tjandrarini, D.H.; Paramita, A. District-Level Inequalities in Hypertension among Adults in Indonesia: A Cross-Sectional Analysis by Sex and Age Group. Int. J. Environ. Res. Public Health 2022, 19, 13268. [Google Scholar] [CrossRef]
- Di Cesare, M.; Khang, Y.H.; Asaria, P.; Blakely, T.; Cowan, M.J.; Farzadfar, F.; Guerrero, R.; Ikeda, N.; Kyobutungi, C.; Msyamboza, K.P.; et al. Inequalities in non-communicable diseases and effective responses. Lancet 2013, 381, 585–597. [Google Scholar] [CrossRef] [PubMed] [Green Version]
- Zhou, B.; Carrillo-Larco, R.M.; Danaei, G.; Riley, L.M.; Paciorek, C.J.; Stevens, G.A.; Gregg, E.W.; Bennett, J.E.; Solomon, B.; Singleton, R.K.; et al. Worldwide trends in hypertension prevalence and progress in treatment and control from 1990 to 2019: A pooled analysis of 1201 population-representative studies with 104 million participants. Lancet 2021, 398, 957–980. [Google Scholar] [CrossRef]
- Mosca, I.; Kenny, R.A. Exploring differences in prevalence of diagnosed, measured and undiagnosed hypertension: The case of Ireland and the United States of America. Int. J. Public Health 2014, 59, 759–767. [Google Scholar] [CrossRef] [Green Version]
- Kusuma, D.; Cohen, J.; McConnell, M.; Berman, P. Can cash transfers improve determinants of maternal mortality? Evidence from the household and community programs in Indonesia. Soc. Sci. Med. 2016, 163, 10–20. [Google Scholar] [CrossRef]
- Kusuma, D.; Atanasova, P.; Pineda, E.; Anjana, R.M.; De Silva, L.; Hanif, A.A.M.; Hasan, M.; Hossain, M.M.; Indrawansa, S.; Jayamanne, D.; et al. Food environment and diabetes mellitus in South Asia: A geospatial analysis of health outcome data. PLoS Med. 2022, 19, e1003970. [Google Scholar] [CrossRef]
- Li, J.; Shi, L.; Li, S.; Xu, L.; Qin, W.; Wang, H. Urban-rural disparities in hypertension prevalence, detection, and medication use among Chinese Adults from 1993 to 2011. Int. J. Equity Health 2017, 16, 50. [Google Scholar] [CrossRef] [PubMed] [Green Version]
- Ibrahim, M.M.; Damasceno, A. Hypertension in developing countries. Lancet 2012, 380, 611–619. [Google Scholar] [CrossRef] [PubMed]
- Di Chiara, T.; Scaglione, A.; Corrao, S.; Argano, C.; Pinto, A.; Scaglione, R. Association Between Low Education and Higher Global Cardiovascular Risk. J. Clin. Hypertens. 2015, 17, 332–337. [Google Scholar] [CrossRef] [PubMed]
- Di Chiara, T.; Scaglione, A.; Corrao, S.; Argano, C.; Pinto, A.; Scaglione, R. Education and hypertension: Impact on global cardiovascular risk. Acta Cardiol. 2017, 72, 507–513. [Google Scholar] [CrossRef]
- Nasution, F.; Gurning, F.; Siregar, P.; Ahsan, A.; Kusuma, D. Implementation of the Smoke-Free Policy in Medan City, Indonesia: Compliance and Challenges. Int. J. Prev. Med. 2022, 13, 30. [Google Scholar] [CrossRef]
- Sebayang, S.K.; Dewi, D.M.S.K.; Puspikawati, S.I.; Astutik, E.; Melaniani, S.; Kusuma, D. Spatial analysis of outdoor tobacco advertisement around children and adolescents in Indonesia. Glob. Public Health 2021, 17, 420–430. [Google Scholar] [CrossRef] [PubMed]
- Sivasampu, S.; Teh, X.R.; Lim, Y.M.F.; Ong, S.M.; Ang, S.H.; Husin, M.; Khamis, N.; Jaafar, F.S.A.; Wong, W.J.; Shanmugam, S.; et al. Study protocol on Enhanced Primary Healthcare (EnPHC) interventions: A quasi-experimental controlled study on diabetes and hypertension management in primary healthcare clinics. Prim. Health Care Res. Dev. 2020, 21, E27. [Google Scholar] [CrossRef] [PubMed]
- Kusuma, D. Lessons from primary health care in the United Kingdom. Indones. J. Health Adm. J. Adm. Kesehat. Indones. 2021, 9, 4–8. [Google Scholar] [CrossRef]
- Adisasmito, W.; Amir, V.; Atin, A.; Megraini, A.; Kusuma, D. Geographic and socioeconomic disparity in cardiovascular risk factors in Indonesia: Analysis of the Basic Health Research 2018. BMC Public Health 2020, 20, 1004. [Google Scholar] [CrossRef] [PubMed]
- Atanasova, P.; Kusuma, D.; Pineda, E.; Anjana, R.M.; De Silva, L.; Hanif, A.A.M.; Hasan, M.; Hossain, M.M.; Indrawansa, S.; Jayamanne, D.; et al. Food environments and obesity: A geospatial analysis of the South Asia Biobank, income and sex inequalities. SSM—Popul. Health 2022, 17, 101055. [Google Scholar] [CrossRef] [PubMed]


| Poverty | Hypertension Prevalence (%) | ||||||
|---|---|---|---|---|---|---|---|
| Rates | Diagnosed | Undiagnosed | |||||
| (%) | All | Males | Females | All | Males | Females | |
| [1] | [2] | [3] | [4] | [5] | [6] | [7] | |
| Bali | 4.5 | 9.5 | 7.8 | 11.2 | 22.4 | 25.0 | 19.9 |
| South Kalimantan | 4.8 | 10.0 | 6.8 | 13.2 | 35.5 | 35.6 | 35.4 |
| Central Kalimantan | 5.0 | 8.4 | 5.8 | 11.3 | 27.6 | 26.9 | 28.4 |
| Jakarta | 5.0 | 10.1 | 7.7 | 12.5 | 25.3 | 27.1 | 23.5 |
| Banten | 5.3 | 8.6 | 5.9 | 11.4 | 22.8 | 22.4 | 23.2 |
| Bangka Belitung | 5.4 | 8.3 | 4.7 | 12.3 | 23.2 | 23.0 | 23.4 |
| West Sumatera | 6.6 | 7.2 | 5.2 | 9.2 | 19.8 | 18.7 | 20.9 |
| North Kalimantan | 7.0 | 10.5 | 7.3 | 14.1 | 24.8 | 26.3 | 23.0 |
| East Kalimantan | 7.1 | 10.6 | 8.2 | 13.2 | 30.6 | 31.8 | 29.3 |
| Riau Islands | 7.6 | 8.5 | 5.8 | 11.5 | 19.5 | 21.7 | 17.3 |
| Jambi | 7.8 | 7.4 | 5.1 | 9.8 | 22.7 | 21.5 | 23.9 |
| North Maluku | 7.9 | 5.7 | 4.0 | 7.5 | 20.7 | 20.3 | 21.2 |
| West Java | 7.9 | 9.7 | 6.3 | 13.1 | 31.2 | 30.5 | 32.0 |
| West Kalimantan | 8.1 | 8.1 | 6.1 | 10.3 | 30.2 | 30.0 | 30.4 |
| North Sulawesi | 8.5 | 13.2 | 9.5 | 17.0 | 23.7 | 25.5 | 21.7 |
| Riau | 8.8 | 8.4 | 5.9 | 11.0 | 22.6 | 21.9 | 23.4 |
| South Sulawesi | 9.8 | 7.1 | 4.5 | 9.4 | 26.1 | 24.9 | 27.3 |
| West Sulawesi | 10.3 | 6.6 | 5.1 | 8.1 | 29.7 | 28.6 | 30.7 |
| East Java | 10.9 | 8.0 | 5.2 | 10.6 | 29.7 | 28.6 | 30.7 |
| Central Java | 10.9 | 8.1 | 5.6 | 10.5 | 30.6 | 30.1 | 31.1 |
| North Sumatera | 11.3 | 5.5 | 3.8 | 7.1 | 24.8 | 24.7 | 25.0 |
| Lampung | 12.6 | 8.0 | 5.1 | 10.9 | 23.2 | 21.0 | 25.4 |
| Yogyakarta | 12.7 | 10.7 | 7.3 | 14.0 | 24.5 | 26.8 | 22.3 |
| Southeast Sulawesi | 13.0 | 6.2 | 3.9 | 8.4 | 24.9 | 25.6 | 24.2 |
| South Sumatera | 13.1 | 7.3 | 5.2 | 9.5 | 24.4 | 22.7 | 26.2 |
| Central Sulawesi | 14.6 | 8.7 | 6.3 | 11.2 | 23.5 | 22.2 | 24.9 |
| West Nusa Tenggara | 14.8 | 7.2 | 5.2 | 9.0 | 22.1 | 19.3 | 24.6 |
| Bengkulu | 15.0 | 8.4 | 5.5 | 11.3 | 21.5 | 20.4 | 22.6 |
| Aceh | 16.4 | 9.4 | 6.3 | 12.3 | 19.5 | 18.9 | 20.0 |
| Gorontalo | 16.8 | 10.0 | 7.2 | 12.8 | 22.7 | 21.0 | 24.4 |
| Maluku | 21.8 | 5.0 | 4.0 | 5.9 | 25.0 | 25.2 | 24.8 |
| East Nusa Tenggara | 22.0 | 5.4 | 4.0 | 6.7 | 23.6 | 23.3 | 23.9 |
| West Papua | 26.5 | 7.4 | 5.6 | 9.4 | 20.6 | 22.2 | 18.9 |
| Papua | 29.4 | 4.4 | 3.7 | 5.2 | 19.4 | 20.3 | 18.4 |
| Average | 8.2 | 5.8 | 10.6 | 24.7 | 24.5 | 24.8 | |
| All | Urban | Rural | Difference | |||||
|---|---|---|---|---|---|---|---|---|
| n | % | n | % | n | % | % | ||
| [1] | [2] | [3] | [4] | [5] | [6] | [7] = [4,5,6] | ||
| (a) Characteristics (#) | ||||||||
| Sample size district | 514 | 100% | 97 | 100% | 417 | 100% | 0% | |
| Region | ||||||||
| Papua | 95 | 18.5% | 9 | 9.3% | 86 | 20.6% | 11.3% | |
| Java | 128 | 24.9% | 35 | 36.1% | 93 | 22.3% | −13.8% | |
| Sumatera | 154 | 30.0% | 33 | 34.0% | 121 | 29.0% | −5.0% | |
| Kalimantan | 56 | 10.9% | 9 | 9.3% | 47 | 11.3% | 2.0% | |
| Sulawesi | 81 | 15.8% | 11 | 11.3% | 70 | 16.8% | 5.4% | |
| 514 | 97 | 417 | ||||||
| Income/poverty | ||||||||
| Q1 poor | 102 | 19.8% | 3 | 3.1% | 99 | 23.7% | 20.6% | |
| Q2 | 103 | 20.0% | 5 | 5.2% | 98 | 23.5% | 18.3% | |
| Q3 | 103 | 20.0% | 13 | 13.4% | 90 | 21.6% | 8.2% | |
| Q4 | 103 | 20.0% | 22 | 22.7% | 81 | 19.4% | −3.3% | |
| Q5 rich | 103 | 20.0% | 54 | 55.7% | 49 | 11.8% | −43.9% | |
| 514 | 97 | 417 | ||||||
| Education | ||||||||
| Q1 least | 103 | 20.0% | 0 | 0.0% | 103 | 24.7% | 24.7% | |
| Q2 | 103 | 20.0% | 11 | 11.3% | 92 | 22.1% | 10.7% | |
| Q3 | 103 | 20.0% | 17 | 17.5% | 86 | 20.6% | 3.1% | |
| Q4 | 103 | 20.0% | 29 | 29.9% | 74 | 17.7% | −12.2% | |
| Q5 most | 102 | 19.8% | 40 | 41.2% | 62 | 14.9% | −26.4% | |
| 514 | 97 | 417 | ||||||
| (b) Hypertension (%) | ||||||||
| Diagnosed all | n/a | 7.9% | n/a | 8.9% | n/a | 7.6% | 1.3% * | |
| Diagnosed males | n/a | 5.5% | n/a | 6.5% | n/a | 5.3% | 1.2% * | |
| Diagnosed females | n/a | 10.3% | n/a | 11.2% | n/a | 10.1% | 1.1% * | |
| Undiagnosed all | n/a | 25.4% | n/a | 24.7% | n/a | 25.5% | −0.8% | |
| Undiagnosed males | n/a | 24.9% | n/a | 26.1% | n/a | 24.7% | 1.4% | |
| Undiagnosed females | n/a | 25.8% | n/a | 23.4% | n/a | 26.4% | −3.0% * | |
| All Districts (n = 514) | Urban (n = 97) | Rural (n = 417) | |||||||||||||||||
|---|---|---|---|---|---|---|---|---|---|---|---|---|---|---|---|---|---|---|---|
| Diagnosed | Undiagnosed | Diagnosed | Undiagnosed | Diagnosed | Undiagnosed | ||||||||||||||
| All | Males | Females | All | Males | Females | All | Males | Females | All | Males | Females | All | Males | Females | All | Males | Females | ||
| [1] | [2] | [3] | [4] | [5] | [6] | [7] | [8] | [9] | [10] | [11] | [12] | [13] | [14] | [15] | [16] | [17] | [18] | ||
| Region | |||||||||||||||||||
| Papua | 5.3% | 4.2% | 6.6% | 21.0% | 20.9% | 21.1% | 6.6% | 5.0% | 8.2% | 21.7% | 23.2% | 20.2% | 5.2% | 4.1% | 6.4% | 20.9% | 20.6% | 21.2% | |
| Sulawesi | 8.4% | 5.8% | 11.0% | 25.6% | 25.2% | 26.0% | 9.9% | 7.7% | 12.0% | 23.4% | 25.4% | 21.4% | 8.1% | 5.4% | 10.8% | 25.9% | 25.1% | 26.7% | |
| Kalimantan | 9.5% | 6.8% | 12.3% | 30.6% | 30.6% | 30.5% | 10.1% | 7.8% | 12.5% | 28.3% | 30.6% | 25.9% | 9.3% | 6.7% | 12.3% | 31.0% | 30.6% | 31.4% | |
| Sumatera | 7.7% | 5.2% | 10.3% | 22.8% | 21.9% | 23.8% | 8.0% | 5.8% | 10.2% | 21.9% | 22.7% | 21.2% | 7.7% | 5.1% | 10.3% | 23.1% | 21.7% | 24.5% | |
| Java | 8.9% | 6.1% | 11.6% | 29.3% | 29.0% | 29.6% | 9.6% | 7.0% | 12.2% | 27.6% | 29.1% | 26.3% | 8.6% | 5.8% | 11.3% | 29.9% | 29.0% | 30.8% | |
| Absolute | 3.6% | 1.9% | 5.0% | 8.3% | 8.1% | 8.5% | 3.0% | 2.0% | 4.0% | 5.9% | 5.9% | 6.1% | 3.4% | 1.7% | 4.9% | 9.0% | 8.4% | 9.6% | |
| Relative | 1.68 | 1.45 | 1.76 | 1.40 | 1.39 | 1.40 | 1.45 | 1.40 | 1.49 | 1.27 | 1.25 | 1.30 | 1.65 | 1.41 | 1.77 | 1.43 | 1.41 | 1.45 | |
| Income | |||||||||||||||||||
| Q1 poor | 6.2% | 4.7% | 7.9% | 21.7% | 21.3% | 22.1% | 7.2% | 5.8% | 8.5% | 23.8% | 24.4% | 23.3% | 6.2% | 4.7% | 7.9% | 21.6% | 21.2% | 22.1% | |
| Q2 | 7.3% | 4.9% | 9.8% | 25.3% | 24.4% | 26.2% | 9.0% | 6.5% | 11.4% | 22.9% | 23.6% | 22.2% | 7.3% | 4.9% | 9.7% | 25.4% | 24.4% | 26.4% | |
| Q3 | 8.1% | 5.5% | 10.7% | 27.6% | 26.6% | 28.5% | 8.5% | 6.2% | 10.9% | 23.3% | 24.2% | 22.5% | 8.1% | 5.4% | 10.7% | 28.2% | 26.9% | 29.4% | |
| Q4 | 8.6% | 5.8% | 11.4% | 25.9% | 25.4% | 26.4% | 8.5% | 6.1% | 10.9% | 24.4% | 25.2% | 23.6% | 8.6% | 5.7% | 11.5% | 26.3% | 25.4% | 27.2% | |
| Q5 rich | 9.0% | 6.6% | 11.5% | 26.4% | 27.1% | 25.7% | 9.2% | 6.9% | 11.5% | 25.4% | 27.2% | 23.6% | 8.9% | 6.3% | 11.6% | 27.5% | 27.0% | 28.1% | |
| Absolute | 2.8% | 1.9% | 3.6% | 4.7% | 5.8% | 3.6% | 2.0% | 1.1% | 3.0% | 1.6% | 2.8% | 0.3% | 2.7% | 1.6% | 3.7% | 5.9% | 5.8% | 6.0% | |
| Relative | 1.45 | 1.40 | 1.46 | 1.22 | 1.27 | 1.16 | 1.28 | 1.19 | 1.35 | 1.07 | 1.11 | 1.01 | 1.44 | 1.34 | 1.47 | 1.27 | 1.27 | 1.27 | |
| Education | |||||||||||||||||||
| Q1 least | 6.9% | 5.0% | 8.9% | 25.8% | 25.1% | 26.6% | n/a | n/a | n/a | n/a | n/a | n/a | 6.9% | 5.0% | 8.9% | 25.8% | 25.1% | 26.6% | |
| Q2 | 8.0% | 5.3% | 10.6% | 25.6% | 24.8% | 26.4% | 10.0% | 7.6% | 12.4% | 25.2% | 26.6% | 23.8% | 7.7% | 5.1% | 10.4% | 25.7% | 24.6% | 26.7% | |
| Q3 | 7.8% | 5.5% | 10.2% | 25.8% | 25.4% | 26.2% | 8.5% | 6.5% | 10.6% | 25.5% | 27.2% | 23.7% | 7.7% | 5.3% | 10.1% | 25.9% | 25.0% | 26.7% | |
| Q4 | 8.2% | 5.7% | 10.6% | 24.6% | 24.3% | 24.8% | 9.1% | 6.7% | 11.5% | 23.9% | 25.2% | 22.6% | 7.8% | 5.3% | 10.3% | 24.8% | 23.9% | 25.7% | |
| Q5 most | 8.5% | 5.9% | 11.1% | 25.1% | 25.2% | 25.0% | 8.5% | 6.2% | 10.8% | 24.9% | 26.1% | 23.8% | 8.5% | 5.8% | 11.2% | 25.2% | 24.6% | 25.8% | |
| Absolute | 1.6% | 0.9% | 2.2% | −0.7% | 0.1% | −1.6% | −1.5% | −1.4% | −1.6% | −0.3% | −0.5% | 0.0% | 1.6% | 0.8% | 2.3% | −0.6% | −0.5% | −0.8% | |
| Relative | 1.23 | 1.18 | 1.25 | 0.97 | 1.00 | 0.94 | 0.85 | 0.82 | 0.87 | 0.99 | 0.98 | 1.00 | 1.23 | 1.16 | 1.26 | 0.98 | 0.98 | 0.97 | |
Disclaimer/Publisher’s Note: The statements, opinions and data contained in all publications are solely those of the individual author(s) and contributor(s) and not of MDPI and/or the editor(s). MDPI and/or the editor(s) disclaim responsibility for any injury to people or property resulting from any ideas, methods, instructions or products referred to in the content. |
© 2023 by the authors. Licensee MDPI, Basel, Switzerland. This article is an open access article distributed under the terms and conditions of the Creative Commons Attribution (CC BY) license (https://creativecommons.org/licenses/by/4.0/).
Share and Cite
Oktamianti, P.; Kusuma, D.; Amir, V.; Tjandrarini, D.H.; Paramita, A. Does the Disparity Patterning Differ between Diagnosed and Undiagnosed Hypertension among Adults? Evidence from Indonesia. Healthcare 2023, 11, 816. https://doi.org/10.3390/healthcare11060816
Oktamianti P, Kusuma D, Amir V, Tjandrarini DH, Paramita A. Does the Disparity Patterning Differ between Diagnosed and Undiagnosed Hypertension among Adults? Evidence from Indonesia. Healthcare. 2023; 11(6):816. https://doi.org/10.3390/healthcare11060816
Chicago/Turabian StyleOktamianti, Puput, Dian Kusuma, Vilda Amir, Dwi Hapsari Tjandrarini, and Astridya Paramita. 2023. "Does the Disparity Patterning Differ between Diagnosed and Undiagnosed Hypertension among Adults? Evidence from Indonesia" Healthcare 11, no. 6: 816. https://doi.org/10.3390/healthcare11060816