1. Introduction
Liver and lung cancer are the two most prevalent cancers among Asian men, and Taiwan is no exception. Cancer is the leading cause of death in Taiwan, and according to its Ministry of Health and Welfare, lung and liver cancer have always remained the top two leading types of cancers, despite falling cancer rates.
The current clinical practice for liver cancer is to treat tumors larger than 1 cm. Before initiating treatment, the degree of cirrhosis is determined based on five clinical indicators, as it is a crucial indicator for selecting the appropriate course of treatment. The Barcelona clinic liver cancer (“BCLC”) staging system is performed according to both the degree of cirrhosis (using the Child–Pugh score) and the daily physical status (using the Eastern Cooperative Oncology Group performance status scale (“ECOG PS”)), along with other indicators. A simplified and summarized BCLC staging is as follows [
1]:
Stage 0 (very early stage)
Stages A, B and C (early, intermediate, and advanced, respectively)
- ○
ECOG PS 0–2
- ○
Child-Pugh A to C
Stage D (end-stage)
- ○
ECOG PS > 2
- ○
Child-Pugh C
The hepatic artery provides 90–95% of blood and nutrition required for the survival and growth of liver cancer cells. In hepatic artery embolization, the hepatic artery is blocked to stop the blood supply to liver cancer cells; the resulting hypoxia causes shrinkage of the tumor. During embolization, chemotherapy drugs can be delivered through the catheter directly into the hepatic artery. Hepatic artery embolization is highly effective for patients with liver cancer who are not candidates for surgery, and there are lower residual levels of drugs than after conventional chemotherapy.
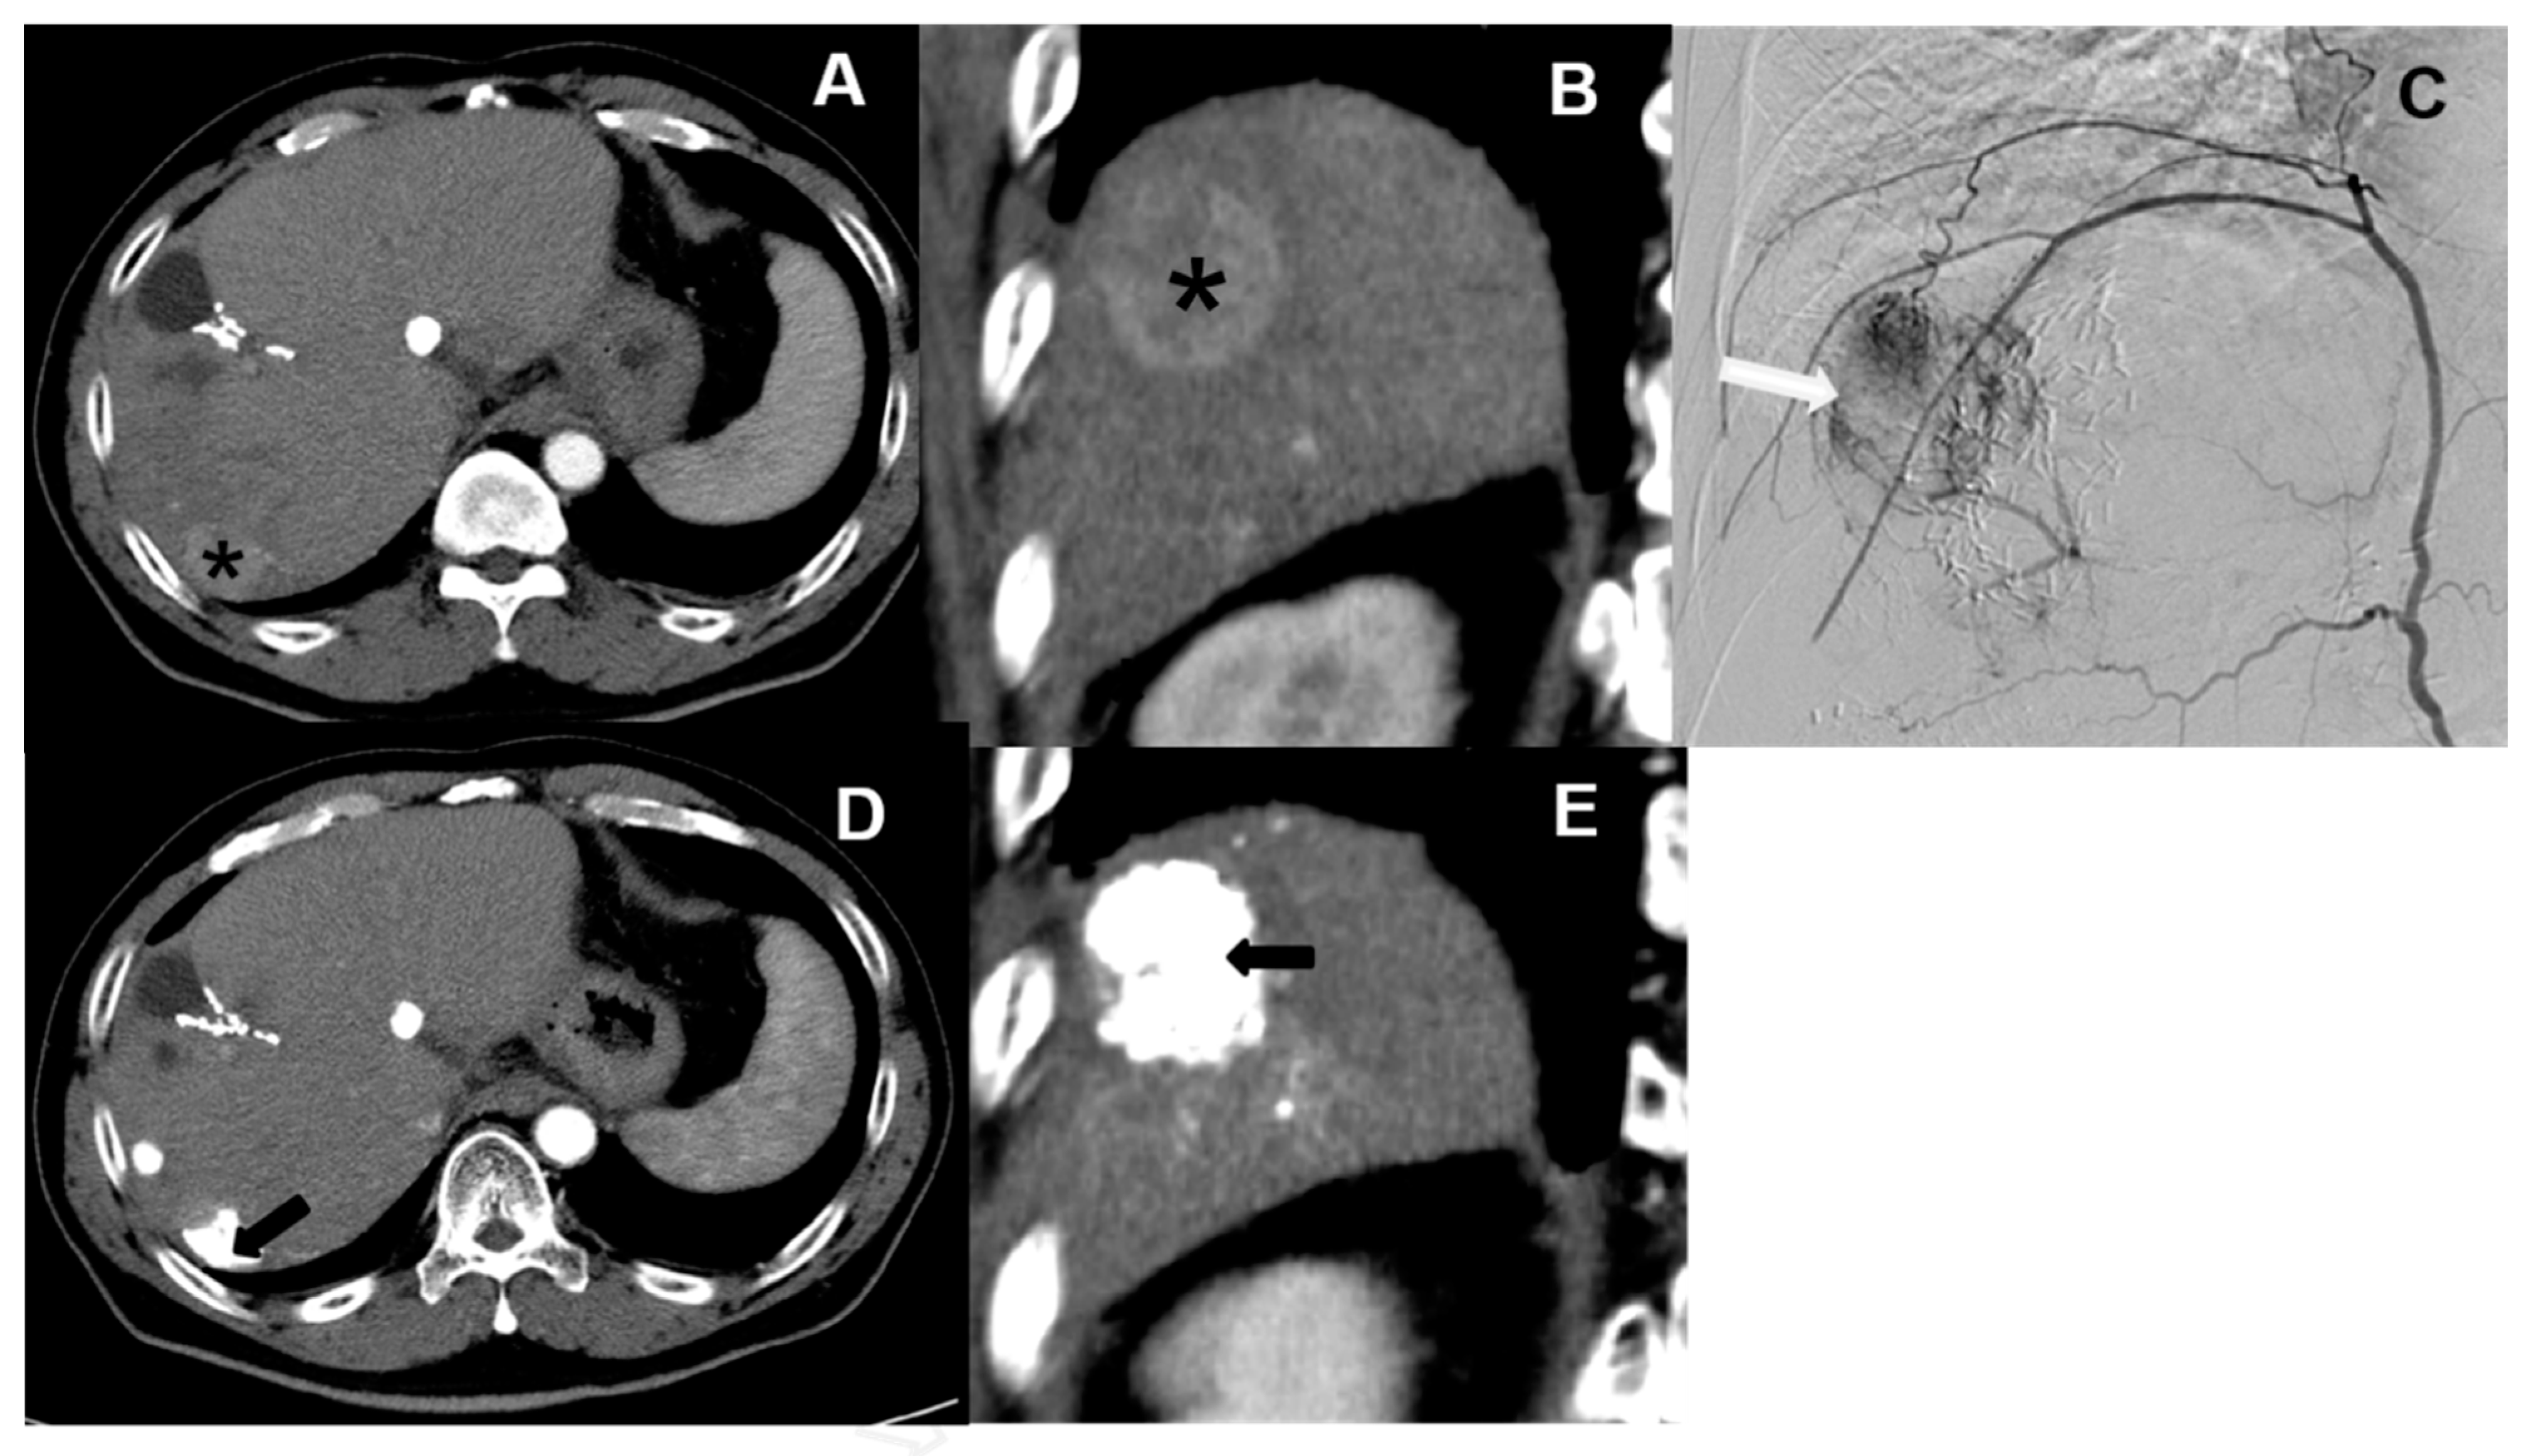
Currently, hepatic artery embolization is performed using two main treatment methods, both involving trans-catheter arterial chemoembolization (“TACE”). Conventional trans-catheter arterial chemoembolization (“cTACE”) is the older of the two methods (
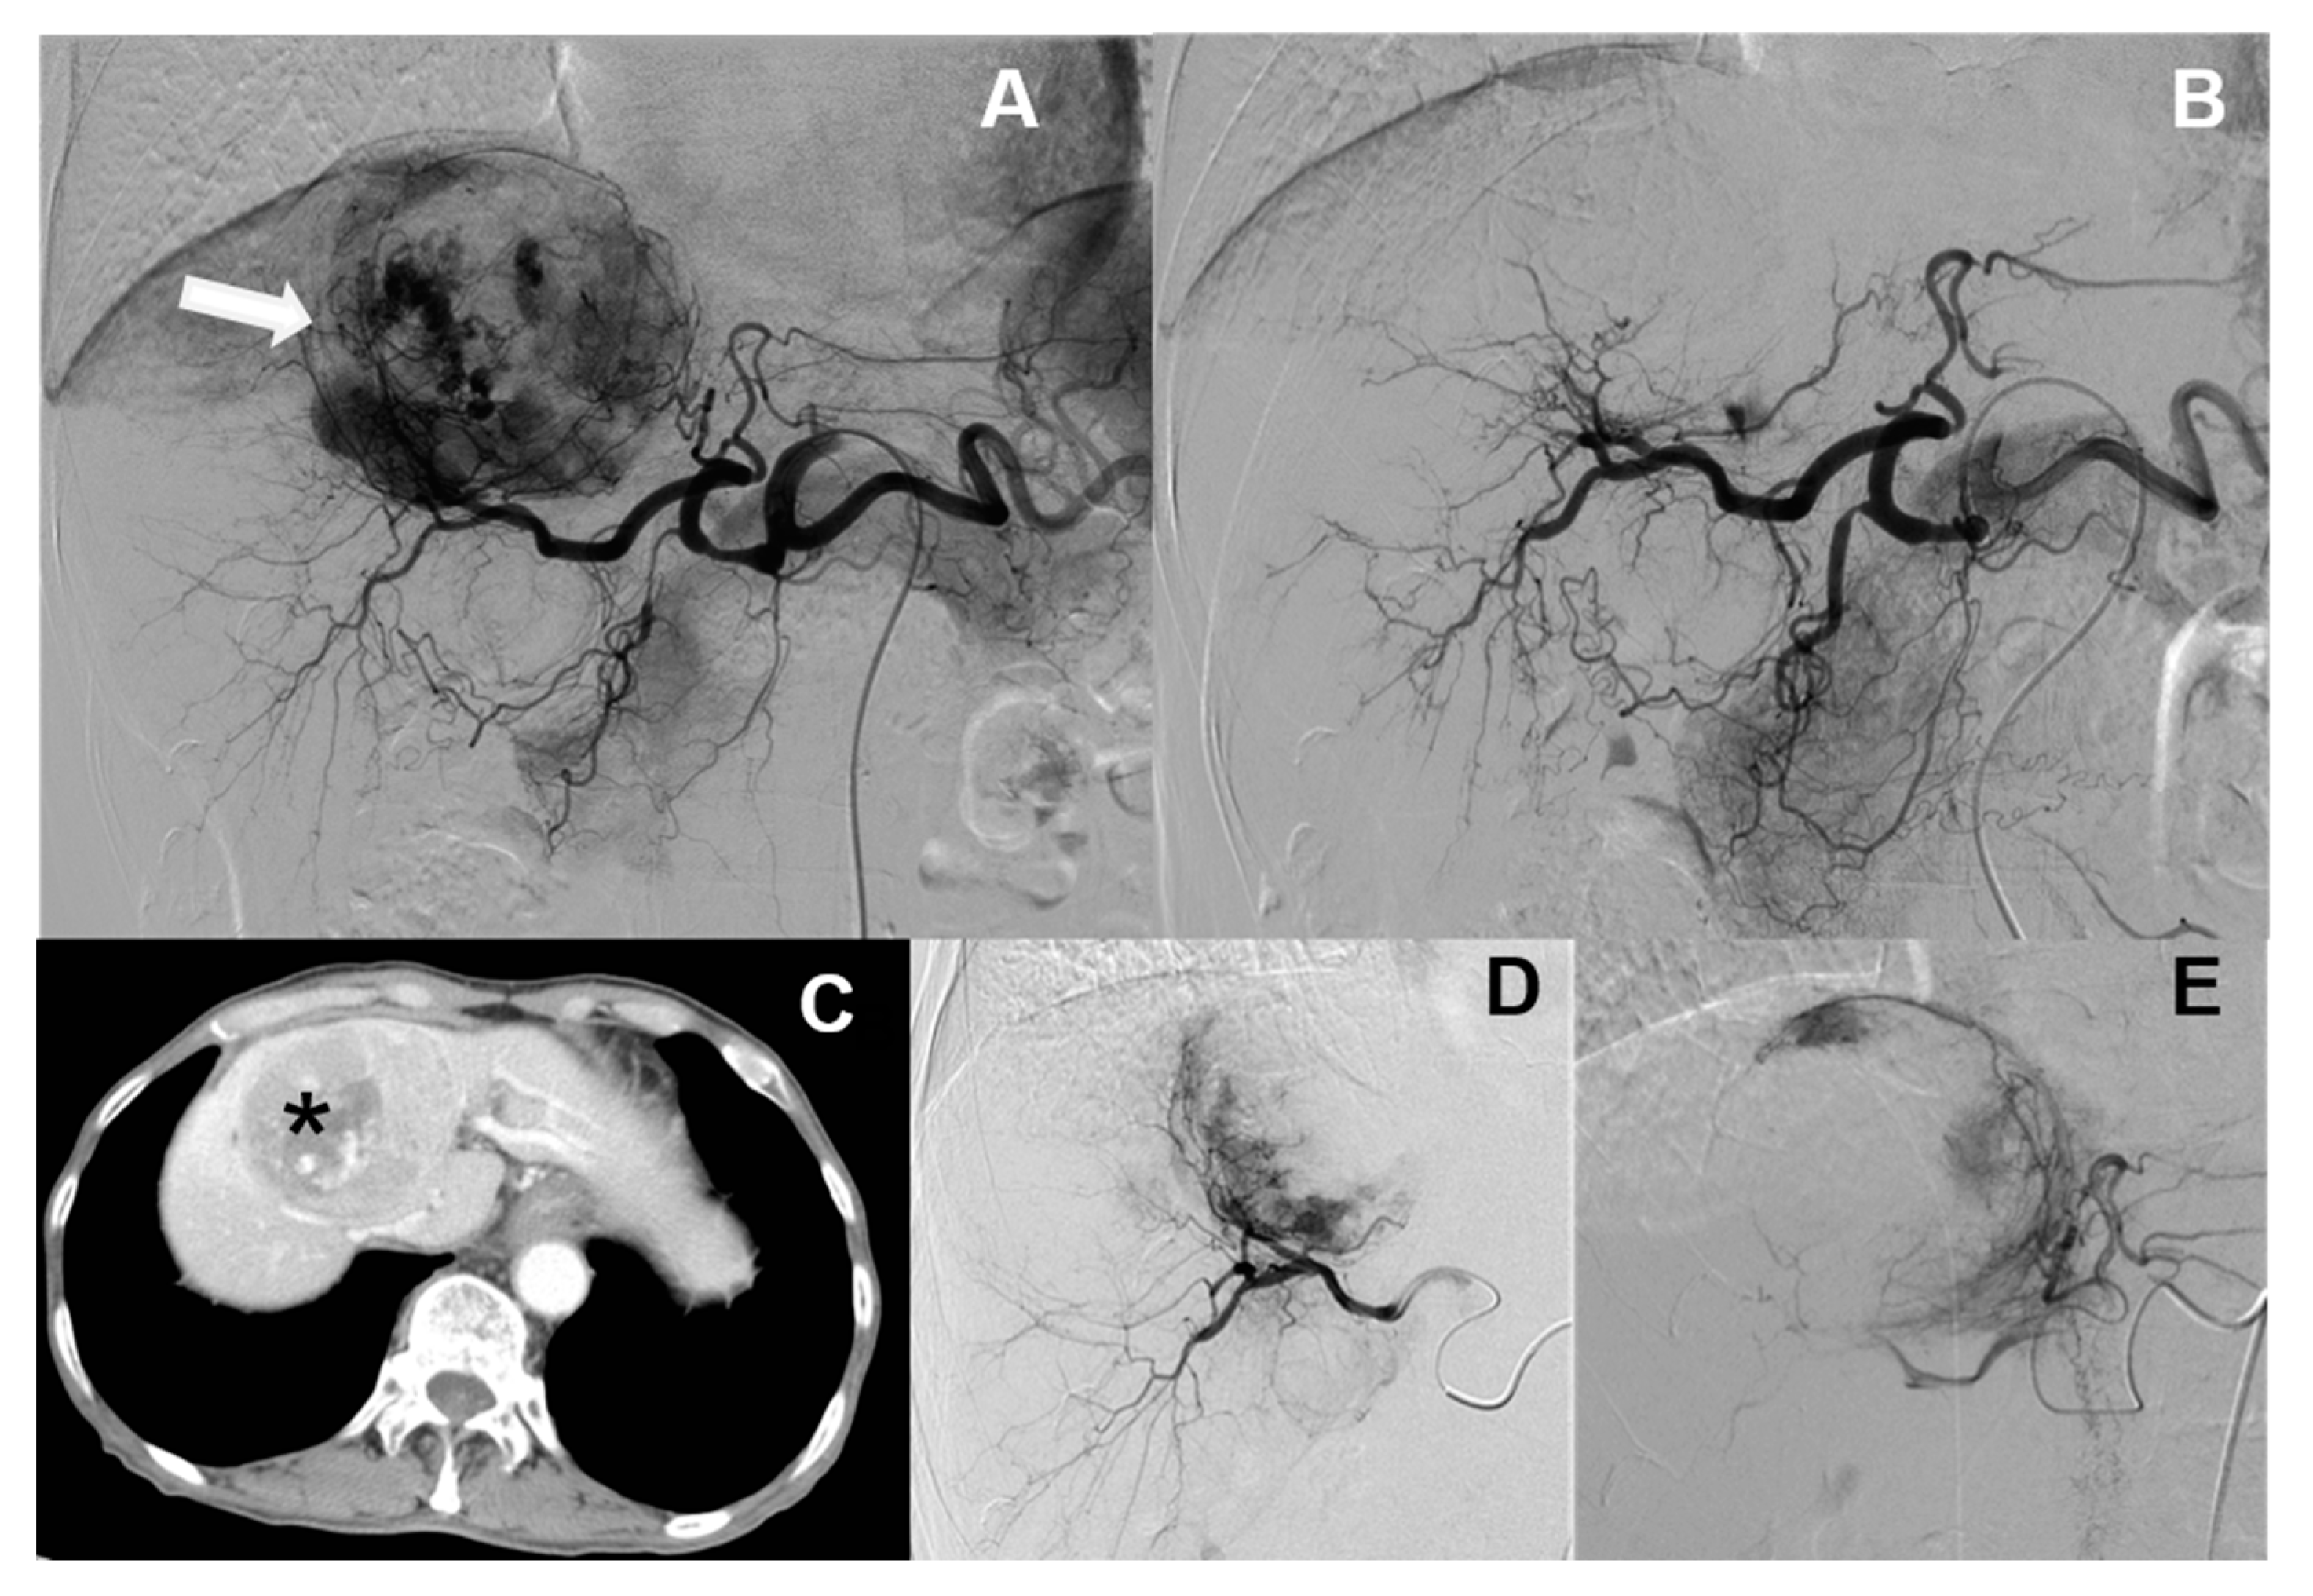
Figure 1), whereas microsphere-loaded arterial embolization—called “DC bead TACE”, after the drug-eluting microbeads employed—is the newer (
Figure 2). DC bead TACE involves the use of a microsphere-loaded drug that prolongs effective treatment times and results in better therapeutic outcomes [
2]. Compared with cTACE, DC bead TACE results in better therapeutic response and delayed tumor progression; however, no significant difference has been noted in liver-related toxicity. Song et al. demonstrated the superior performance of arterial embolization performed using DC beads [
3], and Ashrafi et al. indicated that DC bead TACE can result in the same tumor response as cTACE [
4]. Although the latter study combined the clinical effectiveness of DC beads with that of cTACE, additional large-scale randomized controlled trials are still needed.
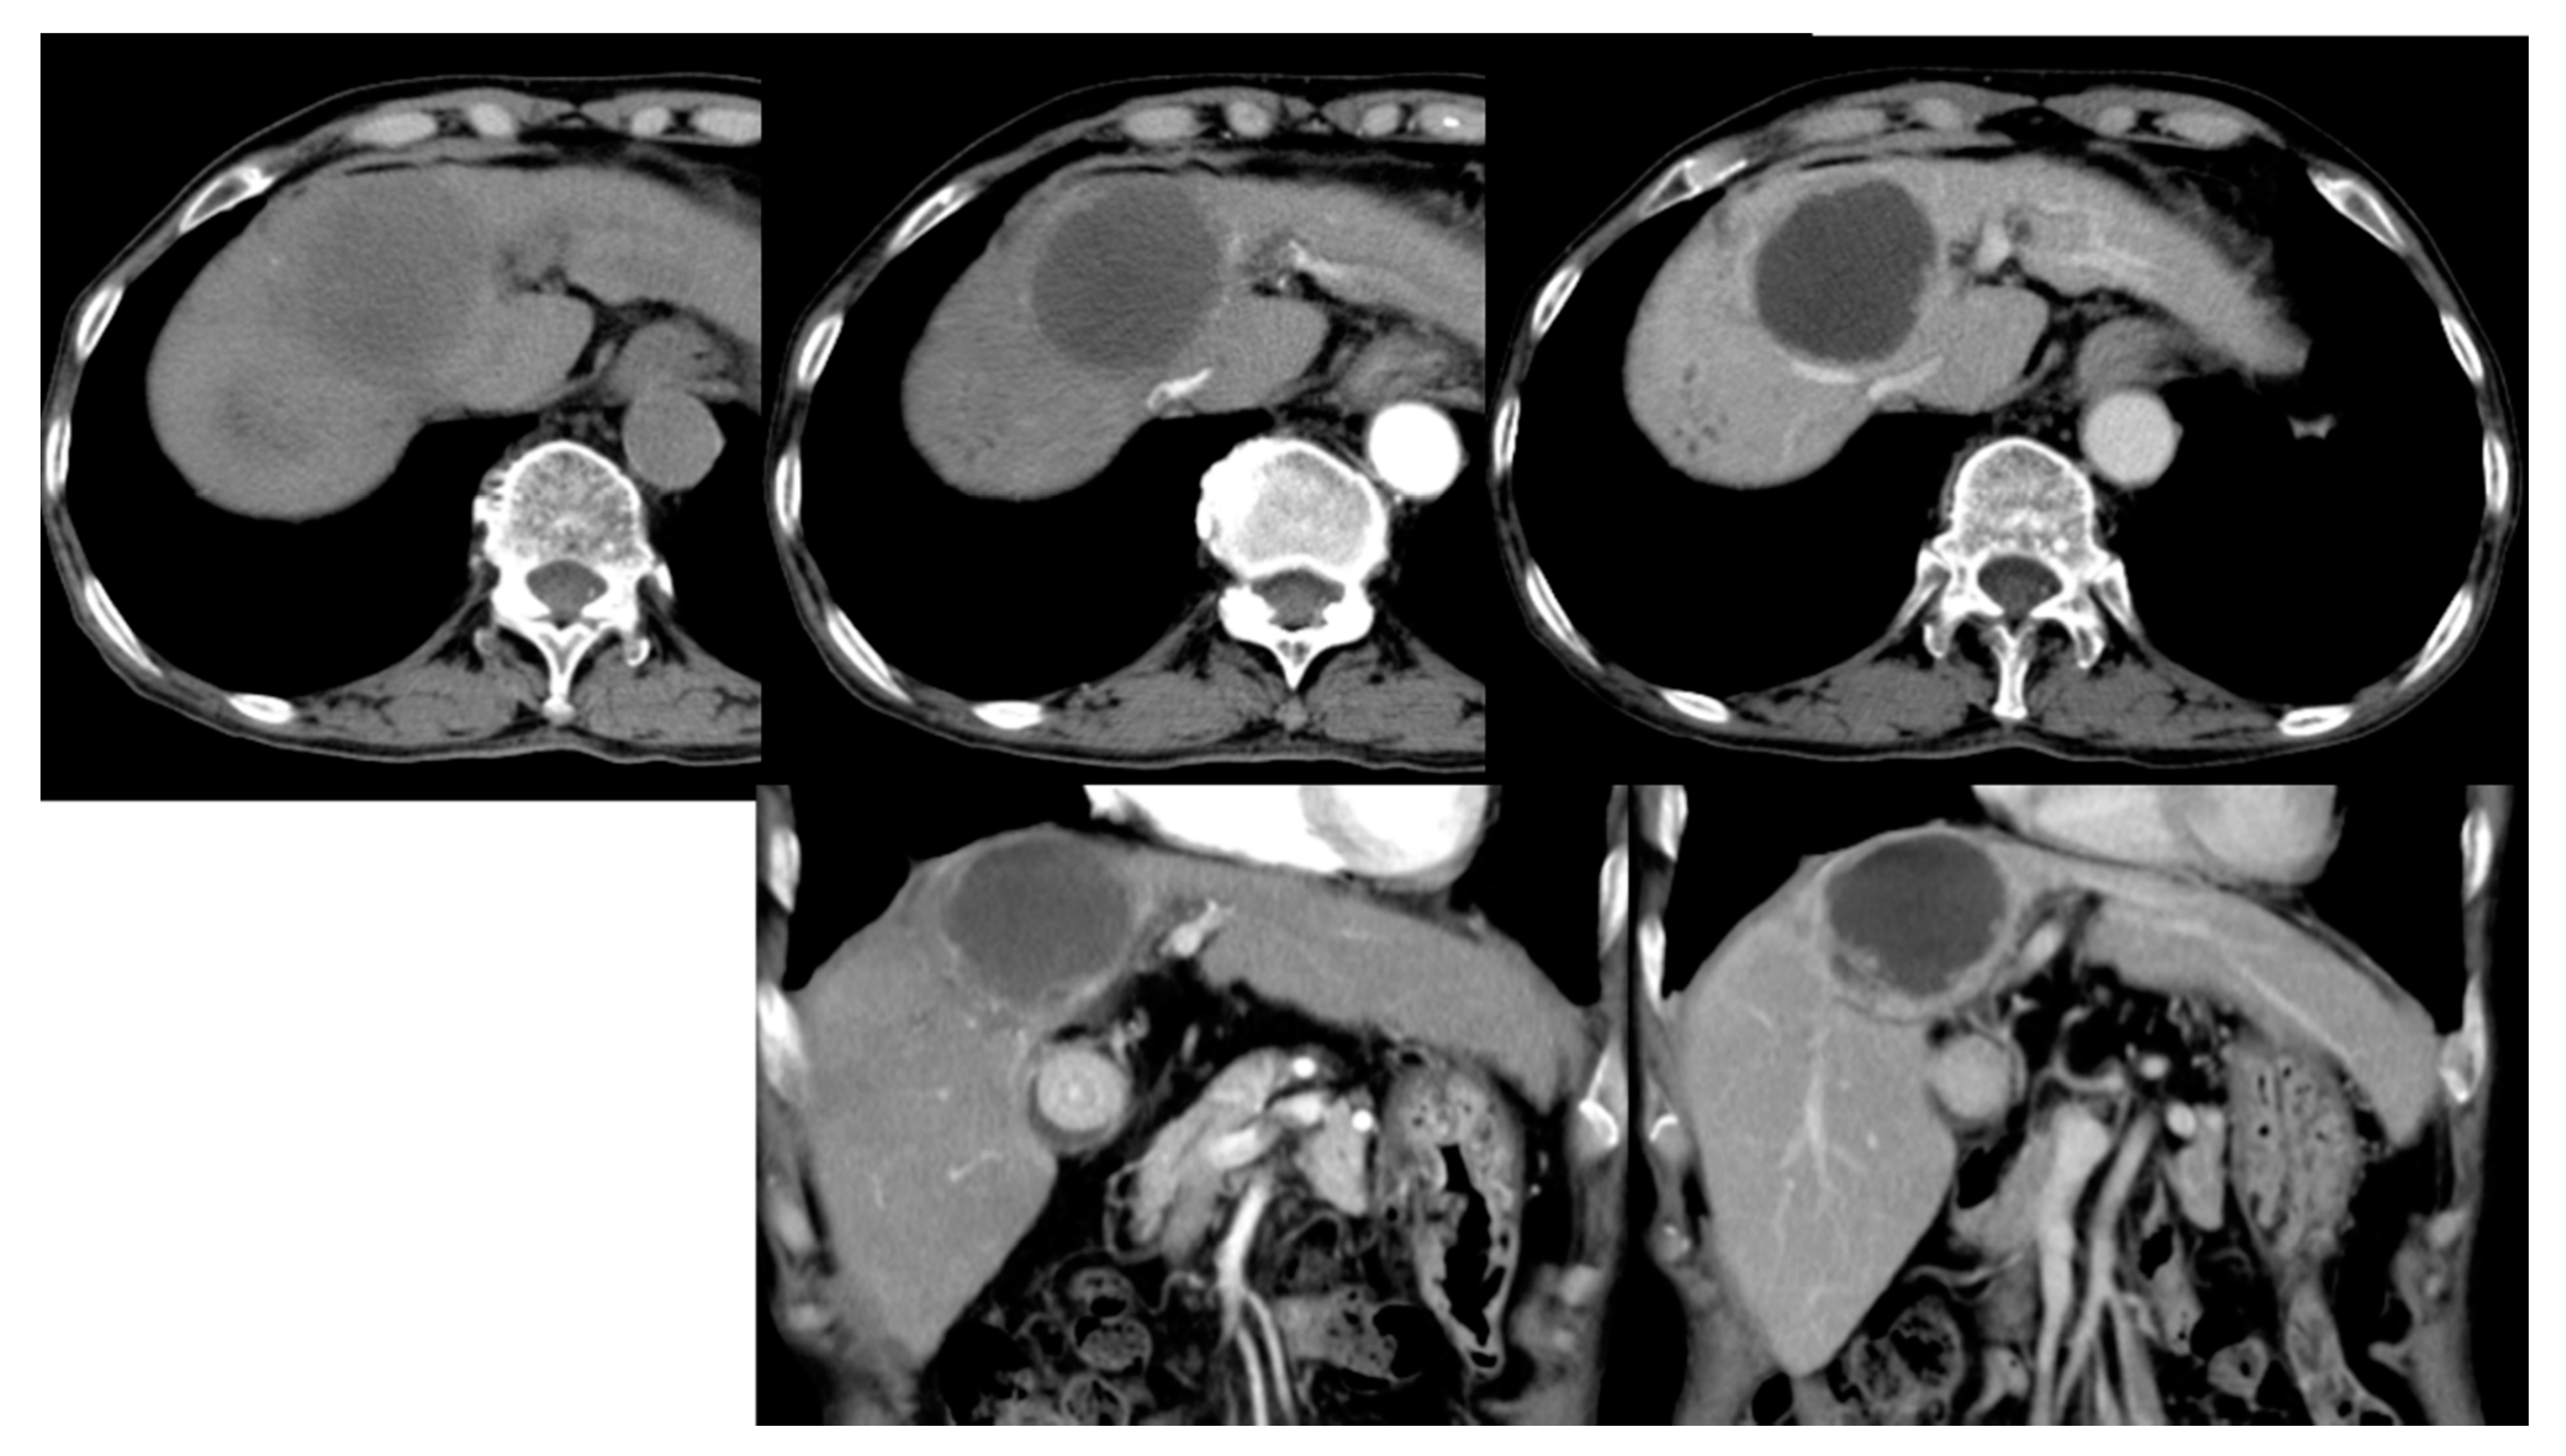
According to the literature, DC bead TACE is more effective for cTACE-refractory hepatocellular carcinoma (“HCC”), particularly when the tumor is small and delayed or enhanced during angiogenesis (
Figure 3). For example, Lammer et al. [
5] compared the clinical efficacies of cTACE vs. DC bead TACE, both using doxorubicin, in 212 cancer patients with Child–Pugh A/B cirrhosis and large and/or multiple nodules and other inoperable cancer patients [
5]. Overall, they reported that in terms of disease control, DC bead TACE was more effective than cTACE in four patients and that those adverse drug reactions were more severe after cTACE than after DC bead TACE. However, according to the chi-square analysis, the DC beads were found to have significant advantages only under certain conditions, such as a specific Child–Pugh rating and ECOG PS status, if prior curative treatments had been undergone, and in the presence of bilobar disease.
Evaluating the clinical effectiveness of chemotherapy includes a host of other variables, complicating the analysis. For instance, Muggia et al. compared the effectiveness of cisplatin-alone versus paclitaxel-alone versus combined cisplatin and paclitaxel chemotherapy in patients with late-stage ovarian cancer [
6]. After patients received a 6-week treatment course, the complete and partial responses were measured every 3 weeks to determine the treatment effectiveness. Among the indicators and effects examined were neutropenia, fever, alopecia, anemia, thrombocytopenia, neurotoxicity, nephrotoxicity and gastrointestinal toxicity.
Therefore, due to the level of complexity of chemotherapy and its effects on the body, whether DC beads can completely replace cTACE in terms of curative effects remains unclear. Thus, the evaluation of which therapy is more effective under what conditions, and the identification of these conditions, can help in developing practical treatment guidelines and potential new therapies.
However, the standard practice in medical studies is to use traditional statistical analysis to determine drug effectiveness, death rates, etc. While traditional statistical analysis is adequate for finding relationships between variables and how significant those relationships are, it is not particularly well-suited for modeling complex systems in a way that is predictive in a practical sense. Rather, this is the purview of data mining and data exploration.
Data mining and exploration are a series of processes to explore the added value of information from a database by extracting and recognizing what is important or interesting in ways that cannot be known by traditional means. Data mining is also commonly known as “knowledge discovery in databases” (“KDD”) and is an important tool for manipulating data to extract important information according to the user’s purpose.
Data mining has become especially popular in recent years because of its ability to convert large amounts of data into some useful information and knowledge. This has been particularly useful in scientific research that employs large databases. The main difference between data mining/exploration and traditional statistics is the amount of data processed, with the former being very well-suited towards large databases. Data mining and exploration can create powerful predictive models of complex systems with large data sets.
The application of data mining to HCC is relatively new. A PubMed search of the terms “HCC”, “liver cancer” and “data mining” yielded less than 200 results at the time of writing. The vast majority of the literature on this matter is concerned with the application of data mining to gene expression and regulation [
7,
8], biomarkers [
9,
10] and predictors [
11,
12], but relatively little work has been done on the effectiveness of HCC treatments. There are a few studies regarding medications such as lenvatinib [
13] and sorafenib [
14], but the data-mining studies on the effectiveness of other modes of treatment are still rare.
Prior studies have shown that DC bead TACE has advantages over cTACE only under certain conditions, but due to the complexity of chemotherapy studies, clear guidelines advising the use of one over the other and under what circumstances are still lacking. This is likely due to the complexity of both HCC and its response to different modes of treatment, both of which may remain relatively opaque to traditional statistical methods. This study aims to use clinical indicators and data exploration to re-examine the effectiveness of cTACE and DC bead TACE and verify the current clinical data on liver cancer arterial embolization. This study refers to the literature on cancer prognosis [
15] and employs decision trees, neural networks and logistic regressions to predict and compare data.
2. Methods and Materials
The present work is a retrospective study and was approved by the Institutional Review Board of Taichung Veterans General Hospital (IRB No. CE17306A), waiving the requirement for informed consent. Patient data were collected from the 2010–2017 Informatics Research and Development Center of Taichung Veterans General Hospital. We collected the data of liver cancer patients who underwent hepatic artery embolization performed using DC Bead TACE/yttrium 90 microsphere carrier drug-carrying therapy (the “new” therapy) and cTACE oil–water carrier drug therapy (the “old” therapy), as well as those of patients who underwent both the therapies. AIDS patients with severely poor prognoses were excluded from this study.
After exclusion, we collected the data of 372 patients, and defined the null hypothesis (H0) as “microsphere embolization therapy is more effective than traditional therapy” and the alternative hypothesis (H1) as “traditional therapy is more effective than microsphere embolization therapy”. The Attributes or Input items of this study were liver cancer staging (unit: period), tumor size (unit: cm), tumor number (unit: units) [
16], new therapy/old therapy [
17], microsphere size (unit: μm) [
4] and hepatitis type. The Output items were the prognostic indicators of liver cancer [
15] and the effects of cancer treatment.
In the first step of logistic regression, the regression coefficient (β1, 2, 3…) was calculated from the training data; then, the probability of verification data being imported into the model with the coefficient was predicted. The predicted odds were then calculated. In medical diagnostic data mining, when the C4.5 decision tree is compared with CART (Classification and Regression Trees), although they both exhibit a similar classification accuracy, the C4.5 algorithm performs better in controlling the scale of the decision tree and generates rules that are more understandable. As the object of this study was the application of medical diagnostic data mining towards evaluating the effectiveness of two different cancer therapies, the C4.5 (J48) decision tree using the ID3 system was selected.
2.1. ID3 Algorithm
The core concept behind the ID3 algorithm is, “the greater the information entropy, the murkier the data”. The following definitions were used:
Original information entropy:
Expected post processing information entropy:
The data gain of each attribute is the decision parameter of the decision tree branch; that is, the maximum gain of each attribute is the branch node, indicating that the attribute can be used to minimize the turbidity of the data. The gain of all the attributes was calculated and compared.
2.2. C4.5 (J48) Algorithm
ID3 has a partiality problem, such as the ID number. If an ID is used for each datum as the branch point, then the gain will be maximized. Another instance is that if the self-variation is the same in the data, then the gain will be the minimized. To prevent this issue, C4.5 changes the gain ratio to makes branch decisions. The amount of gain/self-variation of the information entropy itself (i.e., considering the problem of self-variation of the body quality) can prevent the occurrence of decision paralysis.
The core concept used herein: while adhering to the core concept of ID3, consider the information entropy and eliminate the problem of decision paralysis.
Self-variation information entropy:
The data gain rate of each attribute is the decision parameter of the decision tree branch; that is, the maximum gain rate of each attribute is the branch node, indicating that the attribute can be divided to clarify the data as soon as possible. Finally, 10-fold cross validation is the method used to divide training and verification data. The area under the confusion matrix, the area under the receiver operating characteristic curve (“ROC curve”), and the area under the precision-recall curve (“PR curve”) [
18] were used and compared for the three models in this study.
From
Table 1, we can understand the operation model of the overall confusion matrix and then the judgment indicators extended by the confusion matrix. We defined each indicator according to the code used in the table as follows:
First, from the prediction accuracy surface (C, D surface):
(i.e., to predict the correct middle).
(i.e., the prediction error is in the middle).
Introduced from the real side (A, B side):
The overall model accuracy (E-side):
Precision is data taken based on a lack of information. In binary classifications, precision can be made equal to positive predictive values. Recall is deletion data that were successfully retrieved from data relevant to the query. In binary classification, recall is known as “sensitivity”. The appearance of relevant data taken agrees with the query that can be seen with recall. Accuracy rate is a percentage of the total data identified and assessed. The likelihood ratio (“LR”) derived from the TPR (the amount of positive data correctly classified by the system), FNR (the amount of negative data but classified incorrectly by the system), TNR (the amount of negative data correctly classified by the system), and FPR (the amount of positive data but classified incorrectly by the system) can be judged based on data calculated from the LR value.
The areas under the ROC and PR curves are crucial for judging the accuracy of the model. If the area is 0.5, the probability of guessing is equal, and if the area is below 0.5, then the probability of guessing is lower. The main difference between the two curves is the sensitivity of positive and negative samples. For example, when the positive to negative sample ratio is increased, the ROC curve does not change significantly, while the PR curve changes severely. Therefore, when differences between positive and negative samples are large, the PR curve is more suitable.
4. Discussion
4.1. Baseline Comparison of cTACE and DC Bead TACE
In terms of cTACE and DC bead TACE comparison, this result differed from those of previous studies. In the present study, the difference between the validity of the two hypotheses was 22.7% in favor of the “cTACE is more effective” hypothesis. This statistical result shows that the old cTACE method has a therapeutic advantage, but with the caveat of it only occurring when the stage of cancer is not considered.
To evaluate the impact of BCLC cancer staging on two treatments, the regression coefficients of the traditional therapy showed that it is 1.0669 times more effective than that of the microsphere therapy. The regression coefficients of DC bead TACE mixed-sized microsphere groups of 100–300 μm + 300–500 μm and 100–300 μm + 500–700 μm in size were relatively high. Data on patients with multiple tumors and their sizes and locations were not available. In both cases, there is a high probability of producing effective results with more adequate clinical data. In the future, it may be possible to show that the number of tumors (as opposed to single vs. multiple) is a more influential factor in the effectiveness of both treatments and to explore the effectiveness of mixed-sized microspheres in DC bead TACE. These results indicate two possibilities. First, patients with stage A or B cancer who undergo cTACE have a high probability of controlling their cancer, and patients with stage C or D cancer do not undergo cTACE. Therefore, we could not compare the advantages and disadvantages of the old and new treatments in patients with stage C or D cancer and suggest this be an area of future research. The second possibility is that although microsphere therapy provides the benefit of expanding the field of liver cancer embolization, its treatment effect could be relatively low. The results above show an effectiveness rate of only 45.6% overall and administering this therapy to cancer patients with congenital conditions is difficult. Even after excluding cancer patients with congenital conditions who are difficult to treat, and patients with stage C or D disease, microsphere therapy still showed a low relatively low therapeutic effect, which could also be a topic for further study.
4.2. cTACE Limitations and Applicable Segments
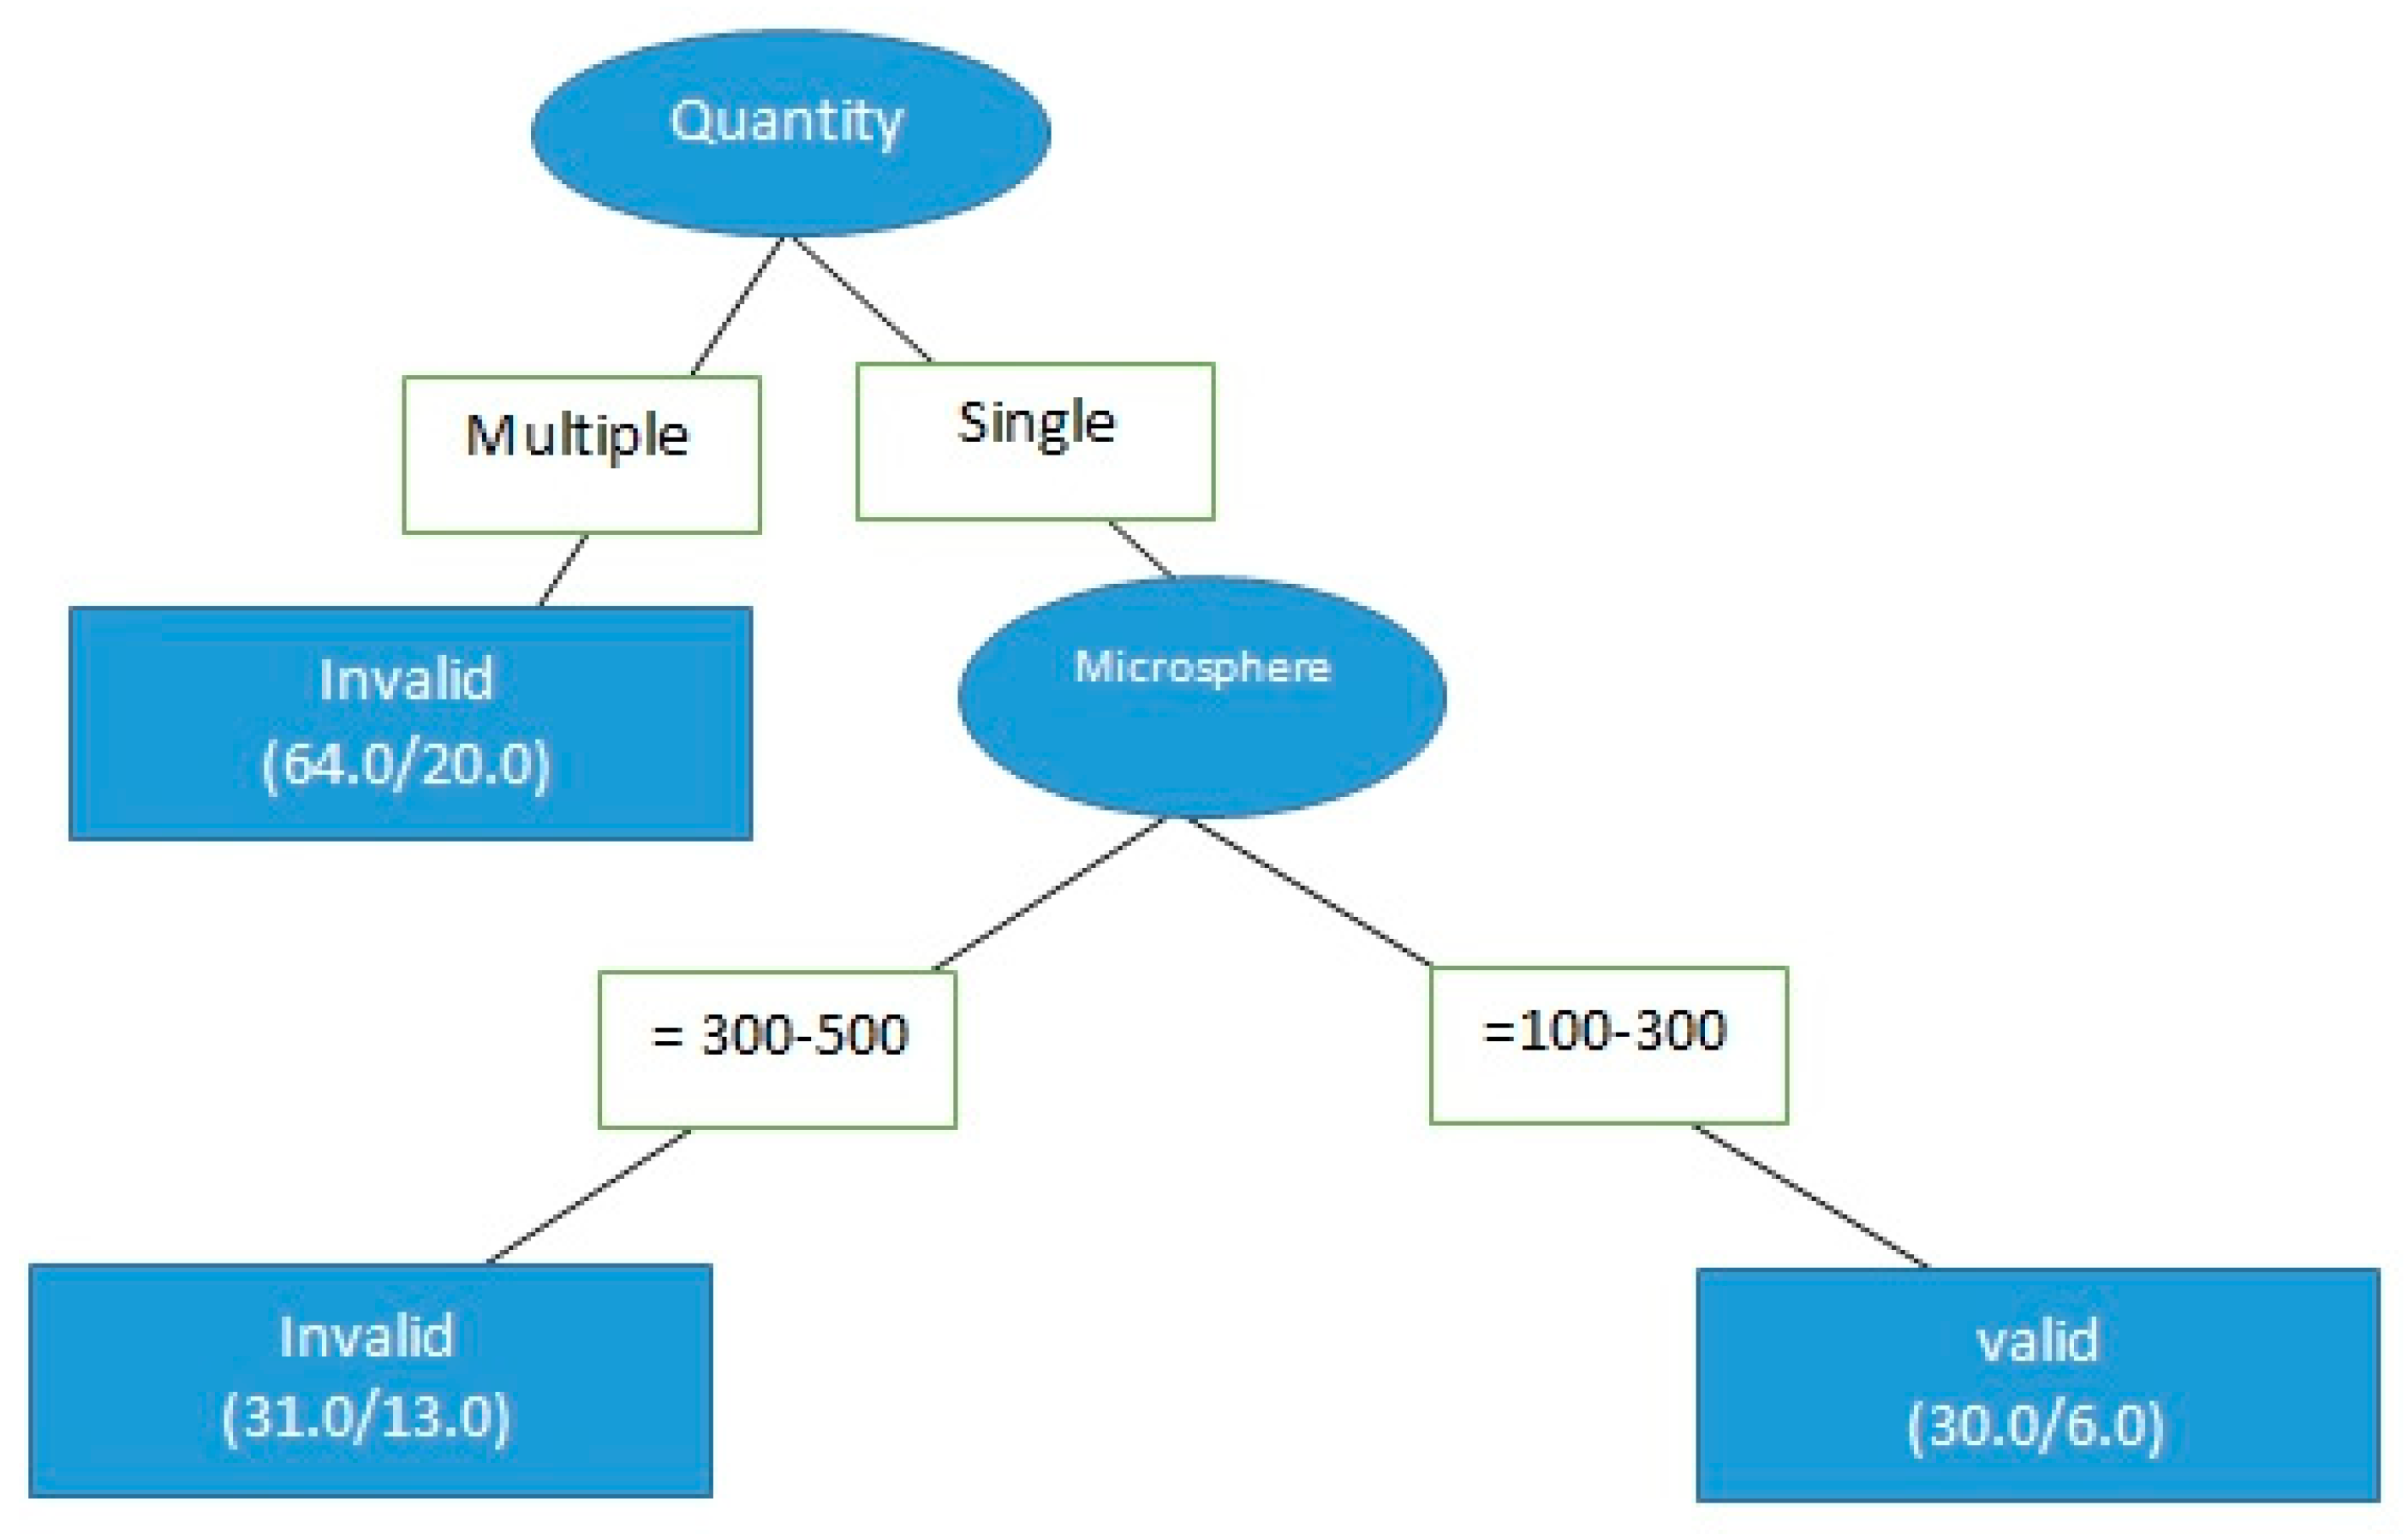
The C4.5 decision tree and real medical records were used to determine whether tumor size affected the effectiveness of either treatment on HCC. These results indicated that microsphere therapy has significant advantages in the treatment of single-tumor patients. More research into the risks and effectiveness of DC bead TACE in multiple-tumor patients is necessary, particularly in terms of the question of whether the number of tumors impacts effectiveness.
Logistic regression was then used to calculate the odds ratio of the number of tumors affecting treatment effectiveness. Treating a single tumor was 3.39 times more successful than treating multiple tumors. However, we recognized that this odds ratio was calculated from a fairly limited data set. Although the accuracy of the model was approximately 70.4%, the prediction ability was not very satisfactory. Having more clinical data in the future is necessary to improve model prediction.
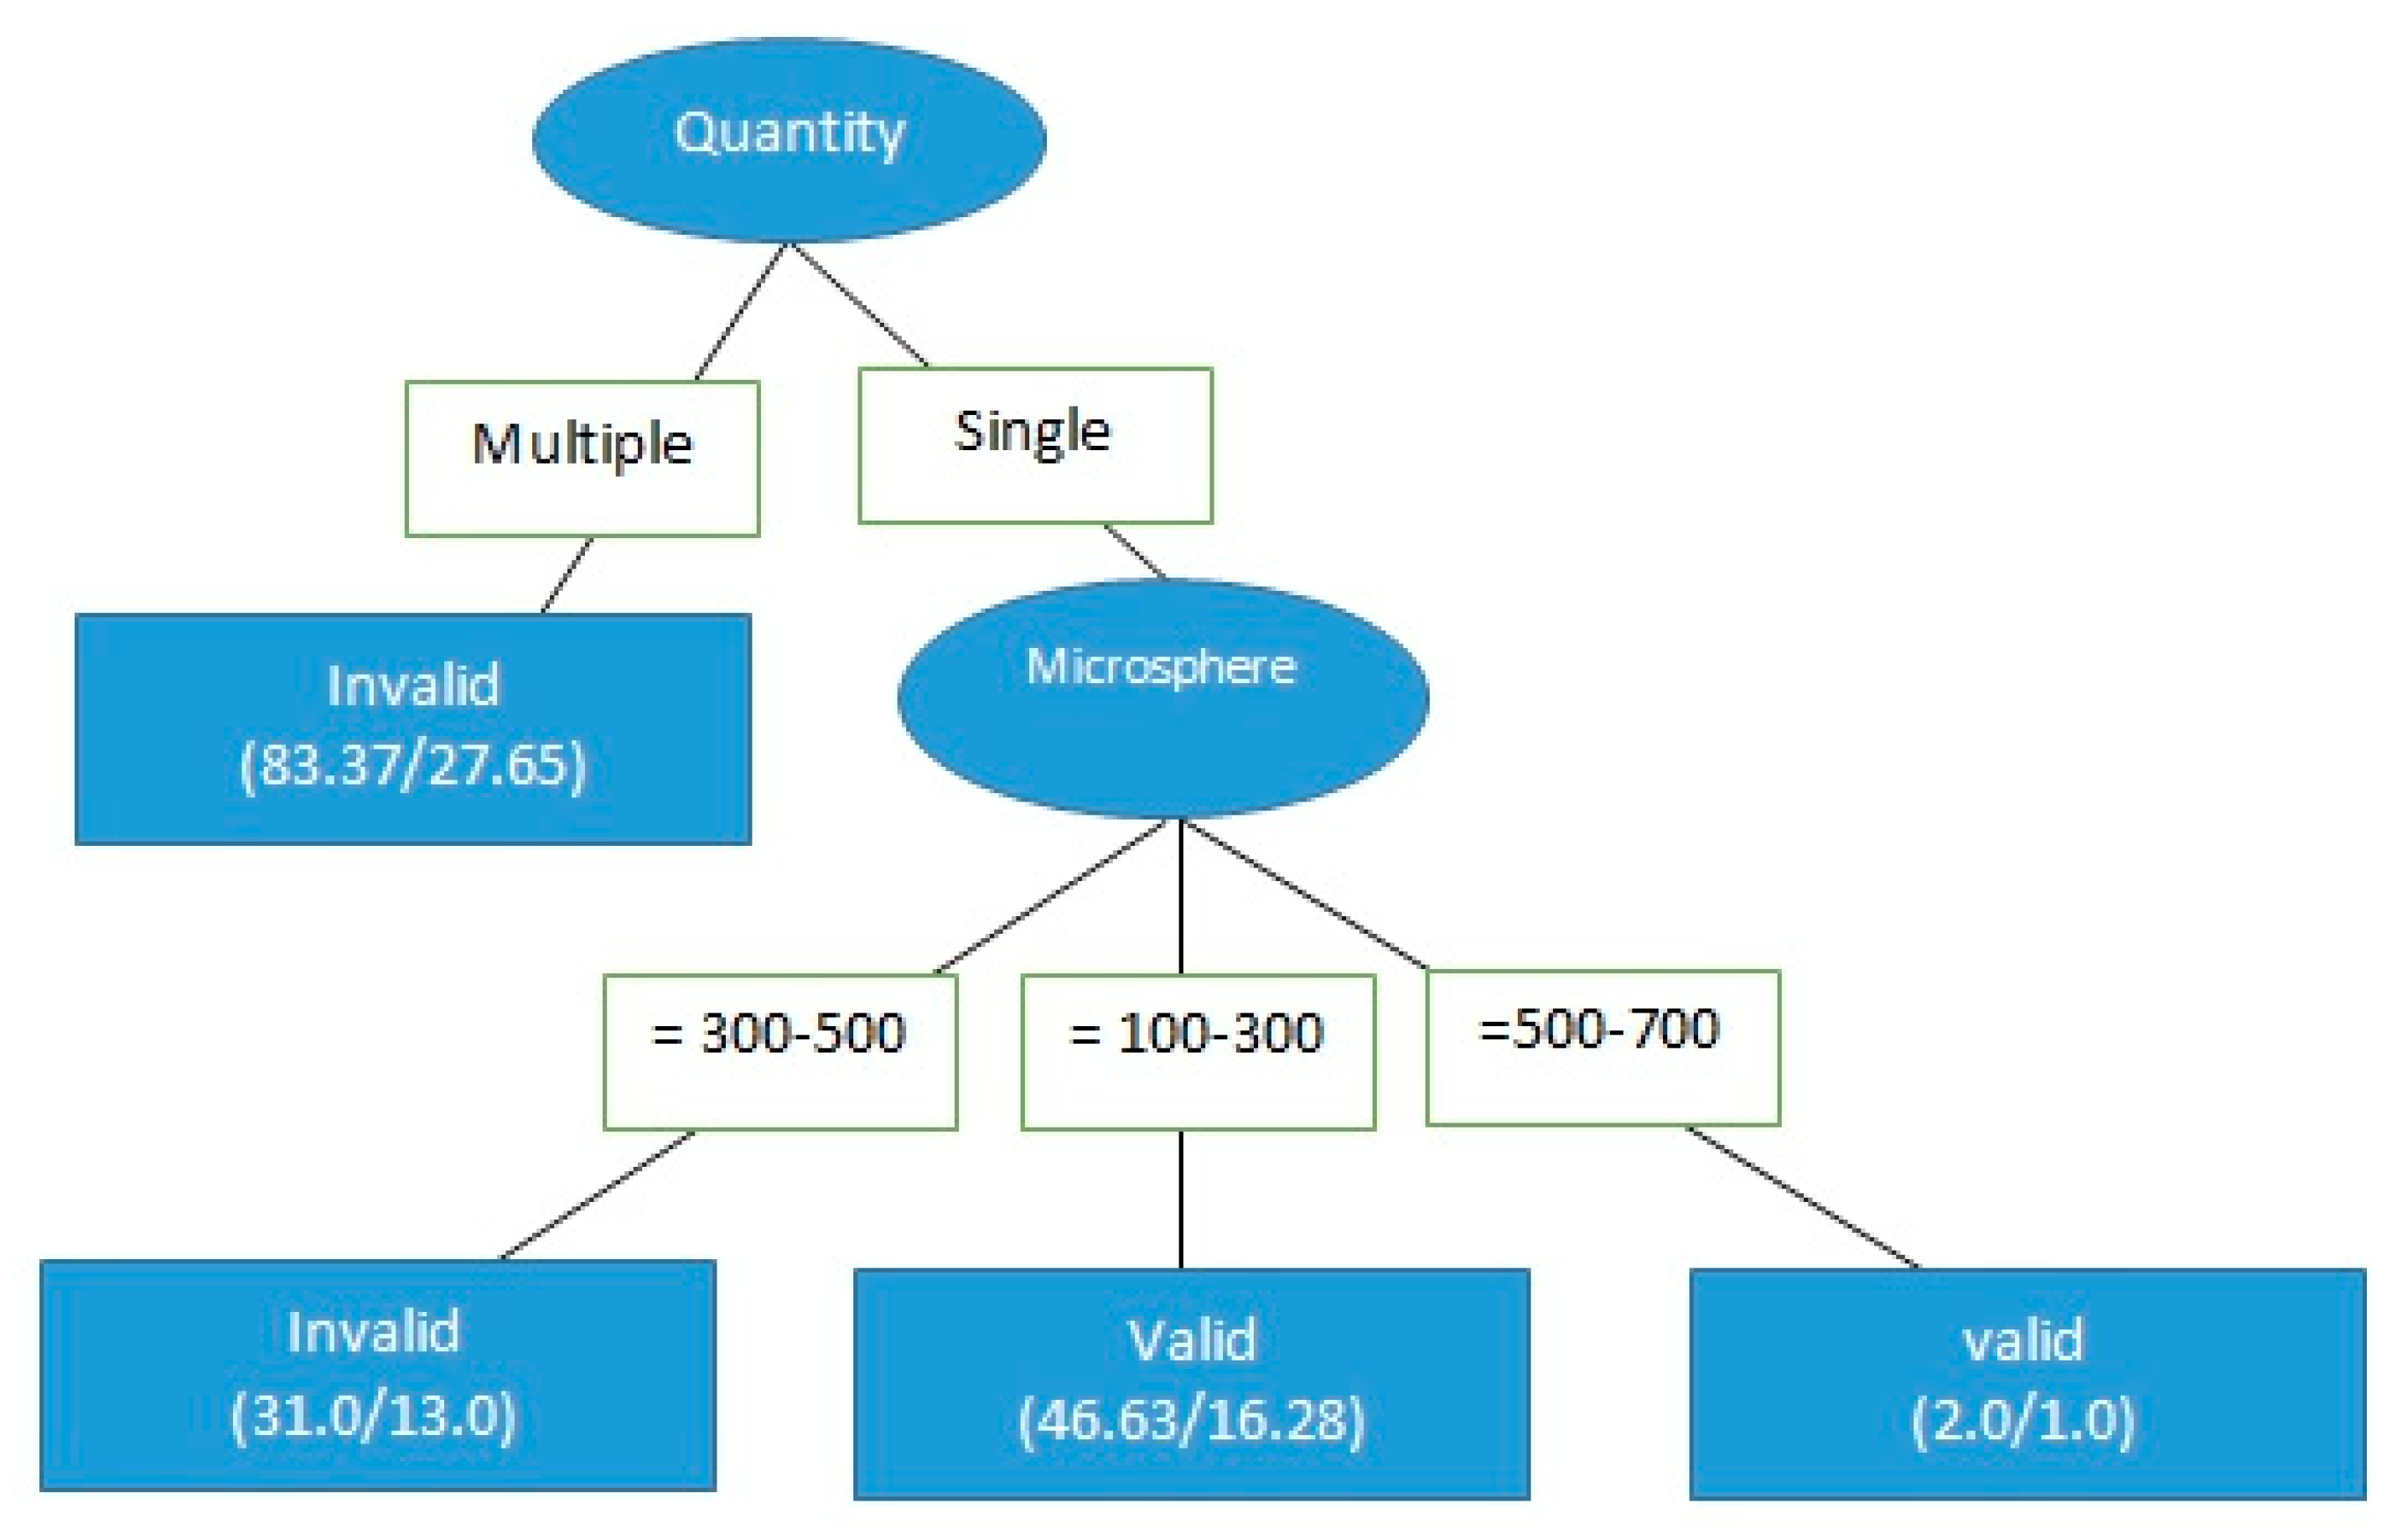
Next, only the data of the 61 patients who were treated for single-tumor HCC with DC bead TACE using either 100–300 μm or 300–500 μm microspheres were analyzed to determine the effect of microsphere size on treatment effectiveness. The data were divided into two different microsphere sizes (30 records for 100–300 μm and 31 records for 300–500 μm, as per
Figure 2), for a total of 61 records. The result of the chi-square test is shown in
Table 6. For microspheres that were 100–300 μm in size, the invalid ratio was 20% and the effective ratio was 80%. For microspheres that were 300–500 μm in size, the invalid ratio was 58.1%, whereas the effective ratio was 41.9%; the chi-square test result was 0.02, indicating a significant difference, that is, microspheres sized 100–300 μm were more therapeutically effective than those sized 300–500 μm in size for a single tumor. The extent of the differences in effectiveness should be further explored.
The odds ratios of the microspheres that were 100–300 and 300–500 μm in size were calculated using a logistic regression. The success rate of treatment with DC bead TACE using 100–300 μm microspheres was 3.412 times of that using 300–500 μm microspheres. The accuracy of this model was approximately 64.8%; however, its prediction ability still needs to be strengthened.
One limitation of this study was the relatively small sample size. Although the factors surrounding HCC and TACE are varied and complex, the strengths of data mining lie also in its ability to analyze large data sets. While the initial population was reasonably large (372), by the time the analysis had reached the point of parsing different aspects of microsphere therapy, the populations had shrunk considerably. In the future, larger populations to which data mining can be applied would probably yield more interesting results.


