Author Contributions
Conceptualization, S.K., S.K., R.B., T.B., C.C., R.D., M.D., P.D.; Data curation, S.K., S.K., R.B., T.B., M.B., S.B., C.C., P.D., R.D., S.F., V.I., T.M.; Formal analysis, S.K., S.F., V.I.; Investigation, S.K., S.K., T.B., S.B., P.D., R.D., V.I., R.L. and T.M.; Methodology, S.K., S.K., R.B., M.B., C.C., R.D., S.F., V.I. and T.M.; Project administration, S.K., S.K., M.D., R.D. and A.S.; Resources, S.K. and A.S.; Supervision, S.K., S.K., R.B.; Visualization, S.K., R.D., S.F., R.B., and V.I., Validation, S.K., S.K., M.B., P.D., and C.C.; Writing—original draft, S.K.; Writing—review & editing, S.K., R.D., S.F., V.I., R.B., and T.B.
Acknowledgments
The U.S. Environmental Protection Agency (EPA), through its Office of Research and Development, funded the research described herein under Contract No. EP-C-15-008 to Jacobs Technology, Inc. and Contract No. EP-C-16-0016 to RTI International. The authors acknowledge EPA staff: Bill Mitchell, Richard Snow and James Faircloth for their contributions to this project. The authors thank the following departments within the Unified Government of Wyandotte County and Kansas City, KS: Fire Department (Station #7), Parks and Recreation Department (Bill Clem, Clopper Field, Leo Alvey), Police Department (South Patrol Division), and American Legion Post #213 for providing site access for instrument deployment.
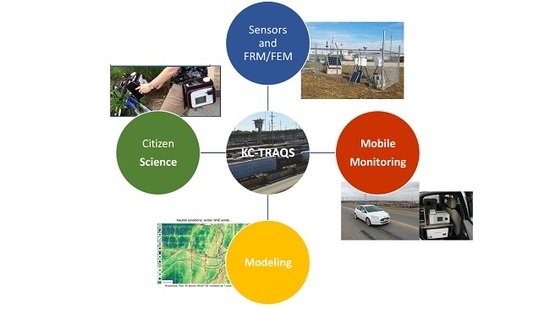
Figure 1.
Kansas City Transportation and Local-Scale Air Quality Study (KC-TRAQS) Area Maps.
Figure 1.
Kansas City Transportation and Local-Scale Air Quality Study (KC-TRAQS) Area Maps.
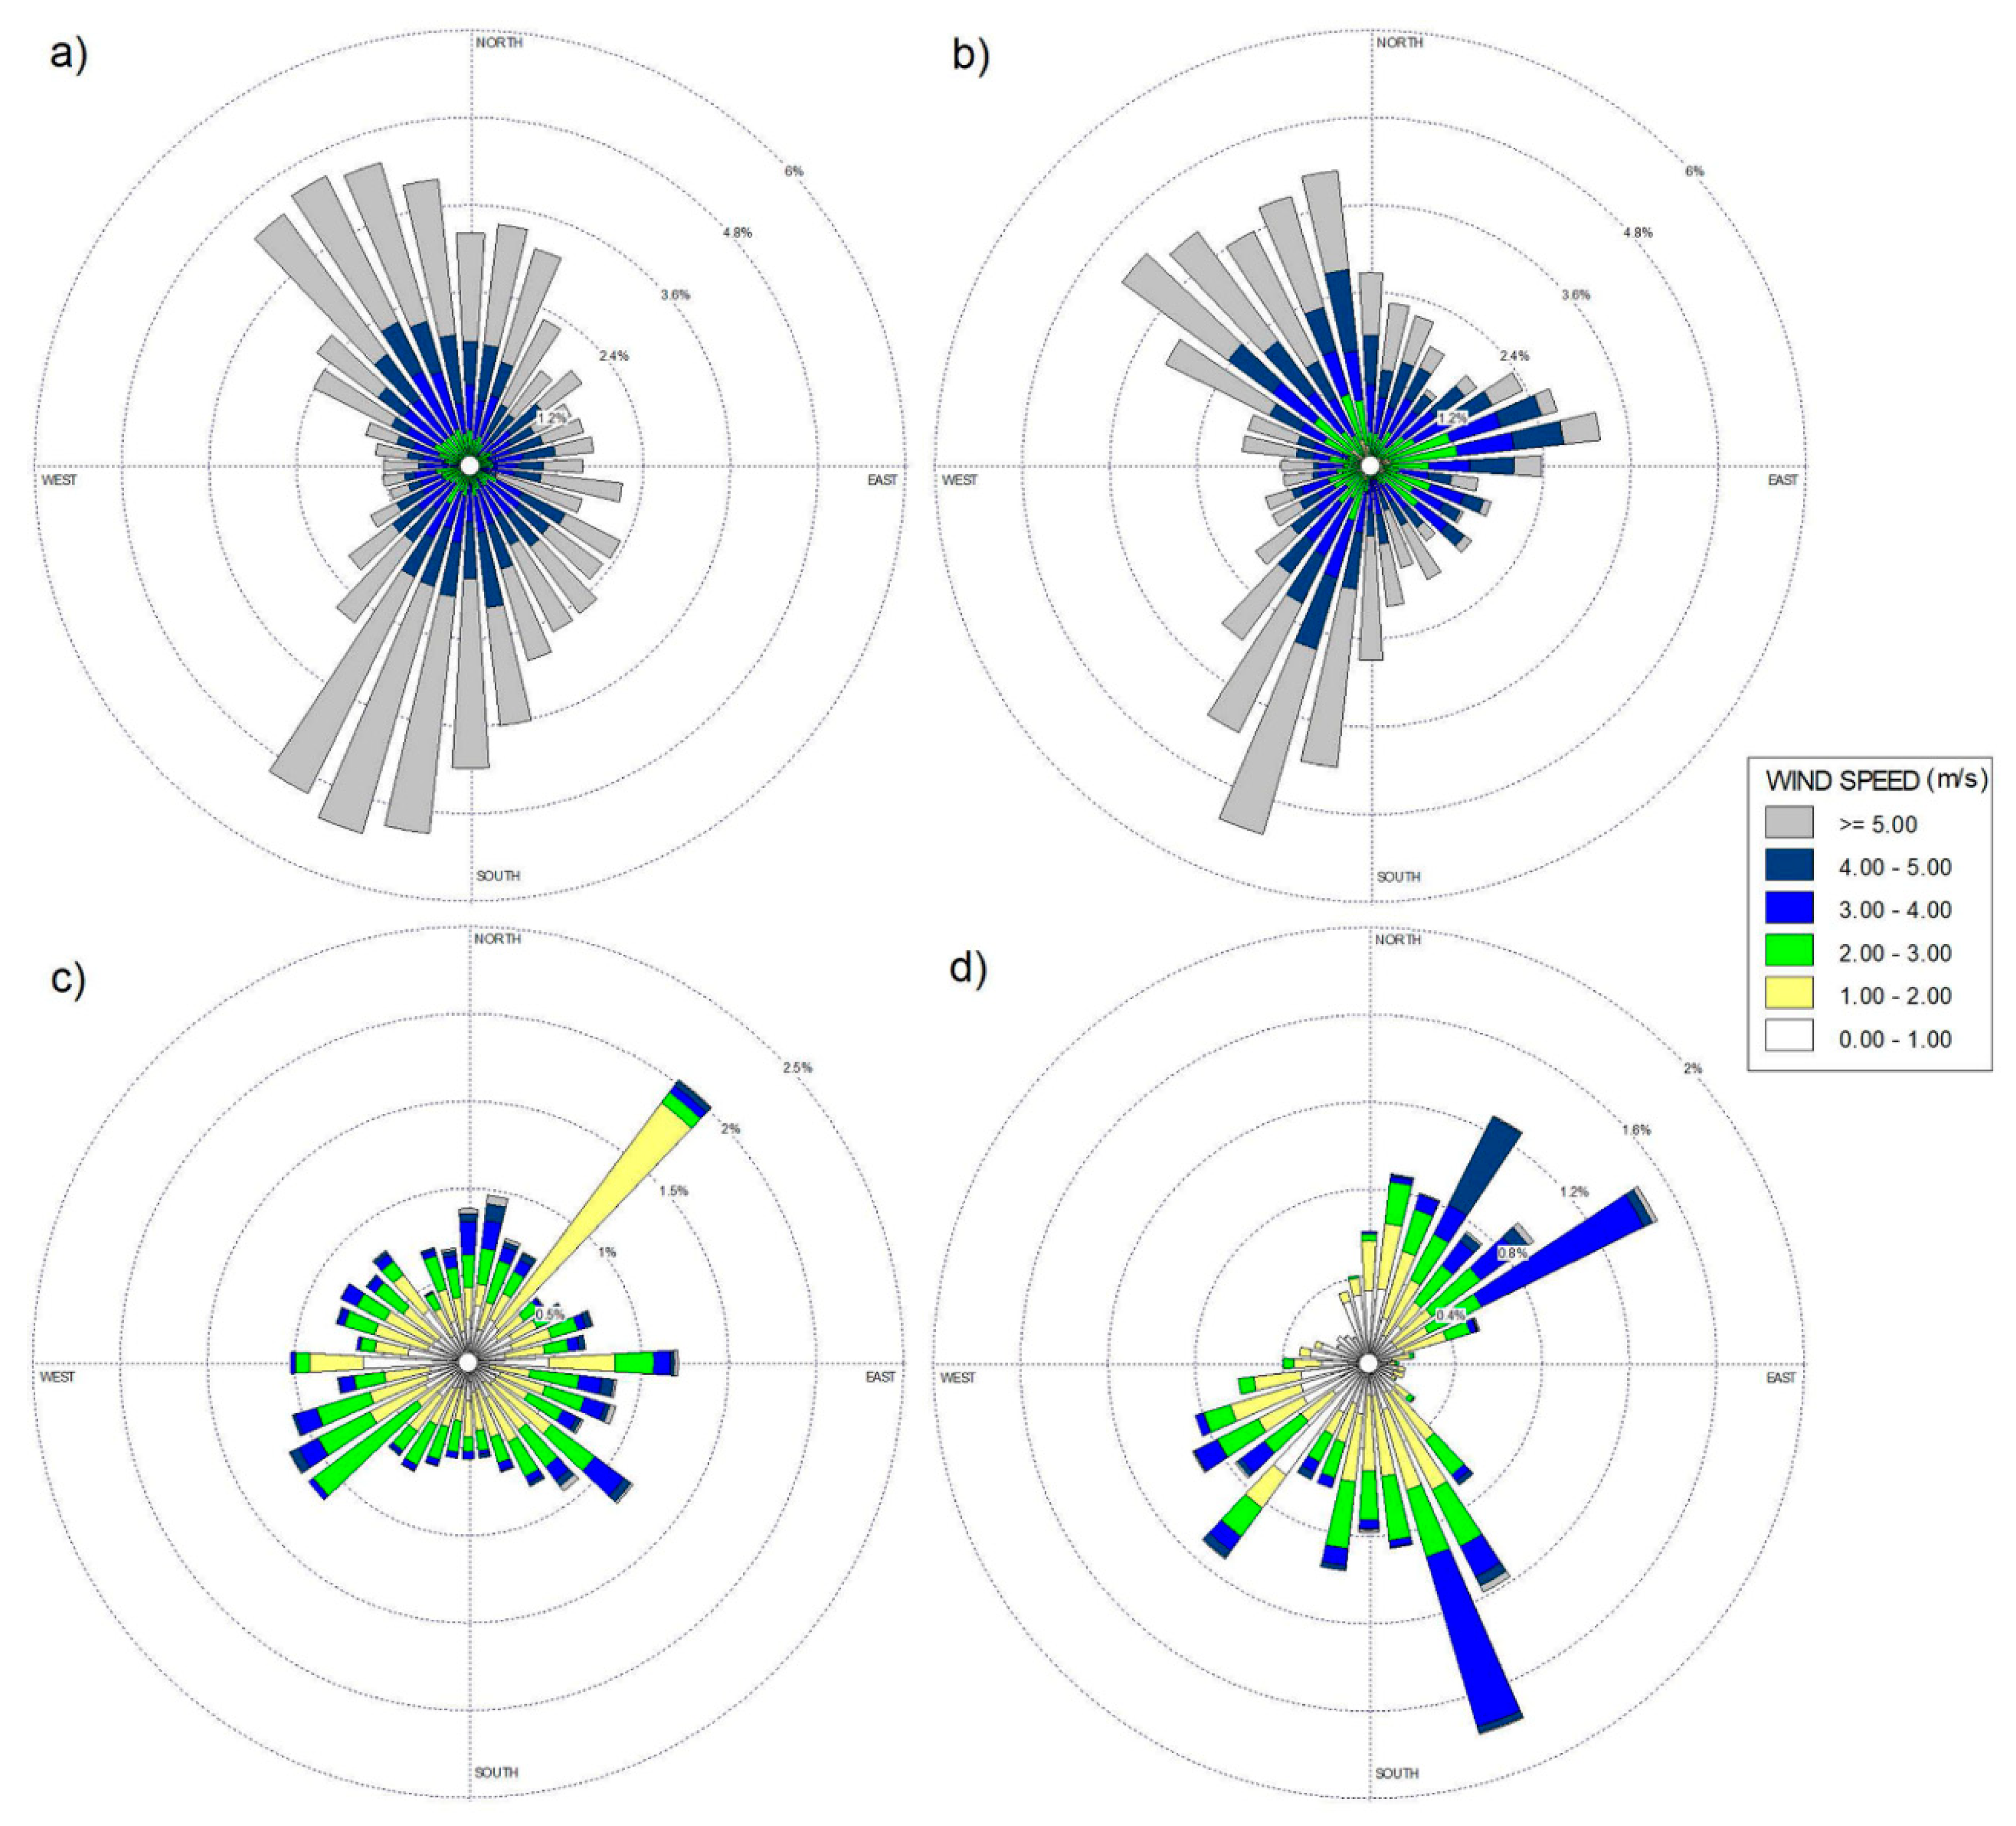
Figure 2.
Wind Roses for different locations in the study area from mid-October 2017 through May 2018: (a) Kansas City Intl. Airport, (b) Kansas City Downtown Airport, (c) Police Station, and (d) Fire Station.
Figure 2.
Wind Roses for different locations in the study area from mid-October 2017 through May 2018: (a) Kansas City Intl. Airport, (b) Kansas City Downtown Airport, (c) Police Station, and (d) Fire Station.
Figure 3.
Comparison of PM2.5 Concentrations from the OPC-N2 Sensor vs. Gravimetric Filter Samples (linear regression lines shown for each site) from 24 October 2017 through 31 October 2018. OPC-N2 sensor PM2.5 concentrations are 24-h averages. The gravimetric filter sample concentrations are 24-h integrated values.
Figure 4.
Box plots for the P-POD PM2.5 measurements for different time periods: Annual (24 October 2017–31 October 2018), April 2018 (month-long spring), August 2018 (month-long summer), 1–7 April 2018 (week-long spring), 5–11 August 2018 (week-long summer), 20 April 2018 (spring day), and 20 August 2018 (summer day). The Leo Alvey site was in a non-operational status during August 2018. The bottom of the box plot represents the 25th percentile; the top of the box plot represents the 75th percentile; mean is the solid line in each box; whiskers above and below represent the 90th and 10th percentiles.
Figure 5.
Box plots for the P-POD BCIR measurements for different time periods: Annual (24 October 2017–31 October 2018), May 2018 (month-long spring), August 2018 (month-long summer), 5–11 May 2018 (week-long spring), 5–11 August 2018 (week-long summer), 9 May 2018 (spring day), and 20 August 2018 (summer day). The Leo Alvey site was in a non-operational status during August 2018. Bottom of box plot represents the 25th percentile; top of box plot represents the 75th percentile; mean is the solid line in each box; whiskers above and below represent 90th and 10th percentiles.
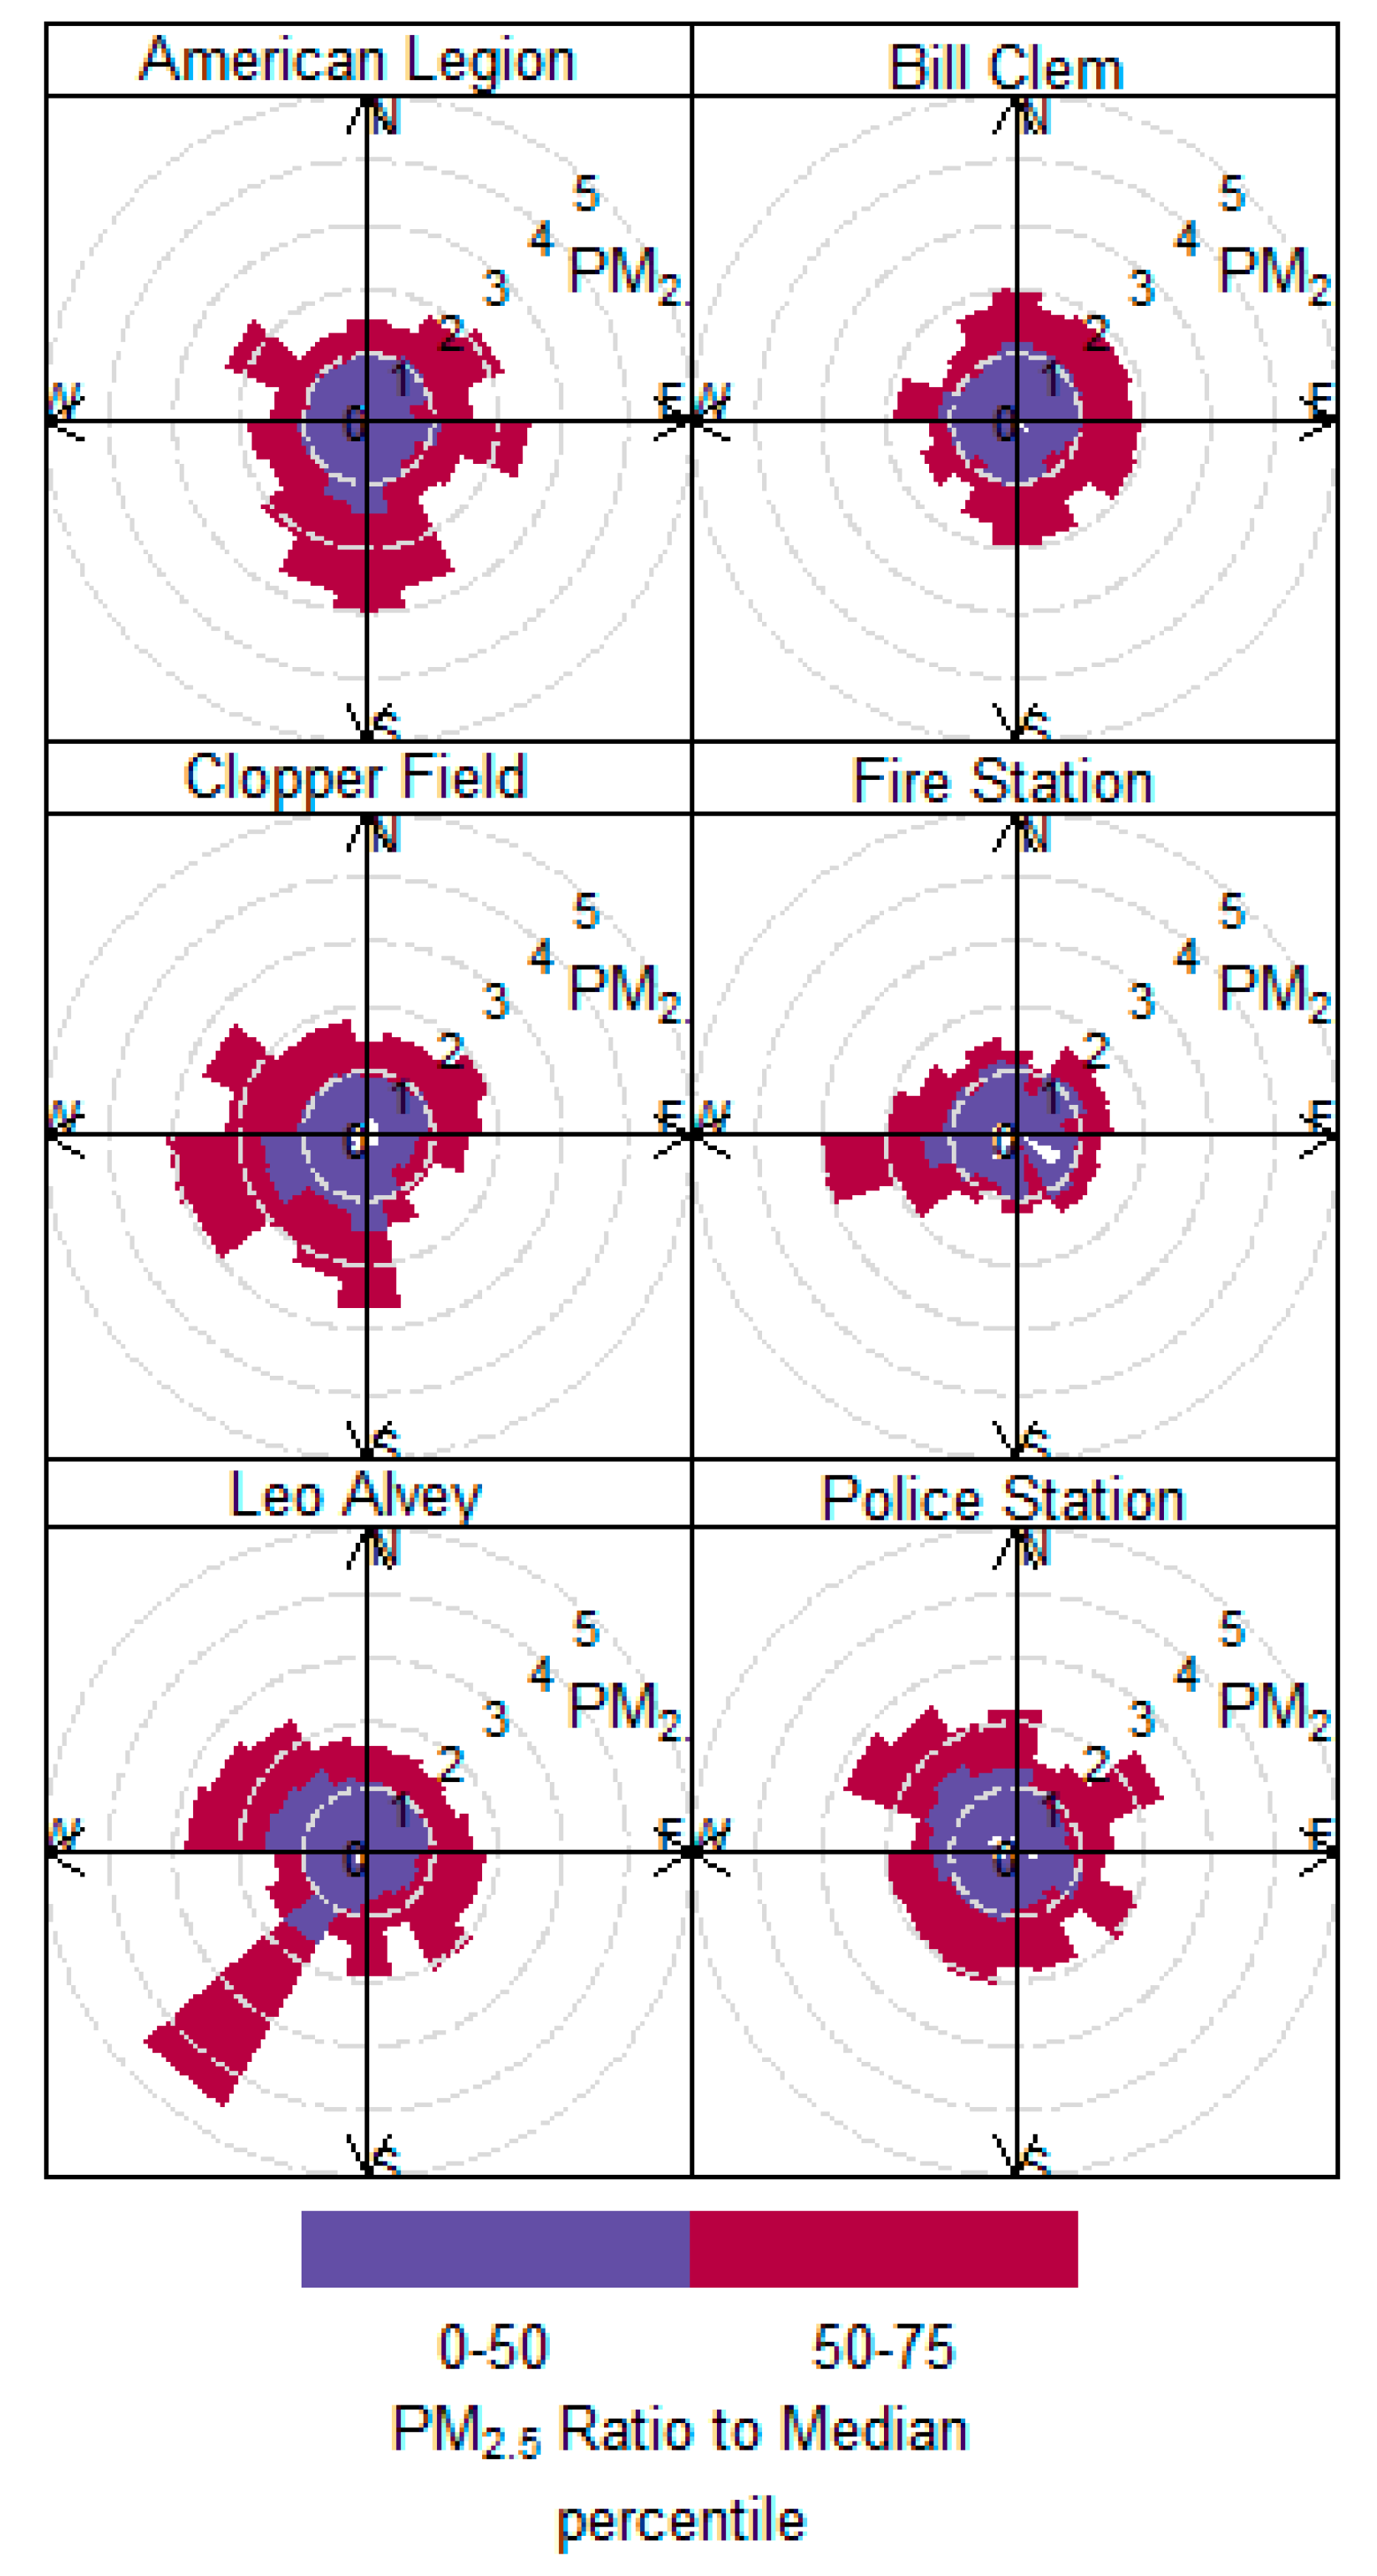
Figure 6.
PM2.5 Pollution rose for all sites.
Figure 6.
PM2.5 Pollution rose for all sites.
Figure 7.
BCIR Pollution rose for all sites.
Figure 7.
BCIR Pollution rose for all sites.
Figure 8.
Diurnal Median PM2.5 Concentrations (µg/m3).
Figure 8.
Diurnal Median PM2.5 Concentrations (µg/m3).
Figure 9.
Diurnal Median BCIR Concentrations (µg/m3).
Figure 9.
Diurnal Median BCIR Concentrations (µg/m3).
Table 1.
KC-TRAQS Fixed Measurement Sites and Locations Providing Meteorological Data. BNSF: Burlington Northern and Santa Fe.
Table 1.
KC-TRAQS Fixed Measurement Sites and Locations Providing Meteorological Data. BNSF: Burlington Northern and Santa Fe.
| Site Name | Community | Latitude/Longitude | Relative Position and Distance to BNSF Railyard Fence Line (m) | Elevation (m) | Location Characteristics |
|---|
| Fixed Measurement Sites |
| American Legion | Argentine | 39.078822/−94.659591 | North | ~20 | 230 | Community ball field, Light industrial, adjacent to railyard |
| Clopper Field | 39.077416/−94.665833 | South | ~45 | 229 | Soccer field, residential, adjacent to railyard |
| Fire Station | 39.074817/−94.661067 | South | ~210 | 230 | Residential, Fire Station Roof |
| Police Station | 39.074133/−94.653333 | South | ~50 | 233 | Residential, adjacent to railyard |
| Bill Clem | Armourdale | 39.086683/−94.636466 | East | ~1720 | 230 | Community park, residential, light industrial, adjacent to 4-lane arterial highway |
| Leo Alvey | Turner | 39.075050/−94.689966 | West | ~760 | 260 | Community park, residential |
| Locations Providing Meteorological Data |
| Kansas City Downtown Airport | - | 39.117/94.600 | East | ~6200 | 226 | Airport |
| Kansas City International Airport | - | 39.317/94.717 | North | ~24,000 | 300 | Airport |
| JFK NCore | - | 39.117219/−94.635605 | North | ~4700 | 263 | Light commercial, residential |
Table 2.
KC-TRAQS Instrumentation. The sample interval for all the data is continuous with the exception of the BGI PQ200 instrument, in which the sampling interval was every three days.
Table 2.
KC-TRAQS Instrumentation. The sample interval for all the data is continuous with the exception of the BGI PQ200 instrument, in which the sampling interval was every three days.
| Measurement Platform | Instrument | Parameter Measured | Sample Rate | Instrument Type (Manufacturer) |
|---|
| Stationary Site | FRM/FEM § | PM2.5 | 24-h | BGI PQ200 (Mesa Labs) |
| 10-min ‡ | † E-BAM (MetOne Instruments) |
| P-POD §§ | PM2.5 | 1-min | OPC-N2# Sensor (Alphasense) |
| BC | Five-wavelength Aethalometer MA 350 (AethLabs) |
| Wind Speed | 2-D Ultrasonic Anemometer, Model 86000 (RM Young) |
| Wind Direction | |
| Relative Humidity | BME280 Humidity and Pressure Sensor (Bosch Sensortech GmbH) |
| Temperature | |
| Barometric Pressure | |
| Citizen Science | AirMapper | PM2.5, PM10, PM1 * | 10-s or faster | OPC-N2 Sensor (Alphasense) |
| CO2 | COZIR CO2 Sensor (CO2Meter.com) |
| Longitude and Latitude | GPS Module (Adafruit) |
| Date and Time | Arduino Microprocessor (Adafruit) |
| Noise | Electret Microphone Amplifier (Adafruit) |
| Temperature | DHT22 Temperature/humidity Sensor (Adafruit) |
| Humidity | |
| MobileMonitoring | GMAP ** | NO2 | 1-s | CAPS *** NO2 Monitor (Aerodyne Research) |
| Particle Number concentration (size range 5.6–560 nm) | Engine Exhaust Particle Sizer (TSI, Inc.) |
| Longitude and Latitude | GPS Crescent R100 (Hemisphere GNSS) |
| BC (black carbon) | 1–5-s | Single-channel Aethalometer, AE-42 (Magee Scientific) |
| Video of Route | <1-s | Webcam |
| SUV | NO2 | 1-s | CAPS NO2 Monitor (Aerodyne Research) |
| Particle Number concentration (size range 5.6–560 nm) | Engine Exhaust Particle Sizer (TSI, Inc.) |
| BC | 1–5-s | Single-channel Aethalometer, AE-51 (Magee Scientific) |
| Area Video | <1-s | Webcam |
Table 3.
Laboratory Analysis. Elemental and organic carbon (EC/OC).
Table 3.
Laboratory Analysis. Elemental and organic carbon (EC/OC).
| Parameter | Filter Type | Instrument (Manufacturer) |
|---|
| PM2.5 | Teflon | Gravimetric analysis AE50 Analytical Balance (Mettler-Toledo) |
| Metals | X-ray fluorescence (XRF)—PANalytical Epsilon 5 (Almelo) |
| EC/OC | Quartz | Thermal-optical Carbon Analyzer (Sunset Laboratory) |
Table 4.
Data Completeness of the 24-h Integrated Filter Samples (24 October 2017 through 31 October 2018).
Table 4.
Data Completeness of the 24-h Integrated Filter Samples (24 October 2017 through 31 October 2018).
| Filter Type | Sample Interval | Pollutant | # of Sample Days | # of Samplers | # of Filters | # of Valid Samples | Completeness (%) | # of Blanks |
|---|
| Teflon | 24-h every three days | PM2.5 | 94 | 6 | 750 | 630 | 84% | 42 |
| Quartz | EC, OC, TC † | 5 | 625 | 531 | 85% | 42 |
Table 5.
Site-Specific Summary Statistics for the 24-hr Integrated Teflon and Quartz Filters (24 October 2017–31 October 2018).
Table 5.
Site-Specific Summary Statistics for the 24-hr Integrated Teflon and Quartz Filters (24 October 2017–31 October 2018).
| Site Name | Total # of Filters | # of Valid Filters | Mean (µg/m3) | Median (µg/m3) | Interquartile Range (µg/m3) |
|---|
| Teflon | Quartz | Teflon | Quartz | PM2.5 | EC | OC | TC * | PM2.5 | EC | OC | TC * | PM2.5 | EC | OC | TC * |
|---|
| American Legion | 125 | 125 | 111 | 107 | 9.34 | 0.49 | 3.70 | 4.19 | 8.40 | 0.40 | 3.38 | 3.82 | 5.91 | 0.37 | 1.93 | 2.14 |
| Bill Clem | 125 | 125 | 102 | 107 | 8.54 | 0.38 | 3.31 | 3.69 | 7.06 | 0.28 | 3.05 | 3.40 | 6.78 | 0.23 | 1.62 | 1.75 |
| Clopper Field | 125 | 125 | 97 | 102 | 7.92 | 0.35 | 3.32 | 3.67 | 7.15 | 0.33 | 3.09 | 3.36 | 5.55 | 0.28 | 1.68 | 1.85 |
| Fire Station | 125 | 125 | 117 | 110 | 8.38 | 0.35 | 3.29 | 3.64 | 7.73 | 0.28 | 3.05 | 3.34 | 5.76 | 0.30 | 1.59 | 1.86 |
| Police Station | 125 | 125 | 106 | 105 | 9.34 | 0.45 | 3.47 | 3.92 | 8.52 | 0.43 | 3.26 | 3.67 | 5.79 | 0.39 | 1.63 | 1.87 |
| Police Station Co-location | 125 | | 96 | | 9.26 | | | | 7.94 | | | | 6.36 | | | |
Table 6.
Site-Specific Summary Statistics for the 1-min P-POD Data, (24 October 2017–31 October 2018).
Table 6.
Site-Specific Summary Statistics for the 1-min P-POD Data, (24 October 2017–31 October 2018).
| Site Name | Data Transmitted (%) a | Total # of Obs. | # of Valid Obs. | Mean (µg/m3) | Median (µg/m3) | Interquartile Range (µg/m3) |
|---|
| PM2.5 | BCIR b | BCUV c | PM2.5 | BCIR | BCUV | PM2.5 | BCIR | BCUV |
|---|
| American Legion | 96.9 | 514,408 | 391,030 | 5.94 | 0.76 | 0.58 | 3.62 | 0.49 | 0.37 | 4.62 | 0.75 | 0.58 |
| Bill Clem | 95.9 | 494,035 | 288,435 | 4.23 | 0.52 | 0.43 | 2.69 | 0.35 | 0.28 | 3.08 | 0.40 | 0.34 |
| Clopper Field | 96.4 | 500,496 | 240,185 | 3.30 | 0.51 | 0.41 | 1.74 | 0.37 | 0.29 | 2.33 | 0.46 | 0.37 |
| d Fire Station | 93.7 | 463,419 | 125,673 | 5.78 | 0.64 | 1.16 | 4.94 | 0.47 | 0.90 | 3.17 | 0.53 | 1.17 |
| Leo Alvey | 96.4 | 499,598 | 239,511 | 3.32 | 0.37 | 0.32 | 1.88 | 0.28 | 0.22 | 2.46 | 0.31 | 0.29 |
| Police Station | 96.3 | 447,350 | 249,932 | 4.09 | 0.61 | 0.62 | 2.49 | 0.40 | 0.48 | 3.15 | 0.54 | 0.60 |


