Appendix A
Table A1.
Reference gene stability values within the amygdala of rats in the latent and chronic phases of the lithium–pilocarpine temporal lobe epilepsy model obtained by four algorithms with the RefFinder online tool.
Table A1.
Reference gene stability values within the amygdala of rats in the latent and chronic phases of the lithium–pilocarpine temporal lobe epilepsy model obtained by four algorithms with the RefFinder online tool.
| Amygdala |
|---|
| | Delta CT | BestKeeper | NormFinder | GeNorm | Comprehensive Ranking |
|---|
| Rank | Gene | Average of STDV | Gene | Std Dev | Gene | Stability Value | Gene | Stability Value | Gene | Geomean of Ranking Values |
|---|
| 1 | Pgk1 | 0.32 | Ppia | 0.19 | Pgk1 | 0.089 | Hprt1 | Ywhaz | 0.215 | Pgk1 | 1.73 |
| 2 | Ywhaz | 0.35 | Rpl13a | 0.21 | Ywhaz | 0.203 | | | Ywhaz | 2.11 |
| 3 | Hprt1 | 0.35 | Pgk1 | 0.24 | Hprt1 | 0.216 | Pgk1 | 0.228 | Hprt1 | 2.45 |
| 4 | Ppia | 0.36 | Hprt1 | 0.31 | Ppia | 0.228 | Ppia | 0.268 | Ppia | 2.83 |
| 5 | Rpl13a | 0.42 | Ywhaz | 0.33 | Rpl13a | 0.328 | Rpl13a | 0.31 | Rpl13a | 3.98 |
| 6 | Gapdh | 0.56 | Gapdh | 0.44 | Gapdh | 0.512 | Gapdh | 0.392 | Gapdh | 6 |
Table A2.
Reference gene stability values within the medial prefrontal cortex of rats in the latent and chronic phases of the lithium–pilocarpine temporal lobe epilepsy model obtained by four algorithms with the RefFinder online tool.
Table A2.
Reference gene stability values within the medial prefrontal cortex of rats in the latent and chronic phases of the lithium–pilocarpine temporal lobe epilepsy model obtained by four algorithms with the RefFinder online tool.
| Medial Prefrontal Cortex |
|---|
| | Delta CT | BestKeeper | NormFinder | GeNorm | Comprehensive Ranking |
|---|
| Rank | Gene | Average of STDV | Gene | Std Dev | Gene | Stability Value | Gene | Stability Value | Gene | Geomean of Ranking Values |
|---|
| 1 | Pgk1 | 0.36 | Rpl13a | 0.23 | Pgk1 | 0.122 | Hprt1 | Ywhaz | 0.175 | Pgk1 | 1.57 |
| 2 | Ywhaz | 0.37 | Pgk1 | 0.24 | Ywhaz | 0.165 | | | Ywhaz | 2 |
| 3 | Hprt1 | 0.39 | Ppia | 0.25 | Hprt1 | 0.237 | Pgk1 | 0.193 | Hprt1 | 2.59 |
| 4 | Ppia | 0.43 | Ywhaz | 0.32 | Ppia | 0.289 | Ppia | 0.299 | Rpl13a | 3.34 |
| 5 | Rpl13a | 0.49 | Hprt1 | 0.37 | Rpl13a | 0.411 | Rpl13a | 0.351 | Ppia | 3.72 |
| 6 | Gapdh | 0.63 | Gapdh | 0.52 | Gapdh | 0.58 | Gapdh | 0.445 | Gapdh | 6 |
Table A3.
Reference gene stability values within the striatum of rats in the latent and chronic phases of the lithium–pilocarpine temporal lobe epilepsy model obtained by four algorithms with the RefFinder online tool.
Table A3.
Reference gene stability values within the striatum of rats in the latent and chronic phases of the lithium–pilocarpine temporal lobe epilepsy model obtained by four algorithms with the RefFinder online tool.
| Striatum |
|---|
| | Delta CT | BestKeeper | NormFinder | GeNorm | Comprehensive Ranking |
|---|
| Rank | Gene | Average of STDV | Gene | Std Dev | Gene | Stability Value | Gene | Stability Value | Gene | Geomean of Ranking Values |
|---|
| 1 | Ywhaz | 0.33 | Rpl13a | 0.27 | Pgk1 | 0.154 | Hprt1 | Ywhaz | 0.164 | Ywhaz | 1.68 |
| 2 | Pgk1 | 0.34 | Pgk1 | 0.29 | Ywhaz | 0.164 | | | Pgk1 | 1.86 |
| 3 | Hprt1 | 0.35 | Ppia | 0.36 | Hprt1 | 0.231 | Pgk1 | 0.232 | Hprt1 | 2.59 |
| 4 | Rpl13a | 0.39 | Ywhaz | 0.4 | Rpl13a | 0.289 | Ppia | 0.312 | Rpl13 | 2.99 |
| 5 | Ppia | 0.4 | Hprt1 | 0.44 | Ppia | 0.315 | Rpl13a | 0.327 | Ppia | 4.16 |
| 6 | Gapdh | 0.5 | Gapdh | 0.48 | Gapdh | 0.446 | Gapdh | 0.385 | Gapdh | 6 |
Table A4.
Reference gene stability values within the temporal cortex of rats in the latent and chronic phases of the lithium–pilocarpine temporal lobe epilepsy model obtained by four algorithms with the RefFinder online tool.
Table A4.
Reference gene stability values within the temporal cortex of rats in the latent and chronic phases of the lithium–pilocarpine temporal lobe epilepsy model obtained by four algorithms with the RefFinder online tool.
| Temporal Cortex |
|---|
| | Delta CT | BestKeeper | NormFinder | GeNorm | Comprehensive Ranking |
|---|
| Rank | Gene | Average of STDV | Gene | Std Dev | Gene | Stability Value | Gene | Stability Value | Gene | Geomean of Ranking Values |
|---|
| 1 | Ywhaz | 1.36 | Pgk1 | 0.45 | Ywhaz | 0.661 | Hprt1 | Ywhaz | 0.239 | Ywhaz | 1.32 |
| 2 | Pgk1 | 1.39 | Hprt1 | 0.5 | Hprt1 | 0.74 | | | Hprt1 | 1.86 |
| 3 | Hprt1 | 1.41 | Ywhaz | 0.53 | Pgk1 | 0.776 | Pgk1 | 0.318 | Pgk1 | 2.06 |
| 4 | Gapdh | 1.73 | Ppia | 0.67 | Gapdh | 1.284 | Gapdh | 0.636 | Gapdh | 4.23 |
| 5 | Ppia | 2.29 | Gapdh | 0.72 | Ppia | 1.783 | Ppia | 1.332 | Ppia | 4.73 |
| 6 | Rpl13a | 2.86 | Rpl13a | 1 | Rpl13a | 2.674 | Rpl13a | 1.841 | Rpl13a | 6 |
Table A5.
Reference gene stability values within the dorsal hippocampus of rats in the latent and chronic phases of the lithium–pilocarpine temporal lobe epilepsy model obtained by four algorithms with the RefFinder online tool.
Table A5.
Reference gene stability values within the dorsal hippocampus of rats in the latent and chronic phases of the lithium–pilocarpine temporal lobe epilepsy model obtained by four algorithms with the RefFinder online tool.
| Dorsal Hippocampus |
|---|
| | Delta CT | BestKeeper | NormFinder | GeNorm | Comprehensive Ranking |
|---|
| Rank | Gene | Average of STDV | Gene | Std Dev | Gene | Stability Value | Gene | Stability Value | Gene | Geomean of Ranking Values |
|---|
| 1 | Pgk1 | 0.26 | Ppia | 0.2 | Pgk1 | 0.115 | Hprt1 | Ywhaz | 0.134 | Pgk1 | 1.57 |
| 2 | Ywhaz | 0.27 | Pgk1 | 0.2 | Ppia | 0.153 | | | Ppia | 2.21 |
| 3 | Ppia | 0.28 | Gapdh | 0.21 | Ywhaz | 0.18 | Pgk1 | 0.168 | Ywhaz | 2.34 |
| 4 | Hprt1 | 0.29 | Rpl13a | 0.25 | Gapdh | 0.22 | Ppia | 0.218 | Hprt1 | 3.31 |
| 5 | Gapdh | 0.32 | Ywhaz | 0.29 | Hprt1 | 0.225 | Gapdh | 0.252 | Gapdh | 4.16 |
| 6 | Rpl13a | 0.41 | Hprt1 | 0.3 | Rpl13a | 0.373 | Rpl13a | 0.305 | Rpl13a | 5.42 |
Table A6.
Reference gene stability values within the ventral hippocampus of rats in the latent and chronic phases of the lithium–pilocarpine temporal lobe epilepsy model obtained by four algorithms with the RefFinder online tool.
Table A6.
Reference gene stability values within the ventral hippocampus of rats in the latent and chronic phases of the lithium–pilocarpine temporal lobe epilepsy model obtained by four algorithms with the RefFinder online tool.
| Ventral Hippocampus |
|---|
| | Delta CT | BestKeeper | NormFinder | GeNorm | Comprehensive Ranking |
|---|
| Rank | Gene | Average of STDV | Gene | Std Dev | Gene | Stability Value | Gene | Stability Value | Gene | Geomean of Ranking Values |
|---|
| 1 | Pgk1 | 0.41 | Ppia | 0.32 | Pgk1 | 0.089 | Hprt1 | Ywhaz | 0.203 | Pgk1 | 1.73 |
| 2 | Ywhaz | 0.46 | Rpl13 | 0.33 | Gapdh | 0.297 | | | Ywhaz | 2.51 |
| 3 | Hprt1 | 0.48 | Gapdh | 0.34 | Ppia | 0.303 | Pgk1 | 0.302 | Ppia | 2.94 |
| 4 | Gapdh | 0.48 | Pgk1 | 0.34 | Ywhaz | 0.333 | Gapdh | 0.356 | Hprt1 | 3.08 |
| 5 | Ppia | 0.49 | Ywhaz | 0.49 | Hprt1 | 0.352 | Ppia | 0.399 | Gapdh | 3.36 |
| 6 | Rpl13a | 0.71 | Hprt1 | 0.5 | Rpl13 | 0.66 | Rpl13a | 0.504 | Rpl13a | 4.56 |
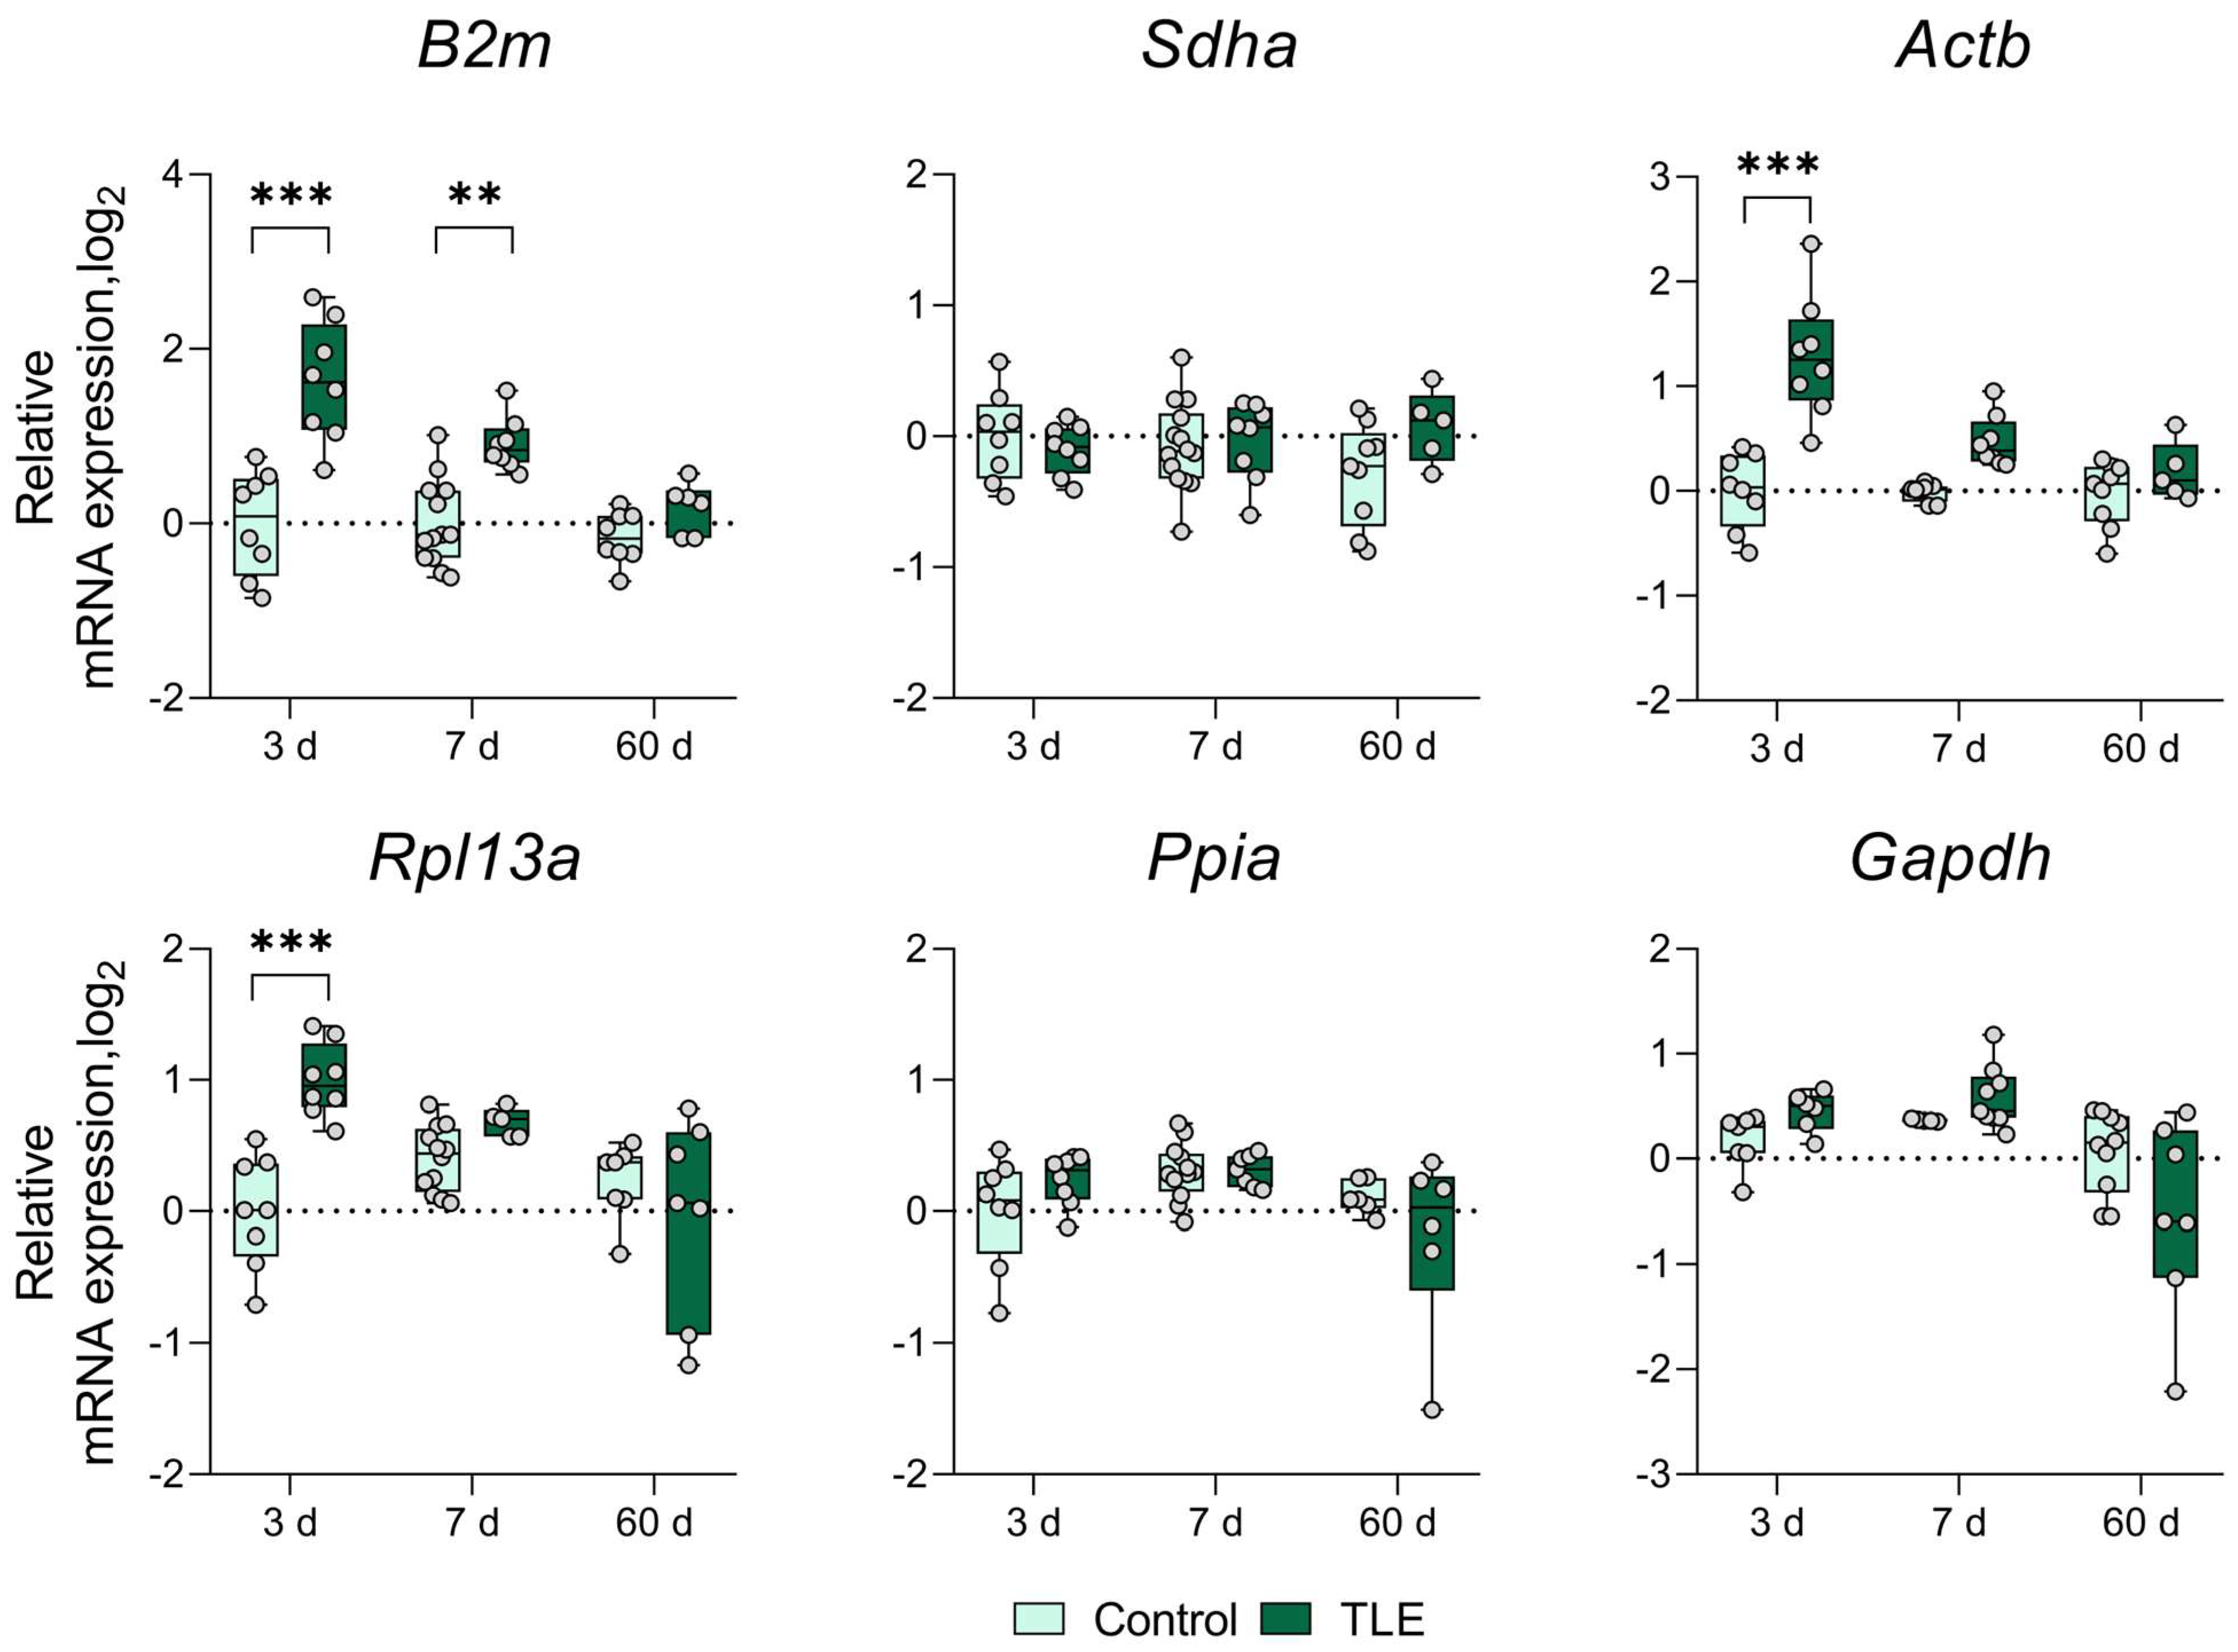
Figure A1.
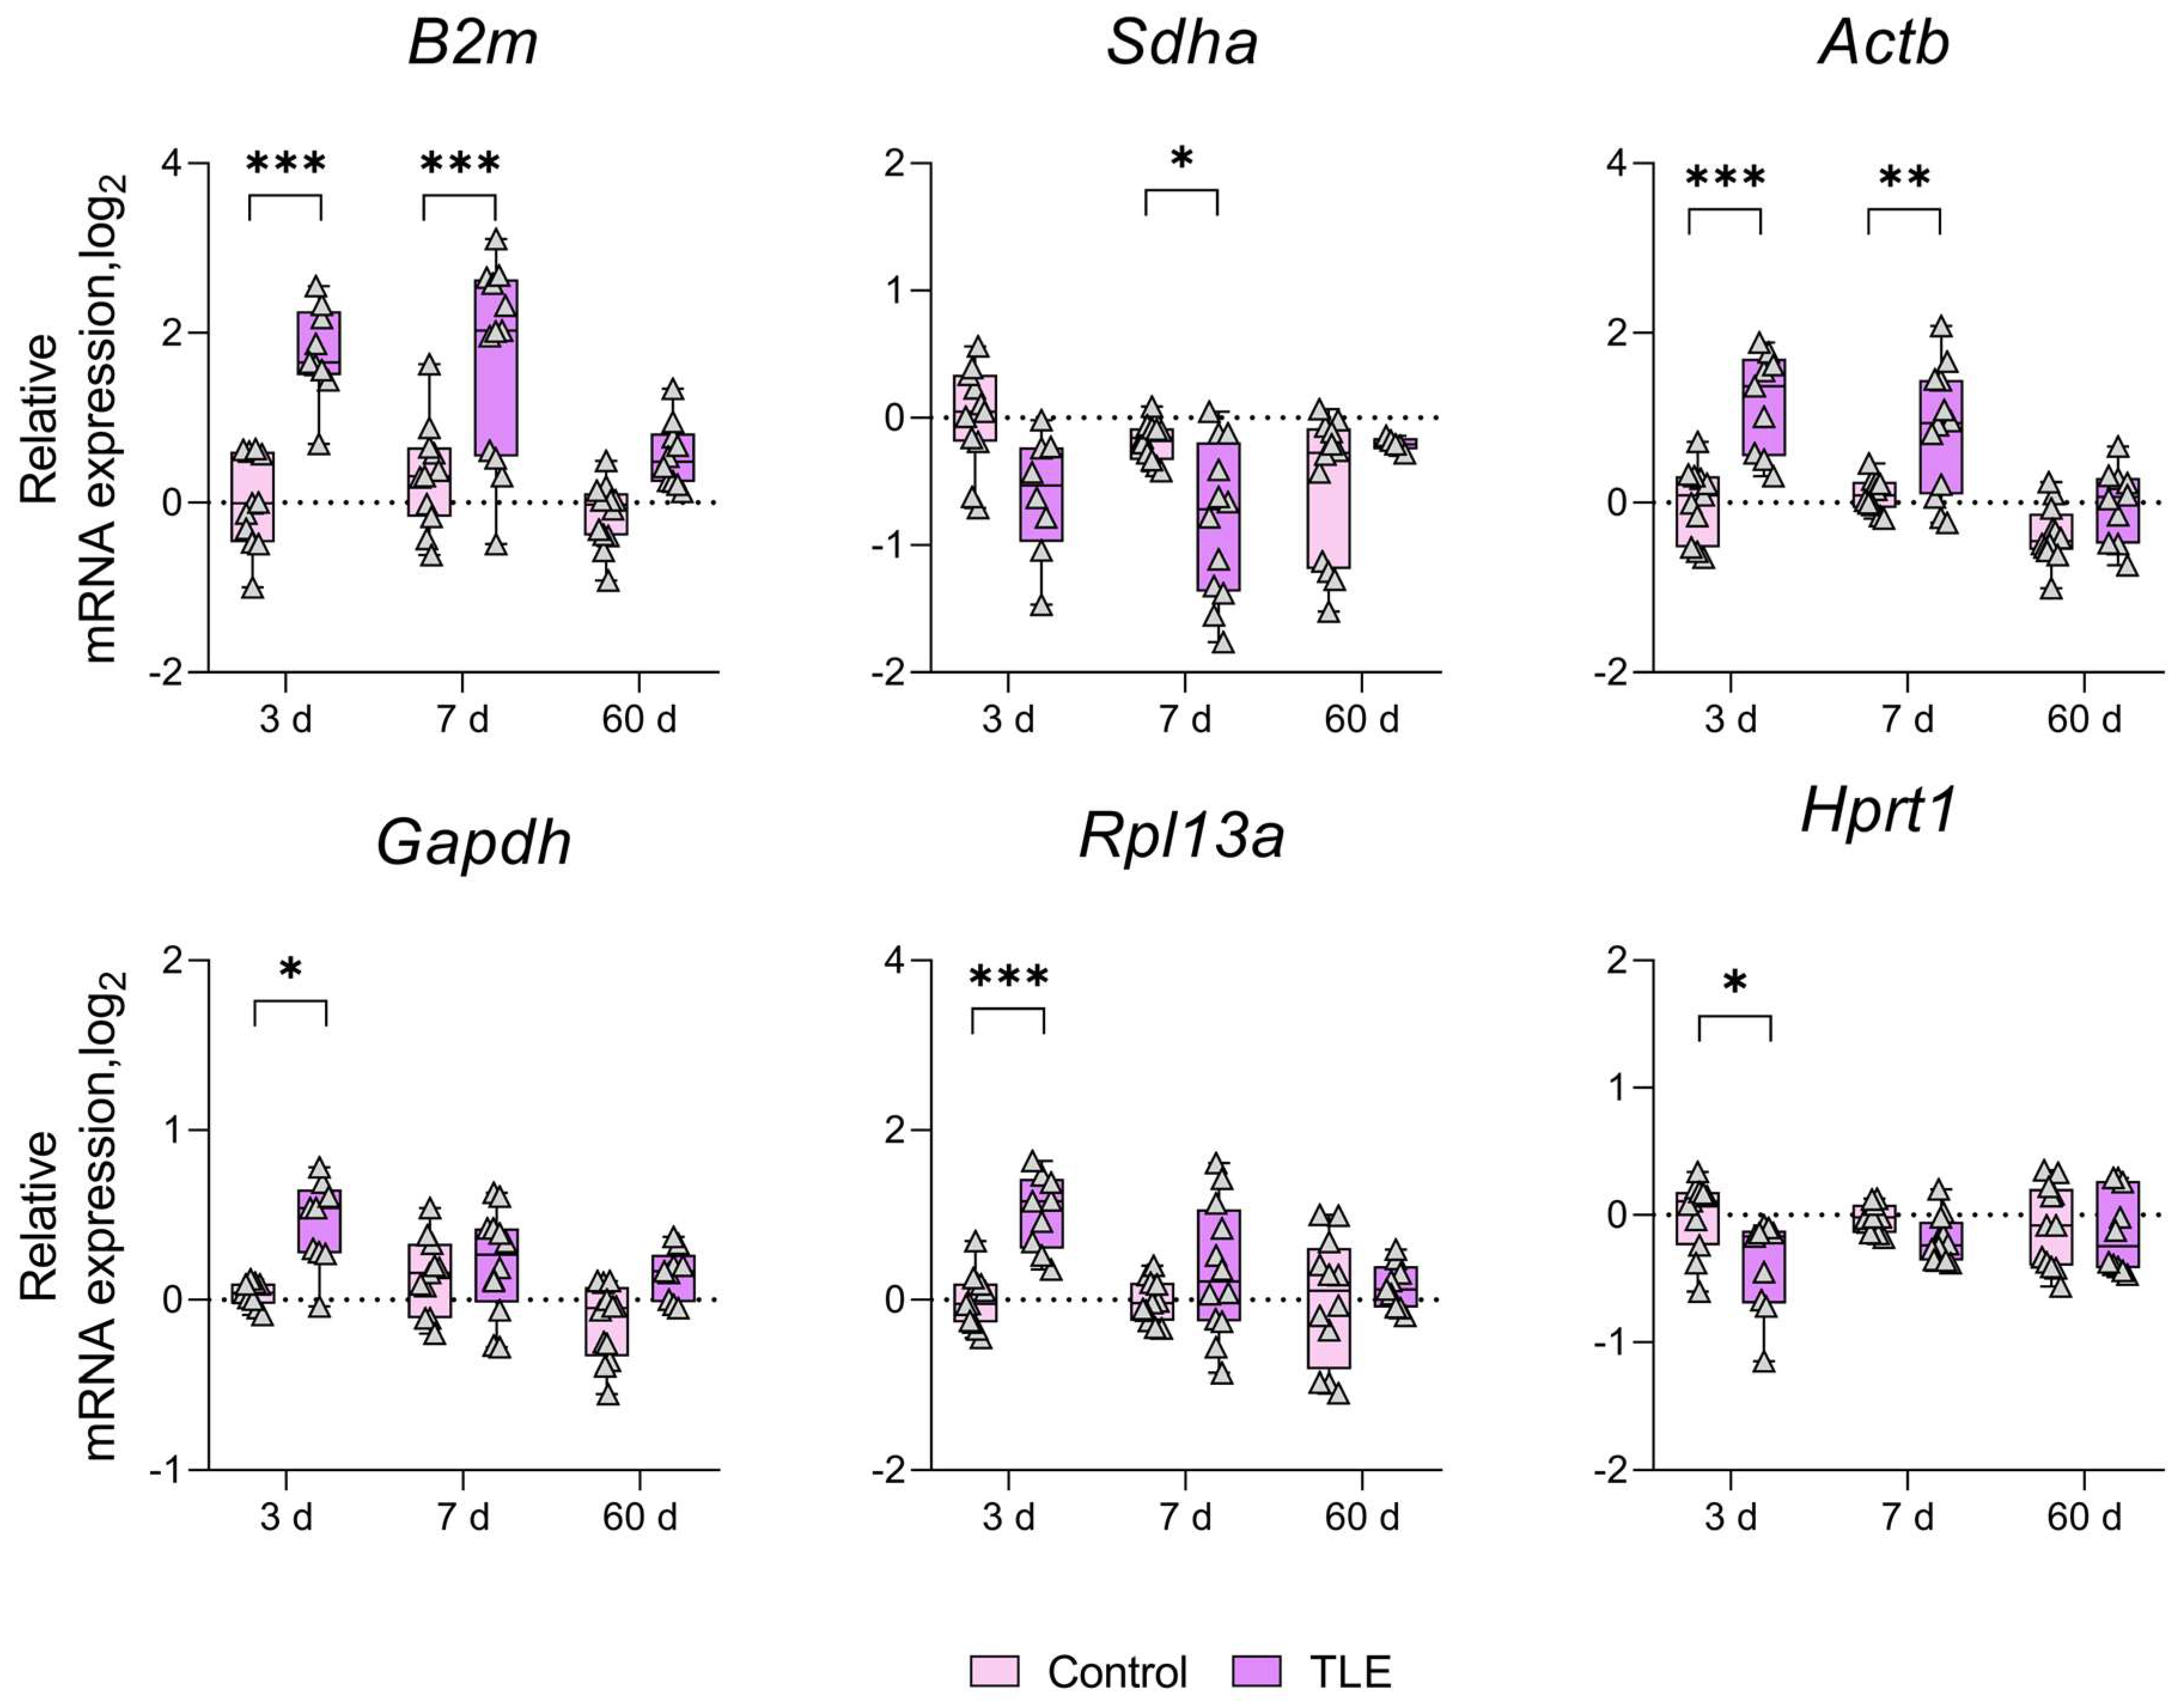
Changes in the expression of commonly used reference genes in the dorsal hippocampal area. Analysis was performed 3, 7, and 60 days after pilocarpine-induced status epilepticus. The data were normalized to the expression levels of the three most stable genes (Pgk1, Ppia, and Ywhaz) in the rat lithium–pilocarpine model of temporal lobe epilepsy. *, *** p < 0.05 or p < 0.001, respectively (two-way ANOVA followed by Sidak post hoc test); Control—control group, TLE—experimental group. All the data are presented as individual values (triangles) with the minimum, maximum, sample median, and first and third quartiles.
Figure A1.
Changes in the expression of commonly used reference genes in the dorsal hippocampal area. Analysis was performed 3, 7, and 60 days after pilocarpine-induced status epilepticus. The data were normalized to the expression levels of the three most stable genes (Pgk1, Ppia, and Ywhaz) in the rat lithium–pilocarpine model of temporal lobe epilepsy. *, *** p < 0.05 or p < 0.001, respectively (two-way ANOVA followed by Sidak post hoc test); Control—control group, TLE—experimental group. All the data are presented as individual values (triangles) with the minimum, maximum, sample median, and first and third quartiles.
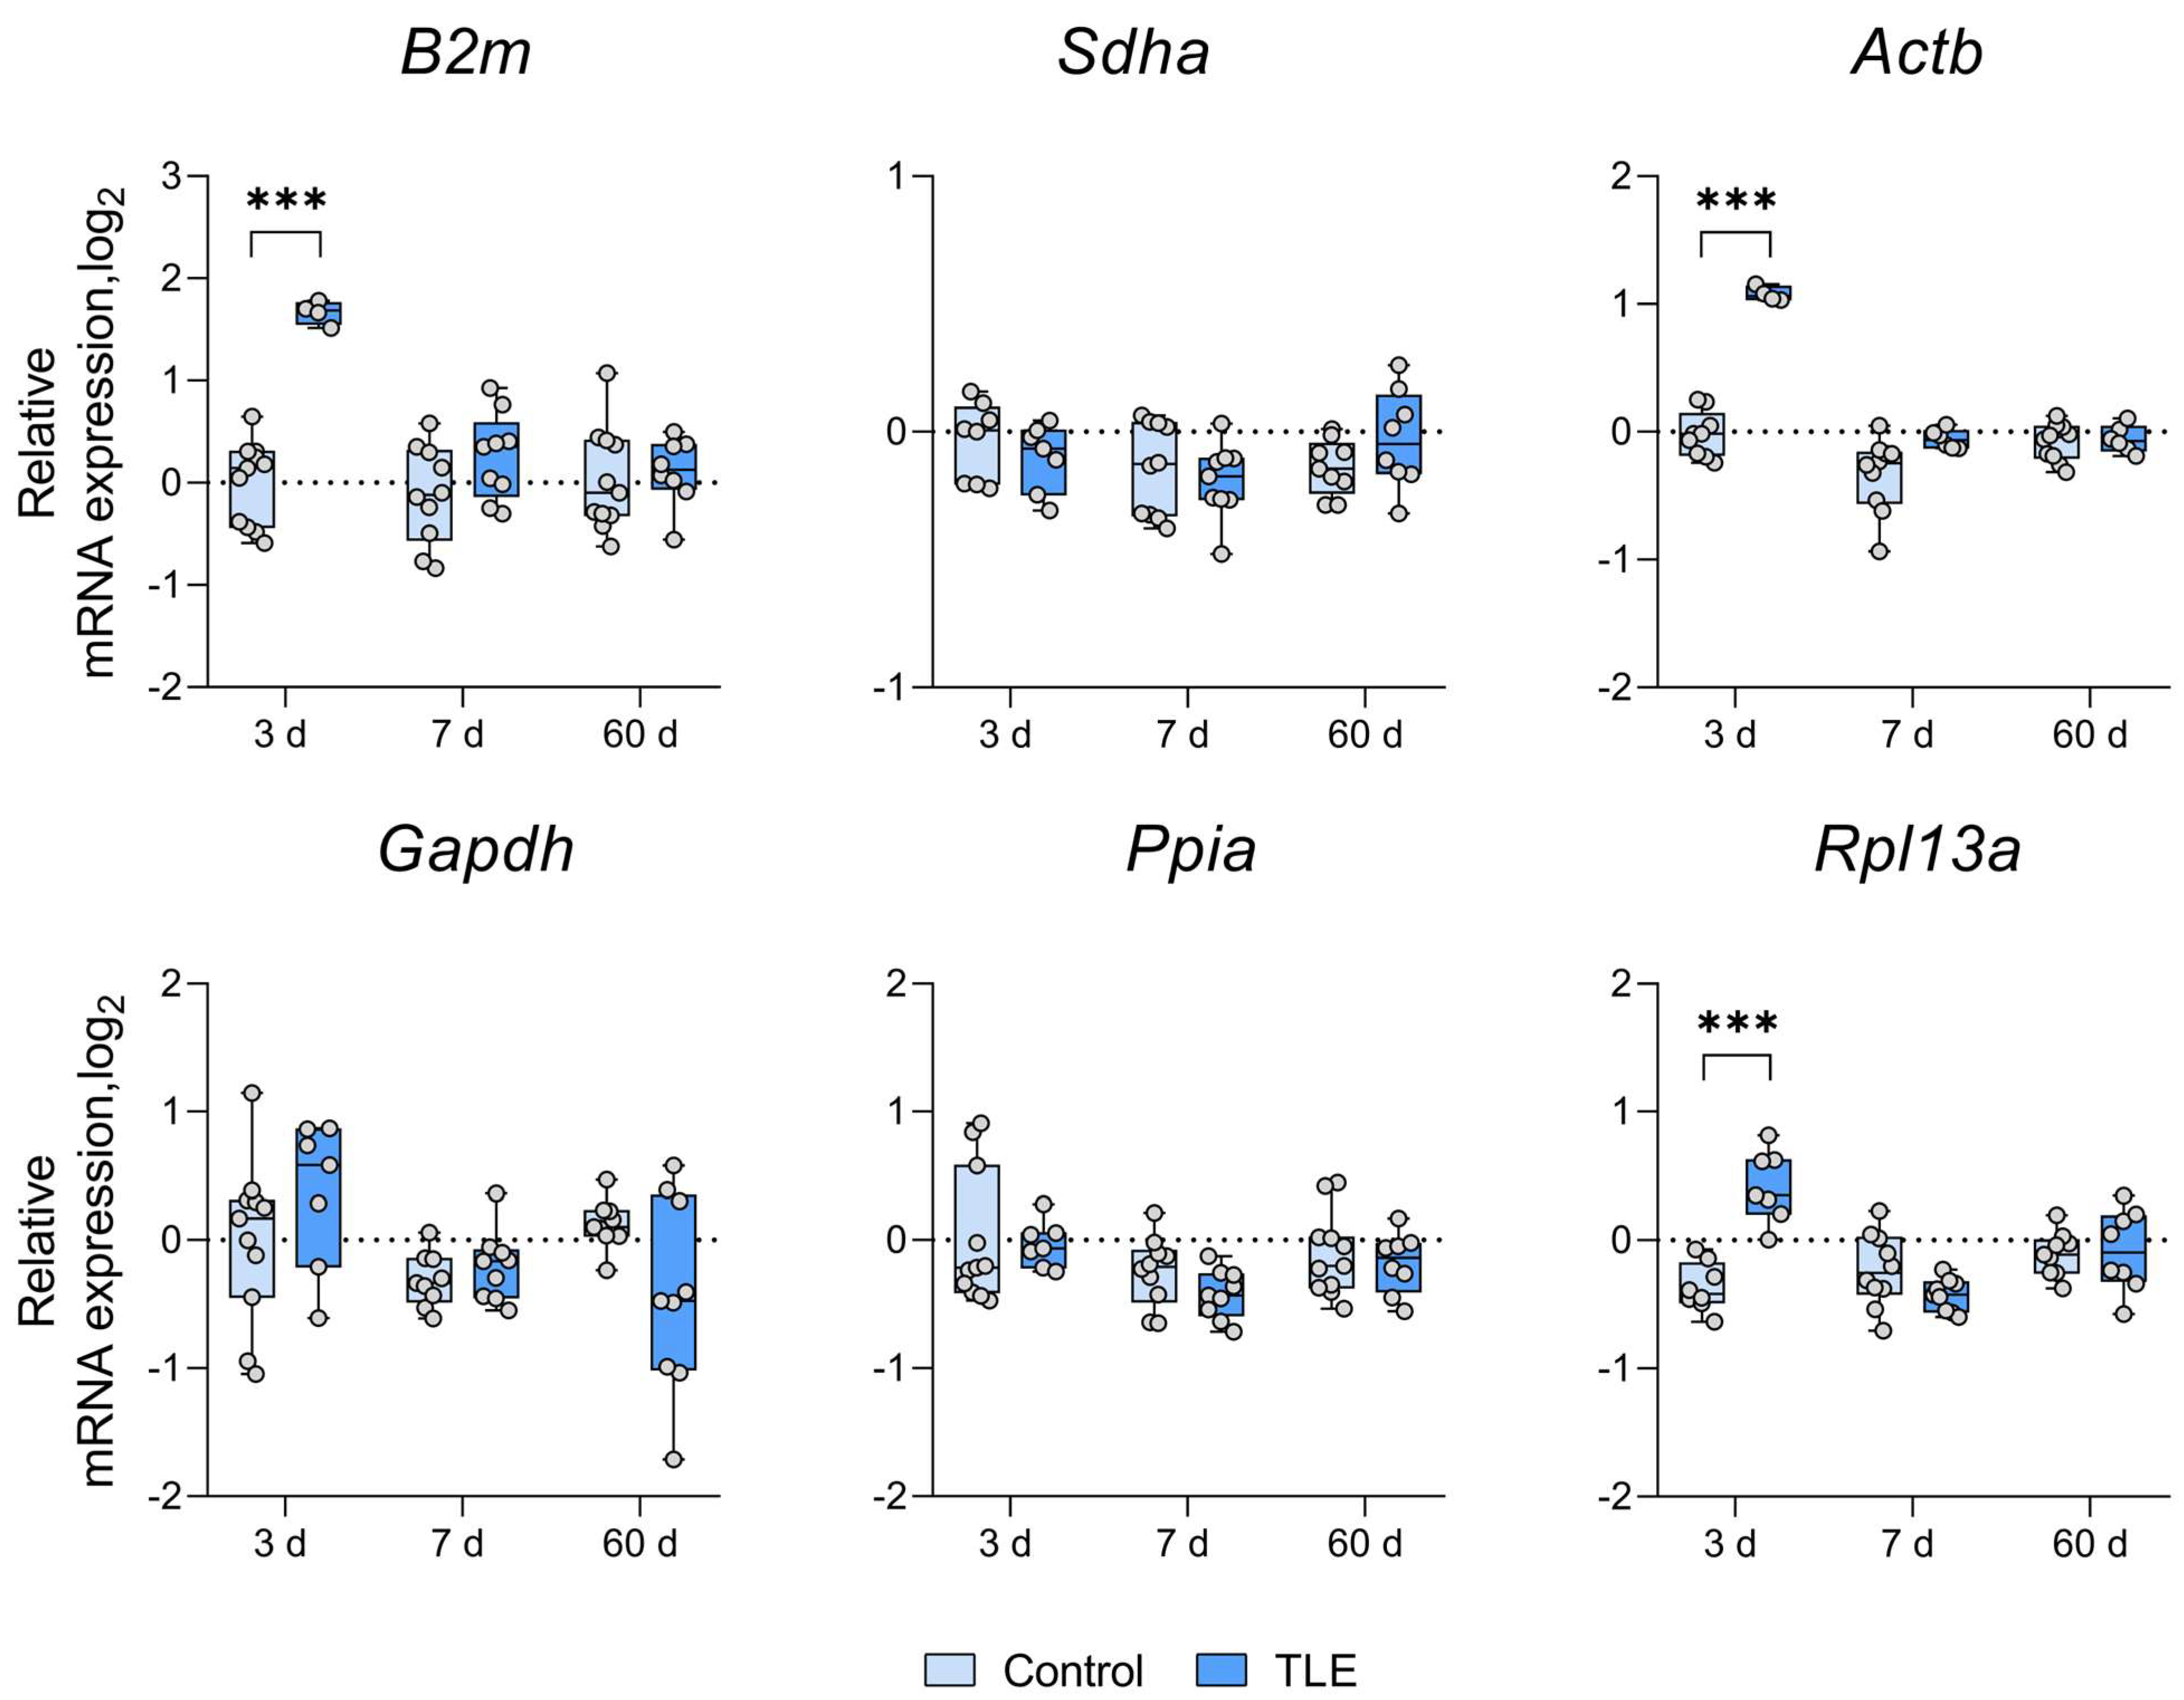
Figure A2.
Changes in the expression of commonly used reference genes in the temporal cortex area. Analysis was performed 3, 7, and 60 days after pilocarpine-induced status epilepticus. The data were normalized to the expression levels of the three most stable genes (Ywhaz, Hprt1, and Pgk1) in the rat lithium–pilocarpine model of temporal lobe epilepsy. **, *** p < 0.01 or p < 0.001, respectively (two-way ANOVA followed by Sidak post hoc test); Control—control group, TLE—experimental group. All the data are presented as individual values (circles) with the minimum, maximum, sample median, and first and third quartiles.
Figure A3.
Changes in the expression of commonly used reference genes in the medial prefrontal cortex area. Analysis was performed 3, 7, and 60 days after pilocarpine-induced status epilepticus. The data were normalized to the expression levels of the three most stable genes (Pgk1, Ywhaz, and Hprt1) in the rat lithium–pilocarpine model of temporal lobe epilepsy. *** p < 0.001 (two-way ANOVA followed by Sidak post hoc test); Control—control group, TLE—experimental group. All the data are presented as individual values (circles) with the minimum, maximum, sample median, and first and third quartiles.
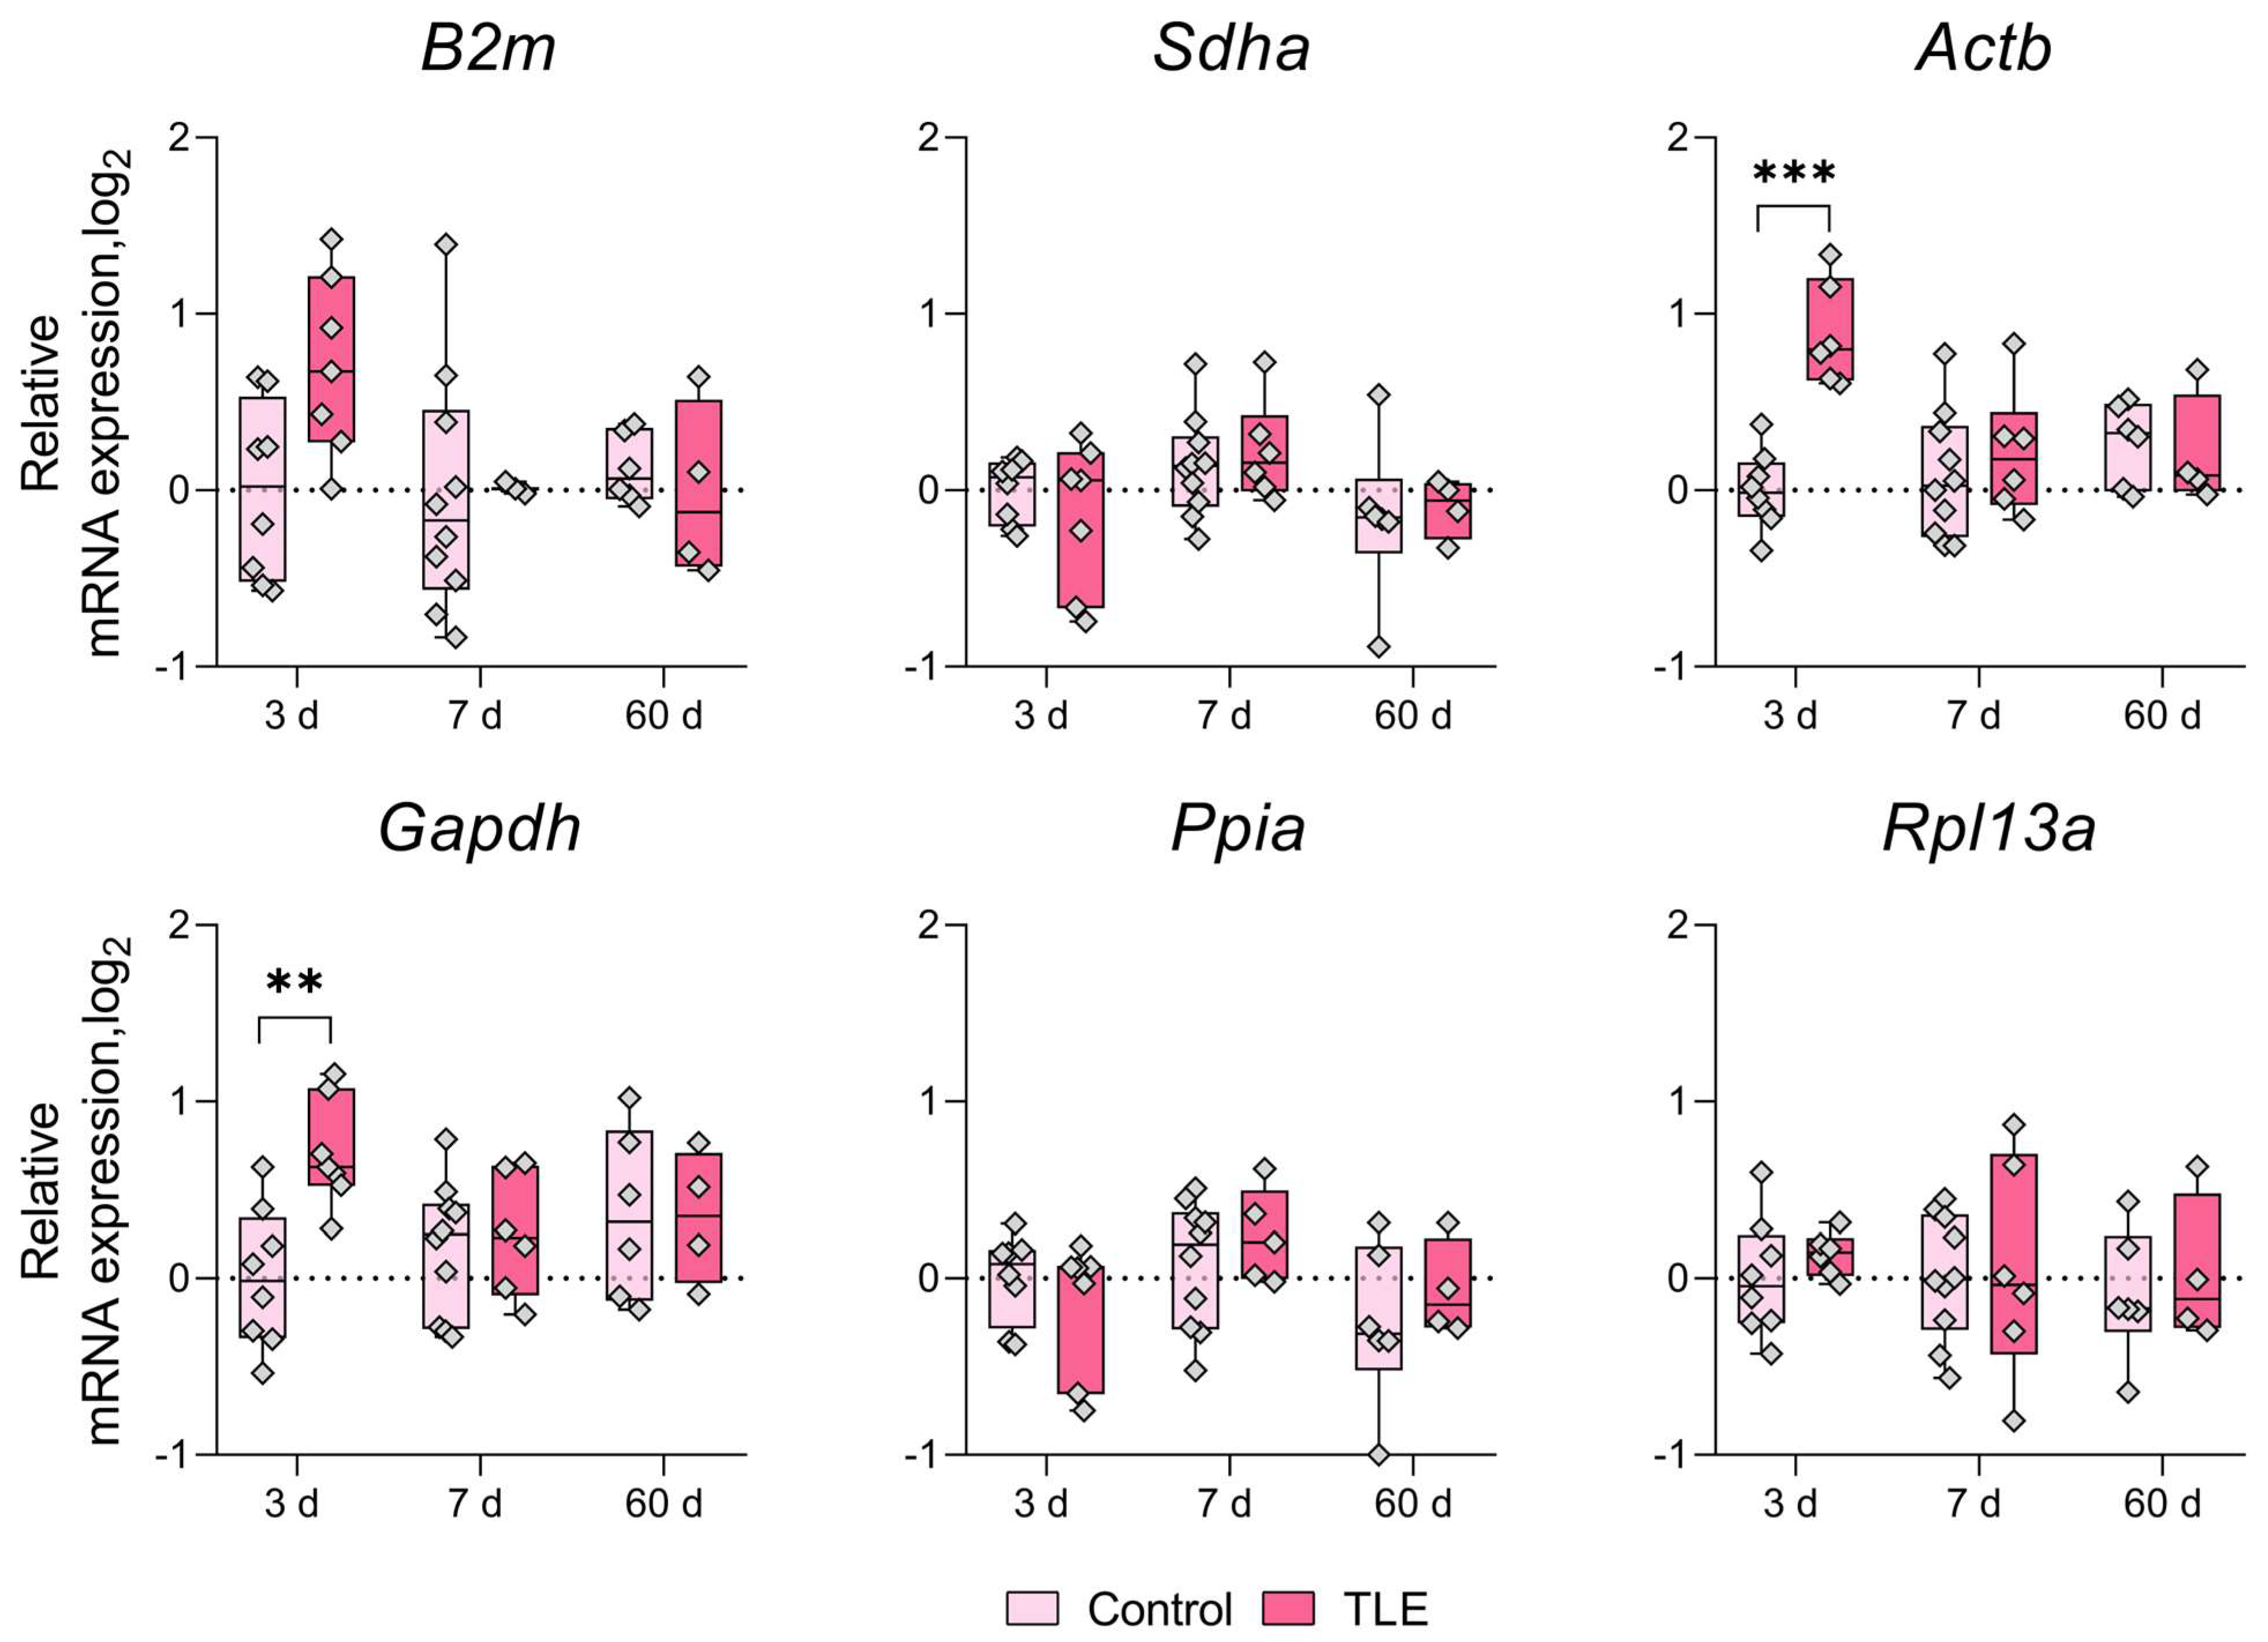
Figure A4.
Changes in the expression of commonly used reference genes in the striatum area. Analysis was performed 3, 7, and 60 days after pilocarpine-induced status epilepticus. The data were normalized to the expression levels of the three most stable genes (Pgk1, Ywhaz, and Hprt1) in the rat lithium–pilocarpine model of temporal lobe epilepsy. **, *** p < 0.01 or p < 0.001, respectively (two-way ANOVA followed by Sidak post hoc test); Control—control group, TLE—experimental group. All the data are presented as individual values (rhombuses) with the minimum, maximum, sample median, and first and third quartiles.
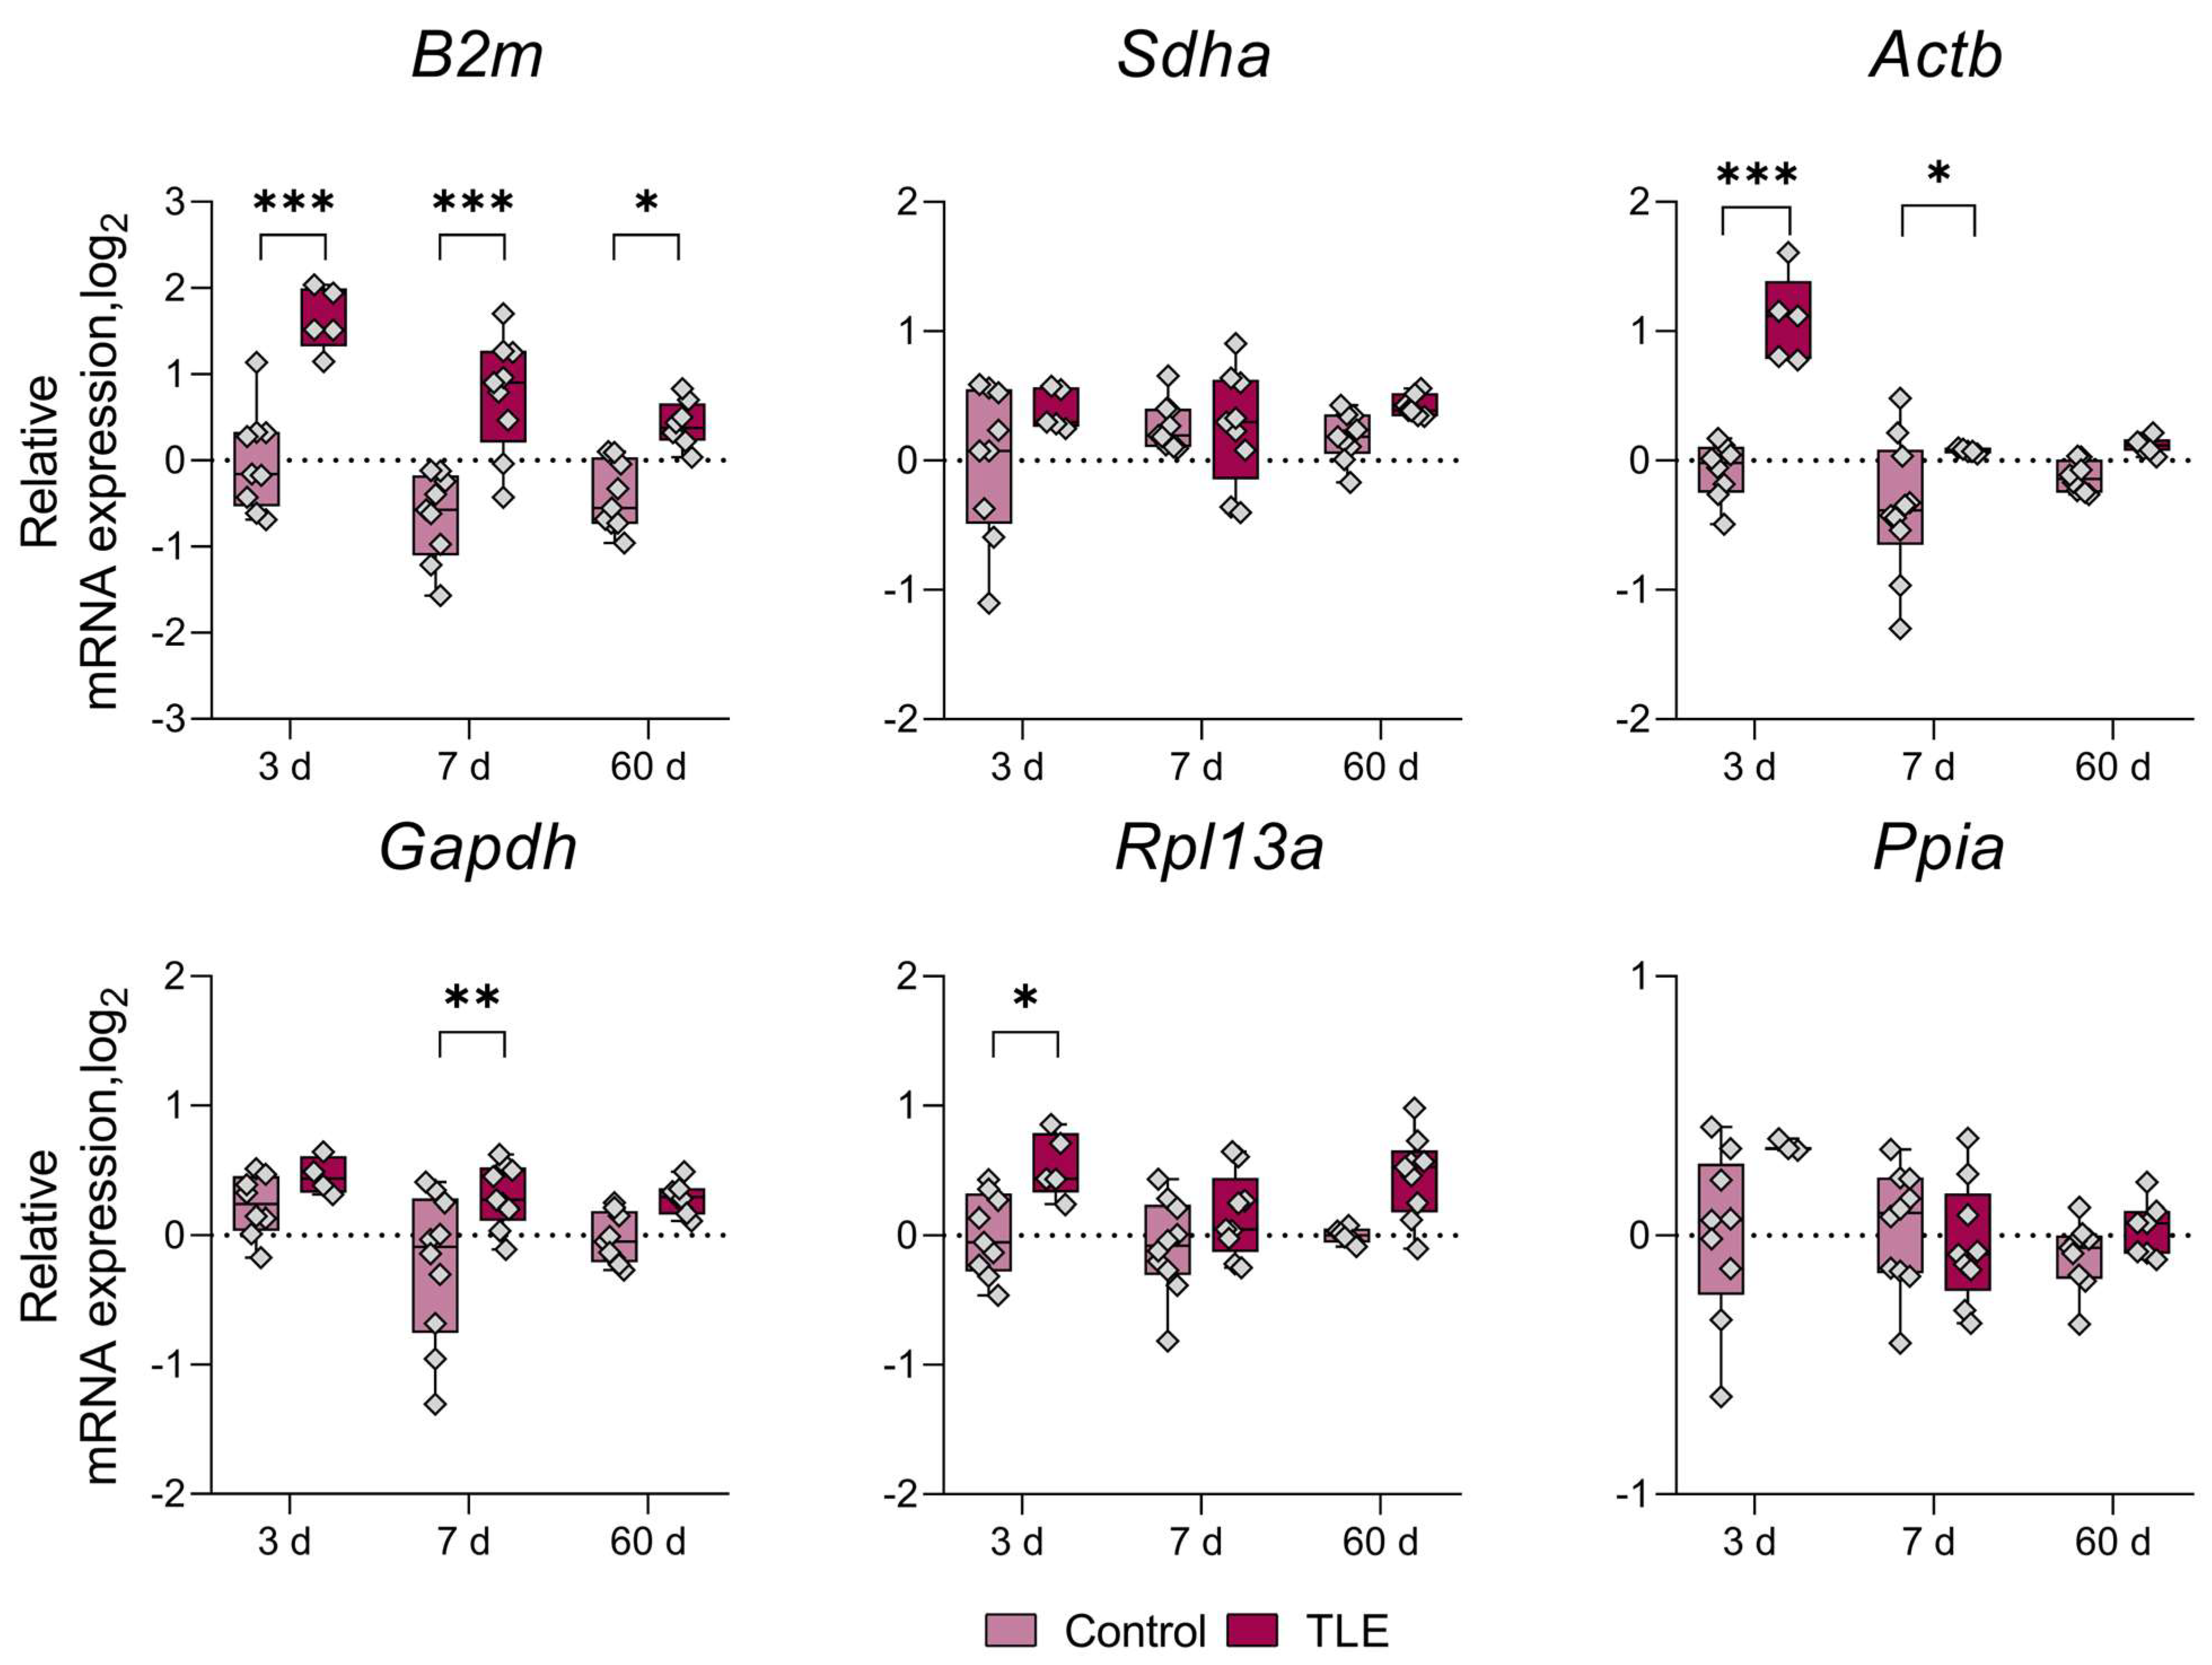
Figure A5.
Changes in the expression of commonly used reference genes in the amygdala area. Analysis was performed 3, 7, and 60 days after pilocarpine-induced status epilepticus. The data were normalized to the expression levels of the three most stable genes (Pgk1, Ywhaz, and Hprt1) in the rat lithium–pilocarpine model of temporal lobe epilepsy. *, **, *** p < 0.05, p < 0.01 or p < 0.001, respectively (two-way ANOVA followed by Sidak post hoc test); Control—control group, TLE—experimental group. All the data are presented as individual values (rhombuses) with the minimum, maximum, sample median, and first and third quartiles.


 ,
, 