Next Article in Journal
Micellar Electrokinetic Chromatography with Laser-Induced Fluorescence Detection for Separation of Red and Yellow Historical Dyes
 
 
Please note that, as of 1 January 2016, Chromatography has been renamed to Separations and is now published here.
Article

Oroxylum indicum Seeds—Analysis of Flavonoids by Micellar Electrokinetic Chromatography

Institute of Pharmacy, Pharmacognosy, University of Innsbruck, Innrain 80-82, 6020 Innsbruck, Austria
*
Author to whom correspondence should be addressed.
Chromatography 2014, 1(1), 1-8; https://doi.org/10.3390/chromatography1010001
Submission received: 5 January 2013 / Revised: 16 February 2013 / Accepted: 19 February 2013 / Published: 25 February 2013

Abstract

:
Flavonoids are bioactive constituents in Oroxylum indicum seeds, an Asian traditional remedy used for the treatment of respiratory infections. In this study the first capillary electrophoretic method for their determination is presented. By using a 25 mM borax buffer at pH 9.2 containing 10 mM SDS as detergent, the determination of seven flavonoids was feasible in only 13 min. Method validation confirmed that the assay is in accordance with ICH requirements in respect to linearity, selectivity, sensitivity, accuracy and precision. Quantitative results revealed that baicalein-7-O-gentiobioside is the most abundant flavonoid in the drug (1.19 to 5.33%), followed by other baicalein derivatives (7-O-glucoside, 7-O-glucuronide). These observations were in good qualitative and quantitative agreement with LC-MS results.

Graphical Abstract

1. Introduction

Oroxylum indicum (L.) Vent. (Bignoniaceae) is an up to 12 m high tree, native to the Indian subcontinent (Assam to southern China). In Ayurvedic and traditional Chinese medicine the bark and seeds of the plant are used, and the latter can easily be recognized as the rather small, kidney shaped seeds are surrounded by a light brown, papery wing up to 5 cm in diameter [1,2]. Termed as mù hú dié a monograph on O. indicum seeds can be found in the current version of the Chinese Pharmacopeia [3]. Major indications described are the treatment of respiratory infections such as cough, sore throat and hoarseness. Pharmacological studies confirmed anti-inflammatory and anti-oxidative activities of the respective extracts and especially emphasized on the role of flavonoids as bioactive constituents [4,5,6]. Accordingly, these compounds (mainly baicalein and chrysin glycosides) are considered as indicators for drug quality and efficacy.
We recently have published the first LC-MS procedure for the qualitative and quantitative determination of all major flavonoids in O. indicum seeds [7]. It showed that their total content is quite variable (2.4 to 13.1%), with baicalein-7-O-gentiobioside being the most dominant compound. The described procedure permits the separation of seven relevant compounds in 20 min and it was fully validated. Six of them were identified by NMR experiments after isolation, the seventh was only tentatively assigned by LC-MS. Yet, due to the high separation efficiency of capillary electrophoresis (CE) and previous experiences with the CE-analysis of flavonoids [8,9], the question remained, whether this technique is suited (if not superior) for the analysis of flavonoids in O. indicum seeds too.

2. Experimental Section

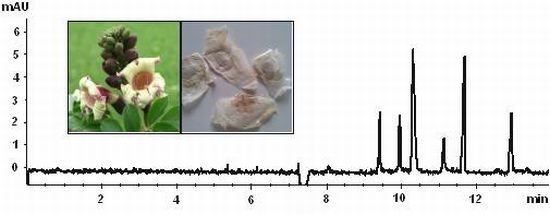
2.1. Chemicals, References and Plant Material

All chemicals (sodium dodecylsulfate (SDS), sodium tetraborate (borax), sodium hydroxide) and solvents (acetonitrile, acetone, dichloromethane, methanol, and water) were of analytical grade and came from Merck (Darmstadt, Germany). Reference standards of baicalein (5) and chrysin (6) were purchased from Sigma (St. Louis, MO, USA), all other compounds (baicalein-7-O-gentiobioside (2), baicalein-7-O-glucoside (3), chrysin-7-O-glucuronide (4) and baicalein-7-O-glucuronide (7)), except (1), were isolated as described before [7]; see Figure 1 for structures. Compound (1) was obtained by semi-preparative HPLC from the methanolic plant extract of sample OI-1 and based on NMR experiments identified as chrysin-7-O-gentiobioside [10].
Figure 1. Chemical structures of the main flavonoids in O. indicum seeds.
Chromatography 01 00001 g001
Four batches of O. indicum seeds (OI-1 to OI-4) were analyzed in this study; OI-1 was purchased from Plantasia (Oberndorf, Austria), and the others came from herbal markets in China (OI-2) or Vietnam (OI-3 and OI-4). The plant material was authenticated by one of the authors (A. Krüger) and voucher specimens are deposited at the Institute of Pharmacy, Pharmacognosy, University of Innsbruck, Austria.

2.2. Method Validation

Linearity of the detector signal was deduced from correlation coefficients. For their determination solutions of standard substances were serially diluted with methanol over a concentration range of approx. two orders of magnitude and analyzed by CE. By further diluting these solutions the assays sensitivity was investigated. Limit of quantification (LOQ) and limit of detection (LOD) are defined as a signal to noise ratio of 10 and 3; respective concentrations were visually evaluated. For the determination of precision multiple portions of the same sample (OI-1) were extracted and analyzed in exactly the same way five times on each of three consecutive days. Variance within the days (intra-day) and over three days (inter-day) was then determined. Accuracy was investigated by spiking one sample (OI-1) with three concentrations of accurately weighted standard compounds. After extraction and analysis recovery rates were calculated, reflecting the agreement of theoretical versus practically found amounts. For these experiments only (5) and (6) were used, since only very small amounts of all other standards were available. Finally, by analyzing the standard deviation of peak areas after multiple injections of the same sample, repeatability of the method could be confirmed.

2.3. Sample Preparation
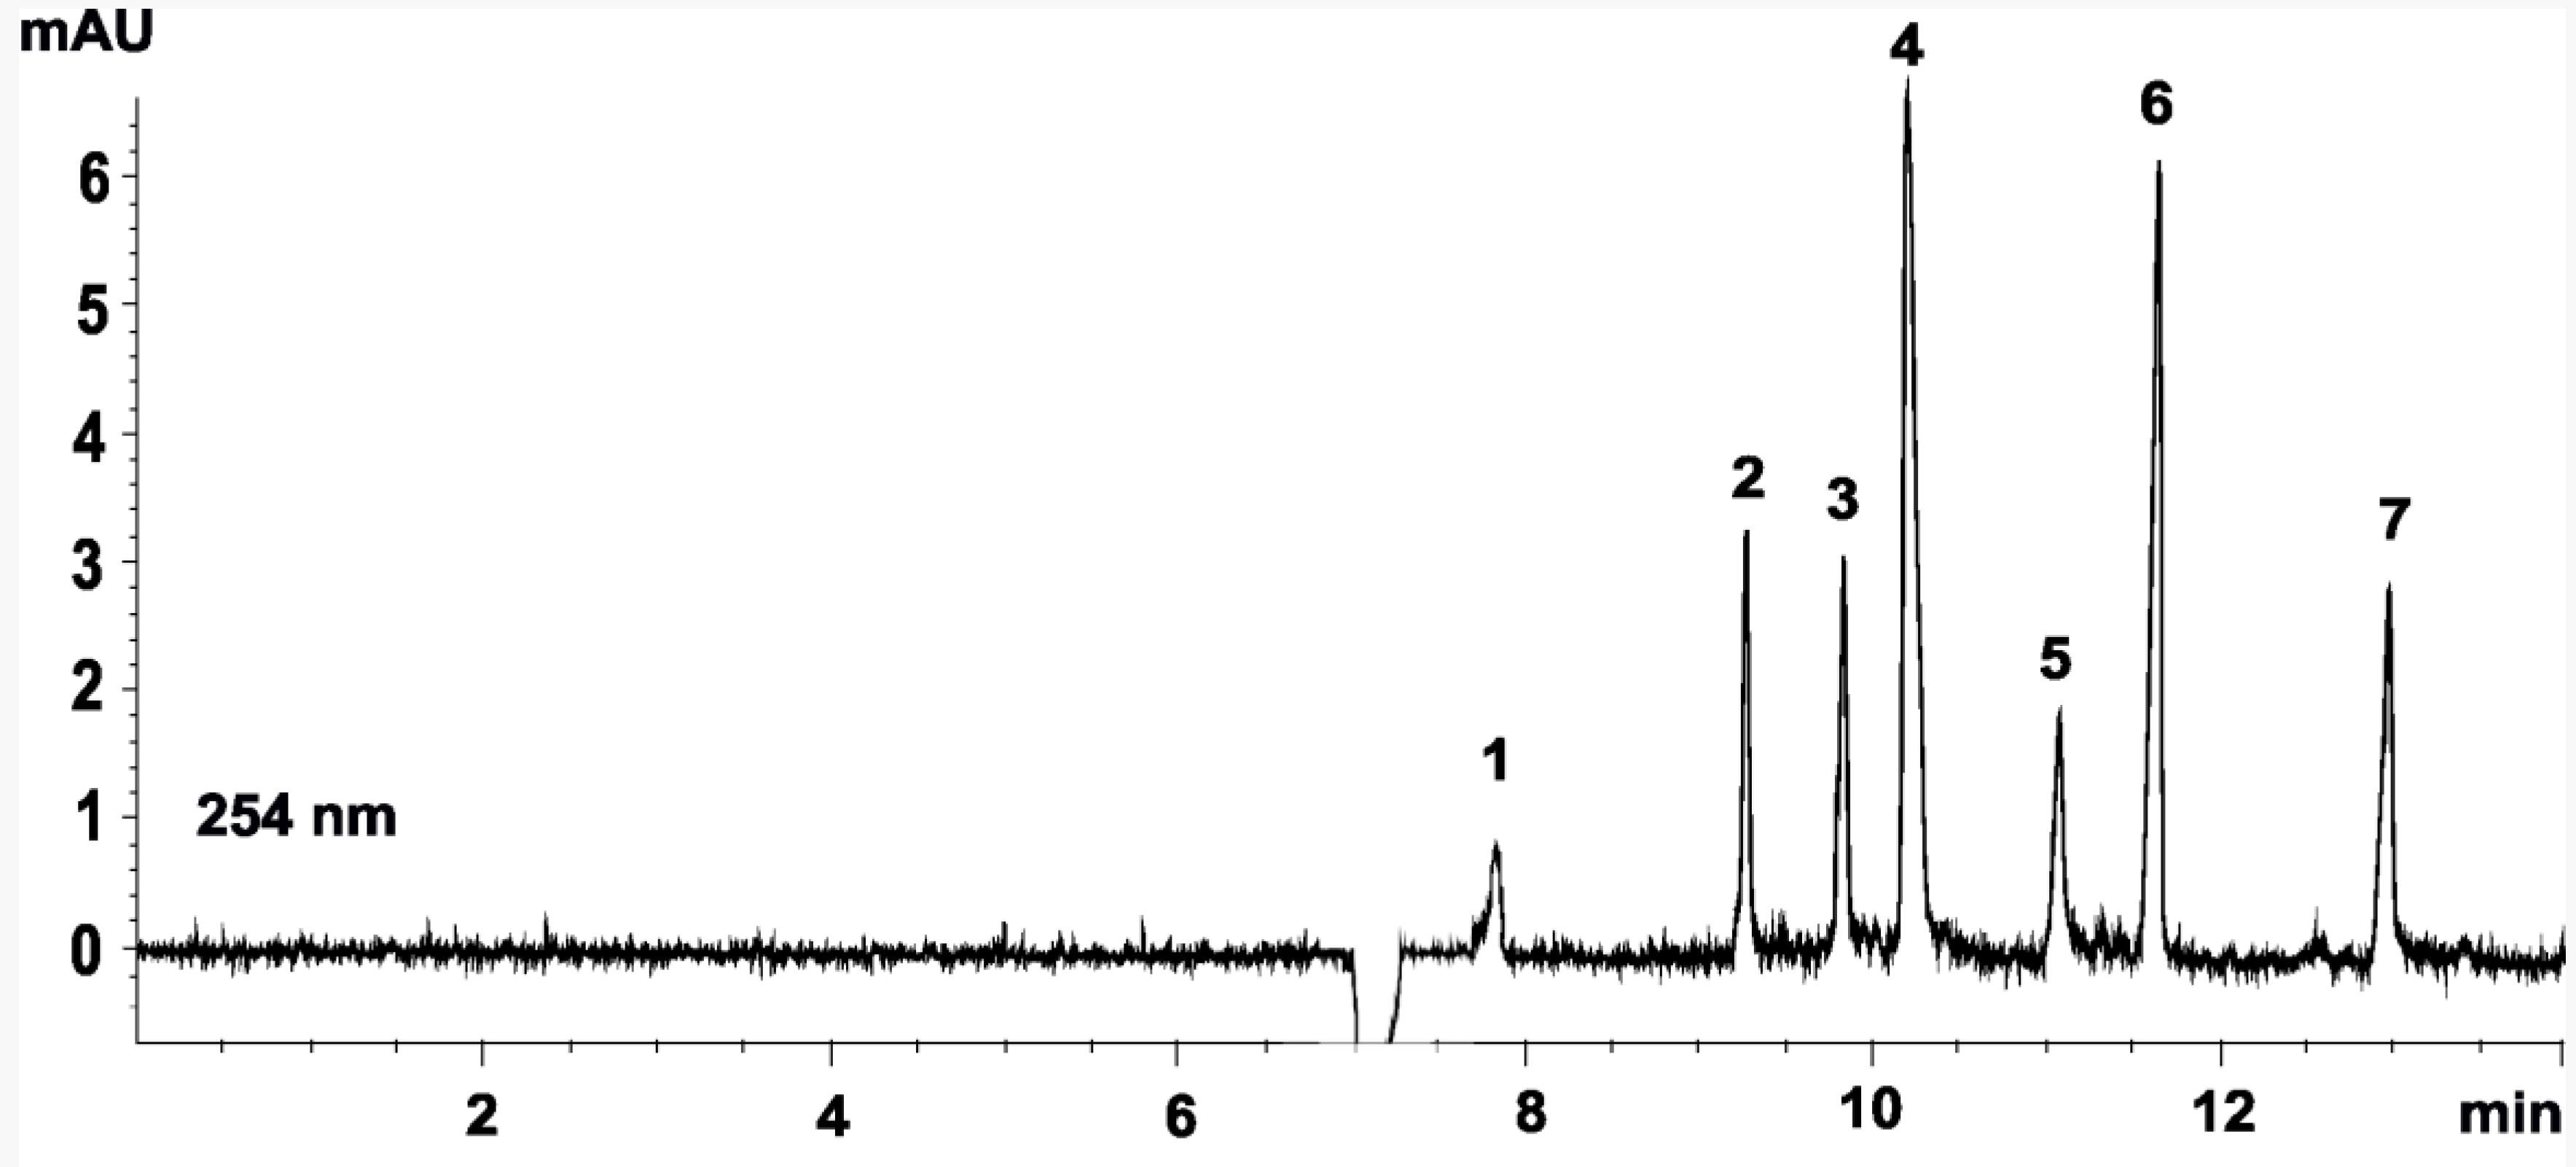
Sample solutions were prepared as those for LC analysis [7]. At first, the dried plant material (3.00 g) was finely powdered and then repeatedly extracted with methanol in a sonicator (4 times with 5 mL each for 10 min). After centrifugation the liquid extracts were combined, the solvent removed under reduced pressure and the obtained residue re-dissolved in methanol (concentration 1.00 mg per mL). Prior to analysis all solutions were membrane filtered (0.2 µm, Minisart SRP 15, Sartorius, Göttingen, Germany).

2.4. CE-Method

Experiments were performed on a 3D-CE system from Agilent (Waldbronn, Germany), and the capillary (fused silica, 50 µm i.d. × 62 cm effective length) was purchased from Polymicro Technologies (Phoenix, AZ, USA). The optimum buffer consisted of 25 mM sodium tetraborate and 10 mM SDS in water (pH of solution 9.2). Diode-array-detection (DAD) wavelength, voltage and capillary temperature were set to 254 nm, +25 kV and 15 °C. Injection was performed in hydrodynamic mode at 50 mbar for 5 s; the required separation time was 13 min. After analysis the capillary was flushed (3 min with 0.1 N NaOH, 2 min with 0.01 N NaOH and 2 min with water) and re-equilibrated for 3 min with the running electrolyte. All required solutions were membrane filtered and replaced with new ones after four runs.

3. Results and Discussion

One of the limitations of CE is the fact that under “normal” conditions only charged analytes can be separated; neutral compounds will migrate unresolved with the electroosmotic flow (EOF). An elegant solution to this dilemma was first reported by Terabe et al., who proposed the use of charged detergents as buffer additives [11]. The micelles formed serve as pseudostationary phase, enabling the separation of charged and uncharged analytes because of hydrophobic interaction with the micelles (micellar electrokinetic chromatography, MEKC). As all of the flavonoids in O. indicum seeds are uncharged at pH-ranges typical for CE this technique was utilized in the current study. Reference standards were available from a previous study (compounds (2) to (7)) or isolated by semi-preparative HPLC (1).

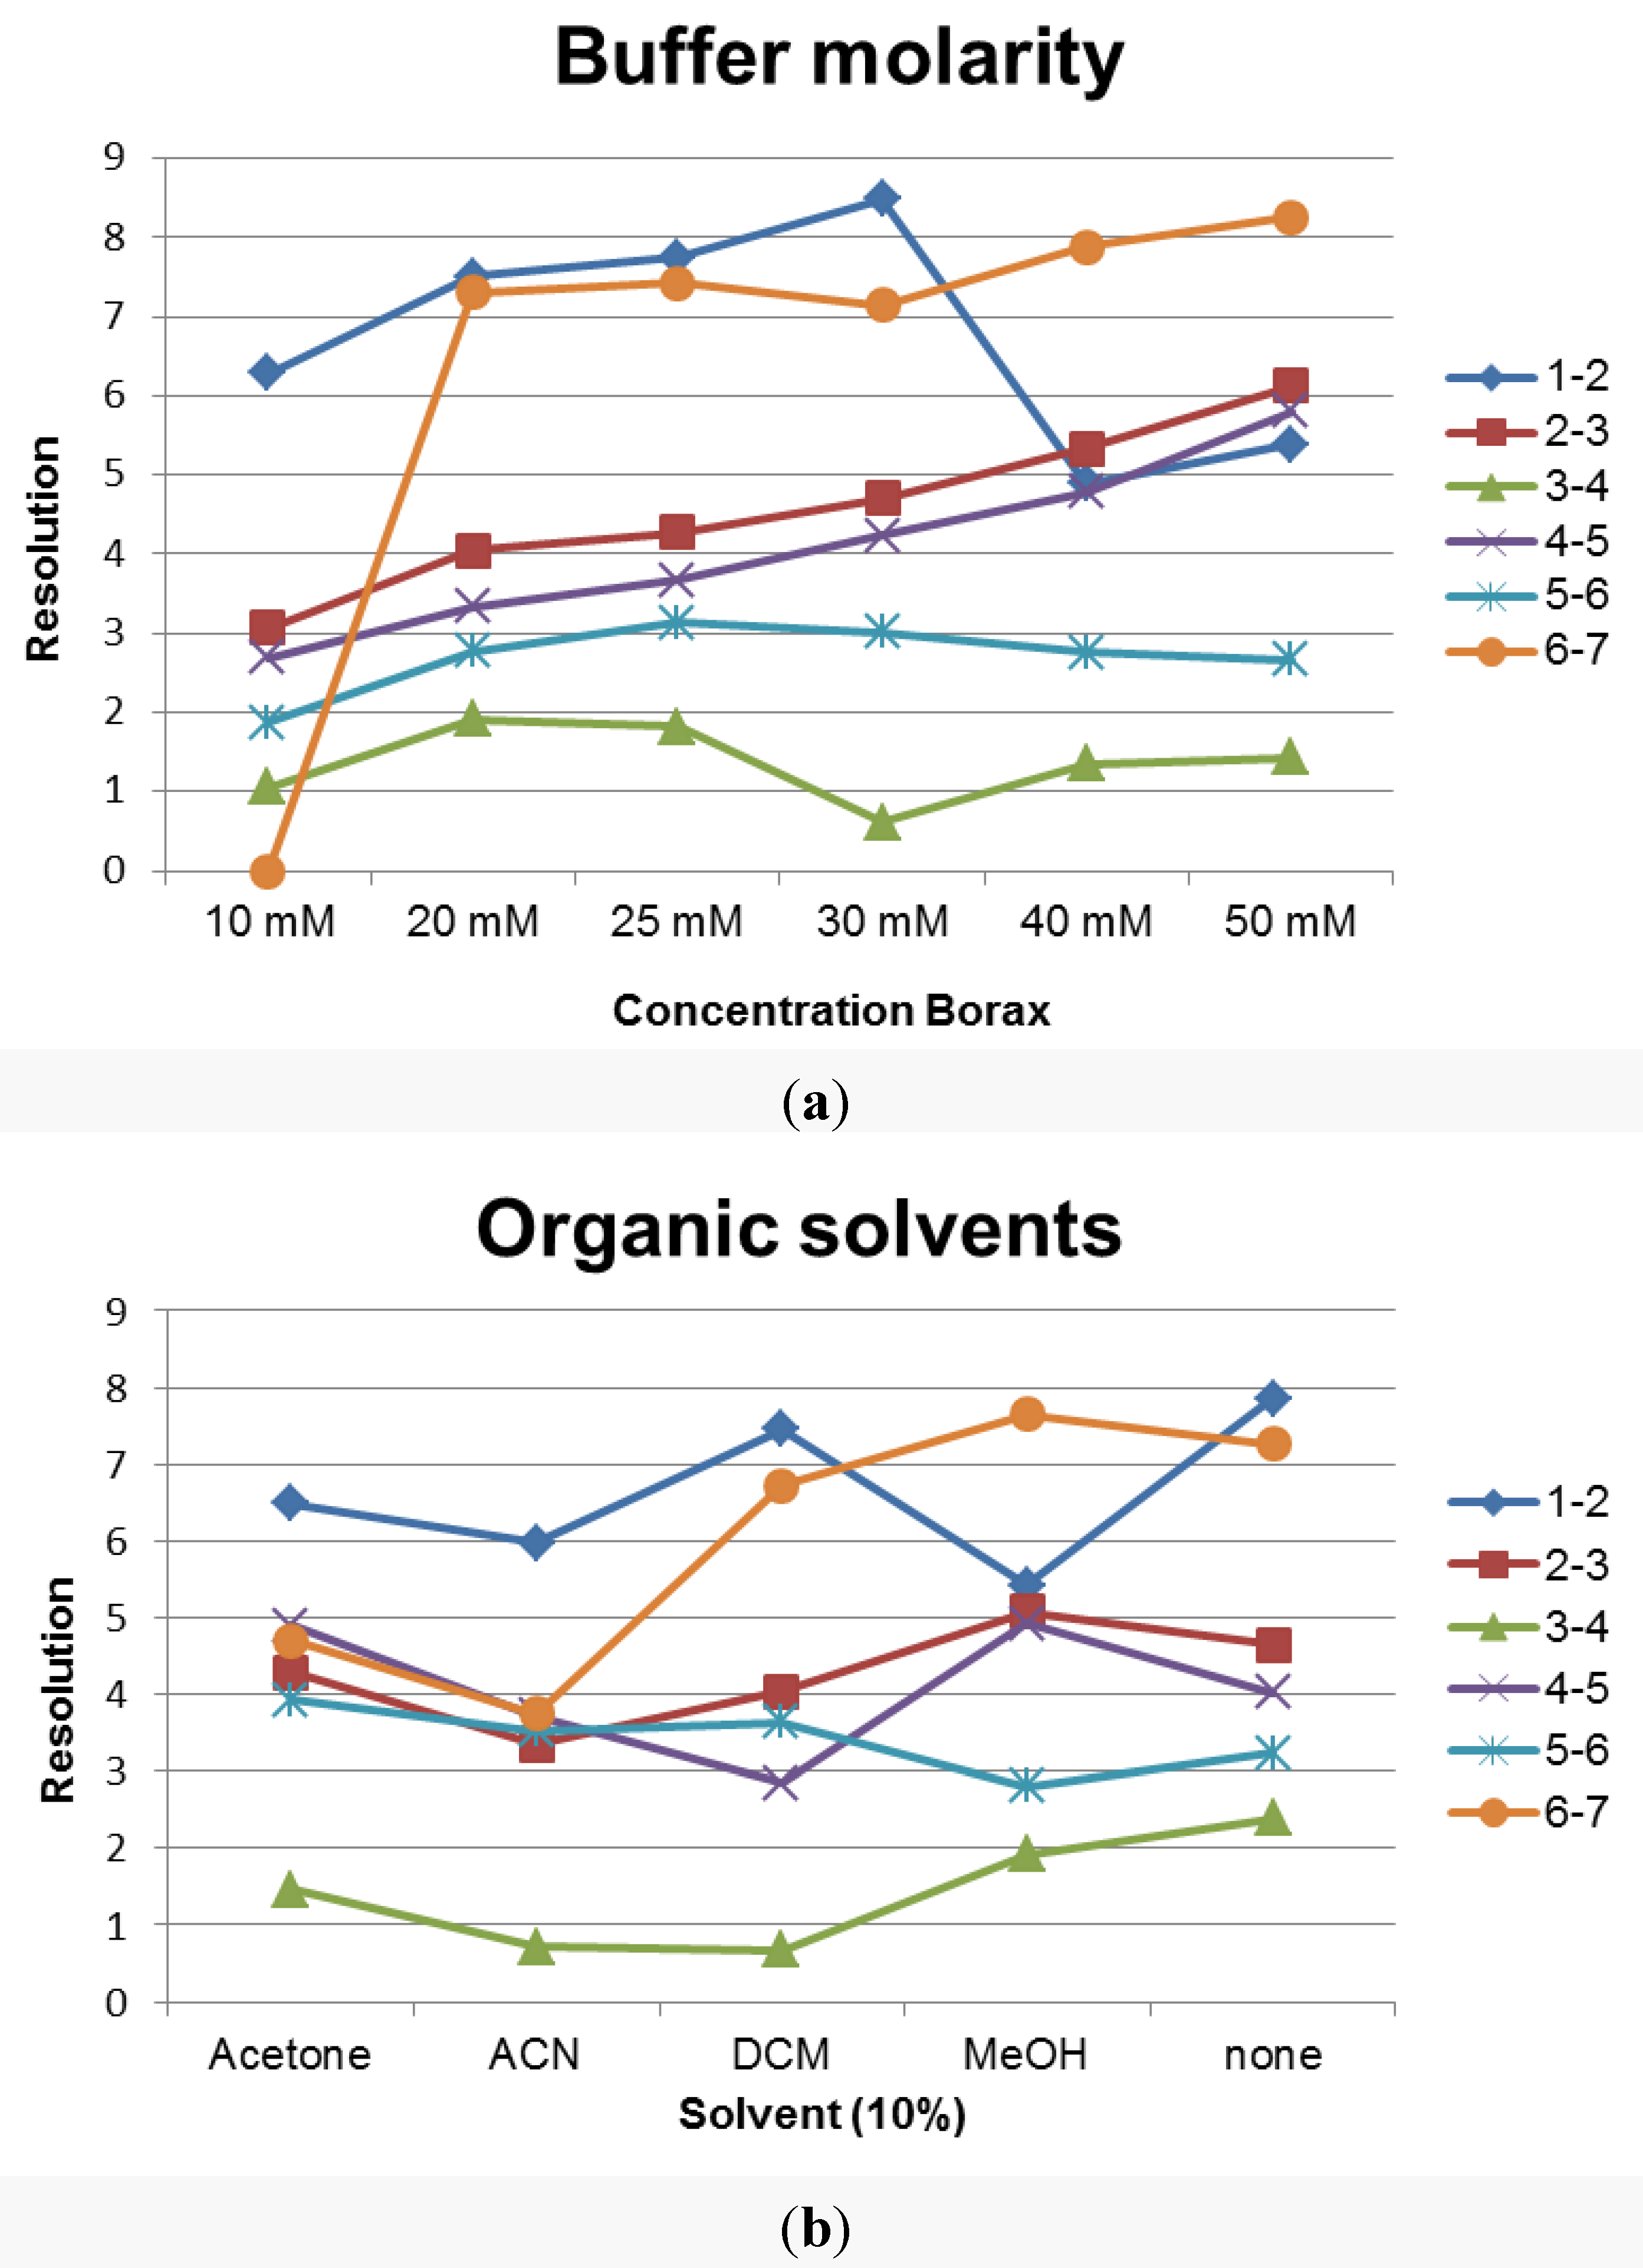
3.1. Method Development

The optimum conditions were evaluated using a standard mixture of all references in methanol (0.1 mg/mL each). For the CE-separation of flavonoids borax buffers are commonly used [8,9], and for this application they showed to be most suitable too. Respective buffer solutions were prepared within a pH-range of 7.5 and 10, and at pH 9.2 (unaltered pH of a borax solution) the overall best peak resolutions (Rs) were observed, i.e., all Rs values of adjacent peaks were higher than 2.2 (Rs calculated as defined in the European Pharmacopeia). With increasing buffer molarity (10 to 50 mM), the resolution increased for most peak-pairs but the signals became broader, so that 25 mM borax was a reasonable compromise (Figure 2(a)).
Figure 2. Effect of buffer molarity (10mM to 50mM) (a) and addition of different organic solvents (10%) (b) on the separation of peaks (17); all data represents the mean of three injections each.
Chromatography 01 00001 g002
Temperatures from 15 °C to 30 °C were tested and showed similar effects as buffer molarity, since resolution and migration time increased at higher temperatures but peak symmetry decreased simultaneously. Therefore, 15 °C was chosen for further work. The addition of SDS to the electrolyte showed an enhancement in separation (i.e., increased Rs values) and peak shape; the optimum was 10 mM SDS as at higher values compounds (3) and (4) could not be resolved anymore. For the best separation a voltage of +25 kV was applied, since lower values resulted in prolonged migration times. The addition of different organic solvents (acetone, acetonitrile (ACN), dichloromethane (DCM) and methanol (MeOH) were tested) to the buffer did not show any significant benefits. In comparison to a “solvent-free” buffer the addition of 10% methanol slightly enhanced the resolution of three peak-pairs (2-3, 4-5, and 6-7), but at the same time those of others decreased (Figure 2(b)). The same trend was observed with 10% acetone in the buffer. Increasing the content of organic solvent up to 30% was not advantageous either.

3.2. Method Validation

After the CE-procedure was optimized it was validated based on the determination of parameters like linearity, sensitivity, selectivity, precision and accuracy (Table 1, Table 2). Validation was done following ICH guidelines and the applied procedures were as described in experimental section.
All validation parameters were well within acceptable limits and mostly comparable to those of the LC-procedure. Linearity of the detector signal was confirmed with excellent correlation coefficients (R2 ≥ 0.999). Intermediate precision was shown to be between 0.4% and 3.3% (intra-day), and from 0.5% to 6.9% for inter-day investigations. The recovery rates for the spiked sample ranged from 97.5 to 100.9% and indicated that the applied procedure is accurate concerning extraction and analysis. Selectivity of the assay was assured by utilizing the peak purity option of the instrument software (chemstation). Based on available DAD-data it confirmed that the quantified signals are free of co-eluting compounds. One parameter that showed a significant deviation compared to the LC method is sensitivity. For the CE assay LOD and LOQ-values are 5 to 10-times higher (e.g., LOD for (5): 2.84 µg/mL by CE versus 0.45 µg/mL by HPLC). Since there was always the same detection wavelength set (254 nm), this divergence can only be explained by the minute sample volume injected in CE (a few nanoliters) and the short optical path available for detection (on-column through a 50 µm capillary).
Table 1. Calibration data of capillary electrophoresis (CE)-assay.
Regression equationR2Range *
1y = 0.12384x0.99912.56–621.96
2y = 0.07970x0.99972.40–673.49
3y = 0.21337x0.99983.69–896.34
4y = 0.11283x0.99958.69–704.20
5y = 0.42260x0.99941.33–973.08
6y = 0.60629x0.99941.37–999.52
7y = 0.32222x0.99986.99–782.89
* µg/mL.
Table 2. Sensitivity, intermediate precision and accuracy of the assay.
LOD * LOQ * Precision (intra-day)Precision (inter-day)Accuracy (high)Accuracy (medium)Accuracy (low)
13.209.690.35%6.90%---
25.3115.031.44%2.72%---
31.865.620.70%4.09%---
43.5110.640.53%5.78%---
50.942.843.32%6.11%99.1%99.1%97.6%
60.522.351.86%5.83%100.9%97.5%99.3%
71.244.821.54%6.64%---
* µg/mL.

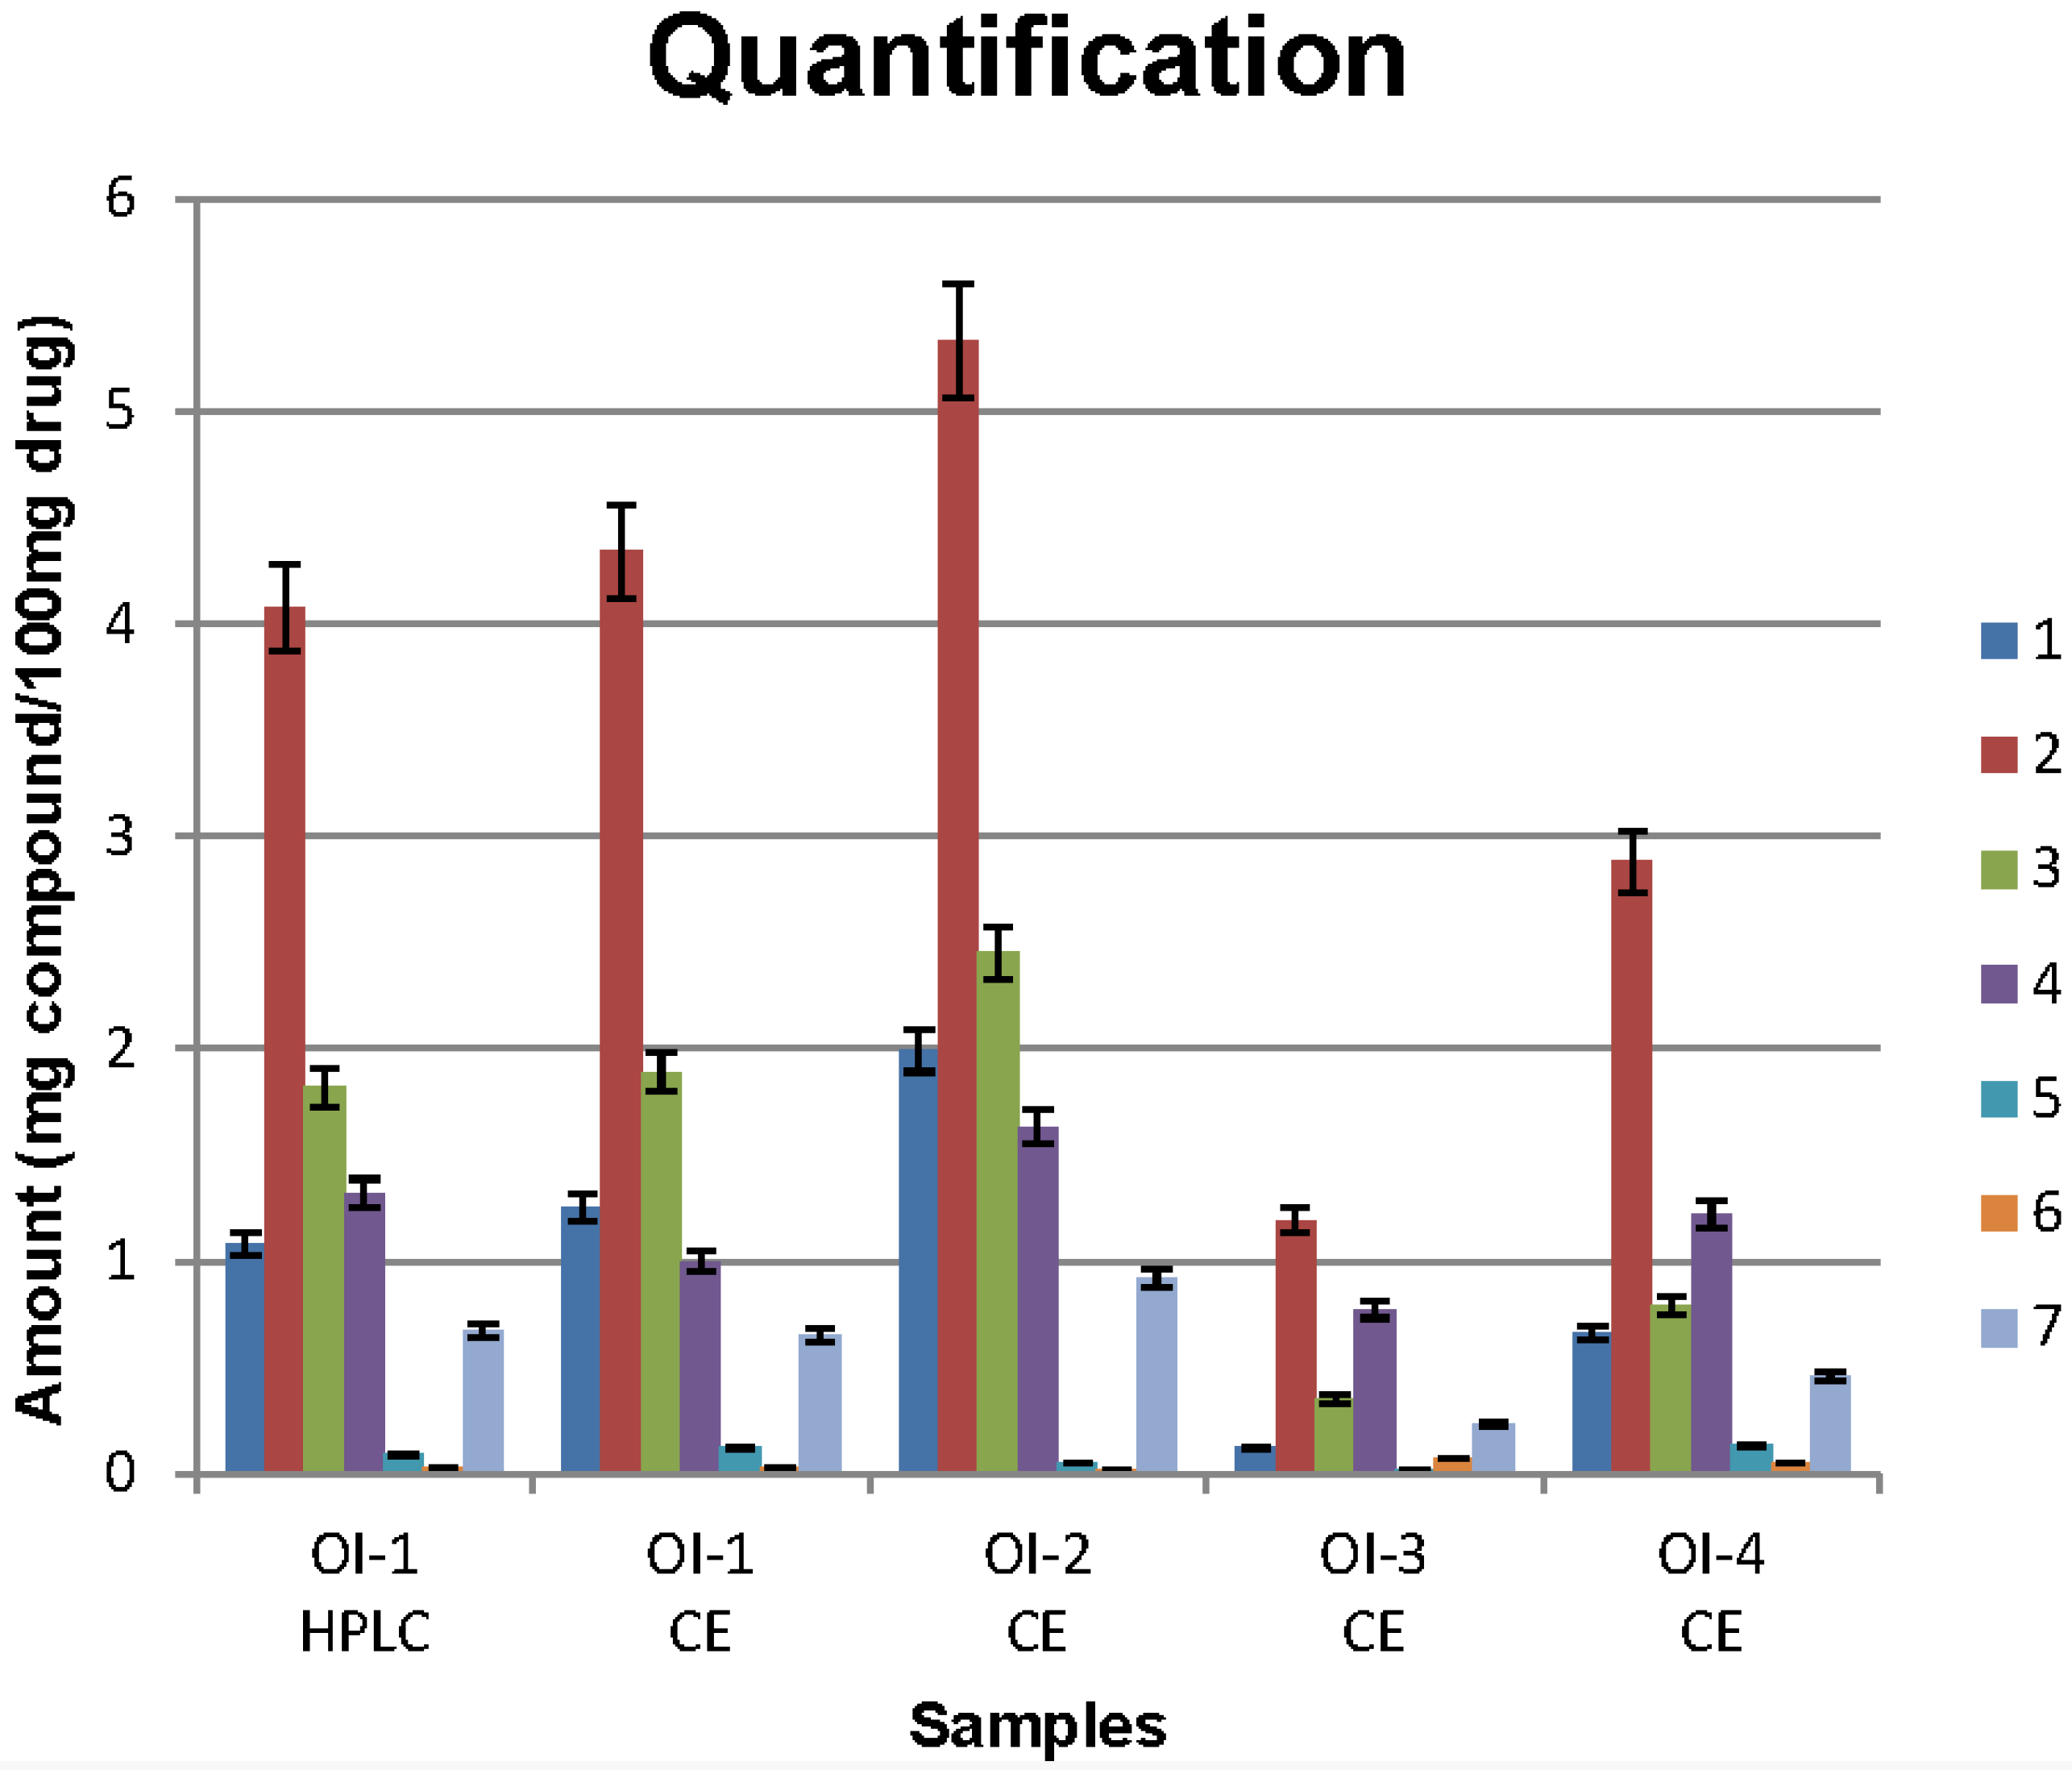
3.3. Sample Analysis

The CE-separation of a methanolic plant extract (sample OI-4) is exemplarily shown in Figure 3. In 13 min all seven standards were baseline separated and could be quantified easily. The total flavonoid content of the different sample batches (Figure 4) varied widely from 2.75% (OI-3) to 12.39% (OI-2). The obtained quantitative results were repeatable (σrel for multiple injection of the same solution ≤3.54%) and in good agreement to those of LC. For example, for sample OI-1 the total flavonoid content was 9.28% (CE) compared to 9.09% by HPLC. Compound (2) was the most dominant one (4.34% (CE); 4.08% (HPLC)), followed by (3) (1.89%; 1.82%) and (1) (1.25%; 1.08%). A similar qualitative pattern was found in all analyzed samples, with (2) being the major flavonoid; yet, in samples OI-3 and OI-4 compound (4) was the second most common one. These results match well with the HPLC data published earlier [7]. In terms of quantitative results both analytical procedures are therefore equally suitable for the determination of flavonoids in O. indicum seeds.
Figure 3. Electropherogram of O. indicum sample OI-4 separated under optimum CE conditions.
Chromatography 01 00001 g003
Figure 4. Comparison of quantitative results of compounds (17) (sample OI-1 analyzed with HPLC and CE; samples OI-1 to OI-4 with CE); error bars reflect standard deviation (n=3).
Chromatography 01 00001 g004

4. Conclusions

As demonstrated in this study, CE is definitely an interesting alternative for natural products analysis, particularly for flavonoids. Despite of a complex matrix (plant extract) a rather simple setup (borax buffer with SDS) facilitated the fast, accurate and reproducible determination of seven relevant compounds in Oroxylum indicum seeds. Compared to HPLC the CE-procedure is, not surprisingly, disadvantageous in terms of sensitivity, but in other relevant aspects like speed of analysis (approx. 40% reduction of required analysis time), resolution power or consumption of sample and buffer it is definitely advantageous.

Conflict of Interest

The authors declare no conflict of interest.

References

  1. Harminder, S.V.; Chaudhary, A.K. A review on the taxonomy, ethnobotany, chemistry and pharmacology of Oroxylum indicum vent. Indian J. Pharm. Sci. 2011, 73, 483–490. [Google Scholar] [CrossRef]
  2. Bensky, D.; Clavey, S.; Stöger, E. Materia Medica, 3rd ed; Eastland Press: Seattle, WA, USA, 2004; pp. 456–457. [Google Scholar]
  3. The State Pharmacopoeia Commission of P.R. China, Pharmacopoeia of People’s Republic of China; China Medical Science Press: Beijing, China, 2010; p. 304.
  4. Yan, R.Y.; Cao, Y.Y.; Chen, Y.C.; Dai, H.Q.; Yu, S.X.; Wei, Y.L.; Li, H.; Yang, B. Antioxidant flavonoids from the seed of Oroxylum indicum. Fitoterapia 2011, 82, 841–848. [Google Scholar] [CrossRef]
  5. Radhika, L.G.; Meena, C.V.; Peter, S.; Rajesh, K.S.; Rosamma, M.P. Phytochemical and antimicrobial study of Oroxylum indicum. Ancient Sci. Life 2011, 30, 114–120. [Google Scholar]
  6. Laupattarakasem, P.; Houghton, P.J.; Hoult, J.R.; Itharat, A. An evaluation of the activity related to inflammation of four plants used in Thailand to treat arthritis. J. Ethnopharamcol. 2003, 85, 207–215. [Google Scholar] [CrossRef]
  7. Krüger, A.; Ganzera, M. Oroxylum indicum seeds—Analysis of flavonoids by HPLC-MS. J. Pharm. Biomed. Anal. 2012, 70, 553–556. [Google Scholar] [CrossRef]
  8. Ganzera, M.; Egger, C.; Zidorn, C.; Stuppner, H. Quantitative analysis of flavonoids and phenolic acids in Arnica montana L. by micellar electrokinetic capillary chromatography. Anal. Chim. Acta 2008, 614, 196–200. [Google Scholar] [CrossRef]
  9. Zehrmann, N.; Zidorn, C.; Ganzera, M. Analysis of rare flavonoid C-glycosides in Celtis australis L. by micellar electrokinetic chromatography. J. Pharm. Biomed. Anal. 2010, 51, 1165–1168. [Google Scholar] [CrossRef]
  10. De Rosa, S.; de Stefano, S. Chrysin 7-gentiobioside from the flowers of Spartium junceum. Phytochemistry 1983, 22, 2323–2324. [Google Scholar] [CrossRef]
  11. Terabe, S.; Otsuka, K.; Ichikawa, K.; Tsuchiya, A.; Ando, T. Electrokinetic separations with micellar solutions and open-tubular capillaries. Anal. Chem. 1984, 56, 111–113. [Google Scholar] [CrossRef]

