Article

Cobalt-Activated Transfer-Free Synthesis of the Graphene on Si(100) by Anode Layer Ion Source

by
Greta Bener
,
Vitoldas Kopustinskas
,
Asta Guobienė
,
Andrius Vasiliauskas
,
Mindaugas Andrulevičius
and
Šarūnas Meškinis
*
Institute of Materials Science, Kaunas University of Technology, K. Baršausko St. 59, LT-51423 Kaunas, Lithuania
*
Author to whom correspondence should be addressed.
Processes 2022, 10(2), 272; https://doi.org/10.3390/pr10020272
Submission received: 15 December 2021 / Revised: 20 January 2022 / Accepted: 25 January 2022 / Published: 29 January 2022
(This article belongs to the Section Materials Processes)

Abstract

:
In this research, the graphene was grown directly on the Si(100) surface at 600 °C temperature using an anode layer ion source. The sacrificial catalytic cobalt interlayer assisted hydrocarbon ion beam synthesis was applied. Overall, two synthesis process modifications with a single-step graphene growth at elevated temperature and two-step synthesis, including graphite-like carbon growth on a catalytic Co film and subsequent annealing at elevated temperature, were applied. The growth of the graphene was confirmed by Raman scattering spectroscopy and X-ray photoelectron spectroscopy. The atomic force microscopy and scanning electron microscopy were used to study samples’ surface morphology. The temperature, hydrocarbon ion beam energy, and catalytic Co film thickness effects on the structure and thickness of the graphene were investigated. The graphene growth on Si(100) by two-step synthesis was beneficial due to the continuous and homogeneous graphene film formation. The observed results were explained by peculiarities of the thermally, ion beam, and catalytic metal activated hydrocarbon species dissociation. The changes of the cobalt grain size, Co film roughness, and dewetting were taken into account.

1. Introduction

Graphene has received significant interest due to the exciting combination of its properties and numerous applications [1,2]. The most often used graphene synthesis method is chemical vapor deposition on copper [3], nickel [4], or cobalt foils [5]. Afterward, fabricated graphene flakes are transferred to the final dielectric or semiconductor substrate necessary for an electronic device or sensor applications. That is a complex and lengthy process leading to graphene contamination and deformation [6]. Therefore, direct synthesis of graphene on targeted substrates is beneficial. Notably, it can be done by combining catalytic copper, nickel, or cobalt films deposited on the dielectric or semiconductor surfaces with physical vapor deposited amorphous carbon films and subsequent high-temperature annealing. In such a way, graphene can be grown directly on the targeted non-catalytic substrate. Overall, two groups of physical vapor deposition (PVD) techniques can be used for such a purpose. In the first case, the catalytic metal film such as Ni, Co, or Cu is combined with hydrogen-free amorphous carbon film deposited by electron beam evaporation, magnetron sputtering, or pulsed laser deposition [7,8,9,10,11,12,13,14,15]. In this case, amorphous carbon deposition at a temperature elevated up to 400 °C is beneficial for better controlling the graphene layers number than room temperature deposited carbon films. However, subsequent higher temperature annealing is necessary, too. In the second case, 20–80 keV energy carbon ion implantation of the Ni coated substrate is performed, followed by 500–1000 °C temperature annealing [8,15,16]. Carbon ion penetration depth is big enough in such a case, and carbon ions can be implanted to both the metal interlayer and substrate surface [17]. Alternatively, a sacrificial catalytic metal interlayer can be used for direct graphene synthesis on an insulator on semiconductor substrates by chemical vapor deposition (CVD) or plasma-enhanced chemical vapor deposition (PECVD) [18]. In all cases, the main graphene growth mechanisms are carbon dissolution in catalytic metal with following precipitation [8] and catalytic metal-induced carbon crystallization with layer exchange [11,19,20,21,22]. It was shown that the last mechanism prevails [11,20,21,22]. The graphene can be grown at the catalytic metal/substrate interface, on top of the catalytic film, or simultaneously on both surfaces mentioned above [7,8,9,10,11,12,13,14,15,16,17].
In the present study, graphene was directly synthesized on the semiconductor substrate applying a different flexible method, allowing graphene synthesis conditions similar to the annealing of the amorphous carbon/catalytic metal bilayer and the PECVD with a sacrificial catalytic interlayer. That is low energy (300–800 eV) hydrocarbon ion beam irradiation of the Si(100) wafer coated by 12–50 nm thickness cobalt film, using an anode layer ion source suitable for high area deposition [23]. Ion sources of this type are already used for large-area web and glass treatment [23]. The carbon ion implantation depth, in this case, is no more than several nm even at elevated implantation temperatures [24]. This is similar to the graphene synthesis by annealing the PVD deposited carbon and metal bilayers. However, the presence of hydrogen may be beneficial for graphene growth due to the significant role of hydrogen in graphene synthesis by CVD and PECVD. In total, two types of thermal processing were applied for graphene synthesis. The first one was a single-step process comprising hydrocarbon ion beam irradiation at 500–800 °C temperature. This approach is similar to the direct graphene synthesis by PECVD using a sacrificial catalytic metal interlayer. The second one was a two-step process, including hydrocarbon ion beam irradiation at 400 °C temperature and subsequent additional annealing at 500–800 °C temperature. Thus, hydrogenated carbon film was deposited on the Co interlayer and, afterward, annealing induced graphene synthesis followed. The process is similar to the direct graphene synthesis by annealing the catalytic metal and top amorphous carbon bilayer.
The graphene was grown on Si(100) using both processes: a single-step synthesis, and a two-step synthesis. The influence of main technological conditions essential for graphene synthesis by catalytically assisted direct synthesis was investigated. The effects of the temperature, Co interlayer thickness, and hydrocarbon ion beam energy were studied to control the graphene structure. The process was optimized for the graphene layer number, defects density, crystallite size, absence of the non-planar graphene features, and amorphous carbon phase. The graphene synthesis conditions beneficial for forming the continuous and homogeneous graphene film were found.

2. Materials and Methods

Direct synthesis of graphene was performed on n-type silicon substrates with the orientation of <100>. The samples size was 1.5 cm × 1.5 cm.
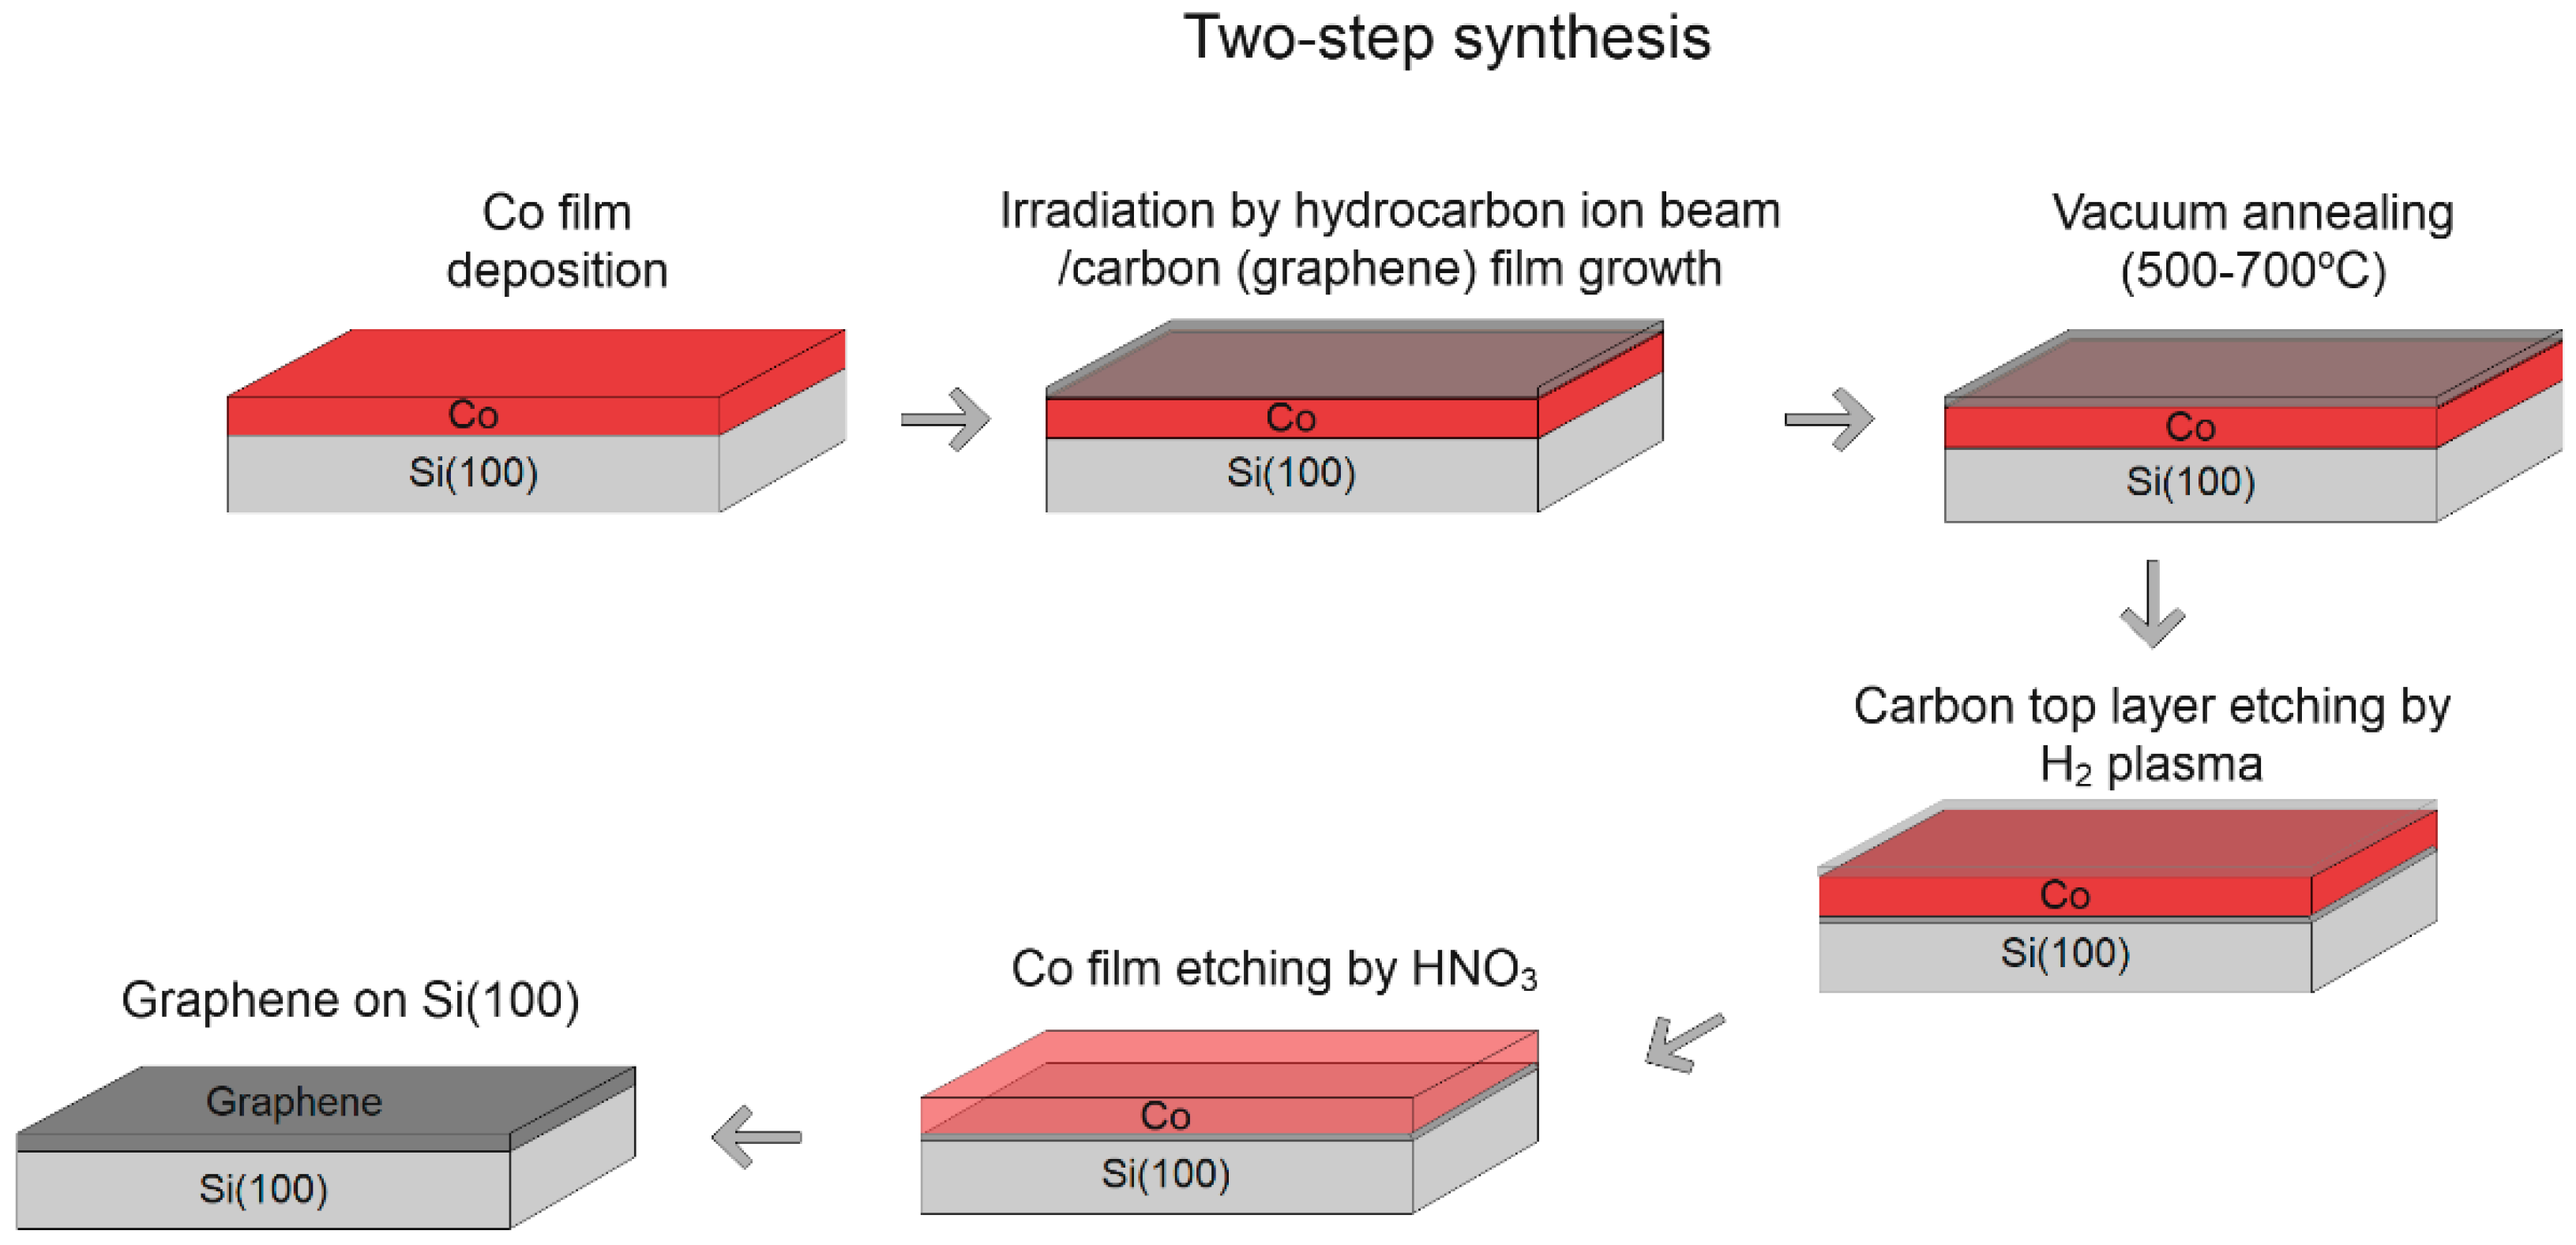
The diagrams of one-step synthesis and two-step synthesis are shown in Figure 1 and Figure 2, respectively. The substrates were coated with a cobalt layer of 10–55 nm thickness by magnetron sputtering. An anode layer ion gun was used as a hydrocarbon ion beam source. More information on anode layer ion sources can be found in [23,25]. Graphene was obtained in single-step and two-step synthesis. The processes of these two synthesis methods followed similar principles: a 10–55 nm thick Co film was deposited by magnetron sputtering on Si(100). After the Co film growth, hydrocarbon ion beam irradiation followed. The base pressure in the ion-beam deposition unit chamber was 2 × 10⁻⁴ Pa. The work pressure during hydrocarbon ion beam irradiation was 2 × 10⁻² Pa. The ion energy was varied in the 300–800 eV range, and the process temperature was 400–800 °C. In the single-step synthesis process, the sample temperature during the hydrocarbon ion beam irradiation was set at 600–800 °C (Figure 1). No additional annealing was performed. In the two-step synthesis (Figure 2), the Co film was irradiated at 400 °C temperature by a hydrocarbon ion beam to grow a graphite-like carbon film. Afterward, the samples were annealed at 500–700 °C in a vacuum. The pressure during annealing was 2 × 10⁻⁴ Pa. The main samples synthesis conditions are summarized in Table 1.
Since the goal was to obtain directly synthesized graphene on Si(100), we removed the catalytic layer of cobalt with graphene on top of it. For this reason, a few more steps after synthesis were performed. Firstly, the sample was treated by hydrogen plasma chemical etching (Plasma-Therm INC PK-2430PD, (Plasma deposition)) to remove the carbon phase on the top of the catalytic cobalt layer. Plasma etching time was 8 min, plasma power density was 1 W/cm2, and process pressure was 40 Pa. Following this, chemical etching by nitric acid (HNO3) and distilled water solution for 5 min was performed to remove cobalt (we were unable to remove the cobalt layer using HCl). The samples were then washed with distilled water and dried under compressed nitrogen gas.
In order to explore the forming process of a graphene film on a Si(100) substrate by Co-assisted direct synthesis, fabricated samples were analyzed by Raman scattering spectroscopy. A Raman spectrometer in Via (Renishaw, Wotton-under-Edge, UK) with the excitation wavelength of 532 nm, laser beam power of 1.5 mW, and integration time of 10 s was used. The I2D/IG ratio was estimated to identify the number of graphene layers in all samples using a methodology developed by Hwang et al. [26]. One can find the calculated graphene layer number in Table S2. ID/IG and ID/ID’ ratios, as in the work of A. Eckmann et al. [27], were used to detect defects and evaluate their type. The G peak’s full-width half maximum (FWHM) values were compared. The peak fitting was performed by using XPS peak 4.1 software. For the peaks D (~1350 cm−1), G (~1580 cm−1), D (~1620 cm−1), and 2D (~2690 cm−1), the Lorentzian function was used. The mixed Lorentzian-Gaussian function was used to fit other peaks, such as D + D” (~2500 cm−1) and D + D’ (~2900 cm−1). The spectra were measured at the several different places of the each sample to evaluate dispersion of the results. The average value of the each parameter was calculated and used in the subsequent study. The dispersion of the results in most samples was low. Particularly, the standard deviation of the ID/IG ratios within the sample was in 0.4 ÷ 3.6% range, and the I2D/IG ratio dispersion, in most cases, was below 3% (see Table S1 for more information).
Optical microscopy images of the samples were produced with Optika Italy m-600 microscope after the ion-beam synthesis, hydrogen plasma etching, and chemical etching.
For further surface analysis, the investigation using atomic force microscopy (AFM), scanning electron microscope (SEM) Helios Nanolab 650 (FEI, Eindhoven, Nederlands), and X-ray photoelectron spectroscope (XPS) Kratos Analytical XSAM800 (Kratos Analytical, Manchester, UK) was performed.
AFM experiments were carried out at room temperature using a NanoWizardIII atomic force microscope (JPK Instruments, Bruker Nano GmbH, Berlin, Germany), while the data was analyzed using a JPKSPM Data Processing software (Version spm-4.3.13, JPK Instruments, Bruker Nano GmbH). The AFM images were collected using an ACTA (Applied NanoStructures, Inc., Mountain View, CA, USA) probe (silicon cantilever shape—pyramidal, a radius of curvature (ROC) < 10.0 nm and cone angle −20°; reflex side coating—Al with a thickness of 50 ± 5 nm, force constant ~40 N m1, resonance frequency in the range of 300 kHz). Height, amplitude, and phase diagrams were recorded along with steps with scan sizes of 2 μm and scan speeds of 1 Hz. Height, amplitude, and phase diagrams were recorded with steps with scan sizes of 2 μm and scan speeds of 1 Hz. The integral gain was set at two, while proportional gain was set at five. Pixels for samples and lines were (516 × 516) operating in tapping mode.
Selected samples’ surface chemical composition and bonding were analyzed with the X-ray photoelectron spectroscopy (XPS) method. The KRATOS ANALYTICAL XSAM800 spectrometer was used with a non-monochromatized Al Ka radiation (hν = 1486.6 eV) was used. The base pressure in the analytical chamber was lower than 2 × 10⁻⁷ Pa. The system’s energy scale was calibrated according to the Au 4f7/2 and Cu 2p3/2 Ag 3d5/2 peaks positions. The C 1s, O 1s, and Si 2p spectra were acquired at the 20 eV pass energy (0.1 eV energy step), and the analyzer was in the fixed analyzer transmission (FAT) mode. After Shirley’s background subtraction, relative atomic concentrations were calculated using original KRATOS software from element peak area and sensitivity factors of the element.

3. Results

3.1. Single Step Synthesis

3.1.1. Temperature

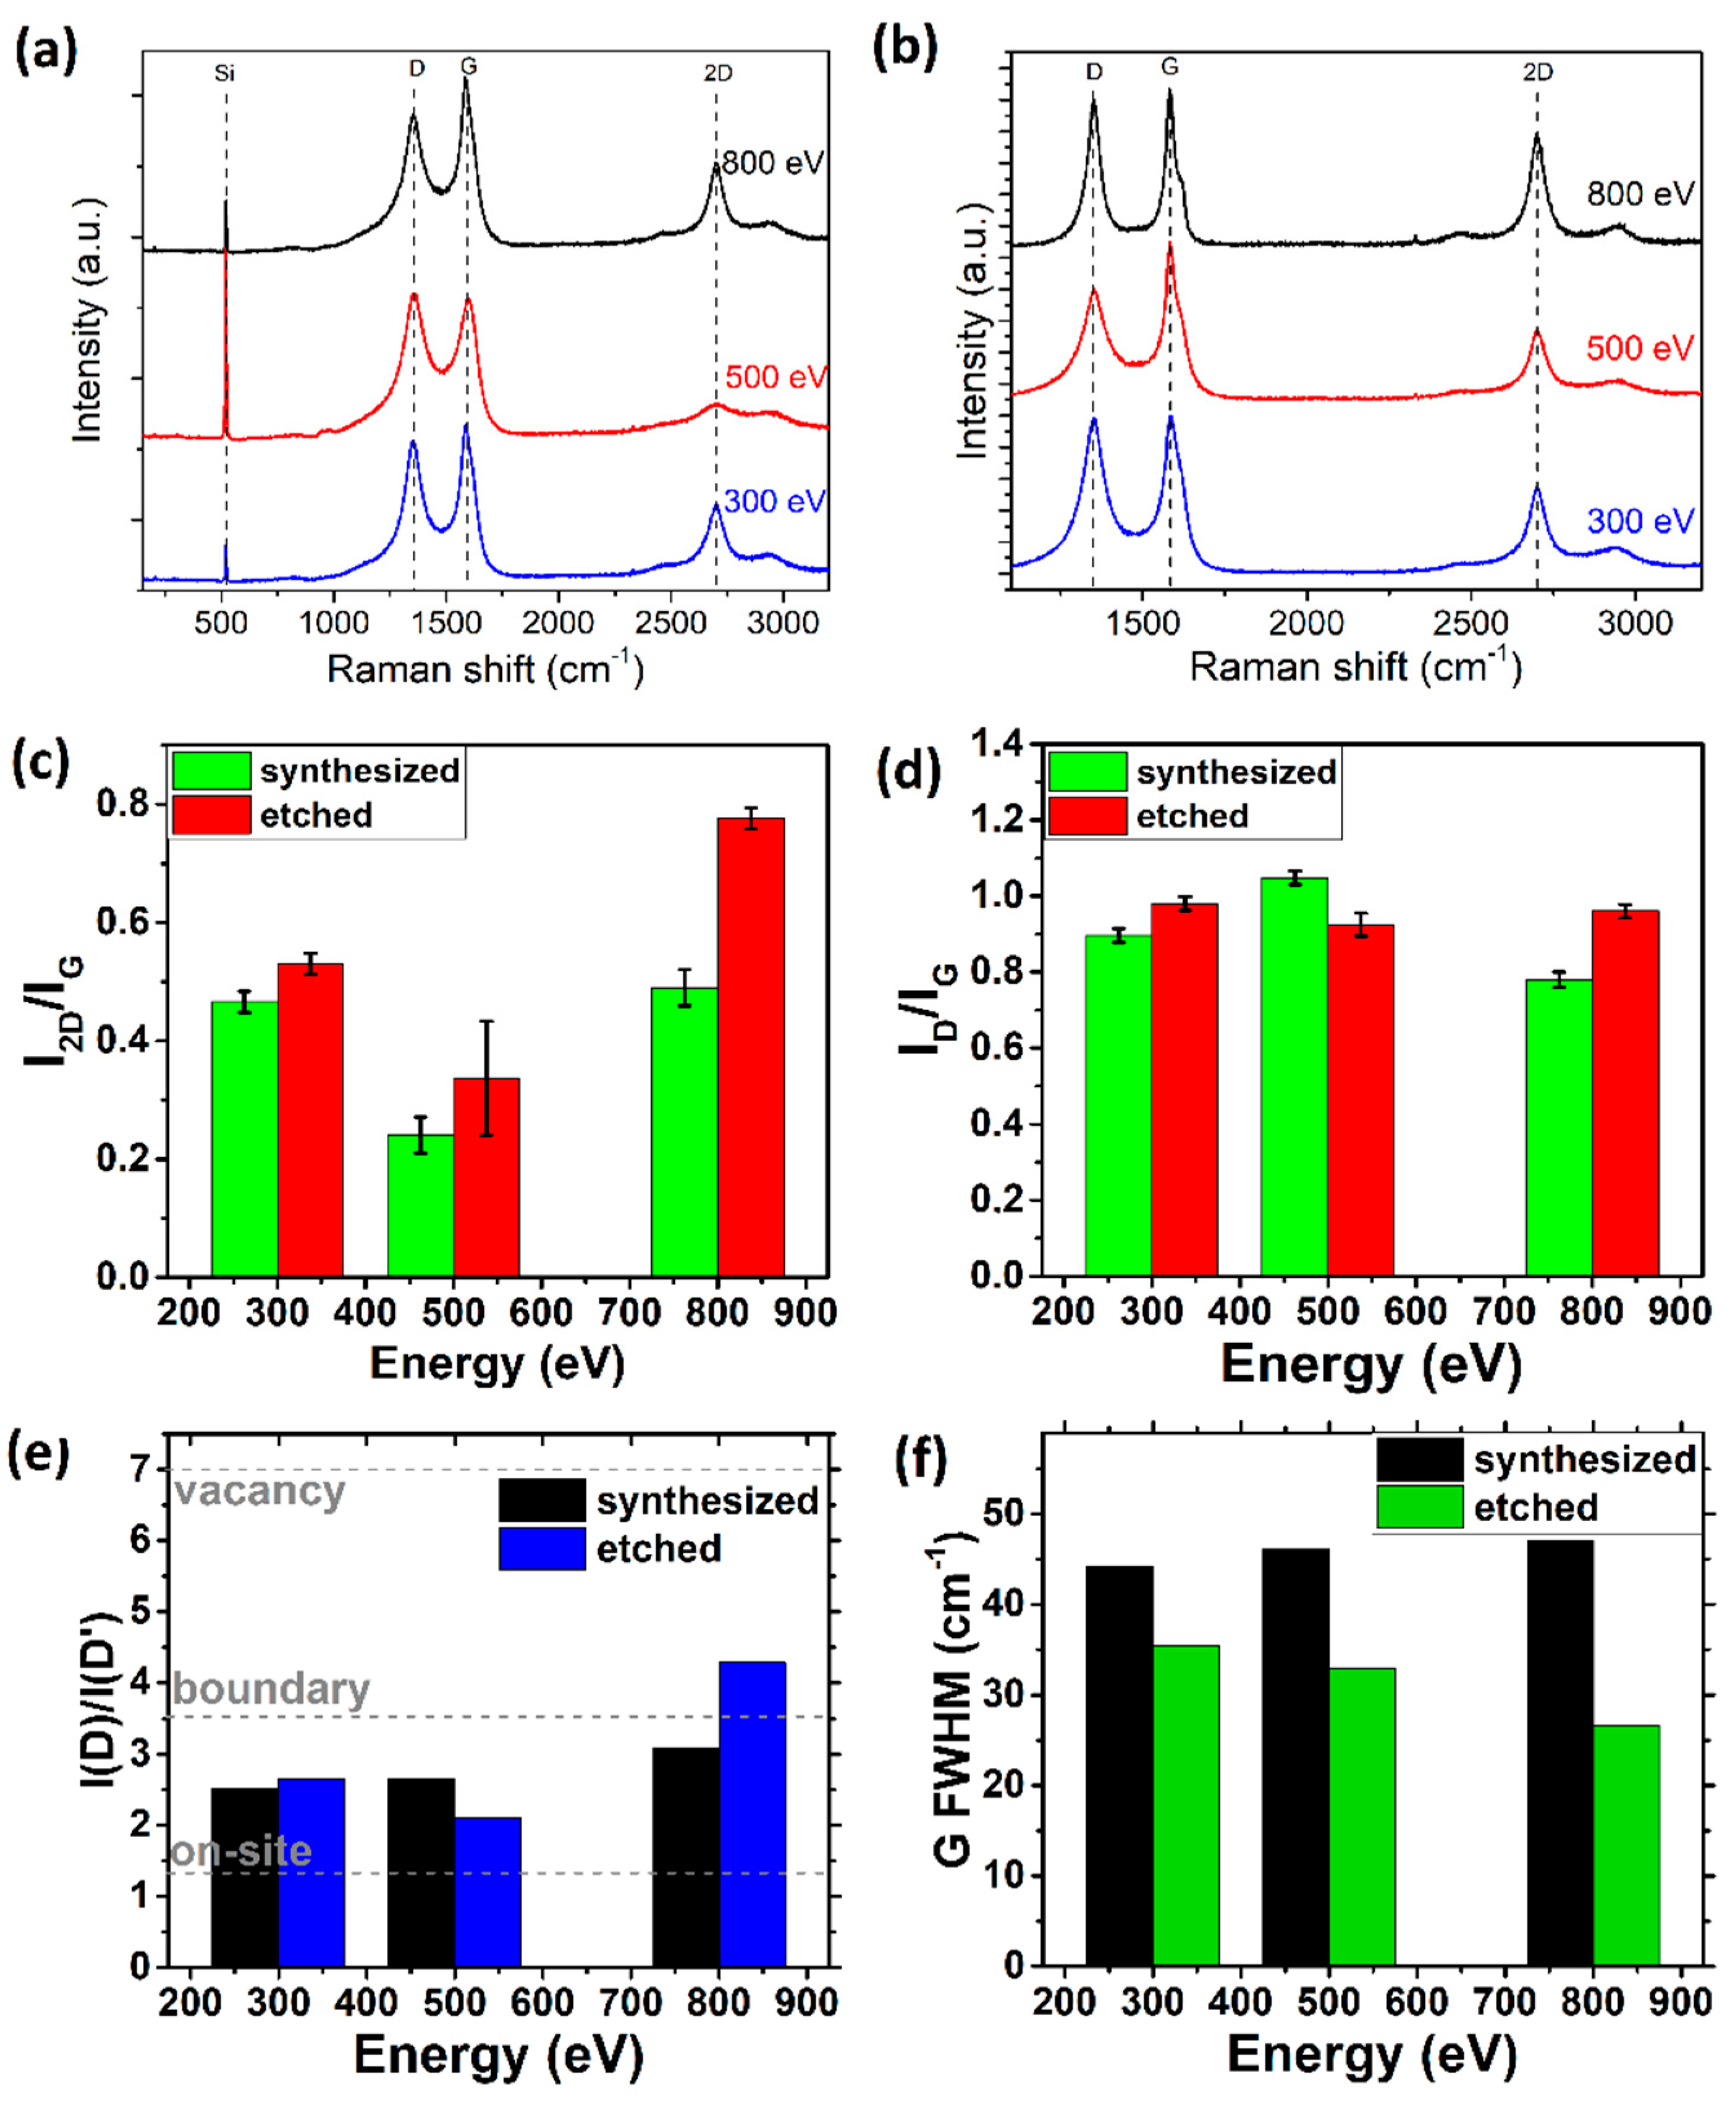
The process temperature was the first studied technological parameter of graphene single-step direct-ion beam synthesis. Raman scattering spectra were measured before and after the Co catalytic later etching. The synthesis temperature was altered from 600 °C to 800 °C. In the measured Raman spectra of the samples, shown in Figure 3a,b, G and 2D peaks typical for multilayer graphene can be seen at ~1600 cm−1 and ~2700 cm−1 [3,6,28]. Defects related D (~1350 cm−1), D’ (~1620 cm−1), D + D” (~2500 cm−1) and D + D’ (~2900 cm−1) peaks were found [28].
Firstly, higher deposition temperatures caused higher intensities of Si substrate-related band (~520 cm−1), Figure 3a. It might be explained by the cobalt film dewetting process [29]—the appearance of the holes in the cobalt interlayer and subsequent clustering with increasing process temperature (see, e.g., [30]). In [31], annealing at lower temperature caused open voids formation in Co film, and higher temperature annealing resulted in Co films breakup to the islands. Further results analysis in Figure 3b showed that after the subsequent etching of the samples by hydrogen plasma and HNO3 acid, intensities of Si peak (~520 cm−1) had increased significantly and additional substrate related bands at ~300 cm−1, ~680 cm−1, and ~960 cm−1 were able to be distinguished. It seems that in the graphene grown on the cobalt interlayer, a relatively large amount of the amorphous phase was presented: D and G peaks were partially overlapped (Figure 3a). It was reported in [28] that it could be explained by the amorphous carbon phase-related peak between the G and D peaks. In the Raman spectra of the graphene on Si(100), D and G peaks were much more clearly separated (Figure 3b). Thus, it can be supposed that, in this case, amount of the amorphous carbon phase was negligible.
Raman results were further analyzed by fitting data and observing the intensities of G, D, and 2D bands. Accordingly, the I2D/IG and ID/IG intensity ratios are shown in Figure 3c,d. The I2D/IG ratios are below ~0.6 (multilayer graphene) (see Table S2). The only exception is graphene on Si(100), synthesized at the temperature of 700 °C. In that case, I2D/IG ratio reaches ~0.8 (value of the mixture of single-layer and bilayer graphene) [26]. It should be mentioned that the I2D/IG ratio of the graphene fabricated using annealing at 600–1000 °C of a-C and Ni bilayer did not depend on annealing temperature [10]. ID/IG ratios show that the lowest defects density can be found in the samples synthesized at 700 °C temperature. The ID/IG intensity ratios of the Raman spectra slightly increased after the Co interlayer etching. Thus, the defects density in the graphene synthesized on the Si(100) was higher than in the graphene grown on Co. Boundary defects prevailed in almost all samples, according to Eckmann et al. [27], while for sample synthesized at 800 °C temperature, the presence of the on-site defects and boundary defects can be supposed.
Next, the G band full-width half maximums (FWHM(G)) were evaluated (Figure 3f,g). G peaks slightly narrowed after the etching of the cobalt. Thus, it can be supposed that the crystallites of the graphene on Si(100) were slightly larger. The lowest FWHM(G) was found for the sample synthesized at 700 °C temperature.
One can explain the observed results by temperature effects on catalytic cobalt interlayer leading to the different graphene growth conditions. Co film grain size increase with substrate temperature [32,33,34,35]. Co film can become both smoother [35] and rougher with increased annealing temperature [34]. The increased roughness for graphene synthesized on Ni by metal-induced crystallization resulted in increased graphene layers number and defects density [36]. The increased Co grain size reduces graphene nucleus number and thickness as carbon diffusion mainly occurs via the catalytic metal grains, and fewer carbon atoms can reach the Si surface [22]. It seems to be the main factor leading to the significant reduction of the graphene layers number and increased graphene crystallites size due to the rise of the process temperature from 600 to 700 °C. Another mechanism to be considered is the increase of the carbon atoms desorption rate with the synthesis process temperature [37]. As mentioned above, increased intensity of the substrate-related Si peak with process temperature in Raman spectra of the graphene grown on Co film indicates enlargement of the area of substrate surface uncoated by Co. At the same time, graphite-like carbon film can grow instead of the graphene on the Co interlayer through-holes. It explains the significantly reduced I2D/IG ratio and partial overlap of the D and G peaks in Raman spectra of the graphene synthesized on Si(100) at 800 °C. It seems that for samples synthesized at temperatures of 600 and 700 °C, Co interlayer-related additional dissociation of the CHx fragments results in a reduced number of the hydrogen-related on-site defects (Figure 3a,b,e).While synthesis temperature increase up to 800 °C results in intensified dewetting of the Co interlayer and part of the CHx fragments reach the silicon surface via through-holes, and a number of the on-site defects in carbonaceous film on the silicon remains higher (Figure 3a,b,e).
Regarding differences in the defects density in the graphene synthesized on the Si(100) and the Co, it can be mentioned that various authors reported contradictory results. In some studies, graphene was synthesized only on the catalytic metal [38], while in other research, the graphene was synthesized only on the substrate [10]. In [18] for graphene catalytically-assisted growth by PECVD, graphene synthesized on Ni contained much more defects than graphene synthesized on quartz. It was explained by plasma irradiation damage [18]. However, the opposite tendency was found despite the irradiation by much higher energy ions in our case. In [38], using the a-C/Co/SiO2 multilayer, graphene was synthesized only on the Co surface, while using the Co/C/SiO2 structure, graphene was grown on both silicon and cobalt. The graphene was synthesized on SiO2 at 600 °C and the nickel at 1000 °C, annealing the a-C/Ni bilayer deposited on the SiO2 substrate [10]. In this case, graphene grown on SiO2 contained fewer defects than graphene grown on Ni. Our results can be explained by considering the carbon and cobalt interaction. The graphene is grown on the Si(100) surface due to the carbon diffusion through the grain boundaries [22]. However, the carbon atoms dissolution in the cobalt surface layer and subsequent precipitation on the Co surface can occur due to combined activation of the carbon diffusion to the metal surface layer by ion beam and temperature effects, similarly to the graphene CVD synthesis on the catalytic cobalt film [39]. At the same time, defects density in graphene CVD-grown on the catalytic Co film [39] is much lower than defects density in graphene directly synthesized on the semiconductor or dielectric substrates by metal-induced crystallization (see, e.g., [10,18,38]).
Optical microscopy photos show the surface of the sample, synthesized at 800 °C, before and after the etchings (Figure S1a,b). As we can see, the surface after the etchings has fewer dark structures, meaning that we removed most of the Co layer. However, the etched sample’s surface was inhomogeneous. Other authors reported similar results for graphene directly synthesized by catalytic metal-assisted synthesis [9,10,11,19,40].

3.1.2. Ion Beam Energy

Another analyzed parameter of direct synthesis was ion beam energy. The methane molecules’ dissociation degree increases with ion beam energy [41,42]. It should be mentioned that Ni catalytic interlayer-assisted CVD growth of the graphene on the dielectric substrate is possible only at 950–1000 °C temperature. While using PECVD, one can decrease synthesis temperature down to 475 °C. Furthermore, in the case of the Ni-assisted PECVD synthesis, plasma power must be optimized. Too low power results in the insufficient activation energy of carbon atoms for transporting through the Ni layer, and too high plasma power would result in the formation of Ni-C alloy.
Graphene was synthesized using 800 eV, 500 eV (1 kV), and 300 eV (0.6 kV) ion beam energy. We set a synthesis temperature at 700 °C due to the growth of the lowest layer number and defect graphene containing the largest crystallites (see Figure 3).
The analysis showed that in all cases, typical bands of Raman spectra were formed (Figure 4a,b). The Si substrate-related peaks at ~960 cm−1 and ~520 cm−1 were detected for all graphene on Co samples. The intensities of these peaks were highest for a sample synthesized using 500 eV energy.
One can see that in the graphene synthesized on Si(100) using 300 and 500 eV hydrocarbon ion amorphous carbon phase presented: D and G peaks partially overlap (Figure 4b), showing the existence of the amorphous carbon phase-related peak amidst them [28]. It seems that in this case, carbon crystallization was incomplete. Such a problem can occur even for graphene synthesized by CVD on catalytic foil [43]. The catalytic activity of Cu resulting in the decomposition of methane and the graphitization process would be limited upon the increase of graphene coverage [43]. CH4 decomposition process would become incomplete. A lowly dehydrogenated carbon species such as CH3 would be produced instead of highly dehydrogenated CHx active species [44], leading to the formation of amorphous carbon on the graphene sheet [43]. Thus, our results can be explained similarly. It seems that Co catalytic interlayer alone cannot ensure the necessary level of the methane molecules dissociation. Therefore, amorphous carbon grows along with graphene when lowering hydrocarbon ion beam energy reduces ion-induced dissociation.
The lowest I2D/IG ratios were observed for graphene synthesized using 500 eV energy ion beam, while the highest ratio was found when 800 eV energy ion beam was applied (Figure 4c). It means that more graphene layers were formed at lower ion beam energies (Table S2). The graphene layer number decreased from ~five layers in graphene synthesized on Si(100) using 500 eV ion beam to one to two layers for graphene grown using 800 eV energy ion beam (Table S2). In all cases, the ID/IG ratios (Figure 4d) did not show a significant difference for graphene synthesized on Si(100), while for graphene grown on the cobalt, the highest defects density was found in the sample synthesized using a 500-eV energy hydrocarbon ion beam. It is noteworthy that in the case of the Ni catalytic interlayer activated PECVD graphene synthesis on dielectric substrate, too high or too low plasma power resulted in decreased I2D/IG ratio and increased ID/IG ratio [18].
ID/ID’ ratio values were between 2–2.5 in the samples synthesized with 300 and 500 eV ion beam energy before and after the etchings. 800 eV energy caused a slightly larger ratio value, which, after the etchings, was under ~4. Thus, in all studied samples, boundary defects dominated. Some vacancy-type defects also were found for graphene synthesized using an 800-eV hydrocarbon ion beam, while in samples synthesized using a lower energy ion beam, on-site defects existed along with boundary defects. Vacancy-type defects may be created due to the higher energy ion bombardment [27]. In contrast, on-site defects are usually associated with hydrogen atoms adsorbed on the graphene sheets [45]. In our case, it appears to be related to less intensive dissociation of the methane and the presence of the lowly dehydrogenated CHx species.
The FWHM(G) of the graphene on Co slightly increased with increasing ion energy (Figure 4f). The FWHM(G) of the graphene on Si(100) decreased with increased ion beam energy. For comparison: at 300 eV G FWHM was ~35.41 cm−1, at 500 eV ~32.89 cm−1, and at 800 eV ~26.59 cm−1. It means that the size of crystallites was smaller when lower ion beam energies were used for synthesis. It can be explained by decreased in-plane graphene growth rate due to the less intensive dissociation of the CH4 molecules [46].
Thus, the optimal ion beam energy for synthesizing the graphene on Si(100) in terms of the lowest graphene layer number, largest crystallite size, and smallest defects density is 800 eV.

3.1.3. Thickness of Cobalt Layer

The cobalt layer thickness during the direct ion-beam synthesis was varied between 10–55 nm (Figure 5). The synthesis temperature and ion beam energy were selected according to the results revealed in the previous chapters.
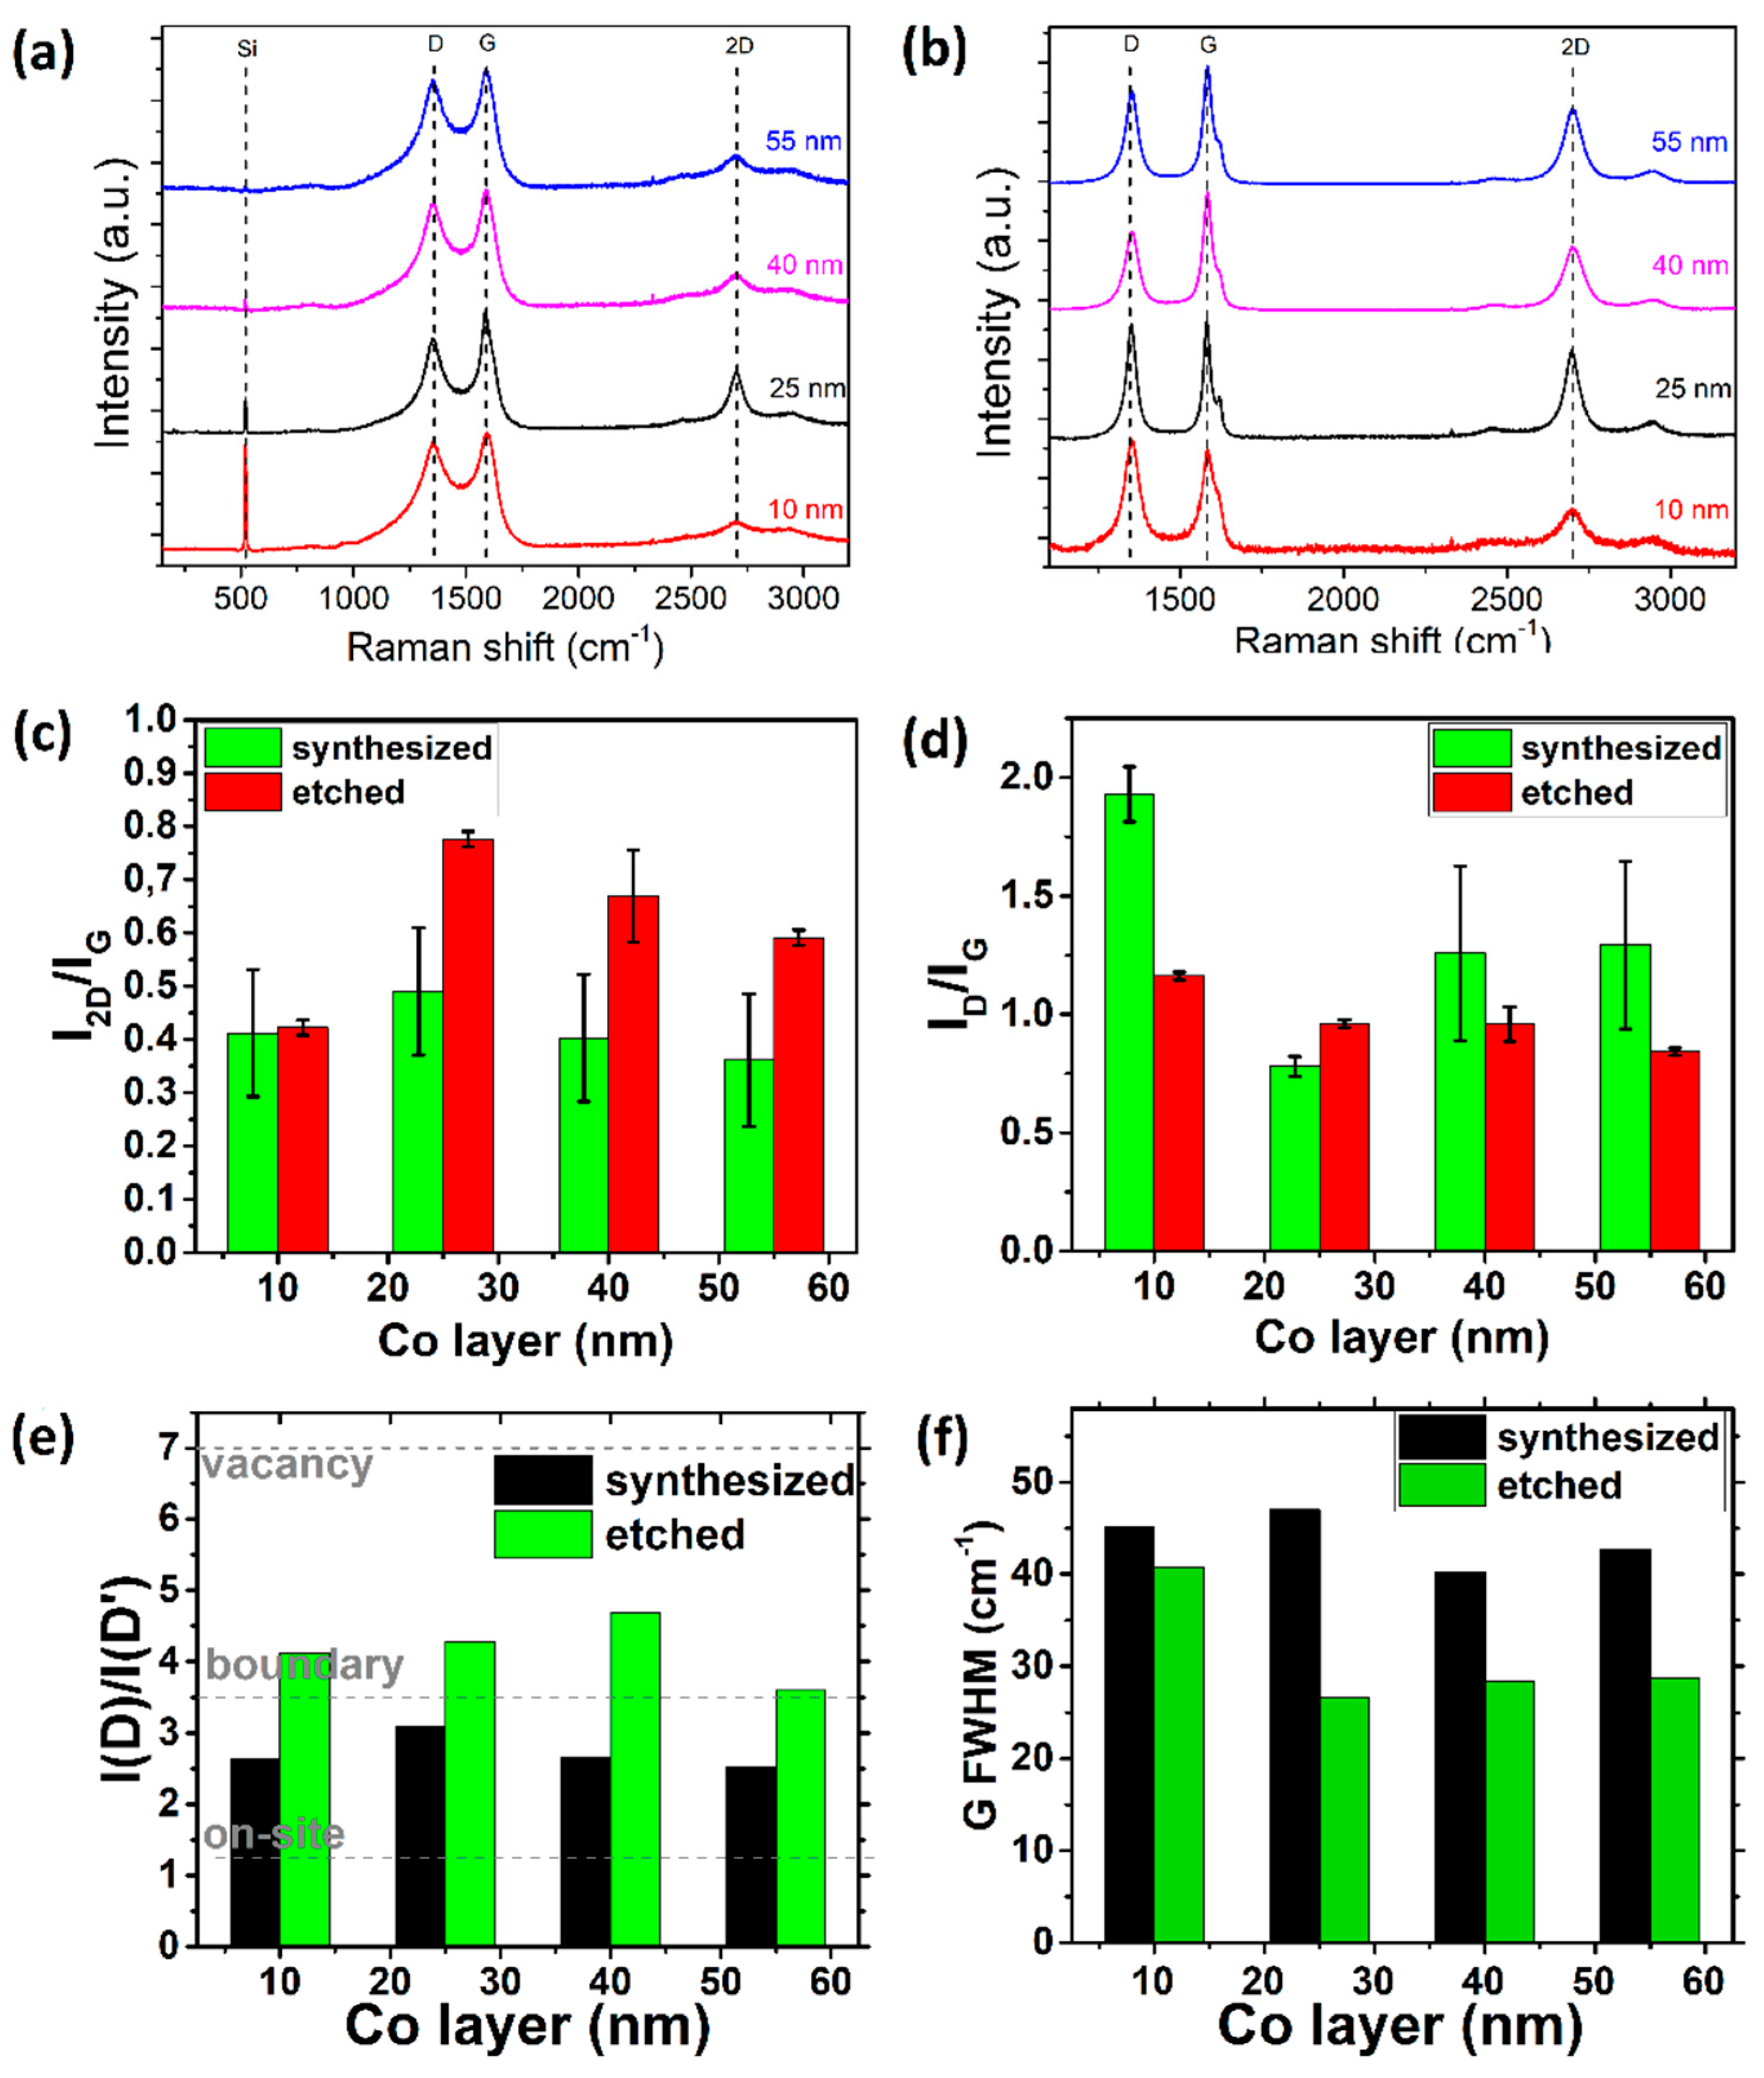
As the thickness of the Co layer increased, the intensities of the Si (~520 cm−1) peaks in the Raman spectra of the graphene on cobaltmples decreased (Figure 5a). For graphene synthesized on the Co layer of 55 nm thickness, no Si-related peak at ~520 cm−1 was apparent. Thus, the silicon was still fully coated due to the greater Co thickness, and the Co layer had no cavities. This is in accordance with [30], where higher annealing temperatures were necessary for the appearance of the holes and subsequent clusterization of the thicker films. As in the previous results, after the cobalt etching processes, the intensities of Si have significantly increased.
From the I2D/IG ratios below in Figure 5c, it can be concluded that the thinnest graphene was grown using a 25 nm thickness Co interlayer (see Table S2). The too thin or thick interlayer increases graphene layers number (Table S2). It can be seen in Figure 5d that the concentration of defects in the synthesized graphene increase for the sample synthesized on a 10 nm thickness cobalt interlayer. On-site defects were found along with boundary defects in all cases for graphene on Co, while in the graphene on Si(100), boundary defects prevailed for all samples. The FWHM(G) was lower for graphene synthesized on Si(100) using 40–55 nm thickness Co interlayer in comparison with the case of the 10 and 25 nm thickness interlayers (Figure 5f). Thus, a thicker Co interlayer was beneficial for the growth of the larger graphene crystallites on a silicon substrate. It should be mentioned that the dependence of the graphene resistivity on Ni interlayer thickness was reported in [38]: too high or too low interlayer thickness resulted in increased graphene resistance. Similarly, the structure of the graphene grown on SiO2 at 950 °C by Ni catalytic film assisted CVD, the graphene quality deteriorated as the catalytic layer was too thin, and no graphene was found on the substrate surface after Ni etching when the too thick layer was used [47].
Roughness and grain size increase with Co film [48]. For metal-induced crystallization of the silicon, the smaller metal grains result in a faster layer exchange process [49]. Thus, graphene layer number can decrease with Co film thickness. At the same time, for graphene synthesized on Ni by metal-induced crystallization, increased roughness increased graphene layers number and defects density [36]. Thus, increased Co film thickness can also increase graphene layers’ number and defects density. Therefore, increased Co interlayer thickness can at the same time suppress and promote the growth of the additional graphene layers on the Si(100) substrate. The carbon diffusion mainly occurs via the catalytic metal grains [22]. Thus, graphene crystallite size can increase with the Co interlayer thickness, as observed in Figure 5f. In such a way, the observed results can be explained by competition between the effects of the increased grain size and increased Co surface roughness. The cobalt interlayer induced additional dissociation of the CHx fragments, resulting in prevailing the boundary defects in graphene synthesized on silicon (Figure 5e), while in the graphene grown on the Co, the presence of the on-site defects besides the dominating boundary defects can be supposed.
In optical microscopy photos, see Figure S2a–d, similar results were seen before and after the etchings of the Co layer of 40 and 55 nm thickness. After the etching, dark and bright areas can be seen. It can be supposed that, graphene is only partially covering the silicon substrate surface after the etching.

3.2. Two-Step Synthesis

3.2.1. Thickness of Co Layer

It was found in Section 3.1 that the Co interlayer became discontinuous after the hydrocarbon ion beam irradiation at elevated temperatures: in Raman spectra of the most samples, Si-related peak can be seen at ~500 cm−1. The Si-related peak was not observed only for samples synthesized using thicker, 40 and 55 nm thickness, Co interlayer. However, the graphene grown on silicon seems to be discontinuous in those cases.
Therefore, we modified the synthesis process by reducing the temperature during a hydrocarbon ion beam irradiation and added a post-deposition vacuum annealing step. Several factors were taken into account choosing the temperature during a hydrocarbon ion beam irradiation. In the case of the graphene synthesis by annealing the amorphous carbon and catalytic metal bilayer, a higher carbon film deposition temperature is beneficial due to the graphitization of the layer [21]. The carbon dissolution in catalytic metal film should be limited to ensure graphene layers number control [50]. The catalytic metal dewetting [22] should be avoided. The influence of Co layer thickness on the structure of graphene was analyzed during direct two-step synthesis. In this case, a lower, 400 °C growth temperature was used, and the samples were annealed at 700 °C. The thicknesses of the cobalt layers were 10 nm, 25 nm, 30 nm, and 40 nm.
We can see that in a two-step synthesis, the intensities of the D bands in Raman spectra of the graphene grown on Co are significantly lower than in the case of the single-step synthesized graphene (Figure 6a). It is also observed here that on the Co surface, using the thickest Co layer − 40 nm, the Si peak (~520 cm−1) is not visible at this spectra. Si-related peak intensity was much reduced for samples grown using thinner Co layers than in the single-step synthesis case.
As it can be seen from the I2D/IG ratios, in two-step synthesis, see Figure 6c, in all cases, fewer graphene layers formed on the surface of cobalt and higher number at the interface between Co and Si. The lowest number of graphene layers was found for graphene grown on Si(100) surface using 25 nm thickness Co interlayer. The bilayer graphene was grown (Table S2). One can see that etching significantly increases the concentration of the defects Figure 6d. The ID/IG ratio for graphene synthesized on Si(100) decreased with increased Co film thickness. Again, on-site defects were found along with boundary defects in graphene on Co. While in the graphene on Si(100), boundary defects prevailed (Figure 6e).
The FWHM(G) values (Figure 6f) were slightly higher for graphene synthesized on Si(100) surface in comparison with graphene on Co. The graphene crystallite size slightly increased with Co interlayer thickness.
Similar to the single-step graphene synthesis case, observed results can be explained by competition between the effects of the increased grain size [22] and increased Co surface roughness [36]. The possible additional dissociation of the C-H bonds by Co interlayer results in prevailing the boundary defects alone in graphene synthesized on silicon, as is seen in Figure 6e.
Optical microscopy photos of Figure S3a,c,e,g show the samples synthesized on Co layer measuring 10, 25, 30, and 40 nm in thickness, and Figure S3b,d,f,h after the etchings, accordingly. The sample’s surface appeared to be homogeneous when a 25 nm thickness Co interlayer was used for synthesis. However, samples grown using 30–40 nm Co interlayer remain inhomogeneous after the etching surface.

3.2.2. Temperature of Annealing

Another analyzed parameter of the Co layer activated direct synthesis was annealing temperature. In this case, the carbon layer growth temperature was 400 °C, ion beam energy was ~800 eV, growth time was 15 min, and Co layer thickness was 40 nm. The annealing temperature was varied from 500 to 700 °C.
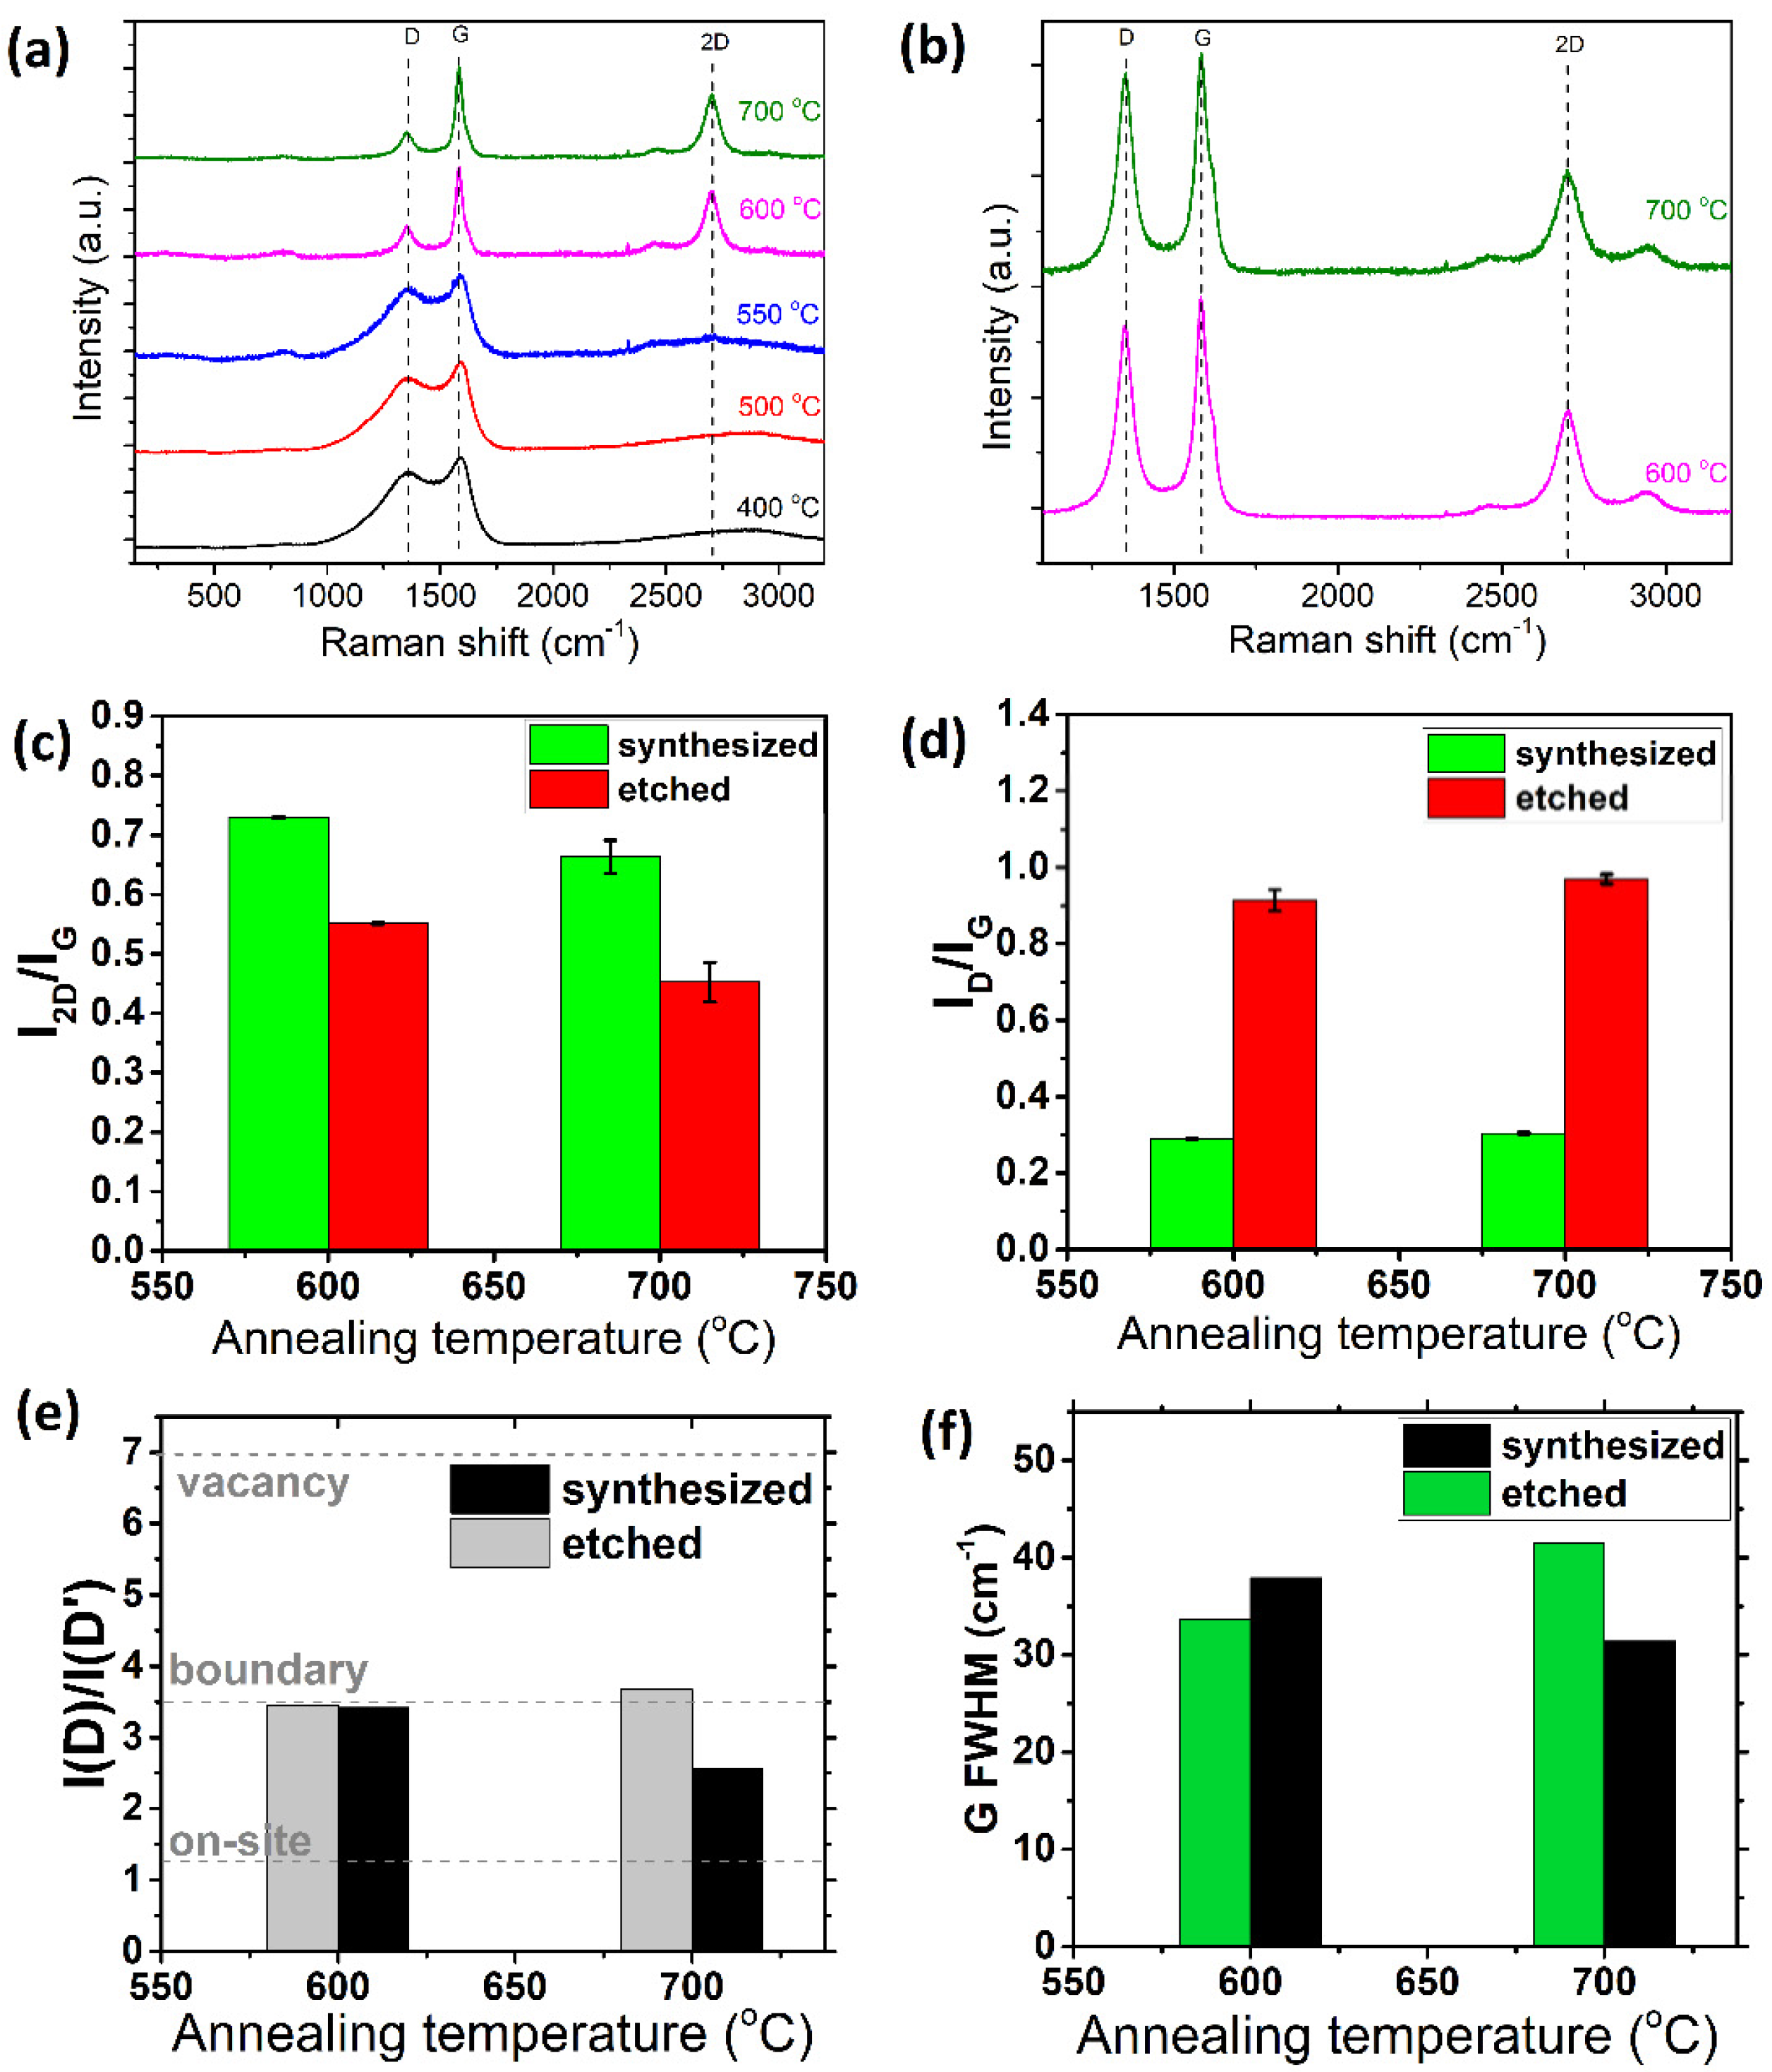
The required temperature of annealing for the formation of graphene on both Co and Si(100) was reached at 600 °C, while at ≤550 °C temperature, amorphous graphite-like carbon was formed on cobalt, and no carbonaceous layer was found on silicon (Figure 7a,b). Amorphous graphite-like carbon was recognized by the half-merged D and G peaks and the absence of the 2D peak [51,52,53]. Similar results were reported for experiments of the graphene synthesis on SiO2 by annealing a-C and Ni bilayer at 575 °C temperature [54].
I2D/IG ratios range from 0.65 to 0.73, corresponding to multilayer graphene (~0.8) (Figure 7c). Thinner graphene is grown on cobalt than on silicon. The layer number of the graphene synthesized on Si(100) increases with synthesis temperature from one to two layers to the ~three layers (see Figure 7c and Table S2). The ID/IG ratios of the samples grown on Co were below 0.3, indicating a relatively low concentration of defects (Figure 7d). ID/IG ratios significantly increased for the graphene synthesized on Si(100), indicating a strongly increased defect density. The ID/ID’ ratio analysis showed that the dominating defect type for all studied graphene samples were boundary defects. The sample, synthesized at 400 °C on Co, had the largest ID/ID’ ratio, indicating the presence of the vacancy and sp3-type defects. Lastly, the annealing temperature did not significantly impact the FWHM(G) (see Figure 7f). The crystallite size slightly increased with annealing temperature for graphene on Co and slightly decreased for graphene on Si(100) (Figure 7f). Optical microscopy photos in Figure S4a–h show the surface of the samples, annealed at 500 °C, 550 °C, 600 °C, and 700 °C before and after the etchings. As we can see, on the surface of the sample annealed at 500 °C Figure S4a,b, no features could be seen before and after the Co etching. For samples annealed at 550 °C temperature (Figure S4c,d), some inhomogeneous parts of the Co layer are left after the etching processes. The sample’s surface annealed at 600 °C temperature was even, indicating the presence of the continuous graphene on both Co and Si(100) (Figure S4e,f). At the same time, the increase of the annealing temperature resulted in the appearance of some features on the sample surface (Figure S4g,h).
The temperature influence on Co interlayer structure resulting in different graphene growth conditions can explain observed results. No Si-related peak at ~520 cm−1 can be found in the Raman scattering spectra of the films grown on cobalt (Figure 8a). Thus, no through-holes were formed in the Co interlayer due to the annealing. Co film can become rougher due to the increased annealing temperature [34], promoting the growth of the thicker graphene on Si(100) at higher annealing temperatures. No FWHM(G) dependence on annealing temperature indicates that nucleation conditions remain the same.

3.3. Single-Step versus Two-Step Graphene Synthesis

Overall, two graphene ion-beam synthesis methods were compared. Raman spectra and their parameters were analyzed for graphene synthesized at 600 °C and 700 °C, and samples synthesized at 400 °C and annealed at 600 °C or 700 °C (see Figure 8). The formation of the through-holes in a Co interlayer was found for samples fabricated using single-step synthesis (Figure 8a,c), while two-step synthesis results in suppression of that process: Si-related peak is absent in Raman scattering spectra of the samples, or its intensity is very low (Figure 8a,c). Besides, in Raman spectra of the graphene single-step synthesized on Co, D and G peaks are partially overlapped (Figure 8a,c). According to [28], it indicates the presence of the amorphous carbon phase.
From the I2D/IG ratio Figure 8e, we can see that during a single-step synthesis, more graphene layers were formed on the Co surface than on the silicon—the I2D/IG ratio increased in both cases, and at 700 °C, it reached ~1.2, while for two-step synthesis, an opposite dependency is found—more layers were formed at a Co-Si interface (Figure 8e).
Compared to the single-step synthesis case, a two-step synthesis method results in a much-reduced ID/IG ratio in Raman spectra of the graphene synthesized on Co (Figure 8f). Thus, much fewer defects were formed in graphene grown using two-step synthesis. The ID/IG ratio of the Raman spectra of graphene synthesized on silicon was higher than in the case of the graphene on Co for the sample grown by two-step synthesis and sample grown by single-step synthesis at 700 °C temperature. In contrast, an opposite tendency was found for graphene grown by single-step synthesis at 600 °C. Comparing the Raman spectra of the graphene synthesized at a cobalt/silicon interface, it can be seen that the defect density is the same for samples grown at 600 °C. The rise of the growth temperature to the 700 °C results in an increased defect density. The defects density increase is more significant for a sample formed by a two-step synthesis than single-step grown graphene (Figure 8f). The defects’ nature was mainly similar for single-step and two-step synthesized graphene (see Figure 8g). In all cases, the FWHM(G) was higher for graphene synthesized on Co, except the sample grown by two-step synthesis at 700 °C (Figure 8h). The use of two-step synthesis resulted in increased crystallites of the graphene grown on Co compared to a single-step case. At the same time, for graphene synthesized on Si(100), the single-step process was beneficial for the growth of the larger graphene crystallites.
Thus, single-step synthesis promotes the growth of thinner graphene on the silicon surface. As mentioned previously, single-step synthesis is similar to the graphene direct growth using PECVD and sacrificial Ni film. The I2D/IG ratio and ID/IG ratio of the graphene synthesized on quartz using PECVD and sacrificial Ni interlayer was 1.3 and 0.05, respectively [18], while graphene grown on the Ni had more layers and much more defects.
The two-step synthesis is more beneficial for thinner graphene, consisting of the larger crystallites, containing fewer defects and no amorphous carbon phase growth on Co. However, the defect density in graphene synthesized at the Co/Si(100) interface at 600 °C by a single-step and two-step methods is nearly the same. Growth temperature increases up to 700 °C results in different behavior—the defect density is lower in the sample synthesized on the silicon using single-step synthesis. The advantage of the graphene growth on Si(100) by two-step synthesis is the formation of the continuous and, in some cases, homogeneous layer, differently from the case of the single-step grown graphene (see the optical photos in Figure 3h,i, Figure 5h–k, Figure 6h–o, and Figure 7h–o). It should be mentioned that for a-C/Co/SiO2 system, annealing resulted in no graphene growth on silicon dioxide [38] The graphene was found only on cobalt film. However, in [10], a-C/Ni/SiO2 structure annealing resulted in graphene formation on SiO2 at 600 °C, and graphene growth on the nickel only at 1000 °C. Thus, it seems possible to further optimize the two-step graphene synthesis method for graphene growth on the silicon.
One can explain the observed results considering the peculiarities of the technological processes and related physical mechanisms. In single-step synthesis, dissociated hydrocarbon and carbon species can participate in cobalt-induced crystallization immediately. Thus, adsorbed hydrocarbon and carbon species are diffused to the catalytic Co film. However, cobalt grain size increase [32,33,34,35], and cobalt dewetting [30,31] can occur during the graphene synthesis due to the elevated temperature.
In two-step synthesis, deposited graphite-like film as a whole is crystallized by a cobalt catalytic interlayer. The carbon atoms from the graphite-like film are diffused to the catalytic interlayer, which has no holes due to decreased deposition temperature of the carbon film. At the same time, part of the carbon can be desorbed from the sample surface [55].
Thus, it can be supposed that during the single-step synthesis, the cobalt grain size in the catalytic interlayer increase due to the elevated temperature during the hydrocarbon ion beam bombardment. It leads to reduced graphene nucleus number and thickness [22]. As a result, fewer graphene layers of the increased crystallite size were grown on Si(100) by the single-step synthesis compared to two-step growth.
In the case of the graphene synthesized on SiO2 by annealing of the amorphous carbon and catalytic metal (Co or Ni) bilayer, the I2D/IG ratio in all cases was lower than in the case of the graphene synthesized on quartz using PECVD and sacrificial Ni catalytic interlayer (see [7,9,10,11,18,36], respectively). At the same time, the defects density in graphene synthesized by bilayer annealing in almost all cases was higher ([7,9,10,11,18,36]).

3.4. AFM and SEM Results

An optical microscopy study revealed different features and inhomogeneities at the samples surfaces. Therefore, surface morphologies of the selected samples synthesized using one-step and two-step processes were more thoroughly studied through atomic force microscopy and scanning electron microscopy. The graphene formed on the Co film and graphene synthesized on the Si(100) substrate were investigated to check the formation of the planar graphene, the possible presence of the non-planar graphene features or other micro/nanostructures, evaluate overall continuity of the synthesized samples, using much higher resolution microscopy techniques.
For the graphene layer synthesized in a single-step process (sample 1), the cobalt interlayer etching decreases RMS by 2.4 times, and a significant height difference between the formed derivatives was found. Detached graphene sheets of 350–600 nm width are observed by AFM and SEM (Figure 9). We can assume from the phase imaging that there are two maxima in the phase histogram. The flat surface area seen in the SEM image is planar graphene (Figure 5 and Figure 9). It should be mentioned that the graphene detachment during the chemical etching of the sacrificial catalytic film was already reported in [56]. In a high-magnification SEM image, one can see the planar graphene at the bottom, some graphene flakes of the 20–40 nm size, and larger rolled graphene flakes (Figure S10).
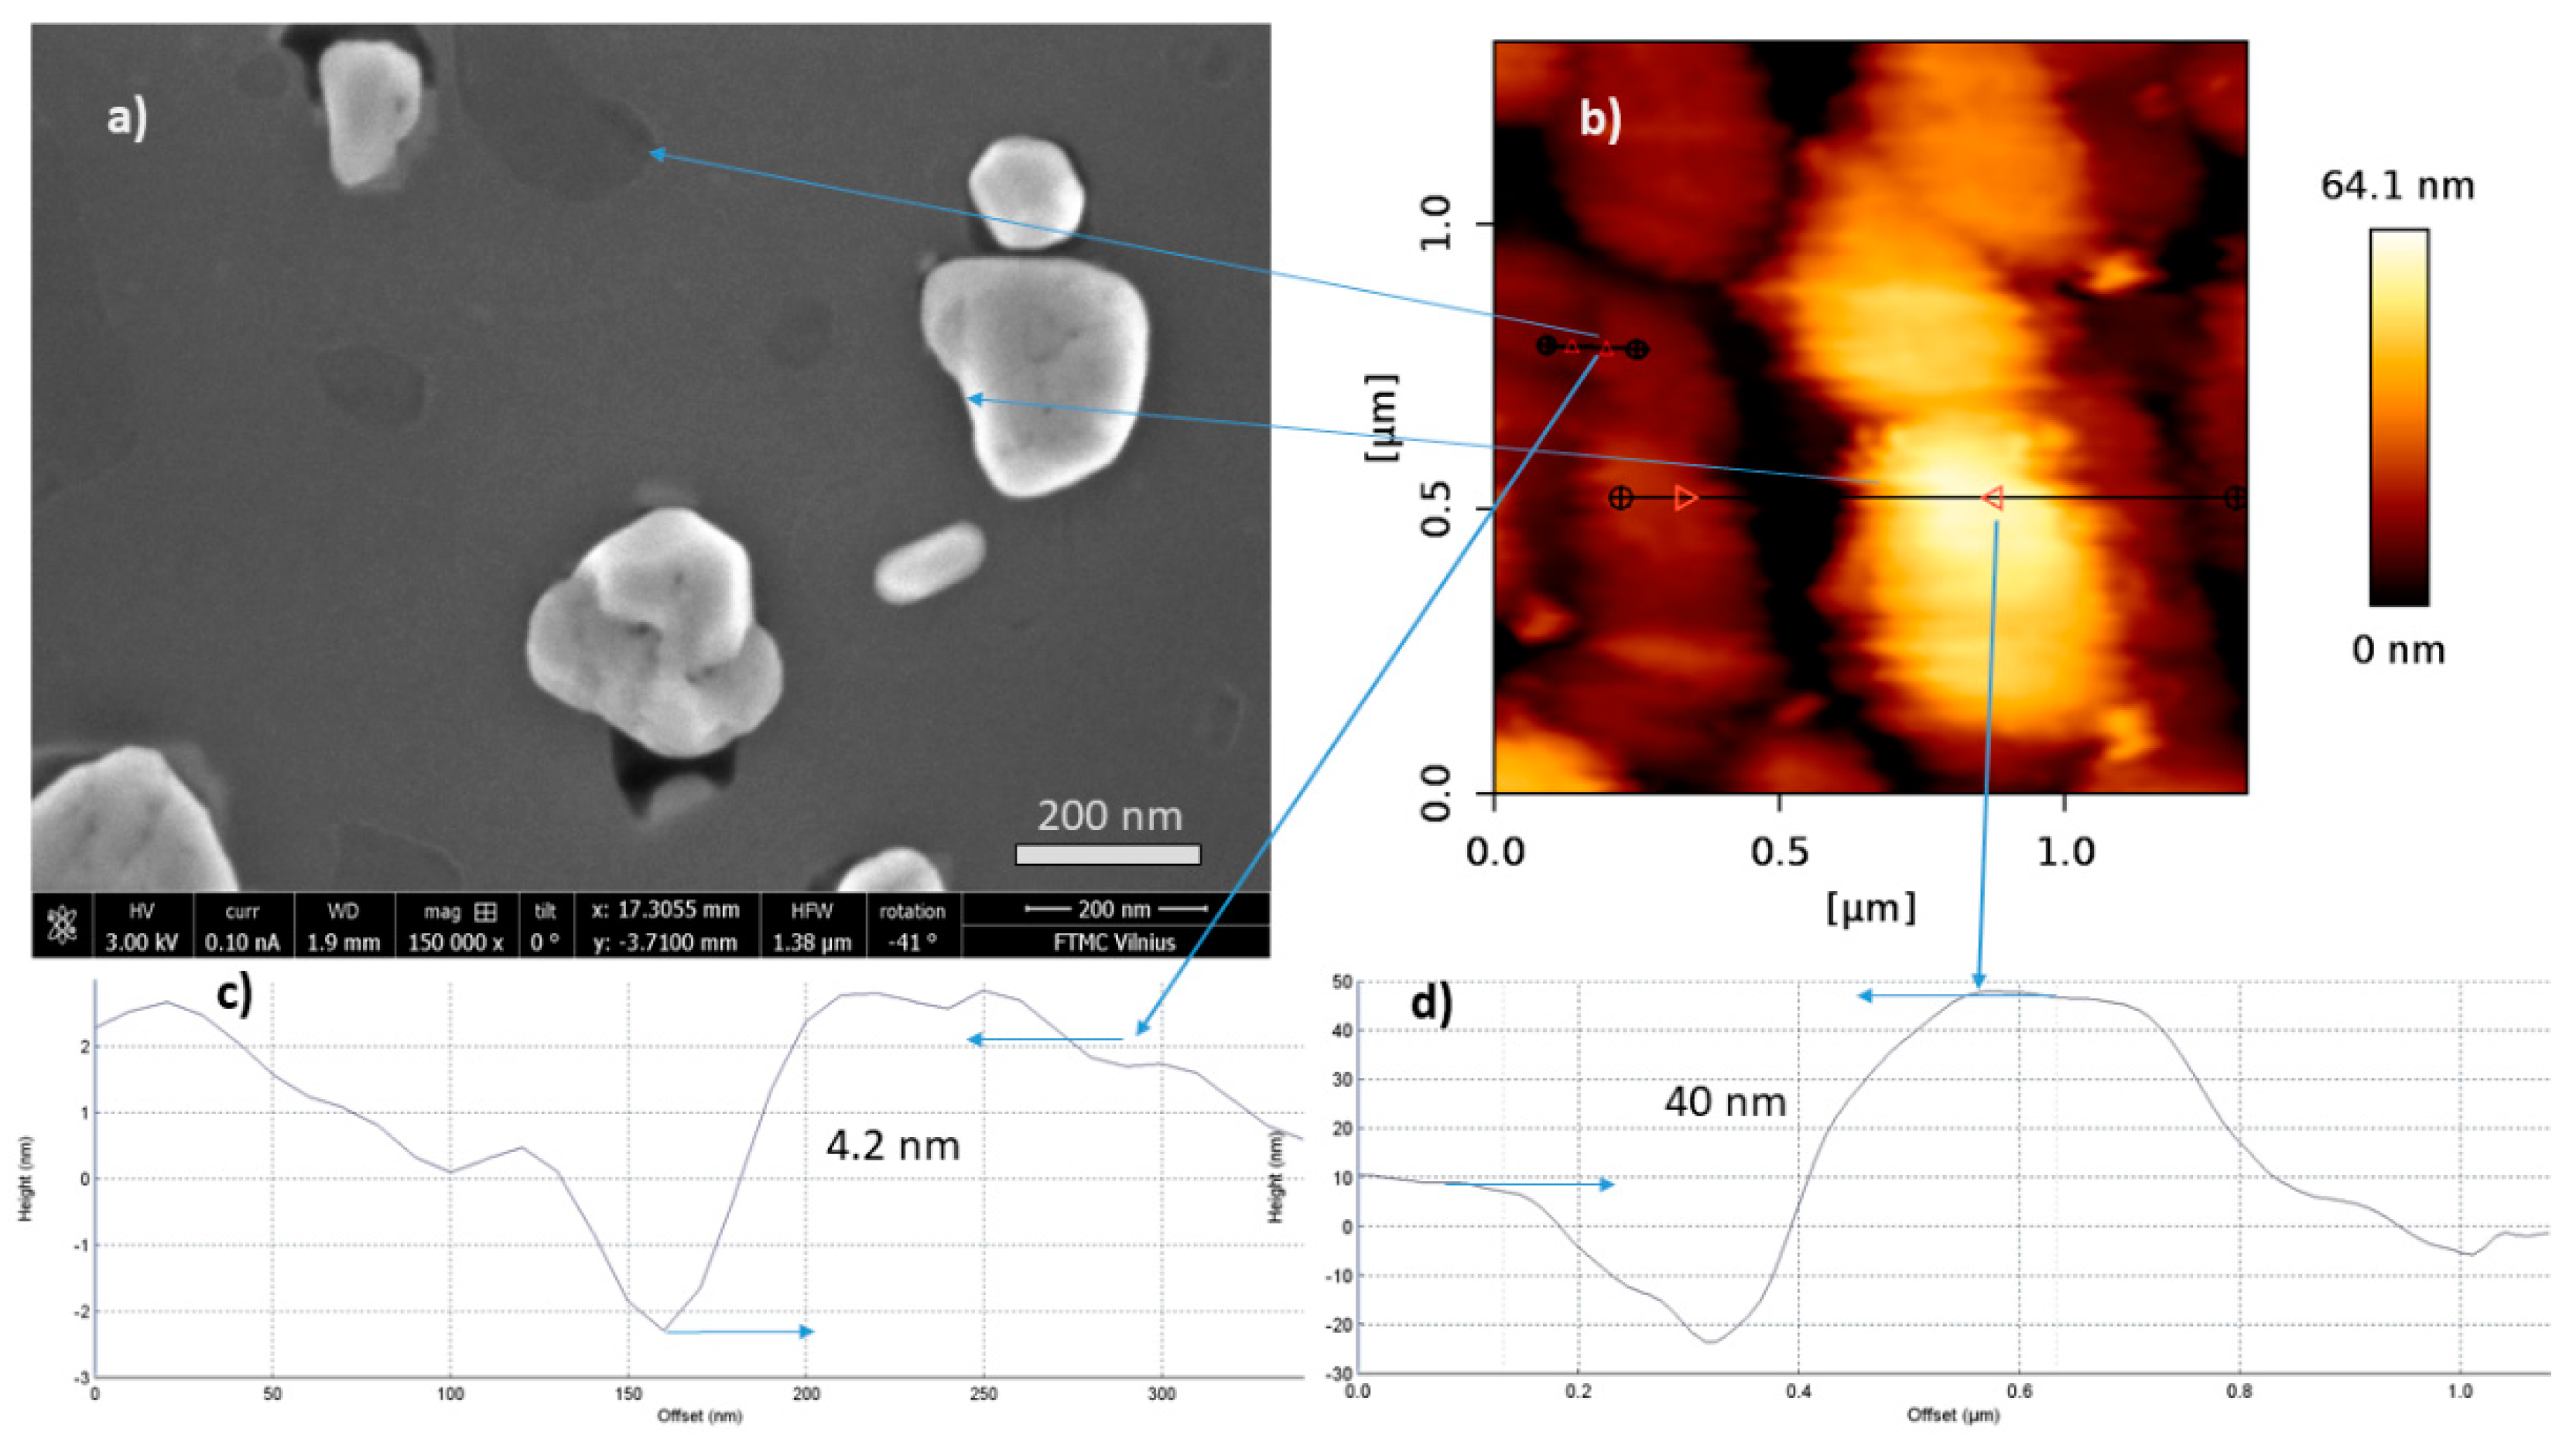
For the graphene layer grown on Co in a two-step process, graphene sheets of predominant 17.1 nm height are observed on the surface (Figure S6). The sample’s RMS increases ~five times due to the HNO3 etching, the histogram expands, and there is a height dispersion. In the microscopic images (Figure 10, Figures S6 and S11), detached and curled graphene sheets and the planar graphene are observed. Thus, similar to the single-step synthesis case, wet chemical etching of the cobalt results in partial detachment of some graphene flakes and their subsequent curling in some cases.
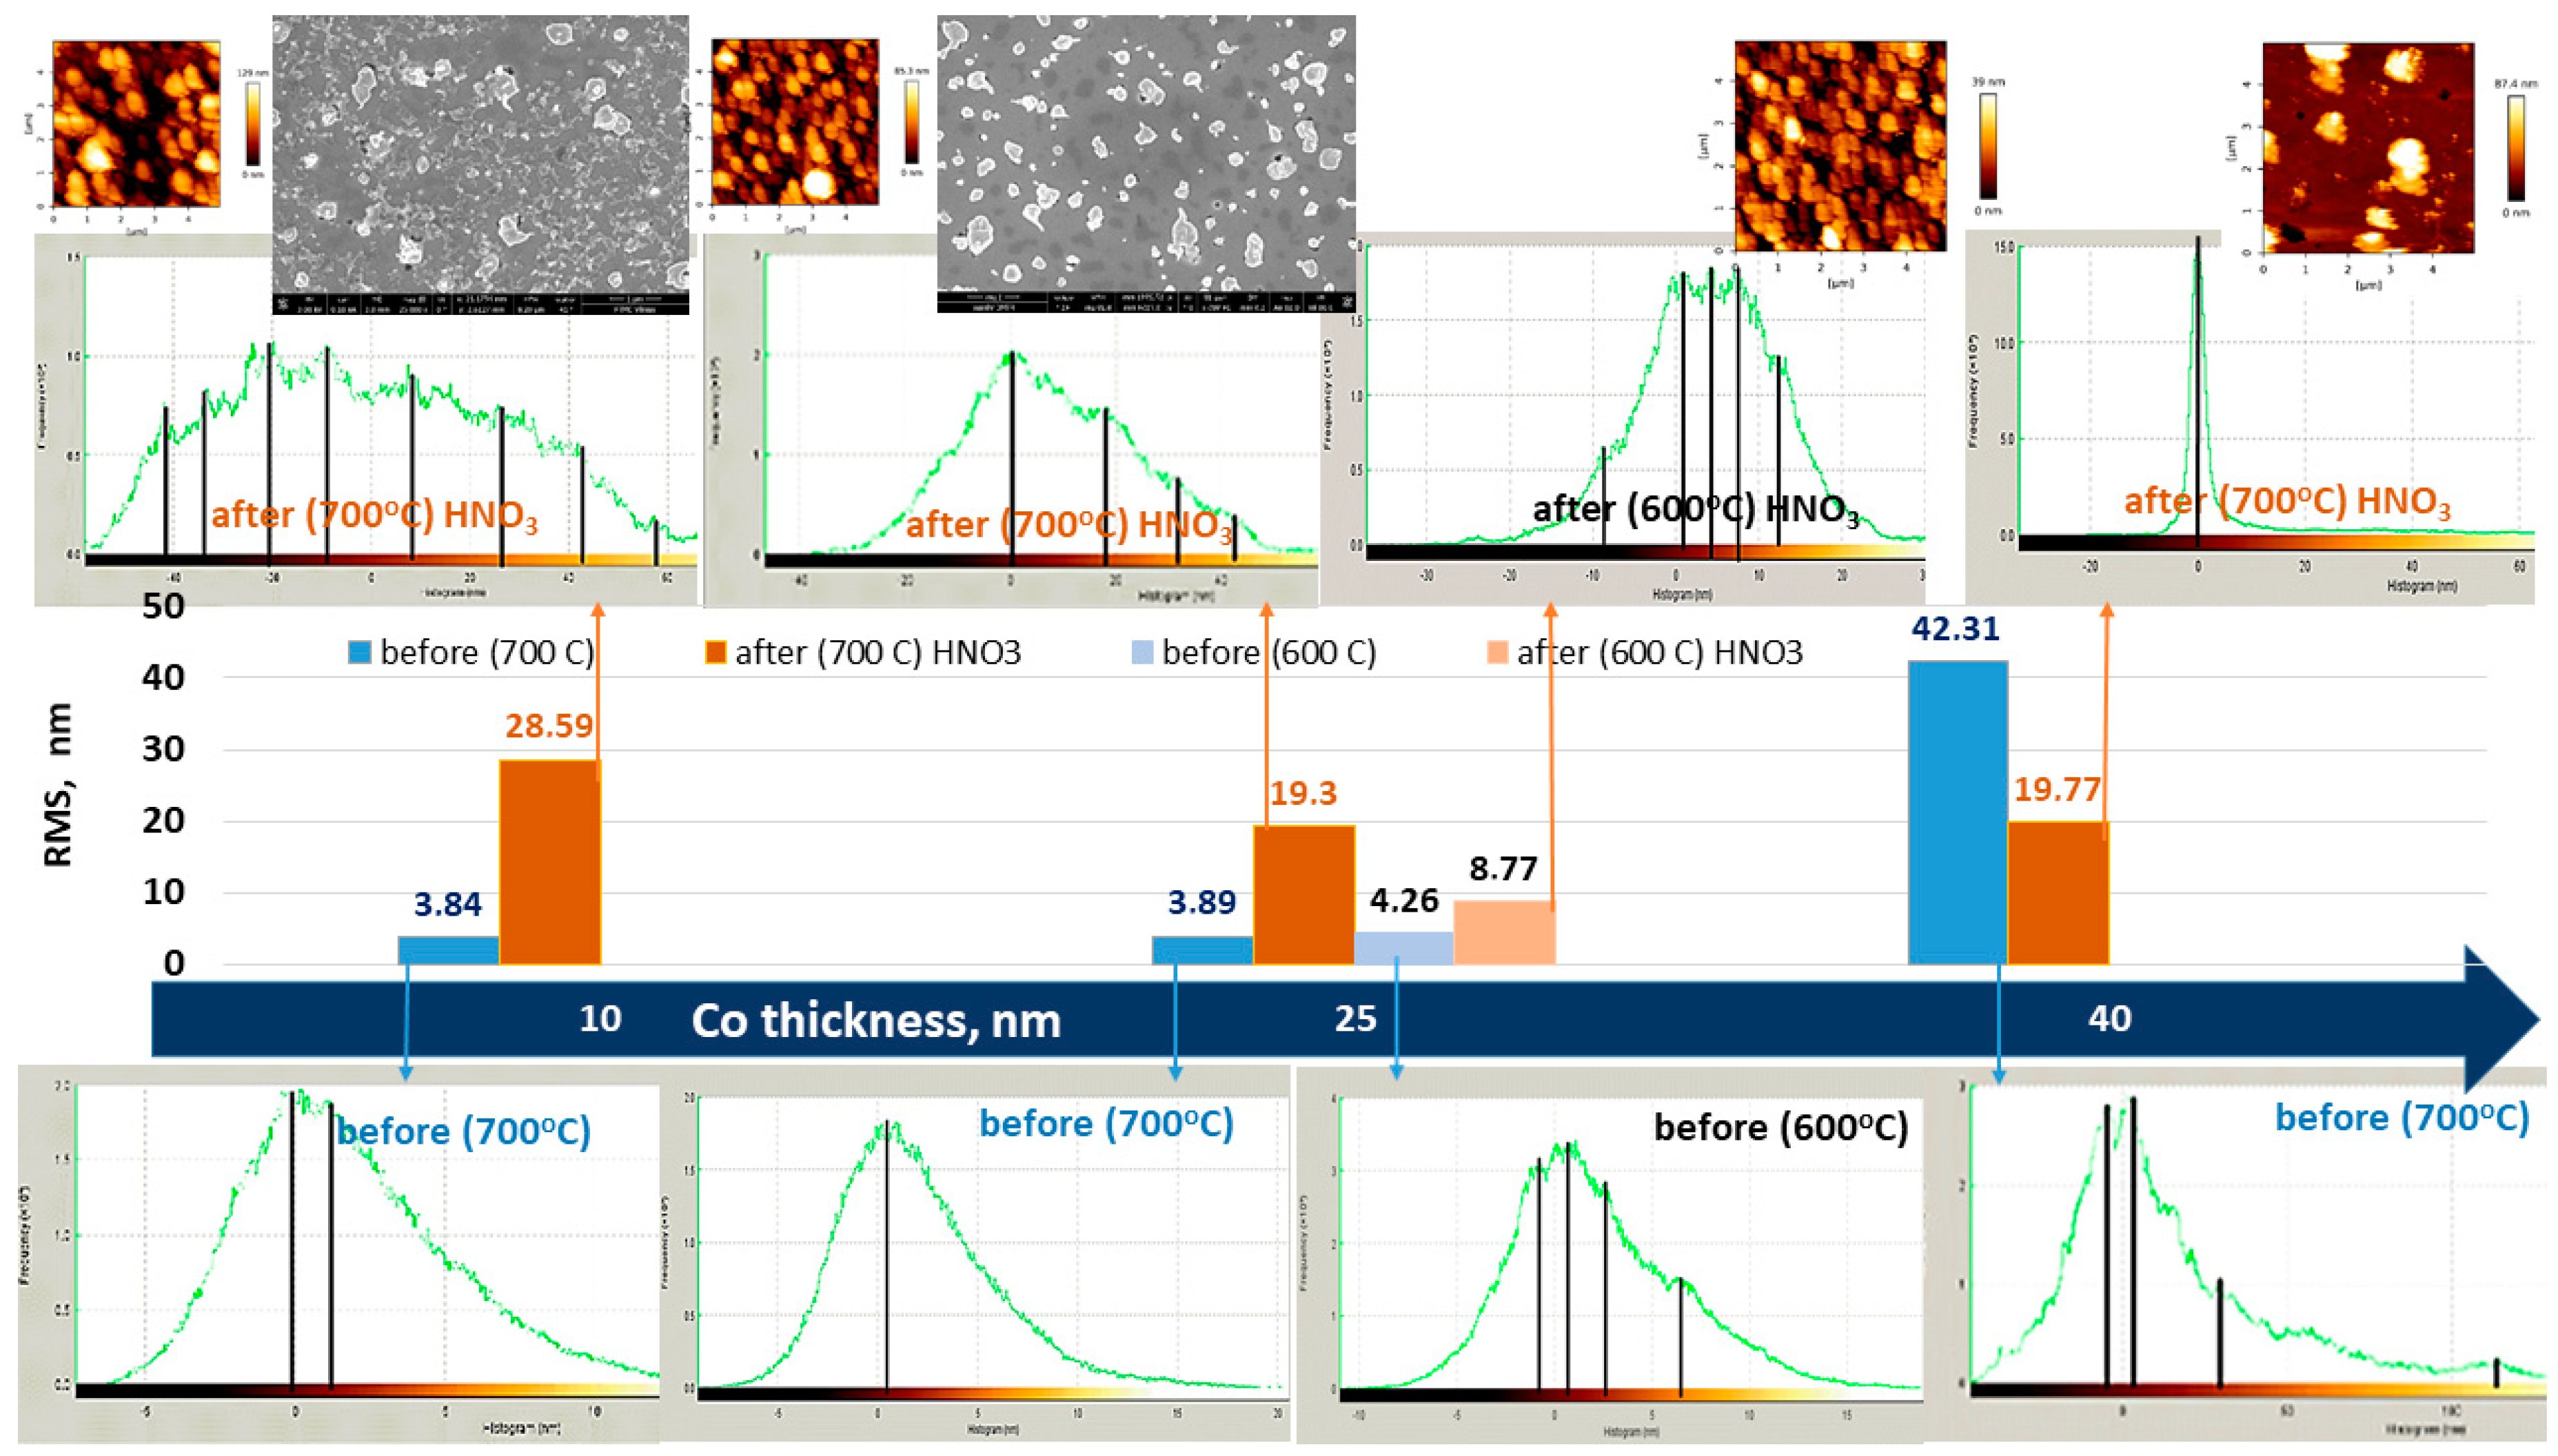
Depending on the thickness of the Co layer, additional graphene sheets of dominant heights are formed for the graphene layer grown in the two-step process after the cobalt wet chemical etching by HNO3 (Figure 11). A total of eight dominant heights were found in the heights histogram of the graphene synthesized on Si(100) using a 10 nm thick Co layer. When the Co interlayer thickness was 25 nm, four dominant heights were found, and for 40 nm thick catalytic interlayer case, six dominant heights were identified. The phase diagrams (Figures S6–S8) also show an inhomogeneous surface. Overall, four phases were found on the sample surface after the etching of cobalt film when the Co layer thickness was 10 nm. For graphene grown using thicker catalytic interlayers, two different phases were found after the Co etching by HNO3. SEM images confirm the results of the AFM analysis: for graphene synthesized using the lowest Co layer thickness, several types of derivatives are observed. A number of the non-planar graphene-related higher surface features appear to decrease with increased sacrificial Co film thickness. One can see that tendency in SEM images and taking into account narrowing of the height distribution histogram for graphene synthesized on silicon (Figure 11).
In summary, we can state that the surface roughness and the number of dominant heights (graphene sheets of different heights) depend on the thickness of the Co layer.
The morphology of the graphene surface depends on the annealing temperature (Figure 11, Figures S8 and S9). Higher annealing temperature (700 °C vs. 600 °C) results in a 2.2 times increase of the RMS of graphene grown on silicon (Figure 11 and Figure S8). In the phase images, for grown by annealing at 600 °C, a single-phase histogram is observed, after HNO3 exposure, while at 700 °C—two phases (Figures S8 and S9). The heights distribution histogram broadens with annealing temperature, indicating an increased number of the non-planar graphene inclusions.
Therefore, one can suppose the influence of the thermal stress and their release on the formation of the detached and curled graphene flakes.
It should be mentioned that other authors reported similar results for graphene directly grown by catalyst-assisted synthesis. The inhomogeneous surface was observed by SEM similarly to Figure 9 and Figure 11 [9,10,19,54]. In [9,56], for some graphene samples, smooth surface areas with darker gray islands were seen by SEM similarly to the graphene on Si(100) areas free of the detached graphene seen in Figure 11. AFM images of the graphene synthesized using catalyst-assisted direct synthesis in [40] revealed a granular structure similar to our study results (Figure 9 and Figure 10).

3.5. XPS Analysis

To better understand the surface composition of the samples and reveal the bonding nature of the synthesized graphene, high-resolution spectra of oxygen, carbon, and silicon were acquired for surface composition analysis and possible chemical bonds detection. The sample synthesized by two-step synthesis (Co film thickness 30 nm, annealing temperature 700 °C, ion beam energy 800 eV) was selected for study by XPS.
Atomic concentration calculation results of the surface of the samples are presented in Table 2. The appearance of the significant amount of silicon most likely is due to the silicon substrate (silicon wafer was covered with thin natural oxide).
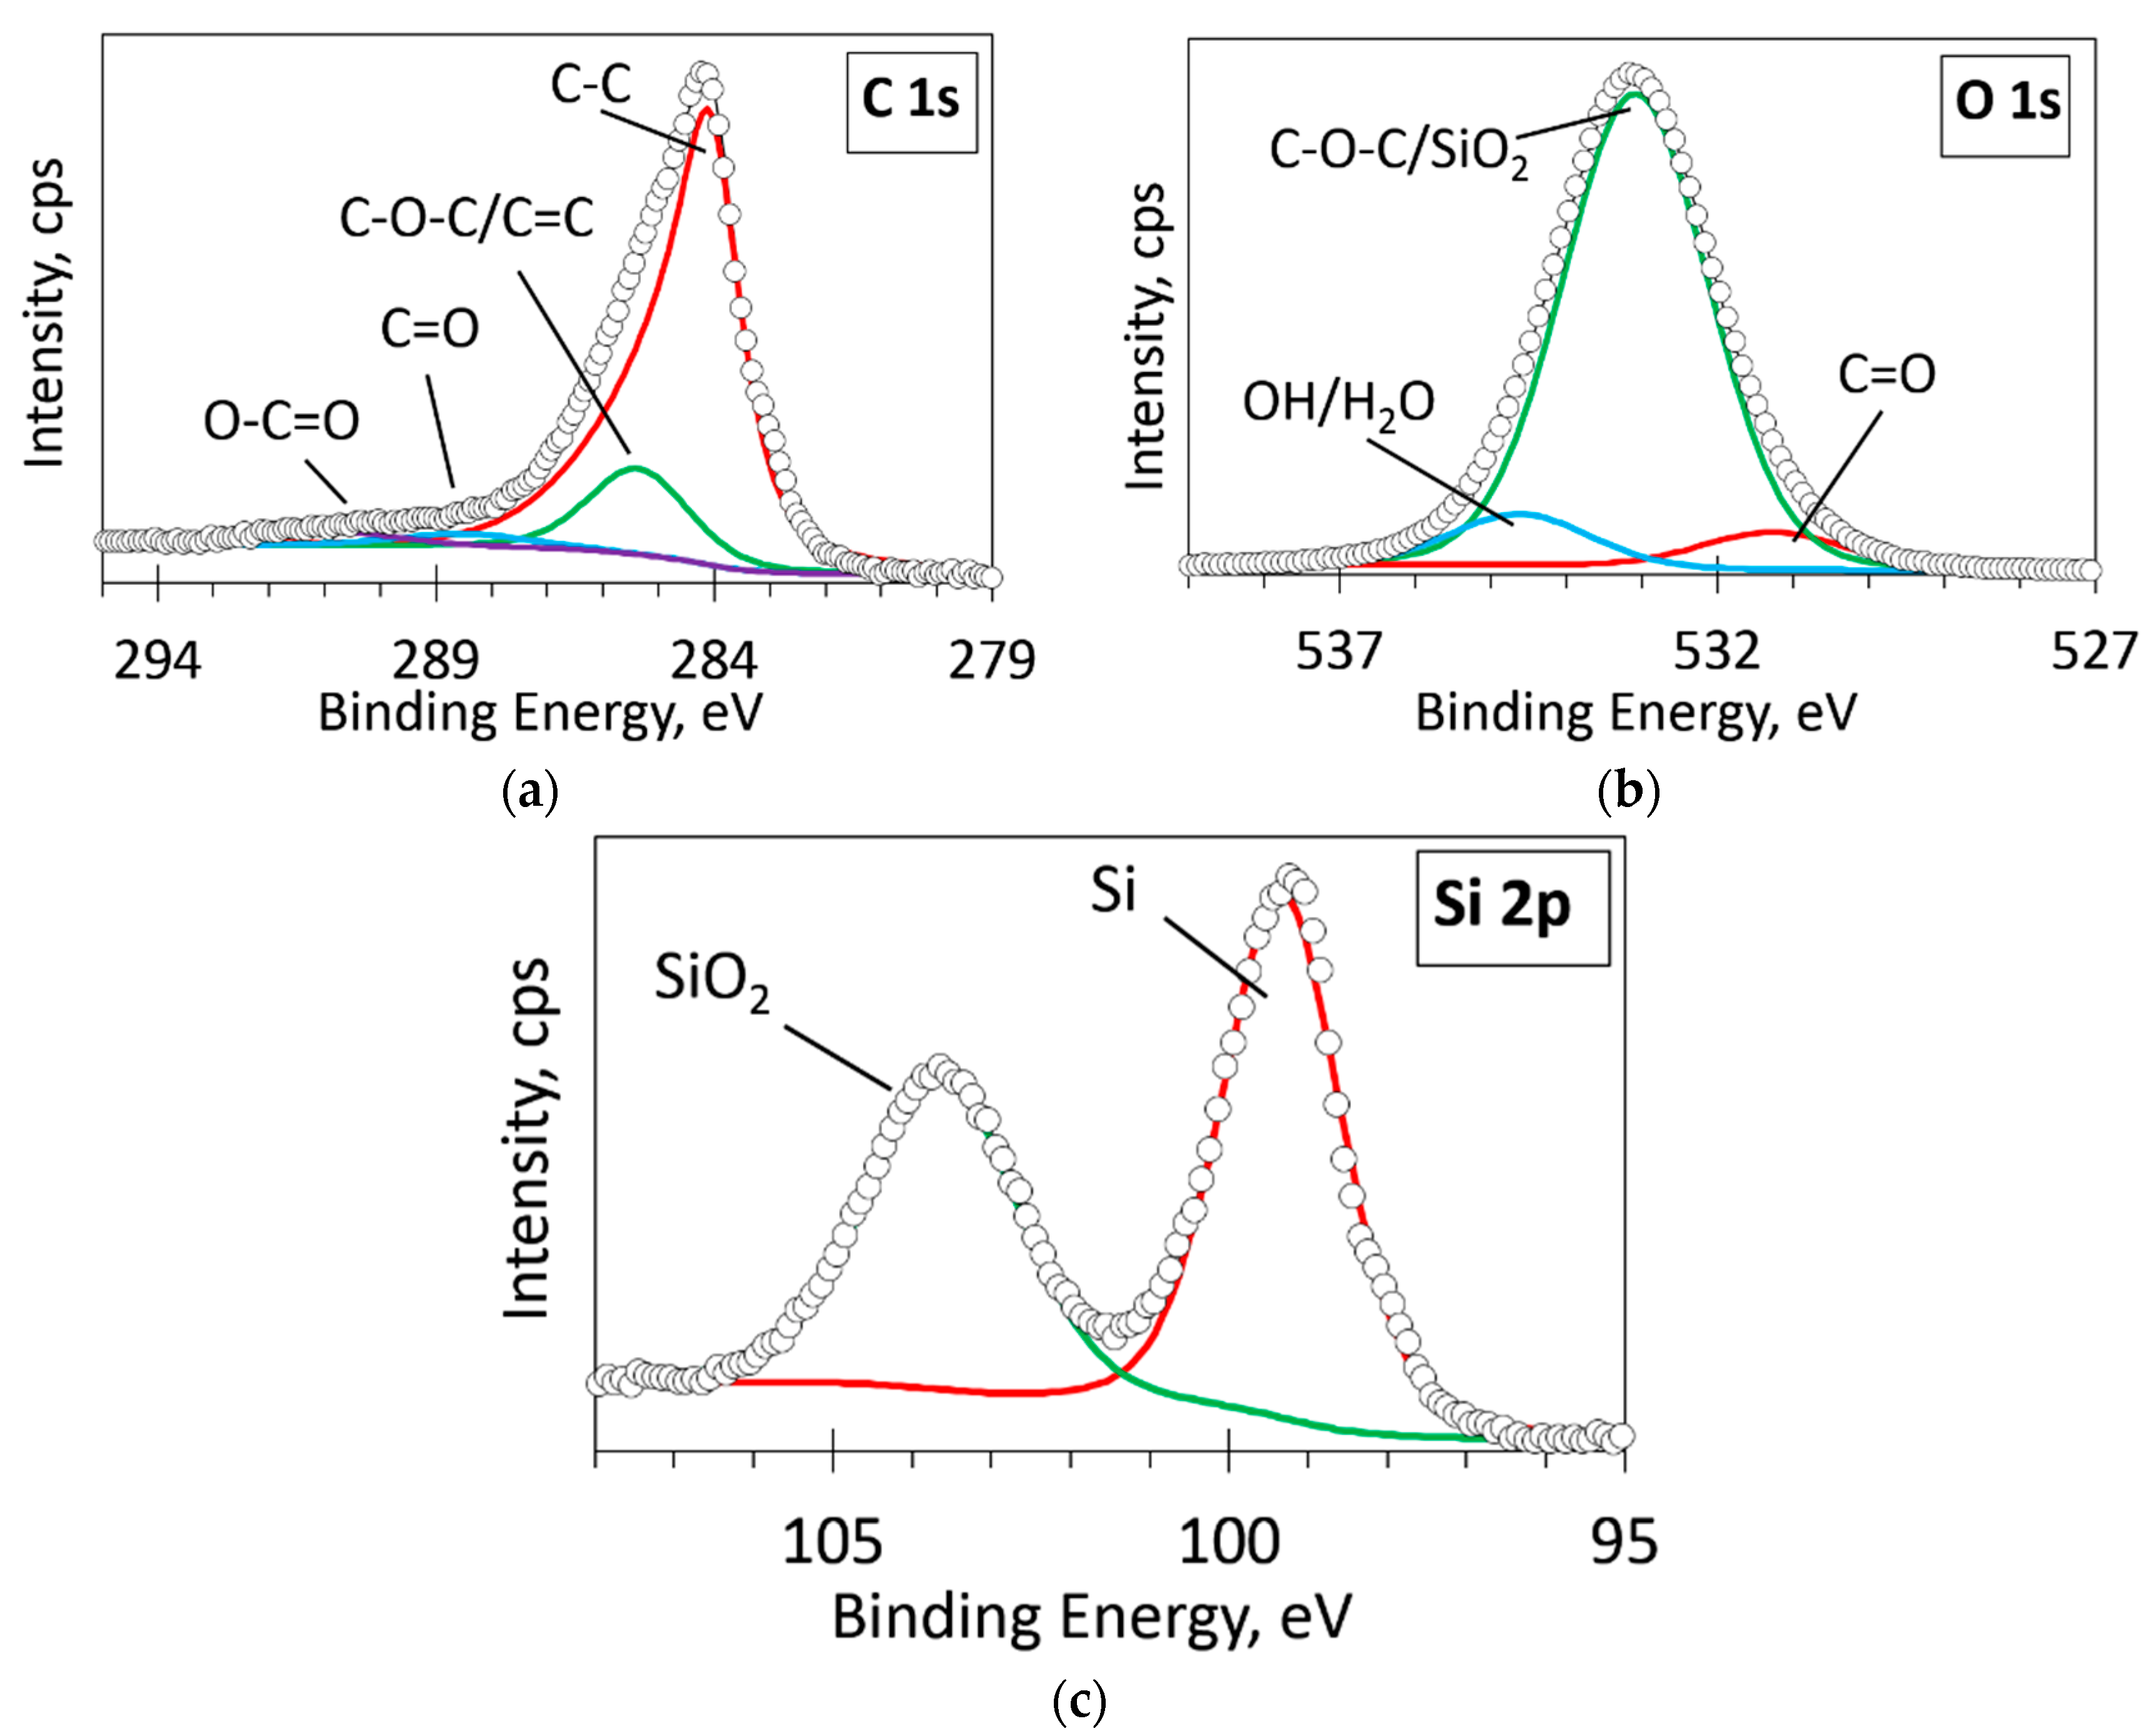
Deconvoluted carbon XPS spectra show a highly asymmetrical, high-intensity peak at 284 eV and a low-intensity symmetrical peak at 285.4 eV (Figure 12a). The first peak coincides with known peak shape and position of carbon (sp2) bonds in graphene (284 eV, 284.5 eV) [57,58] and in amorphous carbon (284.77 eV and 284.53 eV) [59,60]. The second peak could be attributed to carbon (sp3) bonds as reported in the literature [58,59,60] (285.4 eV, 285.25 eV, and 285.1 eV). It implies a high amount of graphitic carbon bonds on the sample’s surface, indicating the formation of graphene on the silicon surface [57]. Moreover, the position of the peak at 285.4 eV partly overlaps with the position of the C-O-C bond (286 eV) [61], and O 1s spectra confirm the presence of C-O-C bonds (Figure 12b).
Deconvoluted high-resolution XPS oxygen O1s spectra are presented in Figure 12b. In this picture, fitted peaks and corresponding chemical bonds are indicated. The O1s peak consists of three fitting components at 531.3 eV, 533 eV, and 534 eV positions on the binding energy scale. These fitting components represent C=O bonds, a mixture of C-O-C and SiO2 bonds, and hydrogen-oxygen bonds, respectively. Positions of these peaks are in good agreement with binding energy values (531, 532.8, and 534 eV, respectively) reported in the literature [58,62,63] for the abovementioned bonds.
The presence of SiO2 bonds is confirmed by silicon Si 2p spectra analysis. Deconvolution of high-resolution silicon Si 2p spectra showed two peaks assigned to Si-Si and SiO2 bonds, and positions of these peaks (99.4 and 103.63 eV, respectively) correspond to binding energy values reported in the literature (99.4 and 103.6 eV, respectively) [63].

4. Conclusions

In the present study, graphene was synthesized on both Co and Si(100) using cobalt sacrificial catalytic film activated hydrocarbon ion beam synthesis at 600 °C. The single-step synthesis promoted the growth of thinner graphene with fewer defects on the silicon surface. The two-step synthesis was more beneficial for graphene synthesis on cobalt: the thinner graphene, consisting of the larger crystallites and containing significantly lesser defects, was grown. On-site defects were found along with boundary defects for most graphene samples synthesized on Co, while in the graphene grown on Si(100), in most cases, boundary defects prevailed. The process temperature, ion beam energy, and cobalt catalytic interlayer thickness affected the graphene structure.
Cobalt film dewetting was found to have occurred during graphene single-step synthesis. It resulted in growth on the cobalt of the graphene with inclusions of the amorphous carbon; and the discontinuous non-homogeneous graphene films on the silicon. The dewetting process was activated with increased synthesis temperature, hydrocarbon ion beam energy decreased to 500 eV, and decreased catalytic Co film thickness. In contrast, two-step graphene synthesis resulted in suppression of this process.
The observed results were explained by peculiarities of the thermally, ion source plasma, and catalytic metal activated hydrocarbon species dissociation. The changes of the Co grain size, cobalt film roughness, and dewetting were taken into account.
The detached and curled graphene sheets along with planar graphene were observed at the samples synthesized on silicon. The density of the non-planar graphene features was lower for two-step grown graphene. It decreased with the Co interlayer thickness increase and annealing temperature decrease. The thermal stress and their release effects on the formation of the detached and curled graphene flakes were considered.
Thus, despite the better control of the graphene layers number and increased crystallite size of the graphene grown on silicon by single-step synthesis, the two-step synthesis of the graphene on Si(100) is beneficial due to the growth of the continuous graphene film with a reduced number of the non-planar graphene features with no inclusions of the amorphous carbon phase. From this point of view, the optimal graphene annealing temperature and the optimal Co interlayer thickness were 600 °C and 25 nm, respectively.

Supplementary Materials

The following are available online at https://www.mdpi.com/article/10.3390/pr10020272/s1, Figure S1: Optical microscopy photos, comparing a sample surface, synthesized at 800 °C, after synthesis (a), and after the cobalt interlayer removal (b), the scale bar represents 50 μm; Figure S2: Optical microscopy photos of the samples synthesized using 40 nm thickness Co layer before (a) and after the etching (b); optical microscopy photos of the samples synthesized using 55 nm thickness Co layer before (c) and after the etching (d), the scale bar represents 50 μm; Figure S3: Optical microscopy photos of the sample synthesized using Co = 10 nm (a), Co = 10 nm—after the etchings (b), synthesized with Co = 25 nm (c), Co = 25 nm—after the etchings (d), Co = 30 nm (e), Co = 30 nm, after the etchings (f), Co = 40 (g), Co = 40, after the etchings (h), the scale bar represents 50 μm; Figure S4: Optical microscopy photos of the sample annealed at 500 °C temperature before (a) and after the etching (b); optical microscopy photos of the sample annealed at 550 °C temperature before (c) and after the etching (d); optical microscopy photos of the sample annealed at 600 °C temperature before (e) and after the etching (f); optical microscopy photos of the sample annealed at 700 °C temperature before (g) and after the etching (h), the scale bar represents 50 μm; Figure S5: Microscopic analysis of the surface of the graphene layer grown in a single-step process, thickness of Co 25 nm, carbon layer growth temperature 700 °C, Energy 800 eV, time 15 min: AFM 2 D images and histograms (measured befor etching by H2 plasma and HNO3) topography (a), phase (b) and (measured after etching by H2 plasma and HNO3) topography (c), phase (d); Figure S6: Microscopic analysis of the surface of the graphene layer grown in a two-step process, thickness of Co 25 nm, carbon layer growth temperature 400 °C, Annealing temperature 700 °C, Energy 800 eV, time 15 min: AFM 2 D images and histograms (measured befor etching by H2 plasma and HNO3) topography (a), phase (b) and (measured after etching by H2 plasma and HNO3) topography (c), phase (d); Figure S7: Microscopic analysis of the surface of the graphene layer grown in a two-step process, thickness of Co 10 nm, carbon layer growth temperature 400 °C, Annealing temperature 700 °C, Energy 800 eV, time 15 min: AFM 2 D images and histograms (measured befor etching by H2 plasma and HNO3) topography (a), phase (b) and (measured after etching by H2 plasma and HNO3) topography (c), phase (d); Figure S8: Microscopic analysis of the surface of the graphene layer grown in a two-step process, thickness of Co 40 nm, carbon layer growth temperature 400 °C, Annealing temperature 700 °C, Energy 800 eV, time 15 min: AFM 2 D images and histograms (measured befor etching by H2 plasma and HNO3) topography (a), phase (b) and (measured after etching by H2 plasma and HNO3) topography (c), phase (d); Figure S9: Microscopic analysis of the surface of the graphene layer grown in a two-step process, thickness of Co 25 nm, carbon layer growth temperature 400 °C, Annealing temperature 600 °C, Energy 800 eV, time 15 min: AFM 2 D images and histograms (measured befor etching by H2 plasma and HNO3) topography (a), phase (b) and (measured after etching by H2 plasma and HNO3) topography (c), phase (d); Figure S10: SEM image of the surface of the graphene layer grown in a single-step process, thickness of Co 25 nm, carbon layer growth temperature 700 °C, ion beam energy 800 eV, time 15 min; Figure S11: High-magnification SEM image of the graphene synthesized using a two-step process, measured after the etching of the cobalt film. The thickness of the Co layer was 25 nm, ion beam treatment temperature—400 °C, annealing temperature 700 °C, ion beam energy—800 eV, ion beam treatment time—15 min; Table S1: Raman scattering spectra parameters (ID/IG and I2D/IG) and their dispersion within the each sample (Δ(ID/IG) and Δ(I2D/IG)); Table S2: Graphene layer number evaluation using the I2D/IG ratio (the estimation was done for graphene synthesized on Si(100).

Author Contributions

Conceptualization, Š.M.; methodology, Š.M.; validation, G.B., V.K. and Š.M.; investigation, G.B., V.K., A.G., A.V. and M.A.; writing—original draft preparation, G.B., A.G., M.A. and Š.M.; writing—review and editing, Š.M.; visualization, G.B., A.G., M.A. and Š.M.; supervision, Š.M.; project administration, Š.M.; funding acquisition, Š.M. All authors have read and agreed to the published version of the manuscript.

Funding

This research was funded by the European Social Fund measure “Strengthening the Skills and Capacities of Public Sector Researchers for Engaging in High Level R&D Activities” administered by the Research Council of Lithuania. The research project No. 09.3.3-LMT-K-712-01-0183.

Acknowledgments

The authors acknowledge other participants of the research project No. 09.3.3-LMT-K-712-01-0183—R. Gudaitis, A. Lazauskas, K. Šlapikas, V. Stankus, D. Peckus, E. Rajackaitė, T. Tamulevičius, A. Jurkevičiūtė, Š. Jankauskas, and F. Kalyk. The authors acknowledge A. Selskis (Center for Physical Sciences and Technology, Vilnius, Lithuania) for scanning electron microscopy measurements. The authors acknowledge the Center for Physical Sciences and Technology (Vilnius, Lithuania) for the possibility of using their scanning electron microscope facilities.

Conflicts of Interest

The authors declare no conflict of interest.

References

  1. Dhinakaran, V.; Lavanya, M.; Vigneswari, K.; Ravichandran, M.; Vijayakumar, M.D. Review on exploration of graphene in diverse applications and its future horizon. Mater. Today Proc. 2020, 27, 824–828. [Google Scholar] [CrossRef]
  2. Tiwari, S.K.; Sahoo, S.; Wang, N.; Huczko, A. Graphene research and their outputs: Status and prospect. J. Sci. Adv. Mater. Devices 2020, 5, 10–29. [Google Scholar] [CrossRef]
  3. Losurdo, M.; Giangregorio, M.M.; Capezzuto, P.; Bruno, G. Graphene CVD growth on copper and nickel: Role of hydrogen in kinetics and structure. Phys. Chem. Chem. Phys. 2011, 13, 20836–20843. [Google Scholar] [CrossRef]
  4. Zou, Z.; Carnevali, V.; Patera, L.L.; Jugovac, M.; Cepek, C.; Peressi, M.; Comelli, G.; Africh, C. Operando atomic-scale study of graphene CVD growth at steps of polycrystalline nickel. Carbon 2020, 161, 528–534. [Google Scholar] [CrossRef] [Green Version]
  5. Yang, X.; Zhang, G.; Prakash, J.; Chen, Z.; Gauthier, M.; Sun, S. Chemical vapour deposition of graphene: Layer control, the transfer process, characterisation, and related applications. Int. Rev. Phys. Chem. 2019, 38, 149–199. [Google Scholar] [CrossRef]
  6. Narula, U.; Tan, C.M.; Lai, C.S. Growth mechanism for low temperature PVD graphene synthesis on copper using amorphous carbon. Sci. Rep. 2017, 7, 44112. [Google Scholar] [CrossRef] [Green Version]
  7. Sato, M.; Takahashi, M.; Nakano, H.; Muro, T.; Takakuwa, Y.; Sato, S.; Nihei, M.; Yokoyama, N. High-current reliability and growth conditions of multilayer graphene wire obtained by annealing sputtered amorphous carbon. Jpn. J. Appl. Phys. 2013, 52, 04CB07. [Google Scholar] [CrossRef]
  8. Dharmaraj, P.; Venkatesh, P.S.; Kumar, P.; Asokan, K.; Jeganathan, K. Direct growth of few layer graphene on SiO2 substrate by low energy carbon ion implantation. RSC Adv. 2016, 6, 101347–101352. [Google Scholar] [CrossRef]
  9. Ueno, K.; Sano, S.; Matsumoto, Y. Direct deposition of multilayer graphene on dielectrics via solid-phase precipitation from carbon-doped cobalt with a copper capping layer. Jpn. J. Appl. Phys. 2019, 58, 026501. [Google Scholar] [CrossRef]
  10. Murata, H.; Toko, K.; Saitoh, N.; Yoshizawa, N.; Suemasu, T. Direct synthesis of multilayer graphene on an insulator by Ni-induced layer exchange growth of amorphous carbon. Appl. Phys. Lett. 2017, 110, 033108. [Google Scholar] [CrossRef]
  11. Murata, H.; Saitoh, N.; Yoshizawa, N.; Suemasu, T.; Toko, K. High-quality multilayer graphene on an insulator formed by diffusion controlled Ni-induced layer exchange. Appl. Phys. Lett. 2017, 111, 243104. [Google Scholar] [CrossRef]
  12. Bachmatiuk, A.; Boeckl, J.; Smith, H.; Ibrahim, I.; Gemming, T.; Oswald, S.; Kazmierczak, W.; Makarov, D.; Schmidt, O.G.; Eckert, J.; et al. Vertical graphene growth from amorphous carbon films using oxidizing gases. J. Phys. Chem. C 2015, 119, 17965–17970. [Google Scholar] [CrossRef]
  13. Ueda, Y.; Maruyama, T.; Naritsuka, S. Direct growth of multilayer graphene by precipitation using W capping layer Jumpei Yamada1. Jpn. J. Appl. Phys. 2016, 55, 100302. [Google Scholar] [CrossRef]
  14. Narula, U.; Tan, C.M. Engineering a PVD-based graphene synthesis method. IEEE Trans. Nanotechnol. 2017, 16, 784–789. [Google Scholar] [CrossRef]
  15. Kim, J.; Kim, J.; Lee, G. Wafer-scale synthesis of multi-layer graphene by high-temperature carbon ion implantation. Appl. Phys. Lett. 2015, 107, 033104. [Google Scholar] [CrossRef]
  16. Chen, D.; Guo, Q.; Yang, S.; Liu, Z.; Zheng, X.; Zhang, N.; Xu, A.; Wang, B.; Wang, G.; Ding, G. Interfacial monolayer graphene growth on arbitrary substrate by nickel-assisted ion implantation. J. Mater. Sci. 2018, 53, 2631–2637. [Google Scholar] [CrossRef]
  17. Garaj, S.; Hubbard, W.; Golovchenko, J.A. Graphene synthesis by ion implantation. Appl. Phys. Lett. 2010, 97, 2–4. [Google Scholar] [CrossRef] [Green Version]
  18. Guo, L.; Zhang, Z.; Sun, H.; Dai, D.; Cui, J.; Li, M.; Xu, Y.; Xu, M.; Du, Y.; Jiang, N.; et al. Direct formation of wafer-scale single-layer graphene films on the rough surface substrate by PECVD. Carbon 2018, 129, 456–461. [Google Scholar] [CrossRef]
  19. Murata, H.; Toko, K.; Suemasu, T. Multilayer graphene on insulator formed by Co-induced layer exchange. Jpn. J. Appl. Phys. 2017, 56, 05DE03. [Google Scholar] [CrossRef] [Green Version]
  20. Saenger, K.L.; Tsang, J.C.; Bol, A.A.; Chu, J.O.; Grill, A.; Lavoie, C. In situ X-ray diffraction study of graphitic carbon formed during heating and cooling of amorphous-C/Ni bilayers. Appl. Phys. Lett. 2010, 96, 153105. [Google Scholar] [CrossRef] [Green Version]
  21. Chen, S.; Xiong, W.; Zhou, Y.S.; Lu, Y.F.; Zeng, X.C. An ab initio study of the nickel-catalyzed transformation of amorphous carbon into graphene in rapid thermal processing. Nanoscale 2016, 8, 9746–9755. [Google Scholar] [CrossRef] [PubMed] [Green Version]
  22. Li, H.; Shi, D.; Guo, P.; Wei, J.; Cui, P.; Du, S.; Wang, A. Amorphous carbon to graphene: Carbon diffusion via nickel catalyst. Mater. Lett. 2020, 278, 128468. [Google Scholar] [CrossRef]
  23. Anders, A. Plasma and ion sources in large area coating: A review. Surf Coat. Technol. 2005, 200, 1893–1906. [Google Scholar] [CrossRef]
  24. Davis, C.A.; Amaratunga, G.A.J.; Knowles, K.M. Growth mechanism and cross-sectional structure of tetrahedral amorphous carbon thin films. Phys. Rev. Lett. 1998, 80, 13–16. [Google Scholar] [CrossRef]
  25. Zhurin, V.V.; Kaufman, H.R.; Robinson, R.S. Physics of closed drift thrusters. Plasma Sources Sci. Technol. 1999, 8, R1–R20. [Google Scholar] [CrossRef]
  26. Hwang, J.-S.; Lin, Y.-H.; Hwang, J.-Y.; Chang, R.; Chattopadhyay, S.; Chen, C.-J.; Chen, P.; Chiang, H.-P.; Tsai, T.-R.; Chen, L.-C. Imaging layer number and stacking order through formulating Raman fingerprints obtained from hexagonal single crystals of few layer graphene. Nanotechnology 2012, 24, 015702. [Google Scholar] [CrossRef]
  27. Eckmann, A.; Felten, A.; Mischenko, A.; Britnell, L.; Krupke, R.; Novoselov, K.S.; Casiraghi, C. Probing the nature of defects in graphene by Raman spectroscopy. Nano Lett. 2012, 12, 3925–3930. [Google Scholar] [CrossRef] [Green Version]
  28. Merlen, A.; Buijnsters, J.; Pardanaud, C. A guide to and review of the use of multiwavelength raman spectroscopy for characterizing defective aromatic carbon solids: From graphene to amorphous carbons. Coatings 2017, 7, 153. [Google Scholar] [CrossRef]
  29. Thompson, C.V. Solid-state dewetting of thin films. Annu. Rev. 2012, 42, 399–434. [Google Scholar] [CrossRef]
  30. Simrick, N.J.; Kilner, J.; Atkinson, A. Thermal stability of silver thin films on zirconia substrates. Thin Solid Film. 2012, 520, 2855–2867. [Google Scholar] [CrossRef]
  31. Zhao, Y.; Wang, K.; Yuan, S.; Li, G.; Ma, Y.; Wang, Q. Solid-state dewetting in polycrystalline co films on native oxide Si(100) by kirkendall effects. J. Phys. Chem. C 2019, 123, 19572–19578. [Google Scholar] [CrossRef]
  32. Dzhumaliev, A.S.; Nikulin, Y.V.; Filimonov, Y.A. Influence of annealing and argon pressure on the microcrystalline structure of magnetron-sputtered textured cobalt films. Tech. Phys. 2018, 6311, 1678–1686. [Google Scholar] [CrossRef]
  33. Jeong, K.; Lee, J.; Byun, I.; Seong, M.J.; Park, J.; Kim, H.W.; Kim, M.J.; Kim, J.H.; Lee, J. Synthesis of highly conductive cobalt thin films by, L.C.;VD at atmospheric pressure. Mater. Sci. Semicond. Process. 2017, 68, 245–251. [Google Scholar] [CrossRef]
  34. Kumar, D.; Gupta, A. Evolution of structural and magnetic properties of sputtered nanocrystalline Co thin films with thermal annealing. J. Magn. Magn. Mater. 2007, 308, 318–324. [Google Scholar] [CrossRef]
  35. Li, M.; Tian, Z.; Yu, X.; Yu, D.; Ren, L.; Fu, Y. Influence of thermal annealing on the morphology and magnetic domain structure of Co thin films. Mater. Res. Express. 2021, 8, 56103. [Google Scholar] [CrossRef]
  36. Janke, D.; Hulman, M.; Wenisch, R.; Gemming, S.; Rafaja, D.; Krause, M. Influence of nickel catalyst morphology on layer-exchange-based carbon crystallisation of Ni/a-C bilayers. Phys. Status Solidi 2017, 254, 1700234. [Google Scholar] [CrossRef]
  37. Chaitoglou, S.E. Effect of temperature on graphene grown by chemical vapor deposition. J. Mater. Sci. 2017, 52, 8348–8356. [Google Scholar] [CrossRef]
  38. Sato, M.; Inukai, M.; Ikenaga, E.; Muro, T.; Ogawa, S.; Takakuwa, Y.; Nakano, H.; Kawabata, A.; Nihei, M.; Yokoyama, N. Fabrication of graphene directly on SiO2 without transfer processes by annealing sputtered amorphous carbon. Jpn. J. Appl. Phys. 2012, 51, 04DB01. [Google Scholar] [CrossRef]
  39. Ramón, M.E.; Gupta, A.; Corbet, C.; Ferrer, D.A.; Movva, H.C.P.; Carpenter, G.; Colombo, L.; Bourianoff, G.; Doczy, M.; Akinwande, D.; et al. CMOS-compatible synthesis of large-area, high-mobility graphene by chemical vapor deposition of acetylene on cobalt thin films. ACS Nano 2011, 5, 7198–7204. [Google Scholar] [CrossRef]
  40. Pan, G.; Li, B.; Heath, M.; Horsell, D.; Wears, M.L.; Al Taan, L.; Awan, S. Transfer-free growth of graphene on SiO2 insulator substrate from sputtered carbon and nickel films. Carbon 2013, 65, 349–358. [Google Scholar] [CrossRef] [Green Version]
  41. Meškinis, Š.; Andrulevičius, M.; Šlapikas, K.; Iljinas, A.; Gudaitis, R.; Puišo, J.; Tamulevičius, S. Growth and properties of the ion beam deposited SiOx containing DLC films. Vacuum 2009, 83 (Suppl. 1), S121–S123. [Google Scholar] [CrossRef]
  42. Xu, W.; Lin, S.; Dai, M.; Shi, Q.; Wei, C.; Zhang, X.; Zhou, K. Effects of bias voltage on the microstructure and properties of Al-doped hydrogenated amorphous carbon films synthesized by a hybrid deposition technique. Vacuum 2018, 154, 159–166. [Google Scholar] [CrossRef]
  43. Lin, L.; Zhang, J.; Su, H.; Li, J.; Sun, L.; Wang, Z.; Xu, F.; Liu, C.; Lopatin, S.; Zhu, Y.; et al. Towards super-clean graphene. Nat. Commun. 2019, 10, 1–7. [Google Scholar] [CrossRef] [PubMed]
  44. Jia, K.; Zhang, J.; Lin, L.; Li, Z.; Gao, J.; Sun, L.; Xue, R.; Li, J.; Kang, N.; Luo, Z.; et al. Copper-containing carbon feedstock for growing superclean graphene. J. Am. Chem. Soc. 2019, 141, 7670–7674. [Google Scholar] [CrossRef]
  45. Venezuela, P.; Lazzeri, M.; Mauri, F. Theory of double-resonant Raman spectra in graphene: Intensity and line shape of defect-induced and two-phonon bands. Phys. Rev. B Condens Mater. Mater. Phys. 2011, 84, 035433. [Google Scholar] [CrossRef] [Green Version]
  46. Kim, Y.S.; Joo, K.; Jerng, S.K.; Lee, J.H.; Yoon, E.; Chun, S.H. Direct growth of patterned graphene on SiO2 substrates without the use of catalysts or lithography. Nanoscale 2014, 6, 10100–10105. [Google Scholar] [CrossRef]
  47. Chen, C.Y.; Dai, D.; Chen, G.; Yu, J.H.; Nishimura, K.; Lin, C.T.; Jiang, N.; Zhan, Z.L. Rapid growth of single-layer graphene on the insulating substrates by thermal CVD. Appl. Surf. Sci. 2015, 346, 41–45. [Google Scholar] [CrossRef]
  48. Kozłowski, W.; Balcerski, J.; Kowalczyk, P.J.; Kowalczyk, P.J.; Cichomski, M.; Szmaja, W. Investigation of thermally evaporated nanocrystalline thin cobalt films. Appl. Phys. A 2017, 123, 1–8. [Google Scholar] [CrossRef] [Green Version]
  49. Nast, O.; Hartmann, A.J. Influence of interface and Al structure on layer exchange during aluminum-induced crystallization of amorphous silicon. J. Appl. Phys. 2000, 88, 716. [Google Scholar] [CrossRef]
  50. Peng, K.J.; Wu, C.L.; Lin, Y.H.; Liu, Y.J.; Tsai, D.P.; Pai, Y.H.; Lin, G.R. Hydrogen-free P.ECVD growth of few-layer graphene on an ultra-thin nickel film at the threshold dissolution temperature. J. Mater. Chem. C 2013, 1, 3862–3870. [Google Scholar] [CrossRef]
  51. Tallant, D.R.; Friedmann, T.A.; Missert, N.A.; Siegal, M.P.; Sullivan, J.P. Raman spectroscopy of amorphous carbon. Mater. Res. Soc. Symp. Proc. 1997, 498, 37–48. [Google Scholar] [CrossRef] [Green Version]
  52. Viana, G.A.; Marques, F.C. Raman and thermal desorption spectroscopy analyses of amorphous graphite-like carbon films with incorporated xenon. Vacuum 2015, 112, 17–24. [Google Scholar] [CrossRef]
  53. Schuepfer, D.B.; Badaczewski, F.; Guerra-Castro, J.M.; Hofmann, D.M.; Heiliger, C.; Smarsly, B.; Klar, P.J. Assessing the structural properties of graphitic and non-graphitic carbons by Raman spectroscopy. Carbon 2020, 161, 359–372. [Google Scholar] [CrossRef]
  54. Tamura, T.; Ueno, K. Low-Temperature synthesis of multilayer graphene directly on SiO2 by current-enhanced solid-phase deposition using Ni catalyst. Jpn. J. Appl. Phys. 2020, 59, 066501. [Google Scholar] [CrossRef]
  55. Zheng, M.; Takei, K.; Hsia, B.; Fang, H.; Zhang, X.; Ferralis, N.; Ko, H.; Chueh, Y.L.; Zhang, Y.; Maboudian, R.; et al. Metal-catalyzed crystallization of amorphous carbon to graphene. Appl. Phys. Lett. 2010, 96, 063110. [Google Scholar] [CrossRef]
  56. Dai, C.Y.; Wang, W.C.; Tseng, C.A.; Ding, F.C.; Chen, Y.T.; Chen, C.C. spatial confinement approach using ni to modulate local carbon supply for the growth of uniform transfer-free graphene monolayers. J. Phys. Chem. C 2020, 124, 23094–23105. [Google Scholar] [CrossRef]
  57. Komissarov, I.V.; Kovalchuk, N.G.; Labunov, V.A.; Girel, K.V.; Korolik, O.V.; Tivanov, M.S.; Lazauskas, A.; Andrulevičius, M.; Tamulevičius, T.; Grigaliūnas, V.; et al. Nitrogen-doped twisted graphene grown on copper by atmospheric pressure CVD from a decane precursor. Beilstein J. Nanotechnol. 2017, 8, 145–158. [Google Scholar] [CrossRef] [Green Version]
  58. Parambath Vinayan, B.; Diemant, T.; Lin, X.-M.; Cambaz, M.A.; Golla-Schindler, U.; Kaiser, U.; Jürgen Behm, R.; Fichtner, M. Nitrogen rich hierarchically organized porous carbon/sulfur composite cathode electrode for high performance Li/S battery: A Mechanistic Investigation by operando spectroscopic studies. Adv. Mater. Interfaces 2016, 3, 1600372. [Google Scholar] [CrossRef] [Green Version]
  59. Egiza, M.; Naragino, H.; Tominaga, A.; Hanada, K.; Kamitani, K.; Sugiyama, T.; Ikenaga, E.; Murasawa, K.; Gonda, H.; Sakurai, M.; et al. Effects of air exposure on hard and soft X-ray photoemission spectra of ultrananocrystalline diamond/amorphous carbon composite films. Coatings 2018, 8, 359. [Google Scholar] [CrossRef] [Green Version]
  60. Egiza, M.; Murasawa, K.; Ali, A.M.; Fukui, Y.; Gonda, H.; Sakurai, M.; Yoshitake, T. Enhanced hardness of nanocarbon films deposited on cemented tungsten carbide substrates by coaxial arc plasma deposition owing to employing silicon-doped graphite targets. Jpn. J. Appl. Phys. 2019, 58, 075507. [Google Scholar] [CrossRef]
  61. Rajackaitė, E.; Peckus, D.; Gudaitis, R.; Andrulevičius, M.; Tamulevičius, T.; Volyniuk, D.; Meškinis, Š.; Tamulevičius, S. Transient absorption spectroscopy as a promising optical tool for the quality evaluation of graphene layers deposited by microwave plasma. Surf. Coat. Technol. 2020, 395, 125887. [Google Scholar] [CrossRef]
  62. Wang, L.; Wang, Y.; Li, A.; Yang, Y.; Tang, Q.; Cao, H.; Qi, T.; Li, C. Electrocatalysis of carbon black- or poly(diallyldimethylammonium chloride)-functionalized activated carbon nanotubes-supported Pd-Tb towards methanol oxidation in alkaline media. J. Power Sources 2014, 257, 138–146. [Google Scholar] [CrossRef]
  63. NIST X-ray Photoelectron Spectroscopy Database, NIST Standard Reference Database Number 20, National Institute of Standards and Technology, Gaithersburg MD. 2000; p. 20899. Available online: https://srdata.nist.gov/xps/citation.aspx (accessed on 13 December 2021).
Figure 1. The diagram of a direct cobalt-assisted single-step ion beam synthesis.
Processes 10 00272 g001
Figure 2. The diagram of a direct cobalt-assisted two-step ion beam synthesis.
Processes 10 00272 g002
Figure 3. The synthesis temperature effects on the structure of graphene, grown by direct cobalt-assisted single step ion beam synthesis: the Raman spectra after synthesis (a) and after removing the sacrificial cobalt interlayer (b); Raman spectra parameters analyzed: I2D/IG (c); ID/IG (d); ID/ID’ (e); FWHM(G) (f). The Co layer was 25 nm thick, ion beam energy—800 eV, ion beam treatment time—15 min.
Processes 10 00272 g003
Figure 4. The hydrocarbon ion-beam energy effects on the structure of graphene: the Raman spectra after synthesis (a) and after removing the sacrificial cobalt interlayer (b); Raman spectra parameters analyzed: I2D/IG (c); ID/IG (d); ID/ID’ (e); FWHM(G) (f). The Co layer was 25 nm thick, synthesis temperature—700 °C, ion beam treatment time—15 min.
Processes 10 00272 g004
Figure 5. The Co sacrificial layer thickness effects on the structure of graphene grown by a single-step synthesis: the Raman spectra after the synthesis (a) and after removing the sacrificial cobalt interlayer (b); Raman spectra parameters analyzed: I2D/IG (c); ID/IG (d); ID/ID’ (e); FWHM(G) (f). The synthesis temperature was 700 °C, ion beam energy—800 eV, ion beam treatment time—15 min.
Processes 10 00272 g005
Figure 6. The Co sacrificial layer thickness effects on the structure of graphene grown by a two-step synthesis: the Raman spectra after the synthesis (a) and after removing the sacrificial cobalt interlayer (b); Raman spectra parameters analyzed: I2D/IG (c); ID/IG (d); ID/ID’ (e); FWHM(G) (f). The synthesis time was 15 min., ion beam treatment temperature—400 °C, annealing temperature—700 °C, ion beam energy—800 eV.
Processes 10 00272 g006
Figure 7. The annealing temperature effects on the structure of graphene grown by a two-step synthesis: the Raman spectra after the synthesis (a) and after removing the sacrificial cobalt interlayer (b); Raman spectra parameters analyzed: I2D/IG (c); ID/IG (d); ID/ID’ (e); FWHM(G) (f).
Processes 10 00272 g007
Figure 8. The comparison of the structure of graphene grown by a single step and a two-step synthesis: the Raman spectra after the synthesis (a,c) and after removing the sacrificial cobalt interlayer (b,d); Raman spectra parameters analyzed: I2D/IG (e); ID/IG (f); ID/ID’ (g); FWHM(G) (h); optical microscopy photos of the sample annealed at 500 °C temperature before (g) and after the etching (h). Co layer thickness was 25 nm, ion beam energy—800 eV, ion-beam treatment time—15 min.
Processes 10 00272 g008
Figure 9. Microscopic analysis of the surface of the graphene layer grown in a single-step process (measured after etching of the Co film): (a) SEM image, (b) AFM phase imaging, (c) AFM 2D image and profilogram, (d) AFM phase imaging histogram. The thickness of the Co layer was 25 nm, synthesis temperature 700 °C, ion beam energy 800 eV, ion beam treatment time—15 min.
Processes 10 00272 g009
Figure 10. SEM (a) and AFM (b) images and profilograms (c,d) of the graphene synthesized using a two-step process, measured after the etching of the cobalt film. The thickness of the Co layer was 25 nm, ion beam treatment temperature—400 °C, annealing temperature—700 °C, ion beam energy—800 eV, ion beam treatment time—15 min.
Processes 10 00272 g010
Figure 11. The dependence of the graphene surface morphology on sacrificial Co layer thickness and annealing temperature. The surface morphology was measured before and after the removal of the sacrificial catalytic interlayer. The two-step growth process was used. The annealing temperature was 700 °C, ion beam energy—800 eV, hydrocarbon ion beam treatment time—15 min.
Processes 10 00272 g011
Figure 12. The deconvoluted high-resolution XPS spectra of the sample for carbon (a), oxygen (b), silicon (c). Circles—acquired spectra, thin black line—an envelope of fitted spectra, color thick lines—fitted peaks.
Processes 10 00272 g012
Table 1. Varied parameters of direct single and two-step graphene synthesis in the present study.
Sample No.Co, nmTemperature during the Ion Beam Irradiation, °CAnnealing Temperature, °CIon Beam Energy, eVt, min
125700-80015
225800-80015
325600-80015
425700-50015
525700-30015
810600-80015
955600-80015
1040600-80015
112540070080015
121040070080015
134040070080015
143040070080015
154040060080015
164040050080015
1740400-80015
184040055080015
Table 2. Results of atomic concentration calculations.
PeakAtomic Concentration (%)
O 1s36.71
C 1s42.77
Si 2p20.52
Publisher’s Note: MDPI stays neutral with regard to jurisdictional claims in published maps and institutional affiliations.