
Hydrodynamic Predictions of the Ultralight Particle Dispersions in a Bubbling Fluidized Bed


Abstract
:1. Introduction
2. Gas–Particle Two-Phase Flow Model with a Second-Order Moment
2.1. Continuity Equations of Gas and Particle
2.2. Conservation Momentum Equations of Gas and Particle
2.3. Momentum Transfer between Gas and Particle
2.4. Reynolds Stress Transport Equations of Gas and Particle Phases
2.5. Kinetic Friction-Stress Model of Particle Collisions
2.6. Numerical Scheme and Setting-Up
3. Result and Discussions
4. Conclusions
- ○
- In this work, the dispersion of non-spherical ultralight EG particles in a bubbling fluidized bed was modeled and simulated numerically using a particle kinetic–friction stress model involving a second-order moment two-phase turbulent model. The behaviors of particle porosity, particle and fluctuation velocity, granular temperature, and fast Fourier transforms were investigated and discussed. It was observed that the distinctive dispersion characteristics listed below are different from the conventional materials. They are as follows:
- ○
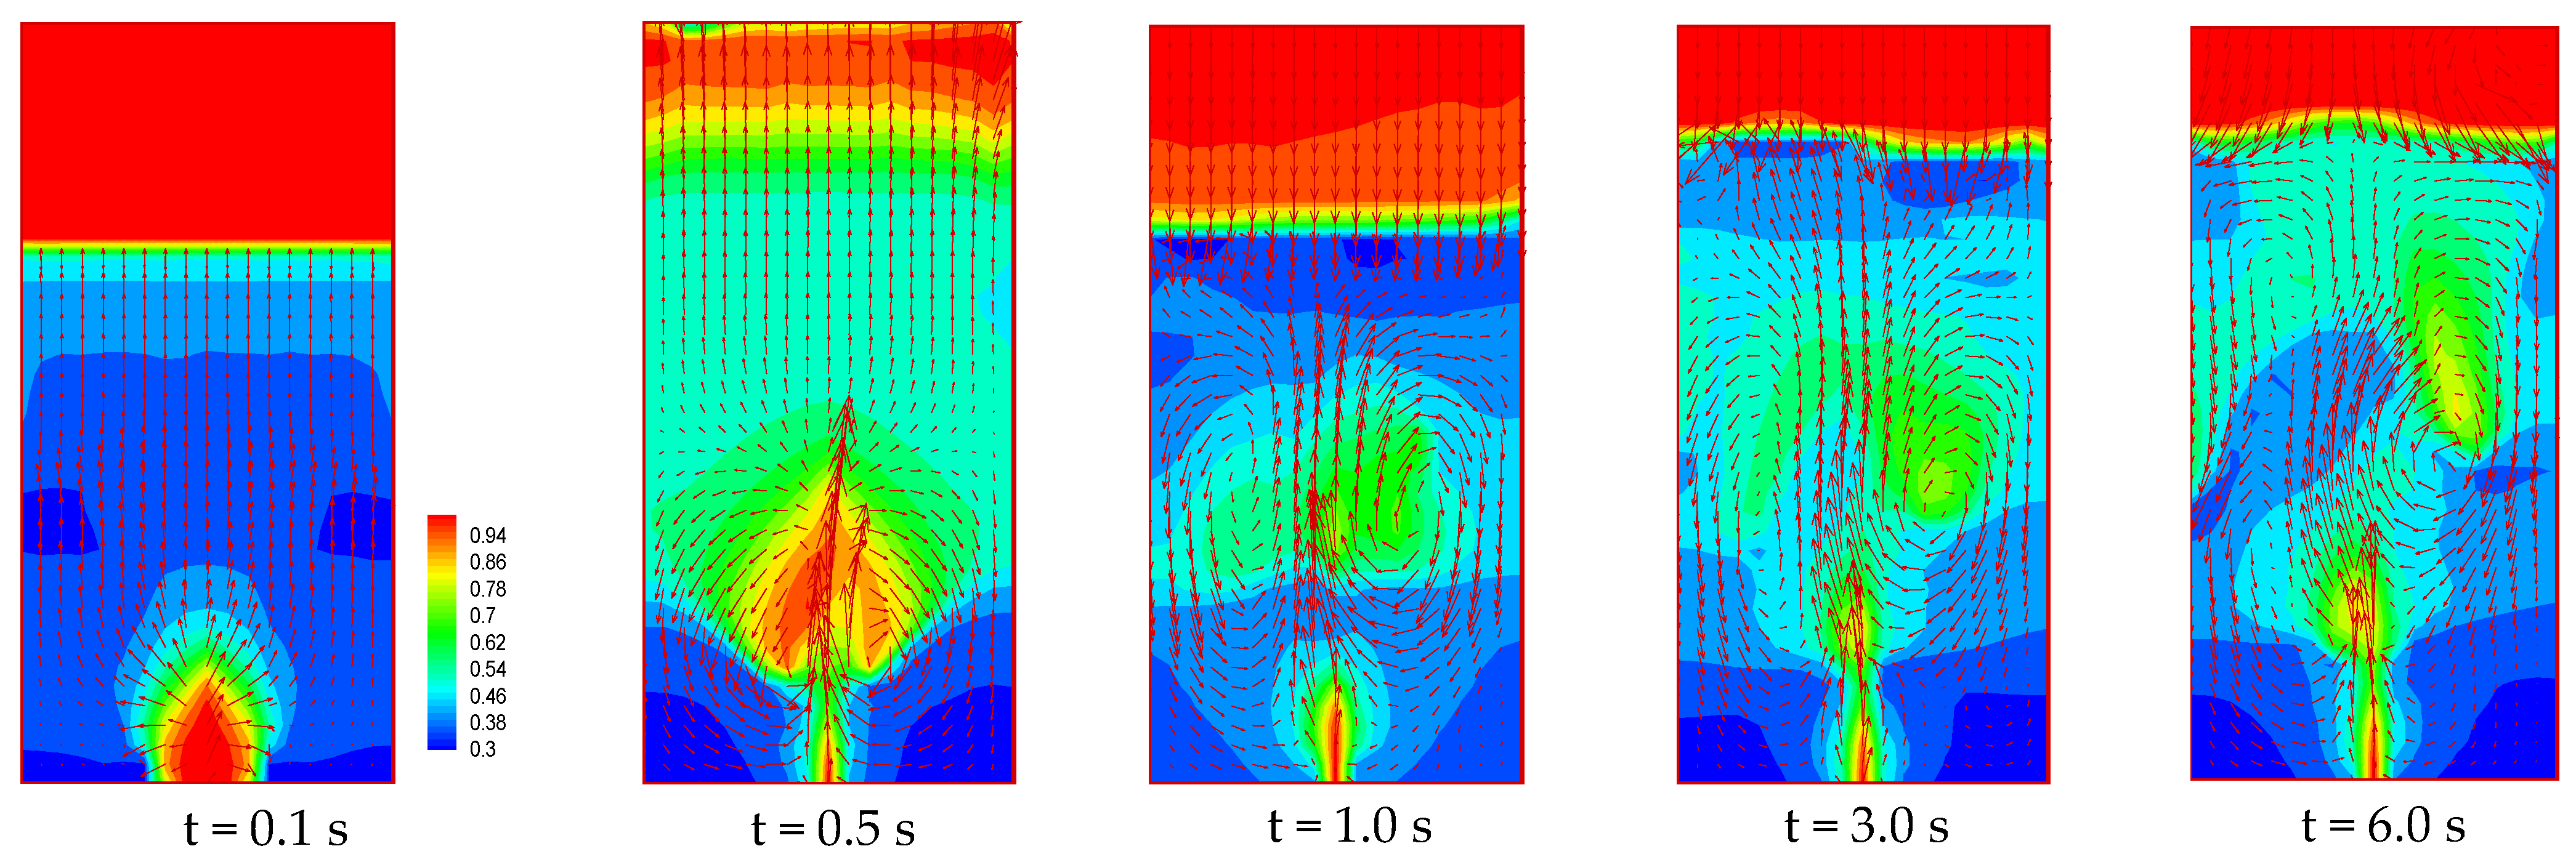
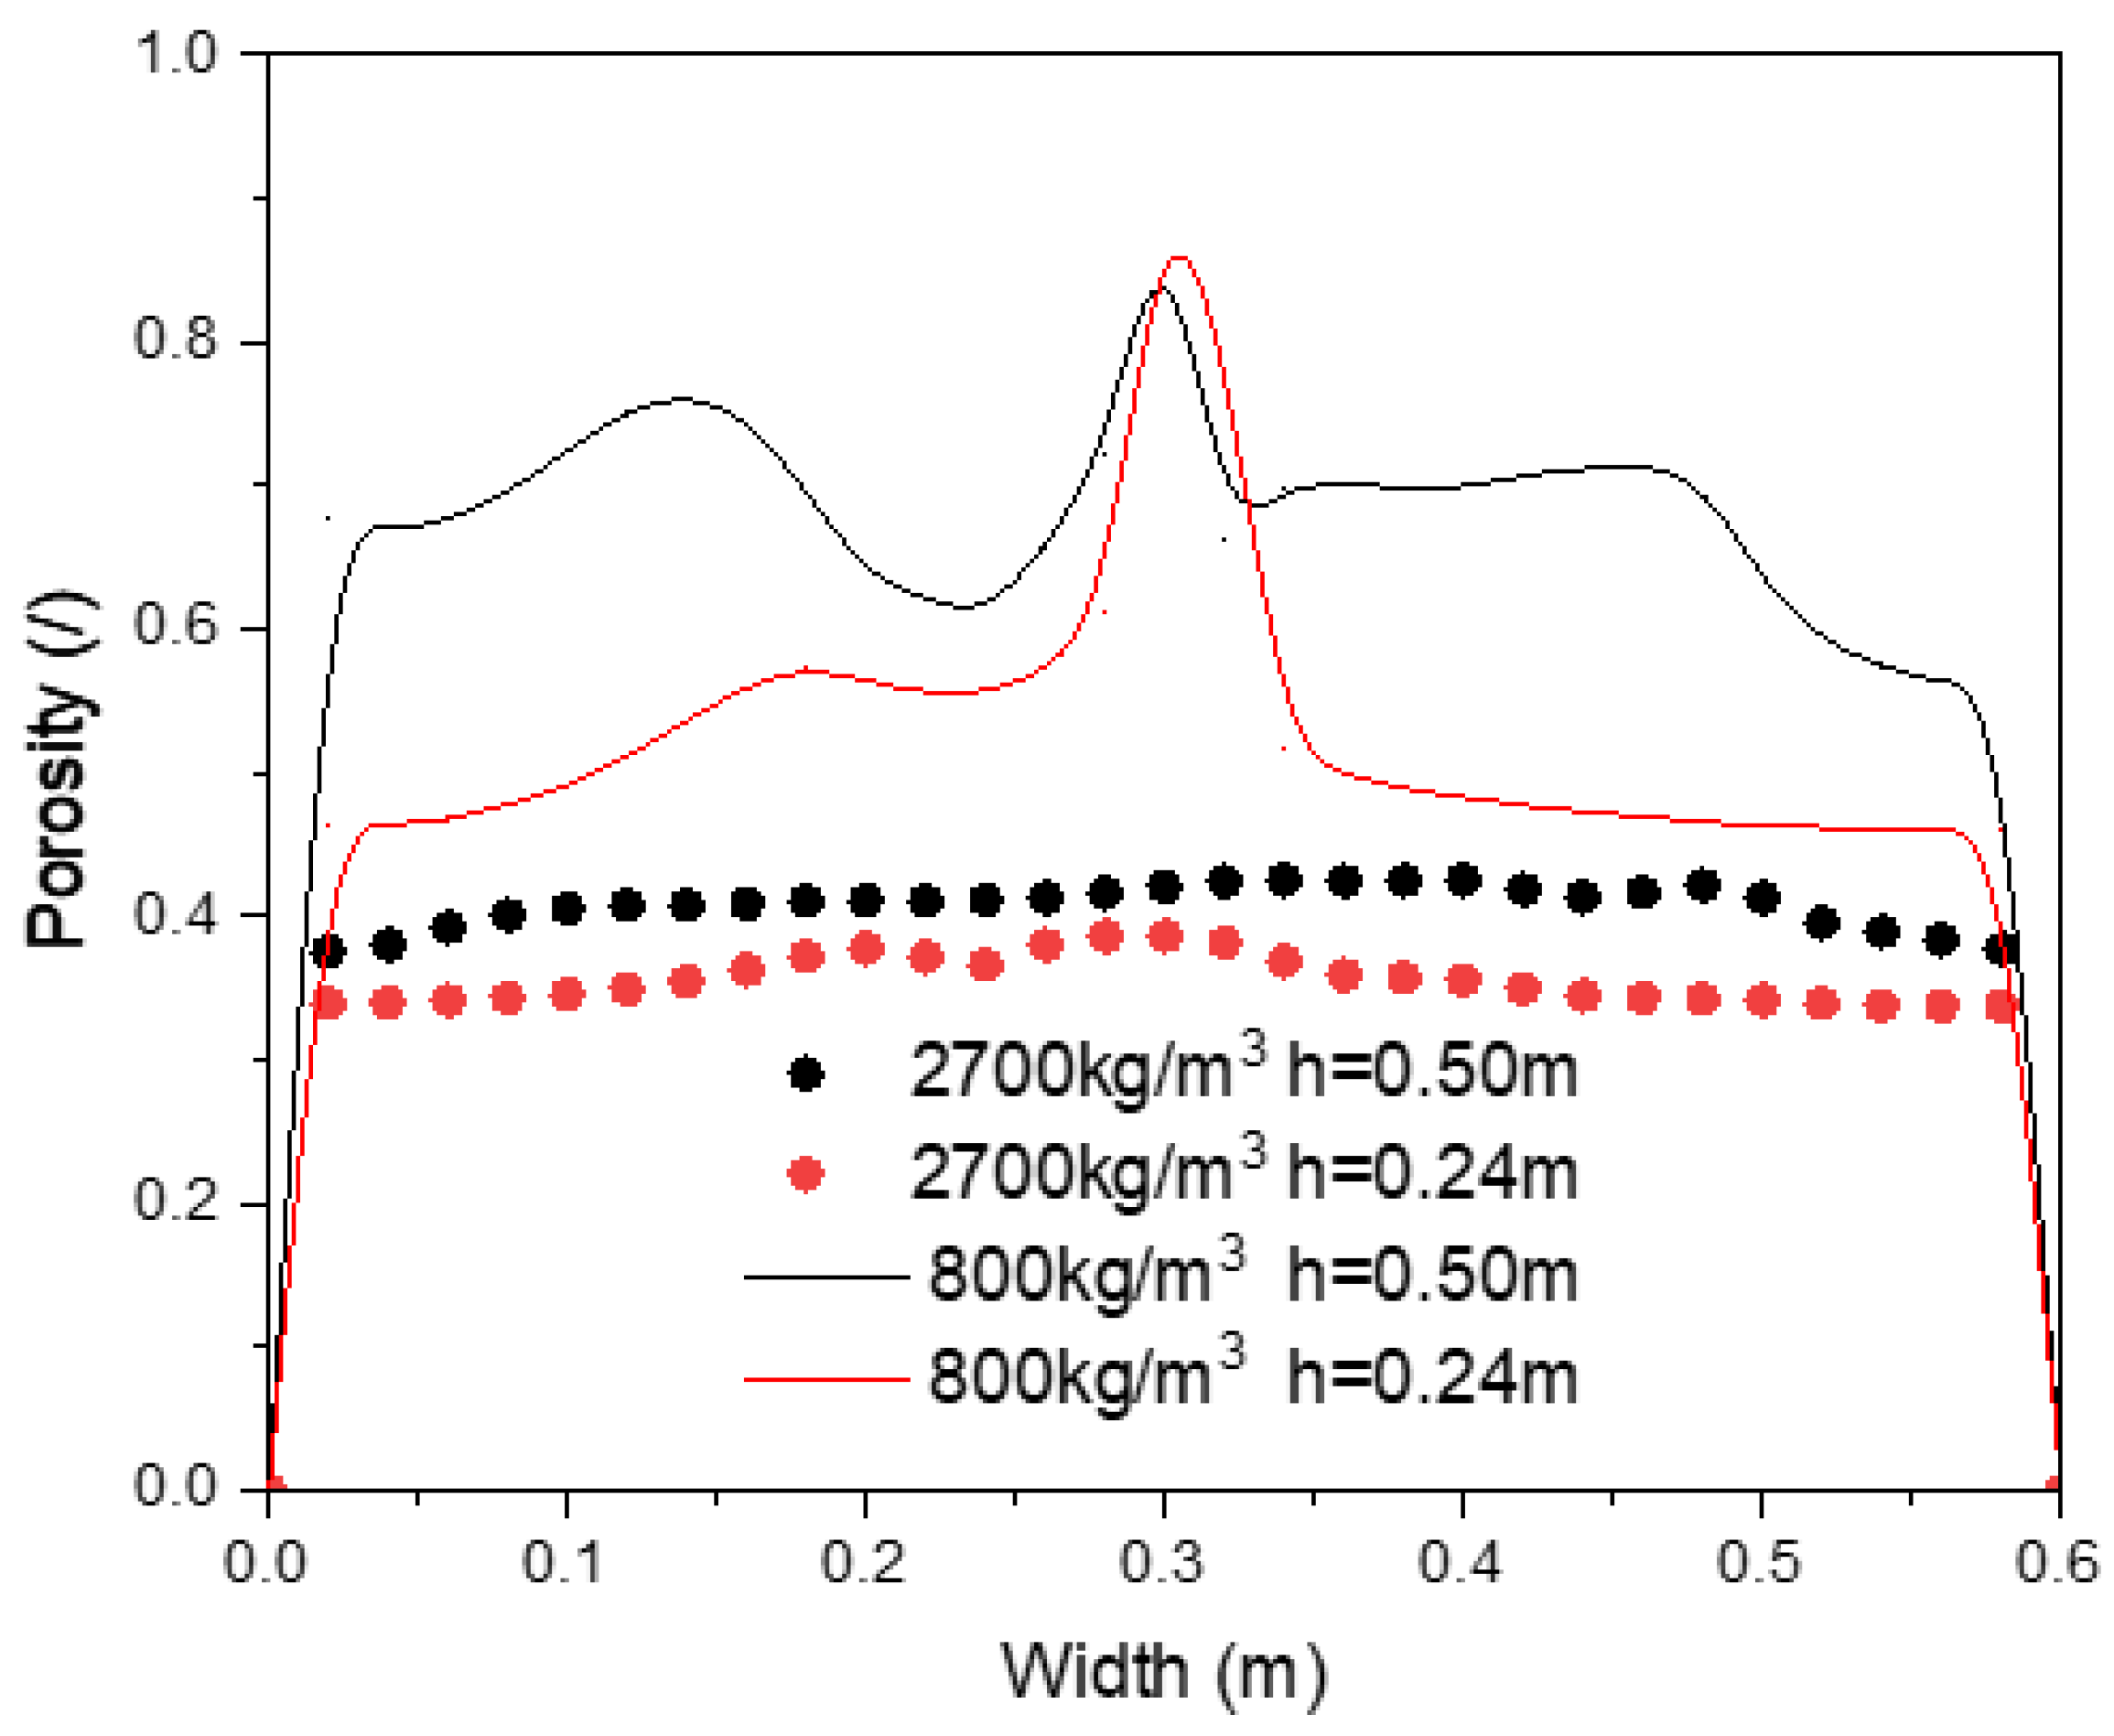
- Larger size bubbles remain in the fluid system rather than moving toward the top surface with eruptions, resulting in the highier voidages;
- ○
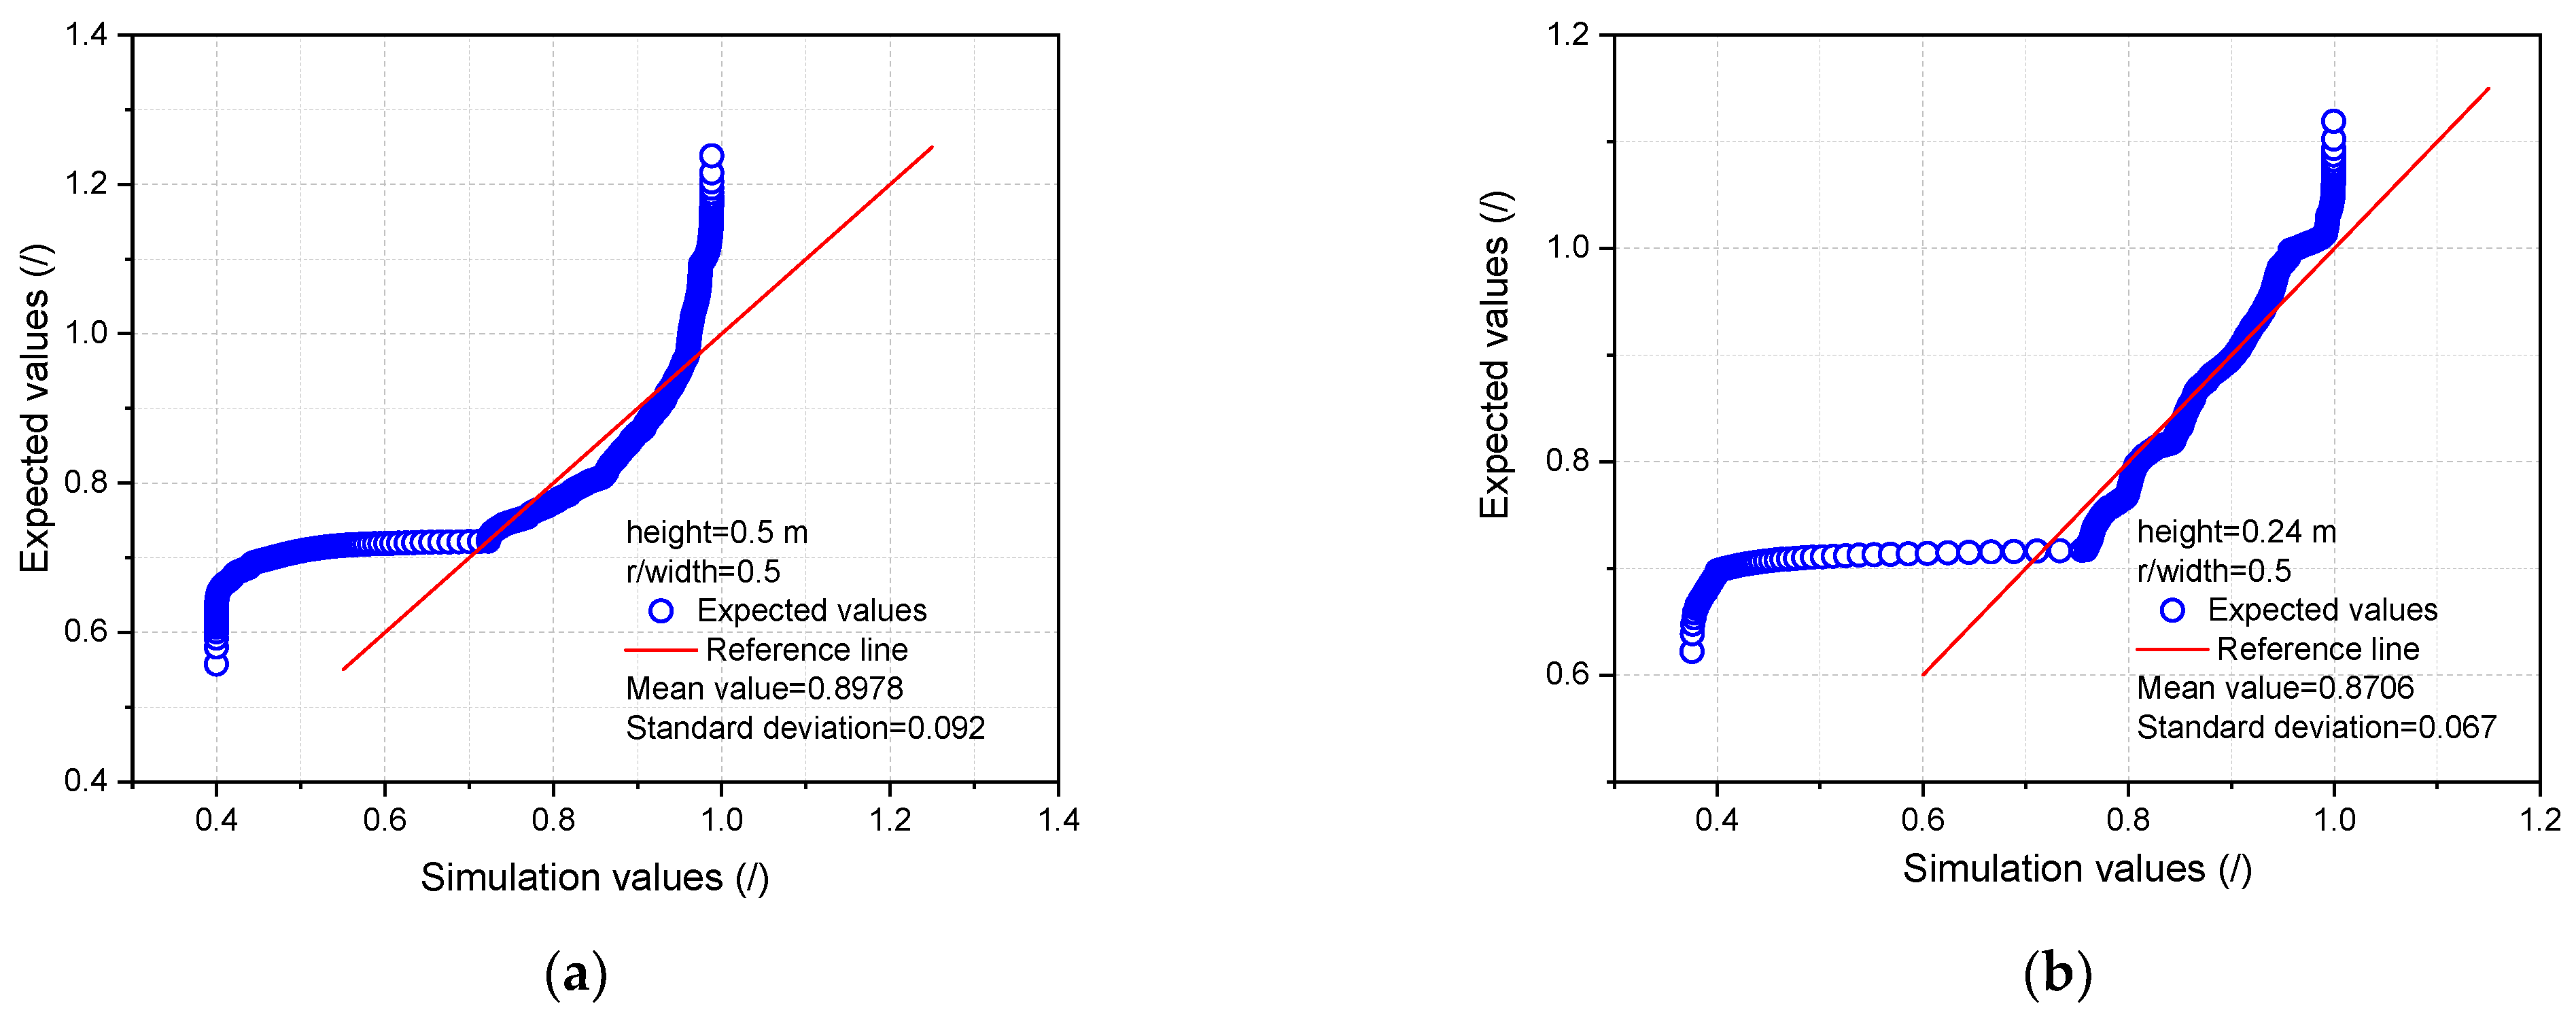
- At r/Width = 0.5 and heights of 0.5 m and 0.24 m, the mean values of axial particle velocity are almost equivalent, but they are approximately 4.0 times and 1.5 times larger than those of heavy particles, respectively;
- ○
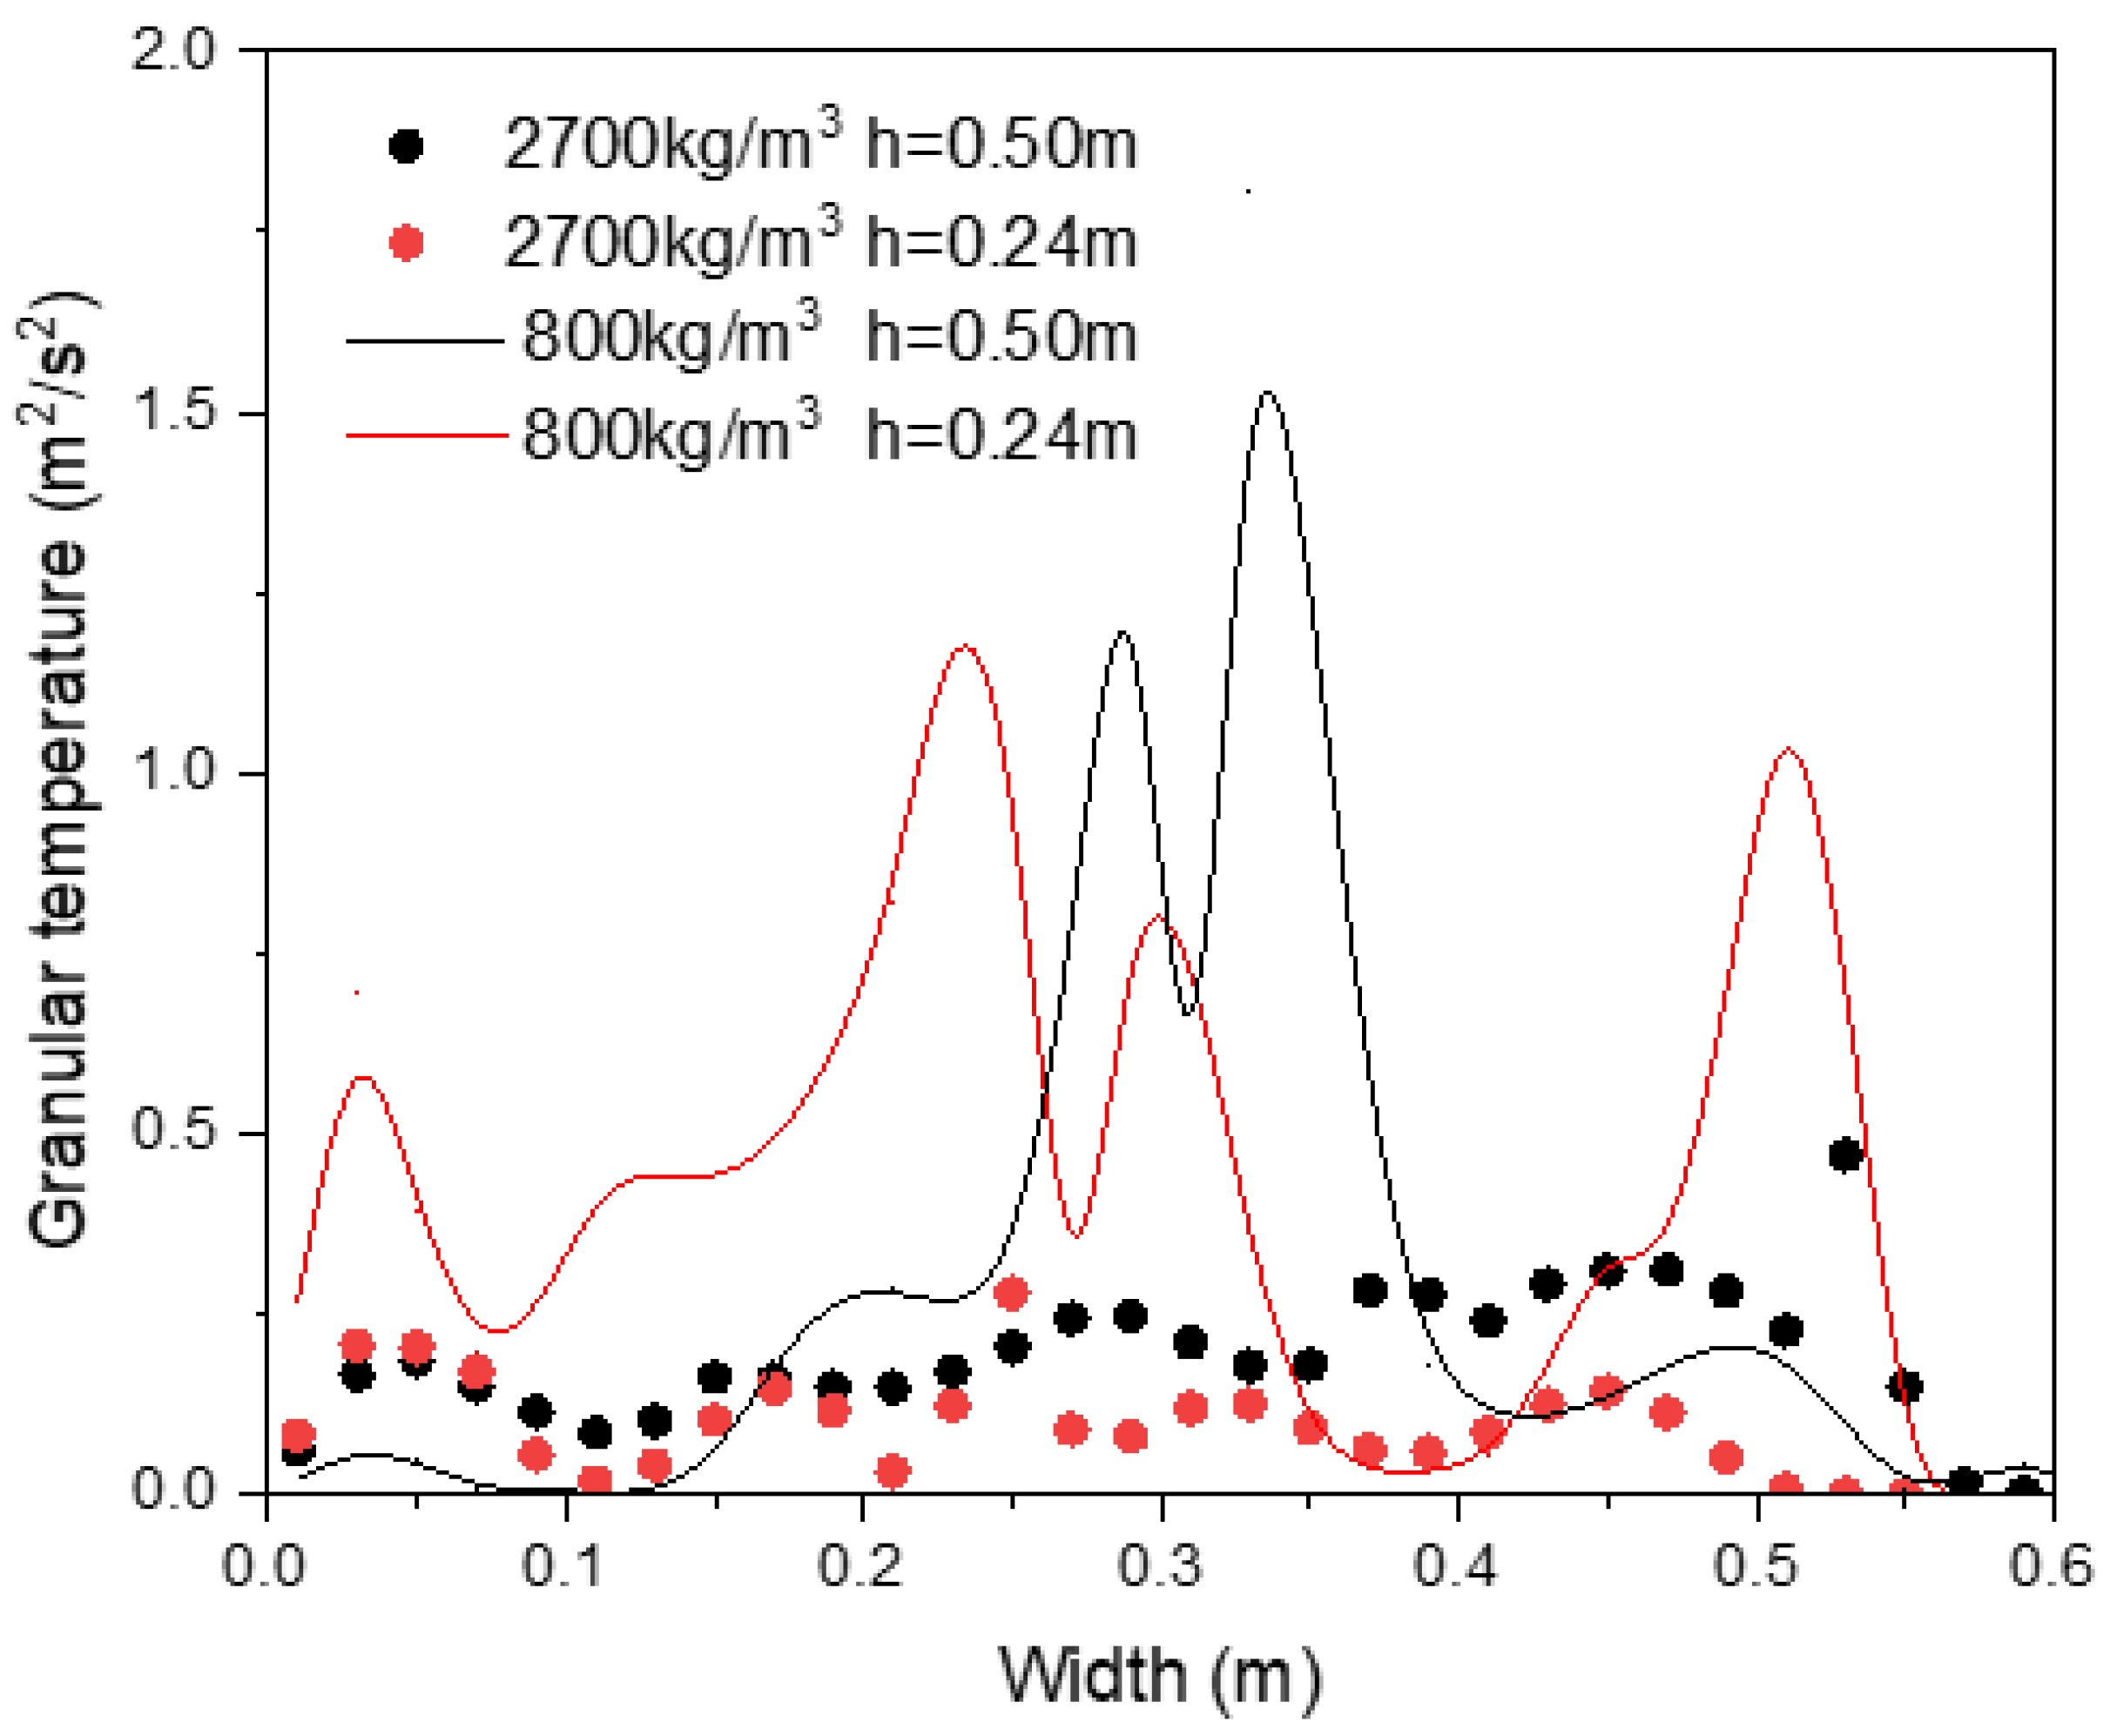
- Maximum granular temperature is approximately 3.0 times greater than its heavy particle counterpart;
- ○
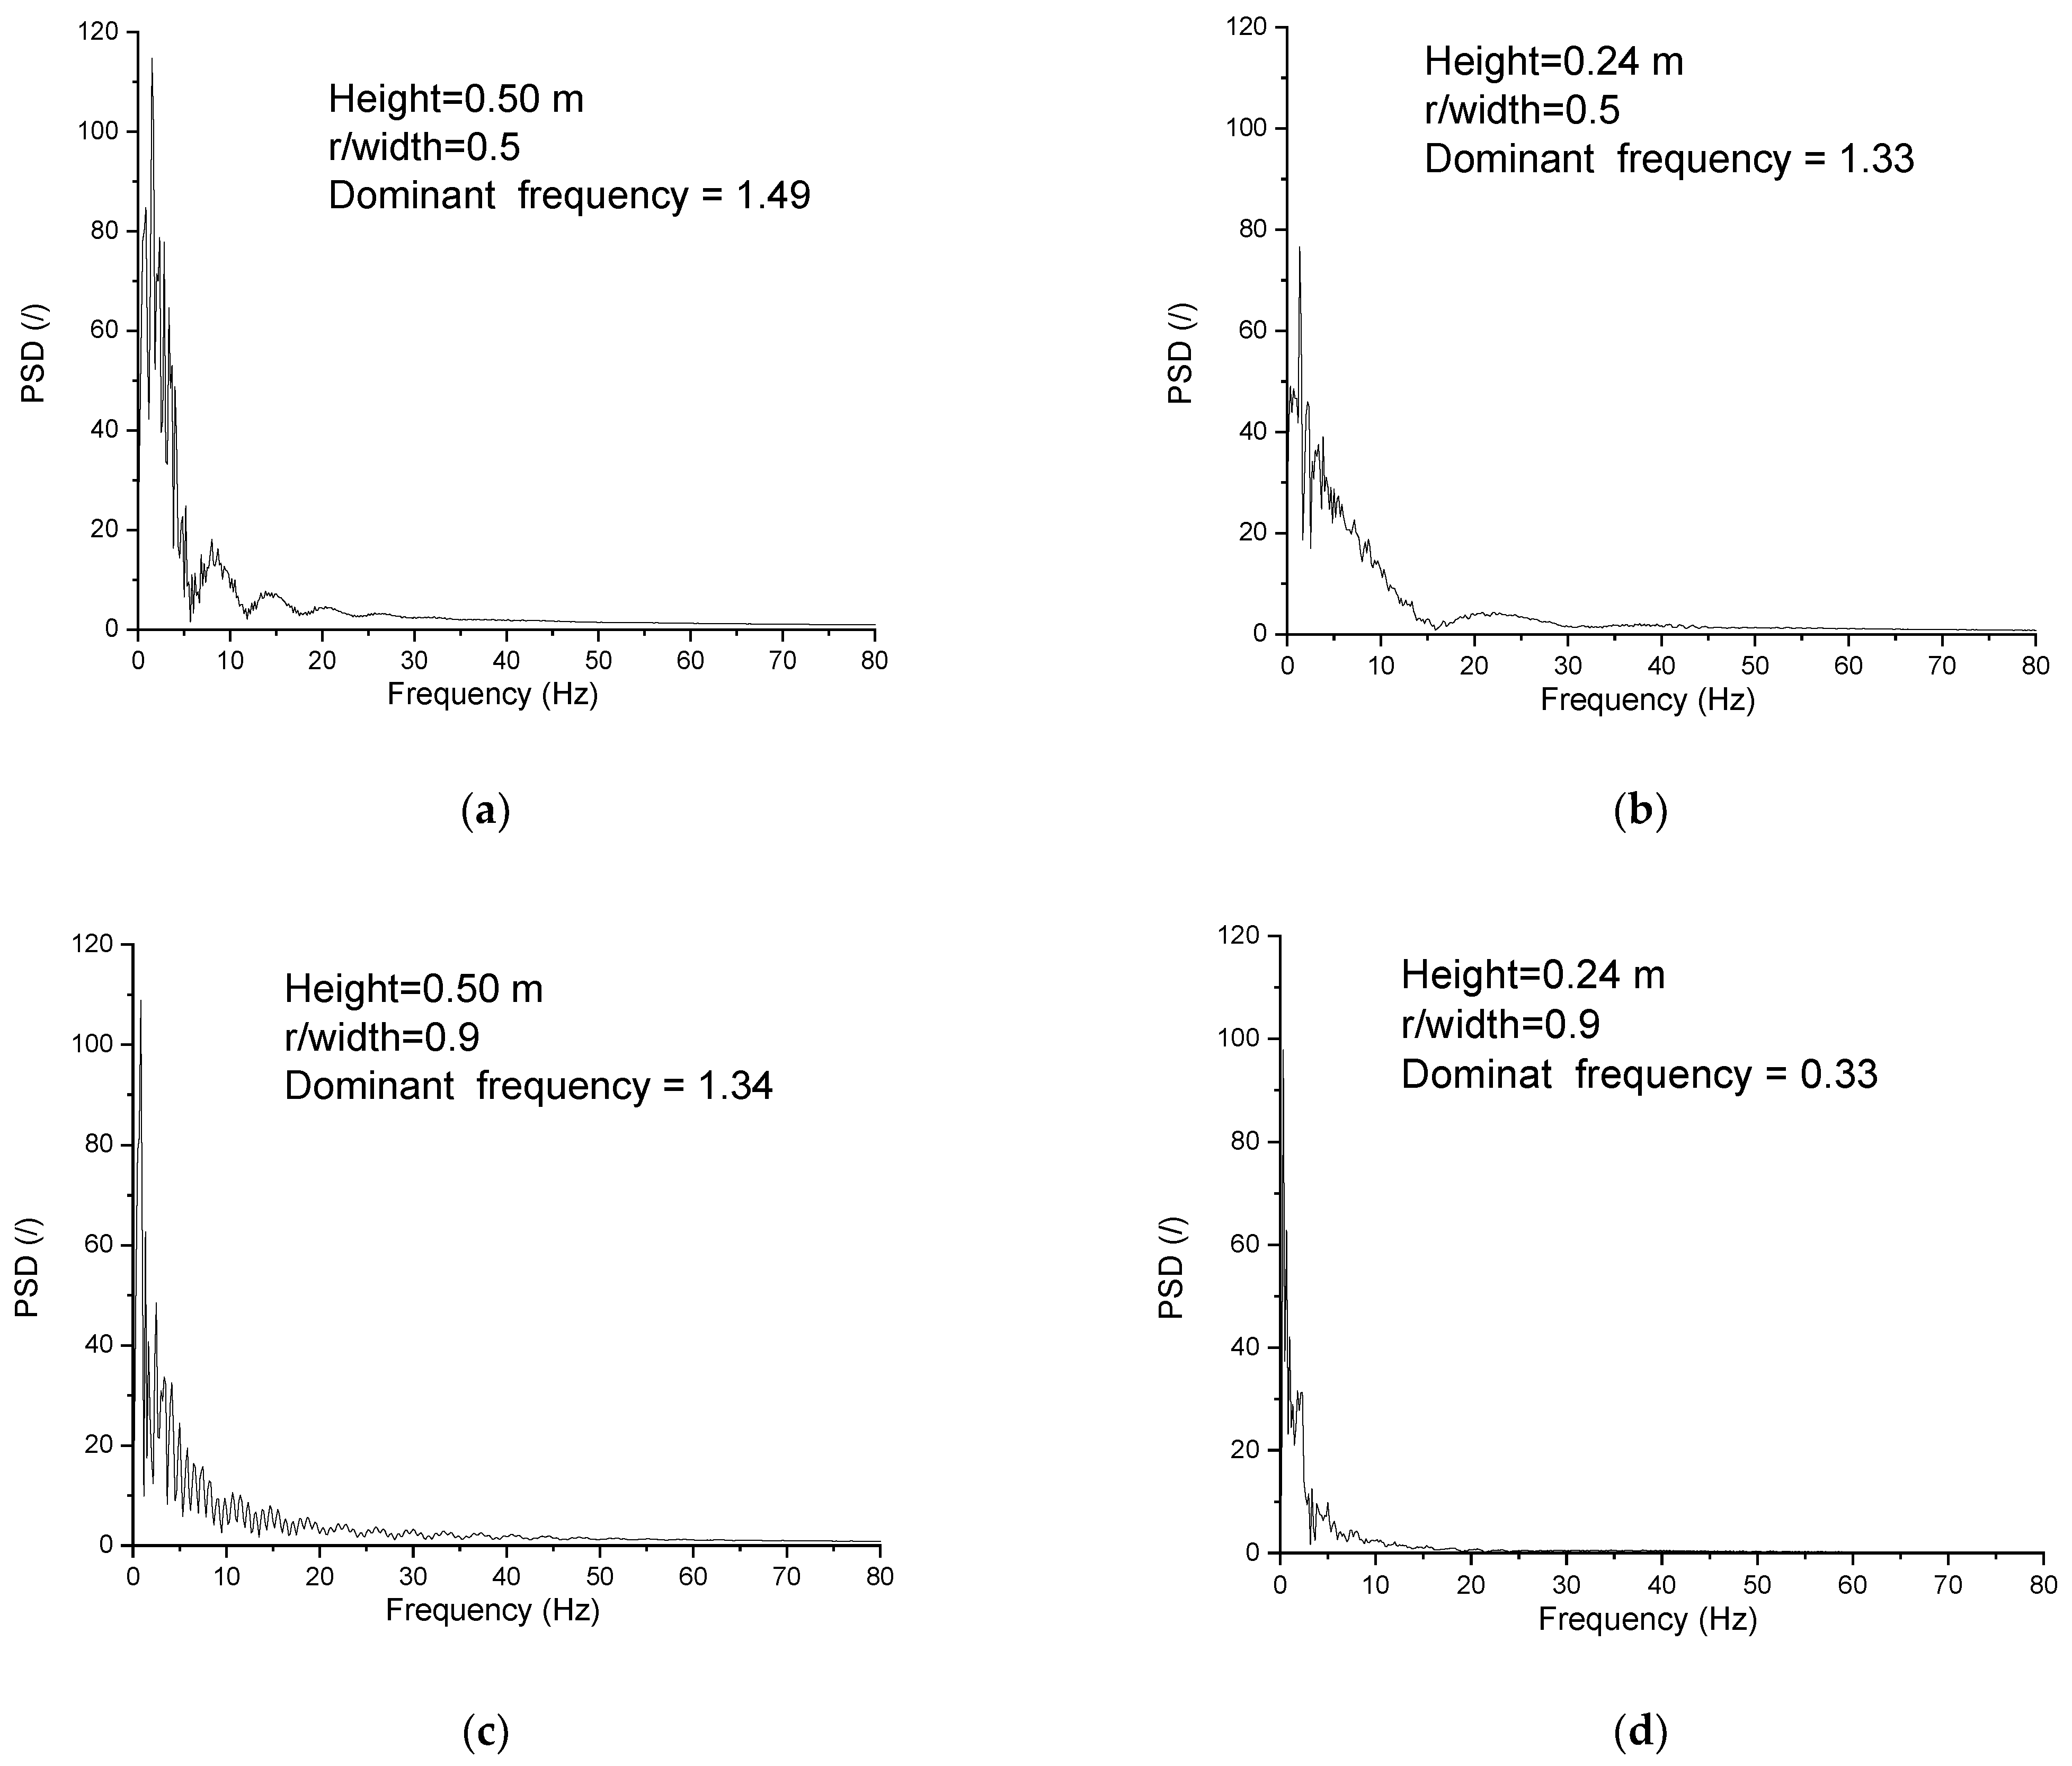
- Dominant frequency for axial porosity fluctuations is smaller than that of the heavy particle.
Author Contributions
Funding
Institutional Review Board Statement
Informed Consent Statement
Data Availability Statement
Acknowledgments
Conflicts of Interest
Nomenclature
| CD | Drag coefficient, (/) |
| dp | Diameter of particle, (m) |
| D | Diffusion term, (kg/m.s3) |
| ep | Restitution coefficient of particle, (/) |
| ew | Restitution coefficient of wall, (/) |
| eeff | Effective particle coefficient, (/) |
| f | Frequency, (dimensionless) |
| g | Gravitational acceleration, (m/s2) |
| g0 | Radial distribution function, (/) |
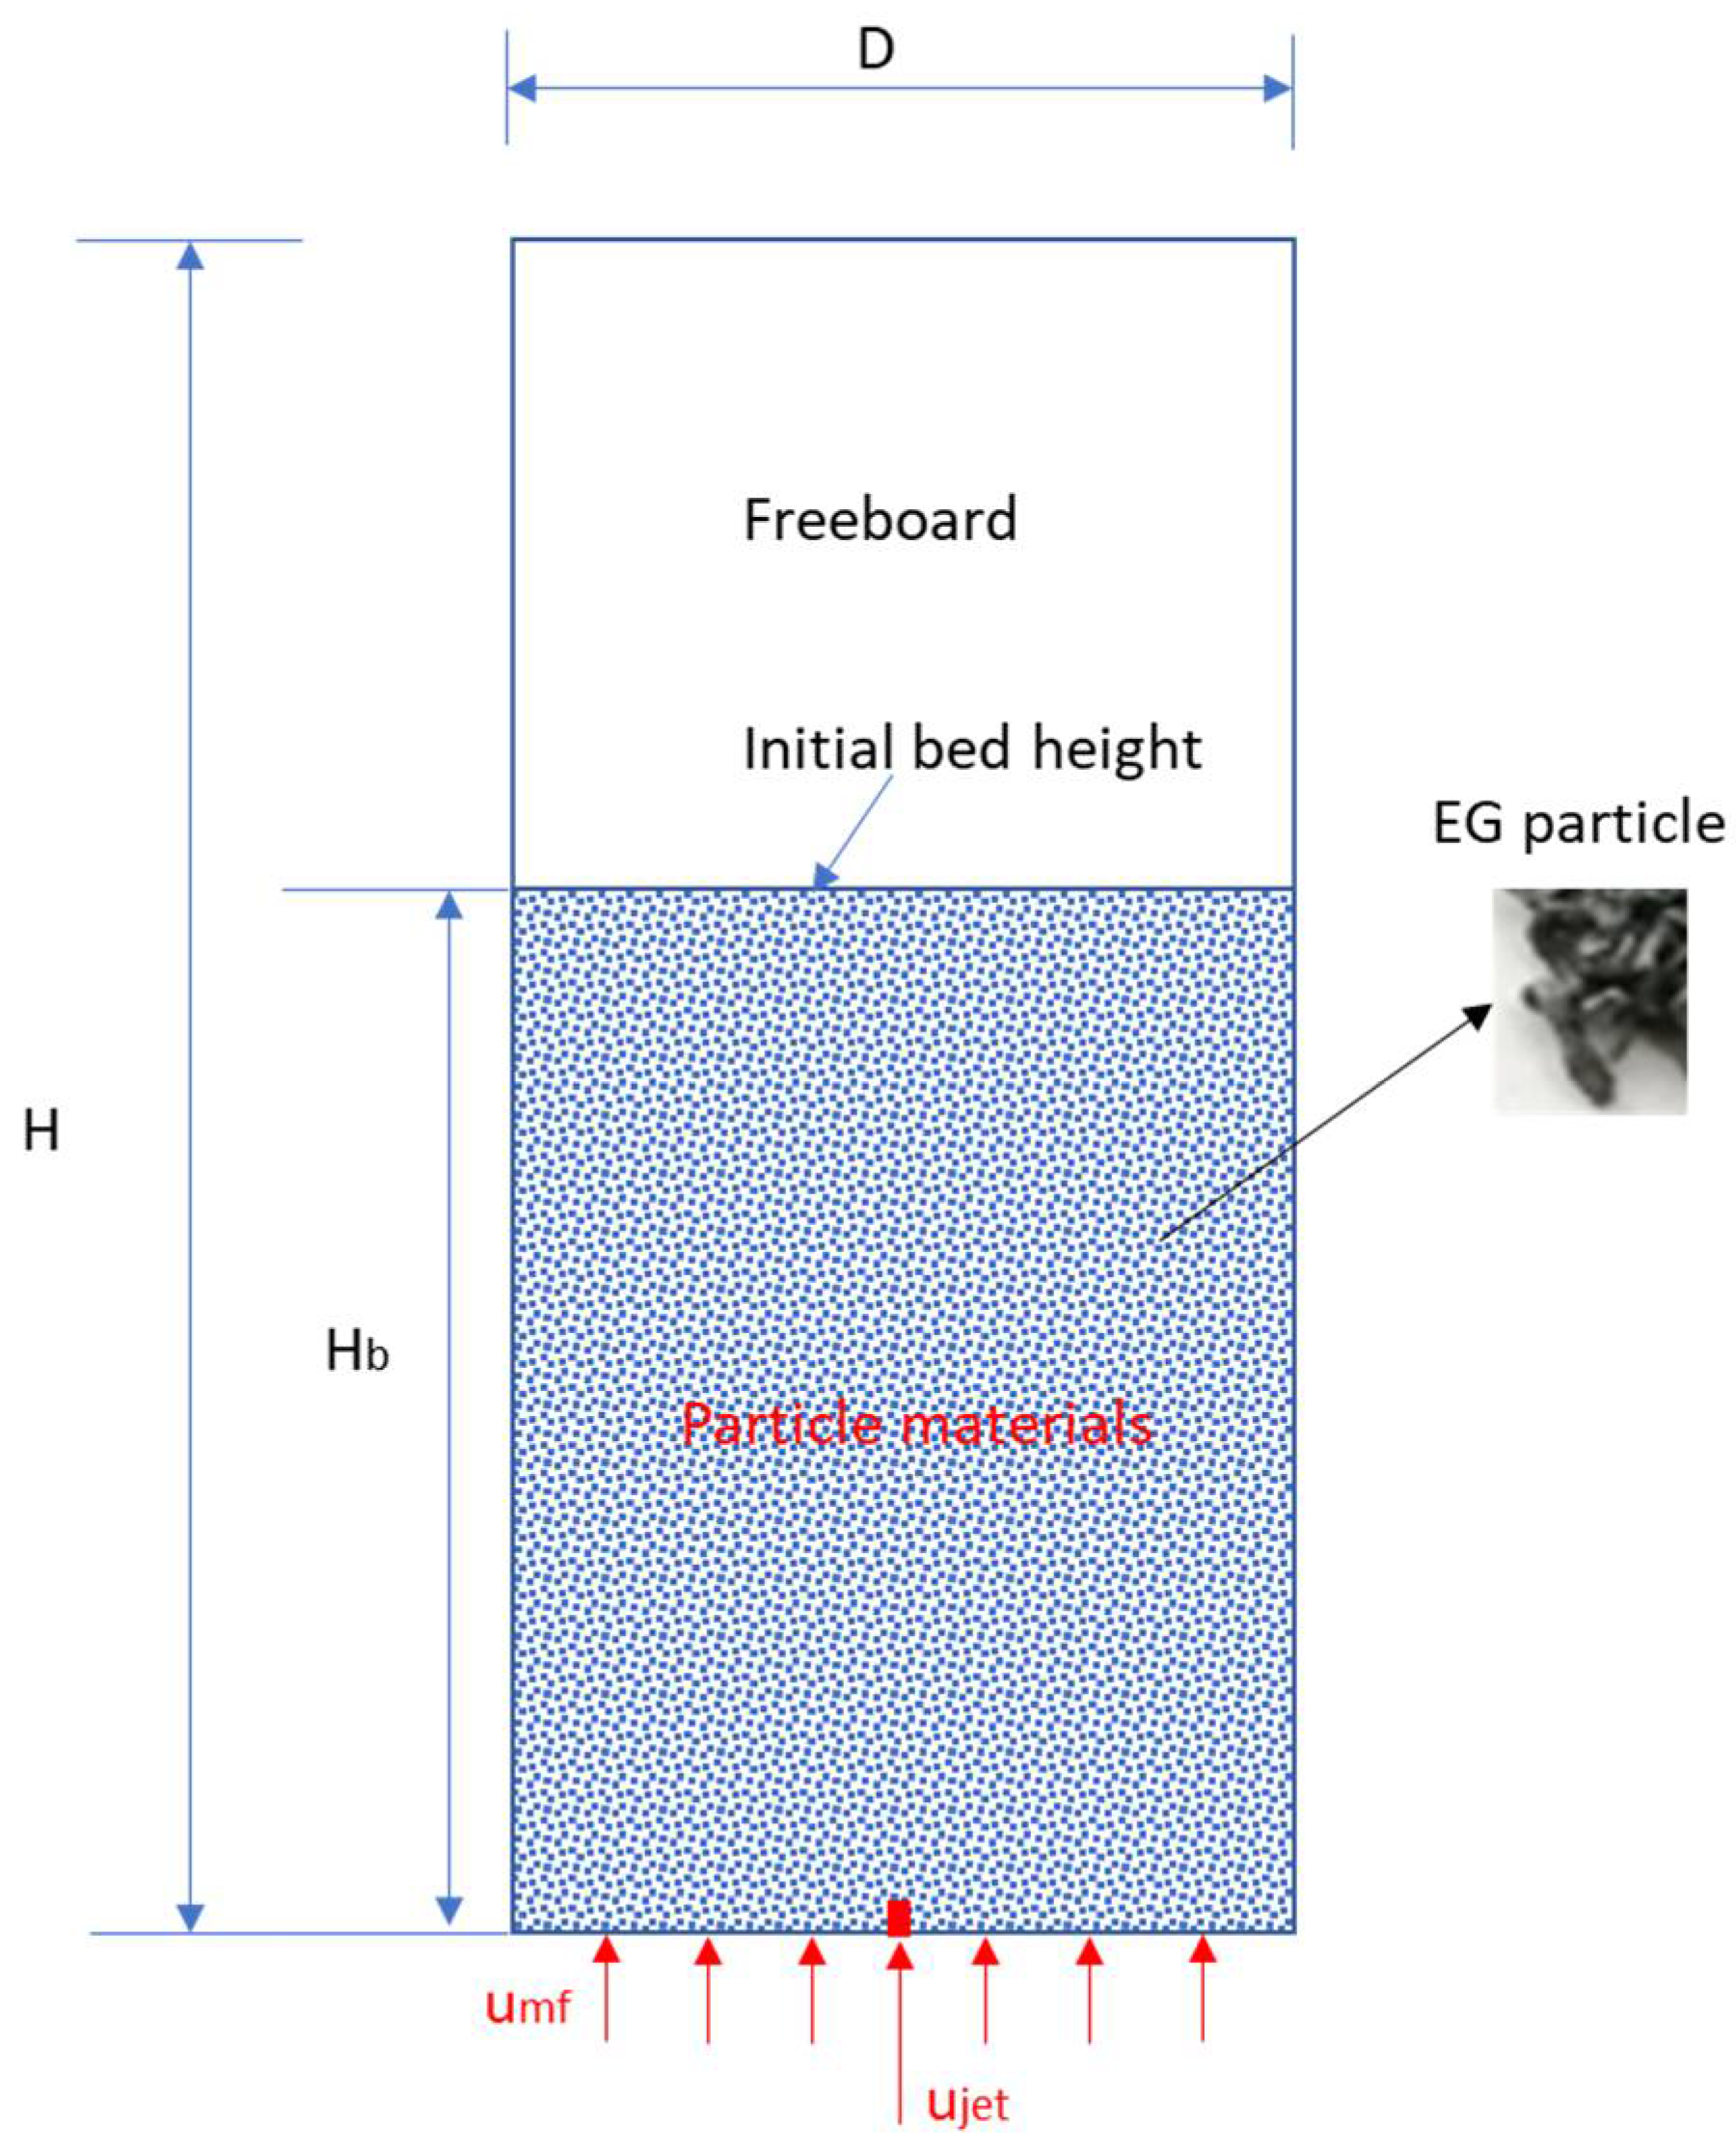
| H | Bed height, (m) |
| I | Unit tensor, (/) |
| kg | Turbulent kinetic energy of gas, (m2/s2) |
| kp | Turbulent kinetic energy of particle, (m2/s2) |
| p | Thermodynamic pressure, (Pa) |
| pp | Particle phase pressure, (Pa) |
| pfp | Particle frictional pressure, (Pa) |
| P | Production term, (kg/ms3) |
| Rep | Particle Reynolds number, (/) |
| ug | Gas velocity, (m/s) |
| up | Particle velocity, (m/s) |
| t | Time, (s) |
| T | Interaction term, (/) |
| Greek Alphabets | |
| αg | Gas volume fraction, (/) |
| αp | Particle concentration, (/) |
| αp,max | Maximum particle concentration, (/) |
| mfβpg | Minimum fluidiation velocity, (m/s) |
| δ | Inter-phase drag coefficient, (/) |
| ρg | Kronic–Delta unit tensor, (/)Gas density, (kg/m3) |
| ρp | Particle density, (kg/m3) |
| εg | Turbulent energy dissipation rate of gas, (m2/s3) |
| εp | Turbulent energy dissipation rate of particle, (m2/s3) |
| μg | Gas dynamic viscosity, (Pa.s) |
| μp | Particle shear viscosity, (Pa.s) |
| τg | Stress tensor of gas phase, (Pa) |
| τp | Stress tensor of particle phase, (Pa) |
| Φ | Sphericity, (/) |
| ωf | Particles internal friction angle, (degree) |
| ϕp | Net flucutaion energy exchange, (kg/ms3) |
| θ | Granular temperature, (m2/s2) |
| Π | Particle pressurestrain, (/) |
| γ | Collisional dissipation rate, (kg/ms3) |
| ξp | Particle bulk viscosity, (Pa.s) |
| Superscripts | |
| ′ | Fluctuation |
| ¯ | Averaged |
| Subscripts | |
| i,j,k | Coordinates directions |
| g,p | Gas and particle |
| l | Laminar |
References
- Gidaspow, D. Multiphase Flow and Fluidization: Continuum and Kinetic Theory Description; Academic Press: New York, NY, USA, 1994. [Google Scholar]
- Crowe, C.T.; Schwarzkopf, J.D.; Sommerfeld, M.; Tsuji, Y. Multiphase Flows with Droplets and Particles; CRC Press: Boca Raton, FL, USA, 2011. [Google Scholar]
- Grace, J.R. Reflections on turbulent fluidization and dense suspension upflow. Powder Technol. 2000, 113, 242–248. [Google Scholar] [CrossRef]
- Liu, Y.; Zhou, L.; Zhang, Y. Numerical Simulation of Bubble-Liquid Two-Phase Turbulent Flows in Shallow Bioreactor. Energies 2019, 12, 2269. [Google Scholar] [CrossRef] [Green Version]
- Anderson, K.; Sundaresan, S.; Jackson, R. Instabilities and the formation of bubbles in fluidized beds. J. Fluid Mech. 1995, 303, 327–366. [Google Scholar] [CrossRef]
- Liu, Y.; Chen, Z.; Zhang, Y.; Zhou, L. Hydrodynamic Modeling of Swirling Binary Mixture Gas–Particle Flows Using a Second-Order-Moment Turbulence Model. ACS Omega 2020, 5, 31490–31501. [Google Scholar] [CrossRef]
- Elghobashi, S. Direct Numerical Simulation of Turbulent Flows Laden with Droplets or Bubbles. Annu. Rev. Fluid Mech. 2019, 51, 217–244. [Google Scholar] [CrossRef] [Green Version]
- Liu, Y.; Zhang, L.; Zhou, L. Effects of swirling flow on ultralight particle dispersion characteristics in coaxial jet combustor. Energy Sci. Eng. 2019, 7, 3220–3233. [Google Scholar] [CrossRef] [Green Version]
- Zhou, J.; Grace, J.; Lim, C.; Brereton, C. Particle velocity profiles in a circulating fluidized bed riser of square cross-section. Chem. Eng. Sci. 1995, 50, 237–244. [Google Scholar] [CrossRef]
- Xu, J.; Zhu, J.-X. Experimental study on solids concentration distribution in a two-dimensional circulating fluidized bed. Chem. Eng. Sci. 2010, 65, 5447–5454. [Google Scholar] [CrossRef]
- Tsuji, Y.; Morikawa, Y. LDV measurements of an air–-Solid two-phase flow in a horizontal pipe. J. Fluid Mech. 1982, 120, 385–409. [Google Scholar] [CrossRef]
- Mychkovsky, A.; Rangarajan, D.; Ceccio, S.L. Measurements and analysis of gas and particulate phase velocity profiles in a vertical jet plume in a 2D bubbling fluidized bedpart 1: A two-phase LDV measurement technique. Powder Technol. 2012, 220, 47–54. [Google Scholar] [CrossRef]
- Rix, S.; Glass, D.; Greated, C. Preliminary studies of elutriation from gas-fluidised beds using particle image velocimetry. Chem. Eng. Sci. 1996, 51, 3479–3489. [Google Scholar] [CrossRef]
- Sutkar, V.S.; Deen, N.G.; Kuipers, H. Spout fluidized beds: Recent advances in experimental and numerical studies. Chem. Eng. Sci. 2013, 86, 124–136. [Google Scholar] [CrossRef]
- Liu, Y.; Zhang, L.; Zhou, L.X. Development of modeling and simulation of bubble liquid hydrodynamics in bubble column. Energy Sci. Eng. 2020, 8, 327–339. [Google Scholar] [CrossRef]
- Cierpka, C.; Lütke, B.; Kähler, C.J. Higher order multi-frame particle tracking velocimetry. Exp. Fluids 2013, 54, 1533. [Google Scholar] [CrossRef] [Green Version]
- Aleixo, R.; Soares-Frazão, S.; Zech, Y. Velocity-field measurements in a dam-break flow using a PTV Voronoï imaging technique. Exp. Fluids 2010, 50, 1633–1649. [Google Scholar] [CrossRef]
- Kähler, C.J.; Scharnowski, S.; Cierpka, C. On the uncertainty of digital PIV and PTV near walls. Exp. Fluids 2012, 52, 1641–1656. [Google Scholar] [CrossRef] [Green Version]
- Sommerfeld, M.; Qiu, H.-H. Detailed measurements in a swirling particulate two-phase flow by a phase-Doppler anemometer. Int. J. Heat Fluid Flow 1991, 12, 20–28. [Google Scholar] [CrossRef]
- Liu, X.; Gao, S.; Li, J. Characterizing particle clustering behavior by PDPA measurement for dilute gas–solid flow. Chem. Eng. J. 2005, 108, 193–202. [Google Scholar] [CrossRef]
- Hagemeier, T.; Börner, M.; Bück, A.; Tsotsas, E. A comparative study on optical techniques for the estimation of granular flow velocities. Chem. Eng. Sci. 2015, 131, 63–75. [Google Scholar] [CrossRef]
- Köhler, A.; Pallarès, D.; Johnsson, F. Modeling Axial Mixing of Fuel Particles in the Dense Region of a Fluidized Bed. Energy Fuels 2020, 34, 3294–3304. [Google Scholar] [CrossRef]
- Köhler, A.; Cano-Pleite, E.; Soria-Verdugo, A.; Pallarès, D.; Johnsson, F. Modeling the motion of fuel particles in a fluidized bed. Fuel 2021, 305, 121424. [Google Scholar] [CrossRef]
- Mirek, P. Influence of the model scale on hydrodynamic scaling in CFB boilers. Braz. J. Chem. Eng. 2016, 33, 885–896. [Google Scholar] [CrossRef]
- Djerf, T.; Pallarès, D.; Johnsson, F. Solids flow patterns in large-scale circulating fluidised bed boilers: Experimental evaluation under fluid-dynamically down-scaled conditions. Chem. Eng. Sci. 2020, 231, 116309. [Google Scholar] [CrossRef]
- Mirek, P. Scaling of flow phenomena in circulating fluidized bed boilers. Chem. Process Eng. 2011, 32, 91–100. [Google Scholar] [CrossRef]
- Djerf, T.; Pallarès, D.; Johnsson, F. Bottom-bed fluid dynamics–Influence on solids entrainment. Fuel Process. Technol. 2018, 173, 112–118. [Google Scholar] [CrossRef]
- Djerf, T.; Pallarès, D.; Johnsson, F. Solids backmixing and entrainment in the splash zone of large-scale fluidized bed boilers. Powder Technol. 2022, 404, 117471. [Google Scholar] [CrossRef]
- Djerf, T.; Pallarès, D.; Johnsson, F.; Sardina, G.; Ström, H. Solids back-mixing in the transport zone of circulating fluidized bed boilers. Chem. Eng. J. 2022, 428, 13097. [Google Scholar] [CrossRef]
- Buist, K.A.; van der Gaag, A.C.; Deen, N.G.; Kuipers, J.A.M. Improved magnetic particle tracking technique in dense gas fluidized beds. AIChE J. 2014, 60, 3133–3142. [Google Scholar] [CrossRef]
- Kruggel, H.; Wirtz, S. Analysis of residence time distributions of different solid biomass fuels by using radio frequency identification (RFID). Energy Technol. 2014, 2, 498–505. [Google Scholar] [CrossRef]
- Elghobashi, S.; Truesdell, G.C. On the two-way interaction between homogeneous turbulence and dispersed solid particles, turbulence modification. Phys. Fluids 1993, 5, 1790–1801. [Google Scholar] [CrossRef]
- Ding, J.; Gidaspow, D. A bubbling fluidization model using kinetic theory of granular flow. AIChE J. 1990, 36, 523–538. [Google Scholar] [CrossRef]
- Kuipers, J.; Van Duin, K.; Van Beckum, F.; Van Swaaij, W. A numerical model of gas-fluidized beds. Chem. Eng. Sci. 1992, 47, 1913–1924. [Google Scholar] [CrossRef] [Green Version]
- Zhou, L.; Liu, Y. Two-fluid LES and RANS modeling of sudden-expansion gas-particle flows. Powder Technol. 2017, 323, 45–50. [Google Scholar] [CrossRef]
- Arastoopour, H. Numerical simulation and experimental analysis of gas/solid flow systems: 1999 Fluor-Daniel Plenary lecture. Powder Technol. 2001, 119, 59–67. [Google Scholar] [CrossRef]
- Zhou, H.; Flamant, G.; Gauthier, D.; Lu, J. Lagrangian approach for simulating the gas-particle flow structure in a circulating fluidized bed riser. Int. J. Multiph. Flow 2002, 28, 1801–1821. [Google Scholar] [CrossRef]
- Liu, Y.; Jiang, L.; Zhang, Y. Hydrodynamic Modeling of Turbulence Modulation by Particles in a Swirling Gas–Particle Two-Phase Flow. ACS Omega 2021, 6, 10106–10118. [Google Scholar] [CrossRef]
- Liu, Y.; Li, G.; Zhang, Y.; Zhang, L. Hydrodynamics of Irregular-Shaped Graphite Particles in Coaxial Two-Phase Jet Flow. ACS Omega 2021, 6, 16631–16640. [Google Scholar] [CrossRef]
- Zhang, M.; Chu, K.; Wei, F.; Yu, A. A CFD–DEM study of the cluster behavior in riser and downer reactors. Powder Technol. 2008, 184, 151–165. [Google Scholar] [CrossRef]
- Zhang, H.; Li, T.; Huang, Z.; Kuang, S.; Yu, A. Investigation on vertical plug formation of coarse particles in a non-mechanical feeder by CFD-DEM coupling method. Powder Technol. 2018, 332, 79–89. [Google Scholar] [CrossRef]
- Jenkins, J.T.; Richman, M.W. Plane simple shear of smooth inelastic circular disks: The anisotropy of the second moment in the dilute and dense limits. J. Fluid Mech. 1988, 192, 313–328. [Google Scholar] [CrossRef] [Green Version]
- Zhang, Y.; Wan, X.T.; Wei, F.; Jin, Y. Numerical simulation of the gas-particle turbulent flow in riser reactor based on k-ε-kp-εp-Θ two-fluid model. Chem. Eng. Sci. 2001, 56, 6813–6822. [Google Scholar] [CrossRef]
- Sun, J.; Battaglia, F. Hydrodynamic modeling of particle rotation for segregation in bubbling gas-fluidized beds. Chem. Eng. Sci. 2006, 61, 1470–1479. [Google Scholar] [CrossRef]
- Syamlal, M.; Rogers, W.; O’brien, T. MFIX Documentation Theory Guide; USDOE Morgantown Energy Technology Center: Morgantown, WV, USA, 1993; DOE/METC94/1004, NTIS/DE940000087.
- Lu, H.L.; Gidaspow, D. Hydrodynamics of binary fuidization in a riser: CFD simulation using two granular temperatures. Chem. Eng. Sci. 2003, 58, 3777–3792. [Google Scholar]
- Liu, Y.; Li, G.; Li, X.; Zhou, L. Investigation on ultralight particle dispersions in dense two-phase flow using a kinetic friction stress model. Case Stud. Therm. Eng. 2021, 26, 101096. [Google Scholar] [CrossRef]
- Liu, Y.; Li, G.H.; Jiang, L.X.; Zhang, L.; Zhang, Y.J. Hydrodynamic simulations of non-spherical particle dispersions in downer reactor with second-order moment turbulence model. Chem. Eng. Process. Process Intensif. 2021, 166, 108491. [Google Scholar] [CrossRef]
- Liu, Y.; Zhang, L.; Chen, Z.; Zhou, L. Numerical investigation on mixture particle dispersion characteristics in swirling particle-laden combustion chamber. Int. Commun. Heat Mass Transf. 2020, 117, 104720. [Google Scholar] [CrossRef]
- Ding, Z.H.; Shashank, S.; Mayank, T.; Nandakumar, K. Computational fluid dynamic simulations of regular bubble patterns in pulsed fluidized beds using a two-fluid model. Can. J. Chem. Eng. 2022, 100, 405–422. [Google Scholar] [CrossRef]
- Zhang, K.; Wang, S.; He, Y. A clouded bubble-based drag model for the simulations of bubbling fluidized beds. Chem. Eng. Sci. 2022, 257, 117724. [Google Scholar] [CrossRef]
- Shashank, S.; Tiwari, S.; Ghatage, V.; Jyeshtharaj, B.; Kong, B. Segregation and intermixing in polydisperse liquid–solid fluidized beds: A multifluid model validation study. AIChE J. 2022, 4, 17725. [Google Scholar]
- Patil, D.; Annaland, M.V.S.; Kuipers, J. Critical comparison of hydrodynamic models for gas–solid fluidized beds—Part II: Freely bubbling gas–solid fluidized beds. Chem. Eng. Sci. 2005, 60, 73–84. [Google Scholar] [CrossRef]
- Reuge, N.; Cadoret, L.; Coufort-Saudejaud, C.; Pannala, S.; Syamlal, M.; Caussat, B. Multifluid Eulerian modeling of dense gas–solids fluidized bed hydrodynamics: Influence of the dissipation parameters. Chem. Eng. Sci. 2008, 63, 5540–5551. [Google Scholar] [CrossRef] [Green Version]
- Liu, Y.; Li, G.H. Investigations of gas-particle two-phase flow in swirling combustor by the particle stokes numbers. Processes 2021, 9, 951. [Google Scholar] [CrossRef]
- Lindborg, H.; Lysberg, M.; Jakobsen, H.A. Practical validation of the two-fluid model applied to dense gas–solid flows in fluidized beds. Chem. Eng. Sci. 2007, 62, 5854–5869. [Google Scholar] [CrossRef]
- Igci, Y.; Iv, A.T.A.; Sundaresan, S.; Pannala, S.; O’Brien, T. Filtered two-fluid models for fluidized gas-particle suspensions. AIChE J. 2008, 54, 1431–1448. [Google Scholar] [CrossRef]
- Sun, D.; Wang, S.Y.; Lu, H.L.; Wang, S.; Wei, L.X. A second-order moment method of dense gas-solid flow for bubbling fluidization. Chem. Eng. Sci. 2009, 64, 5013–5027. [Google Scholar]
- Sun, D.; Wang, J.Z.; Lu, H.L.; Gidaspow, D.; Chen, M. Numerical simulation of gas-particle flow with a second-order moment method in bubbling fluidized beds. Powder Technol. 2010, 199, 213–225. [Google Scholar]
- Zhou, L.X.; Chen, T. Simulation of strongly swirling gas-particle flows using USM and k-ε-kp two-phase turbulence models. Powder Technol. 2001, 114, 1–11. [Google Scholar] [CrossRef]
- Yu, Y.; Zhou, L.; Wang, B.; Cai, F. A USM-Θ two-phase turbulence model for simulating dense gas-particle flows. Acta Mech. Sin. 2005, 21, 228–234. [Google Scholar] [CrossRef]
- Zhou, L. Two-fluid turbulence modeling of swirling gas-particle flows—A review. Powder Technol. 2017, 314, 253–263. [Google Scholar] [CrossRef]
- Liu, Y.; Zhang, Y.; Zhou, L. Numerical study on bubble-liquid two-phase turbulent hydrodynamics in extremely narrow shape bioreactor. Int. Commun. Heat Mass Transf. 2019, 108, 184286. [Google Scholar] [CrossRef]
- Liu, Y.; Zhou, L. Numerical analysis on particle dispersions of swirling gas-particle flow using a four-way coupled large eddy simulation. Int. Commun. Heat Mass Transf. 2022, 133, 105974. [Google Scholar] [CrossRef]
- Liu, Y.; Zhou, L. Hydrodynamic modeling of non-swirling and swirling gas-particle two-phase turbulent flow using large eddy simulation. Process Saf. Environ. Prot. 2022, 161, 175–187. [Google Scholar] [CrossRef]
- Liu, Y.; Zhou, L. A novel particle subgrid scale modeling of large eddy simulation for swirling particle-laden turbulent flow. Powder Technol. 2022, 402, 117348. [Google Scholar] [CrossRef]
- Zhou, H.; Hu, Z.; Zhang, Q.; Wang, Q.; Lv, X. Numerical study on gas-solid flow characteristics of ultra-light particles in a cyclone separator. Powder Technol. 2018, 344, 784–796. [Google Scholar] [CrossRef]
- Yan, S.; He, Y.; Tang, T.; Wang, T. Drag coefficient prediction for non-spherical particles in dense gas–solid two-phase flow using artificial neural network. Powder Technol. 2019, 354, 115–124. [Google Scholar] [CrossRef]
- Johnson, P.C.; Nott, P.; Jackson, P. Frictional-collisional equations of motion for participate flows and their application to chutes. J. Fluid Mech. 1990, 210, 501–535. [Google Scholar] [CrossRef]
- Wang, S.Y.; Shen, Z.H.; Lu, H.L. Numerical predictions of flow behavior and cluster size of particles in riser with particle rotation model and cluster-based approach. Chem. Eng. Sci. 2008, 63, 4116–4125. [Google Scholar]
- Gera, D.; Gautam, M.; Tsuji, Y.; Kawaguchi, T.; Tanaka, T. Computer simulation of bubbles in large-particle fluidized beds. Powder Technol. 1998, 98, 38–47. [Google Scholar] [CrossRef]
- Kashyap, M.; Gidaspow, D.; William, J.K. Circulation of Geldart D type particles: Part I—High solids fluxes. Measurements and computation under solids slugging conditions. Chem. Eng. Sci. 2011, 66, 183–206. [Google Scholar]
- Chalermsinsuwan, B.; Chanchueya, T.; Buakhaoa, W.; Gidaspowc, D.; Piumsomboon, P. Computational fluid dynamics of circulating fluidized bed downer: Study of modeling parameters and system hydrodynamic characteristics. Chem. Eng. J. 2012, 189, 314–335. [Google Scholar] [CrossRef]


| Parameters | Unit | Value |
|---|---|---|
| Height and width of fluidized bed, H, D | m | 1.0, 0.6 |
| Packed bed height, Hb | m | 0.54 |
| Density of gas, ρg | kg/m3 | 1.225 |
| Viscosity of gas, μg | Pa.s | 1.8 × 10⁻⁵ |
| Wall restitution coefficient, ew | - | 0.9 |
| Particle restitution coefficient, ep | - | 0.9 |
| Density of particles, ρp | kg/m3 | 2700.0, 800.0 |
| Sphericity of particles, Φ | - | 0.8 |
| Diameter of particle, dp | m | 0.004 |
| Jetting velocity, ujet | m/s | 30.0 |
| Minimum fluidization velocity, umf | m/s | 1.8, 10. |
| Central jetting width, djet | m | 0.02 |
Publisher’s Note: MDPI stays neutral with regard to jurisdictional claims in published maps and institutional affiliations. |
© 2022 by the authors. Licensee MDPI, Basel, Switzerland. This article is an open access article distributed under the terms and conditions of the Creative Commons Attribution (CC BY) license (https://creativecommons.org/licenses/by/4.0/).
Share and Cite
Liu, H.; Li, G.; Liu, Y. Hydrodynamic Predictions of the Ultralight Particle Dispersions in a Bubbling Fluidized Bed. Processes 2022, 10, 1390. https://doi.org/10.3390/pr10071390
Liu H, Li G, Liu Y. Hydrodynamic Predictions of the Ultralight Particle Dispersions in a Bubbling Fluidized Bed. Processes. 2022; 10(7):1390. https://doi.org/10.3390/pr10071390
Chicago/Turabian StyleLiu, Hailang, Guohui Li, and Yang Liu. 2022. "Hydrodynamic Predictions of the Ultralight Particle Dispersions in a Bubbling Fluidized Bed" Processes 10, no. 7: 1390. https://doi.org/10.3390/pr10071390