Article

Predicting Shear Wave Velocity Using a Convolutional Neural Network and Dual-Constraint Calculation for Anisotropic Parameters Incorporating Compressional and Shear Wave Velocities

1
Key Laboratory of Exploration Technologies for Oil and Gas Resources, Yangtze University, Ministry of Education, Wuhan 430100, China
2
Research Institute of Petroleum Exploration and Development, CNPC, Beijing 100083, China
*
Author to whom correspondence should be addressed.
Processes 2023, 11(8), 2356; https://doi.org/10.3390/pr11082356
Submission received: 30 June 2023 / Revised: 25 July 2023 / Accepted: 28 July 2023 / Published: 5 August 2023

Abstract

:
As the exploration of unconventional reservoirs progresses, characterizing challenging formations like tight sandstone becomes increasingly complex. Anisotropic parameters play a vital role in accurately characterizing these unconventional reservoirs. In light of this, this paper introduces an approach that uses a dual-constraint anisotropic rock physics model based on compressional and shear wave velocities. The proposed method aims to enhance the precision of anisotropic parameter calculations, thus improving the overall accuracy of reservoir characterization. The paper begins by applying a convolutional neural network (CNN) to predict shear wave velocity, effectively resolving the issue of incomplete shear wave logging data. Subsequently, an anisotropic rock physics model is developed specifically for tight sandstone. A comprehensive analysis is conducted to examine the influence of quartz, clay porosity aspect ratio, and fracture density on compressional and shear wave velocities. Trial calculations using the anisotropic model data demonstrated that the accuracy of calculating anisotropic parameters significantly improved when both compressional and transverse wave velocity constraints were taken into account, as opposed to relying solely on the compressional wave velocity constraint. Furthermore, the rationality of predicting anisotropic parameters using both the shear wave velocity predicted by the convolutional neural network and the measured compressional wave velocity was confirmed using the example of deep tight sandstone in the Junggar Basin.

1. Introduction

Shear wave velocity holds significant importance for seismic exploration as it provides crucial information for evaluating the physical properties and structural characteristics of subsurface media. It serves as a fundamental parameter in various essential processes, including pre-stack seismic inversion, fluid identification, and AVO (Amplitude variation with offset) analysis [1,2,3]. However, regarding practical seismic data, the scarcity of shear wave velocity information in conventional well logging data is a common issue arising from factors such as high exploration costs. This limitation is prevalent in a majority of areas. Hence, it is imperative to find a cost-effective method that can achieve highly precise shear wave velocity prediction. Such an approach is crucial for enhancing reservoir prediction accuracy and obtaining the necessary anisotropic parameters. In addition, it establishes a solid theoretical reference framework for subsequent reservoir prediction and related tasks.
International researchers have explored shear wave velocity prediction extensively, classifying it into empirical formula, rock physics-modeling, and machine-learning methods. Among these, the empirical formula methods have gained popularity among geophysicists due to their ease of use and faster application. Many researchers have put forth linear or nonlinear empirical relationships between compressional and shear wave velocities [4,5,6,7,8,9]. However, the accuracy of predictions with empirical formula methods tends to be limited and lacks generalizability, primarily due to variations in regions and lithologies. With the swift progress of software and hardware technology, experts have leveraged machine learning algorithms to predict shear wave velocity using well-logging data [10,11,12]. In particular, deep learning, an offspring of artificial neural network algorithms, has emerged as a prominent research area in both academic and industrial circles. In contrast to traditional shallow learning, deep learning enhances the accuracy of predictions or classifications by constructing intricate machine models with hidden layers. These models excel in complex function approximation and layer-wise feature transformations, making them a compelling choice in the field. Convolutional Neural Networks (CNNs), renowned for their ability to capture spatial features, have demonstrated remarkable performance across diverse geophysical domains, including well-logging data interpretation [13], seismic interpretation [14], and seismic inversion [15,16]. Because Wang et al. (2020) leveraged the long-term correlation patterns observed in well-logging data, the Long Short-Term Memory (LSTM) network emerged as a viable choice for shear wave velocity prediction and the identification of complex reservoir geophysical parameters [17,18]. While LSTM requires longer training times, the Gated Recurrent Unit (GRU) neural network achieves comparable precision at an accelerated pace [19]. Sun et al. (2020) presented a shear wave velocity prediction approach that used a GRU neural network [20]. Such applications serve as compelling evidence for the successful implementation and swift advancement of deep-learning models within geophysics.
Within the domain of rock physics, numerous scholars have put forth various techniques for predicting shear wave velocity. The prevailing models concentrate primarily on modeling the moduli of the rock matrix, dry rock, and saturated rock within the equivalent medium. Notably, these models emphasize the exploration of intricate pore shapes and types. The groundbreaking critical porosity model introduced by Nur serves as the cornerstone for subsequent shear wave velocity prediction methods built upon rock physics models [21]. Building upon this foundation, Xu and White proposed a hybrid model that combines the Kuster–Toksöz (K–T) model and the Differential Effective Medium (DEM) model for accurate shear wave velocity prediction in sand–shale formations [22]. Bai Junyu conducted a comprehensive analysis on the influence of errors in input parameters such as matrix properties, porosity, and aspect ratio on the accuracy of shear wave velocity prediction. The study revealed that estimated shear wave velocities that accounted for varying pore aspect ratios yielded superior accuracy [23]. In a similar vein, Liu Zhishui proposed the DKT model, which integrates the K–T and DEM models to account for multiple pore types in rocks. By dividing the total porosity into flexible and rigid pores, the DKT model enabled simultaneous simulation of rocks with diverse pore types. This model has proven to be more suitable for predicting shear wave velocity in clastic reservoirs [24]. Yang et al. (2017) enhanced the Xu–White model by incorporating the influence of ash volume fraction, leading to the development of a sand–mud rock model with ash content for accurate shear wave velocity estimation [25]. Over the past decade, there have been remarkable advancements in rock physics models for complex reservoirs driven by the growth of unconventional oil and gas resources. Xu and Payne expanded the Xu–White model to encompass carbonate rocks and proposed a physical model capable of addressing the intricate pore types found in carbonate formations [26]. Zhang Guangzhi introduced a methodology based on Kumar and Han’s estimation of pore volume and aspect ratio, tailored for various pore types in carbonate rocks, and suggested a modified Xu–White model for shear wave velocity estimation [27]. Huang Xinrui developed a rock physics approach to account for anisotropic tight sandstone reservoirs, emphasizing the complexity of pore connectivity in tight oil sandstones. The study highlighted the significant impact of clay content, pore connectivity, and pore types on tight oil sandstones [28]. Yuan combined the strengths of the SCA and DEM models for sand–mud rocks, culminating in the establishment of an isotropic dual-porosity effective medium model that achieved enhanced accuracy compared to the Xu–White model [29]. Guo Zhiqi et al. incorporated Chapman’s multiscale fracture theory to consider the shape and connectivity of horizontal fractures in shale. They introduced a pore-fracture system into the vertical transverse isotropy (VTI) solid matrix and incorporated vertical fractures within a VTI anisotropic background of shale using Schoenberg and Helbig’s equivalent medium theory, The study demonstrated a significant positive correlation between the inverted horizontal fracture density and the horizontal permeability obtained from core samples [30]. By incorporating the Chapman multiscale fracture rock physics model, Chen et al. (2020) introduced a series of horizontally aligned fractures into a VTI medium model to simulate the presence of horizontal bedding fractures, resulting in the reconstruction of the rock physics model. This study revealed that the length and density of fractures within shale oil and gas reservoirs exerted a notable influence on both the frequency range and magnitude of compressional wave velocity dispersion [31]. However, the accuracy of rock physics modeling methods in predicting shear wave velocity is heavily reliant on precise reservoir geophysical parameters, such as porosity, pore types, pore shapes, mineral composition, water saturation, and clay content. Acquiring such high-precision parameters is often challenging, leading to increased complexity and uncertainty in rock physics modeling methods.
This study presents a novel approach to enhance the accuracy of anisotropic parameter calculations through the use of a dual-constraint rock physics model that considers both compressional and shear wave velocities. CNNs are employed to improve the prediction accuracy of transverse wave velocity. An anisotropic rock physics model specific to tight sandstones was established, and an analysis was conducted to investigate the influence of quartz and clay pore aspect ratios, as well as fracture density, on compressional and shear wave velocities. The Junggar Basin’s deep tight sandstones served as a case study, and a comprehensive prediction process was developed for estimating anisotropic parameters based on the dual constraint of compressional and shear wave velocities. The research findings affirmed that the use of CNNs predicted shear wave velocities with higher accuracy. Moreover, numerical calculations using the anisotropic model data demonstrated that the dual-constraint approach outperformed the single-constraint approach, based solely on compressional wave velocities, when calculating anisotropic parameters.

2. Principles and Workflow for Predicting Anisotropic Parameters

2.1. Convolutional Neural Network

There are a number of factors to explain why the complexity and uncertainty surrounding rock physics modeling methods are elevated. First, empirical formulas have constrained accuracy in predicting shear wave velocity and they have limitations pertaining to fixed locations and rock types. Moreover, rock physics modeling is substantially dependent on the precision of reservoir geophysical parameters, such as porosity, pore type, pore shape, mineral composition, water saturation, and mud content, which are often challenging to acquire with high precision. Consequently, this study took advantage of a CNN to predict shear wave velocity. The CNN represents a class of deep feed-forward artificial neural networks that finds extensive application in machine learning, especially in vision and image processing. With rapid advancements in deep learning, CNNs have demonstrated their efficacy in tackling geological challenges, encompassing fault recognition, reservoir prediction, lithology classification, and geological parameter inversion [16]. A typical CNN architecture comprises convolutional, pooling, and fully connected layers (Figure 1). Within the convolutional layers, input data undergo convolution with dedicated kernels, facilitating the extraction of local features. Notably, the weight-sharing characteristic of a CNN significantly reduces the network’s complexity. To introduce a non-linear relationship into the data to mitigate overfitting, a rectified linear unit (ReLU) activation function is frequently employed. As the data traverse the convolutional layers, the resulting output features can be expressed as Equation (1):
y j l = σ a i l 1 w i j l + b j l
where y j l denotes the j-th feature map in the l-th layer; a i l 1 represents the i-th feature map in the preceding layer; w i j l signifies the weight matrix of the l-th layer; b j l signifies the corresponding bias term; and σ denotes the activation function.

2.2. The Principle of Constructing Anisotropic Rock Physics Models Involves

The construction of an anisotropic rock physics models entails integrating anisotropic pores into the framework of isotropic models. The specific procedure for constructing these models is outlined as follows:
Step 1: Determine the anisotropic rock physics parameters (normal difference Δ N , tangential difference Δ T ) for fractured dry rocks. The relationship between the fracture density and pore aspect ratio was established using the Hudson model [32,33]:
e = 3 ϕ 4 π α
In Equation (2), ϕ and α denote the estimated porosity and pore aspect ratio, respectively, obtained using the methodology proposed by Kumar and Han [34]. The variable e represents the fracture density.
Additionally, in Equations (3) and (4), the positive difference ( Δ N ) and tangential difference ( Δ T ) of fractures were calculated using the linear sliding model in conjunction with Schoenberg’s approach, as suggested by Zhang [35]:
Δ N = 4 e 3 g ( 1 g )
Δ T = 16 e 3 ( 3 2 g )
In the equation, e represents the crack density, and g = μ/(λ + 2μ), where λ and μ are the Lamé parameters of the rock.
Step 2: Commencing with the stiffness matrix of fractured rock, the fluid substitution equation for anisotropic rock (Equation (5)) is re-derived by building upon the research conducted by Chen [36]:
C 33 s a t = λ + 2 μ 1 λ 2 Δ N λ + 2 μ 2 + K 0 K i s o d r y + λ Δ N K i s o d r y / λ + 2 μ 2 K 0 / K f l ϕ K 0 K f l + K 0 K i s o d r y 1 Δ N K i s o d r y / λ + 2 μ
C 55 s a t = μ ( 1 Δ T )
In Equations (5) and (6), C 33 s a t and C 55 s a t represent the stiffness coefficients of the saturated fractured rock; K i o s d r y denotes the bulk modulus of the isotropic dry rock; K 0 signifies the bulk modulus of the minerals constituting the rock; and K f l corresponds to the effective bulk modulus of the fluid within the pore space.
Step 3: Once the stiffness coefficients of the saturated fractured rock are obtained, the compressional and shear wave velocities can be calculated using Thomsen’s definition of anisotropic parameters (Equations (7) and (8)) [37]:
V P = c 33 / ρ
V S = c 55 / ρ

2.3. Workflow for Predicting Anisotropic Parameters Based on Dual Constraints of Compressional and Shear Wave Velocities

The specific workflow for predicting anisotropic parameters based on the dual constraints of compressional and shear wave velocities is illustrated in Figure 2:
(1)
Estimate the elastic modulus of the mixed minerals after mixing using the Voigt–Reuss–Hill averaging formula.
(2)
Calculate the volume modulus and shear modulus of the dry rock skeleton using the differential effective medium theory and the K–T model.
(3)
Incorporate the fracture system into an isotropic background using the Hudson and Schoenberg theories.
(4)
Mix the pore fluids using the Wood formula and calculate the bulk modulus of the mixed fluid.
(5)
Perform anisotropic fluid substitution using the Brown and Korringna formulas.
(6)
Preprocess the well-logging data, including data standardization, normalization, and partitioning into training and testing sets.
(7)
Train the CNN using a training set, calculate the errors, and check for convergence. If the errors diverge, retrain the CNN. If the errors converge, apply the trained CNN to the testing set to predict the transverse wave velocity.
(8)
Apply dual constraints by comparing the predicted anisotropic parameters based on the transverse wave velocity obtained from the CNN with the compressional wave velocity obtained from the well-logging data.
In the process of predicting anisotropic parameters with dual constraints of compressional and shear wave velocities, constructing an objective function that incorporates both constraints effectively is key. The specific approach adopted in this study is as follows:
By substituting Equations (5) and (6) into Equations (7) and (8), the nonlinear relationship equation ( V S , V P ) = ξ ( α 1 , α 2 ) can be derived, which relates V S , V P , α 1 , and α 2 . This equation enables the forward calculation of compressional and shear wave velocities of the rock by considering fracture density, elastic parameters, pore aspect ratio, and rock component volume content. Alternatively, the fracture density and pore aspect ratio can be jointly inverted based on the compressional and shear wave velocities of the rock. The objective function for the inversion of anisotropic parameters, using Equations (5) to (8), can be expressed as follows:
L S = W P v P r v P p / v P r + W S v S r v S p / v S r
In Equation (9), v P r and v S r represent the compressional and shear wave velocities, respectively, while v P p and v S p represent the predicted compressional and shear wave velocities obtained through the CNN. The weighting factors W p and W s satisfy the condition W p   +   W s = 1.0. Currently, the prediction of anisotropic parameters is achieved first by predicting the transverse wave velocity using rock physics models and then directly predicting the anisotropic parameters. However, this approach can be considered as setting W p = 1.0 and W s = 0, which means relying solely on the compressional wave velocity as a single constraint for inversion. Unfortunately, this approach often leads to poor accuracy and significant bias in the prediction of anisotropic parameters. In this study, a different approach was taken. After predicting the transverse wave velocity using a convolutional neural network, the prediction of anisotropic parameters was performed under the constraint inversion of both compressional and shear wave velocities. This dual-constraint inversion approach yielded significantly different results compared to the compressional wave velocity single-constraint inversion and brought the predicted anisotropic parameters closer to their true values.

3. Numerical Experiments

3.1. Factor Analysis

Due to the inherent characteristics of tight sandstone reservoirs—tight nature, low porosity, low permeability, diverse mineral composition, complex pore structure, significant anisotropy in compressional and shear wave velocities, and thin thickness—predicting anisotropic parameters is highly challenging. Moreover, the geophysical response of tight sandstone reservoirs exhibits minimal contrast with surrounding rocks, and the gas-water distribution within these reservoirs is complex. Additionally, the rock matrix of tight sandstone is primarily influenced by sand composition and quartz. Therefore, this study primarily focused on analyzing the impact of the quartz pore aspect ratio ( α 1 ), clay pore aspect ratio ( α 2 ), and fracture density (e) on the compressional and shear wave velocities.
Figure 3 displays the variation curves depicting the relationship between quartz pore aspect ratio ( α 1 ) and compressional and shear wave velocities. The range of the quartz pore aspect ratio ( α 1 ) spanned 0.01 to 0.1, while the crack density (e) ranged from 0.01 to 0.1. Figure 3a illustrates that as the quartz pore aspect ratio ( α 1 ) increased, the compressional wave velocity exhibited an upward trend. However, for a given ( α 1 ), the compressional wave velocity declined as the crack density increased. Figure 3b demonstrates that the shear wave velocity increased along with the quartz pore aspect ratio ( α 1 ). Similarly, for a given ( α 1 ), the shear wave velocity decreased as the crack density rose. Comparing Figure 3a,b, it can be inferred that the sensitivity of the compressional and shear wave velocities to the quartz pore aspect ratio ( α 1 ) differed.
Figure 4 illustrates the variation curves depicting the relationship between the quartz clay pore aspect ratio ( α 2 ) and the dual constraints of compressional and shear wave velocities. The range of the clay pore aspect ratio ( α 2 ) spanned 0.01–0.15, while the crack density (e) ranged from 0.01 to 0.1. From Figure 4a, it can be observed that as the clay pore aspect ratio increased, the compressional wave velocity exhibited an increasing trend. However, for a given clay pore aspect ratio ( α 2 ), the compressional wave velocity decreased as the crack density increased. Figure 4b demonstrates that the shear wave velocity increased with the clay pore aspect ratio ( α 2 ). Similarly, for a given clay pore aspect ratio ( α 2 ), the shear wave velocity decreased as the crack density rose. In conclusion, the compressional and shear wave velocities were directly proportional to the clay pore aspect ratio ( α 2 ) and quartz pore aspect ratio ( α 1 ) and were inversely proportional to the crack density (e). Comparing Figure 3 and Figure 4, it can be observed that the sensitivity of the compressional and shear wave velocities to the clay pore aspect ratio ( α 2 ) and quartz pore aspect ratios ( α 1 ) differed. From Figure 3a, it can be seen that at a constant compressional wave velocity of 4400 there were multiple combinations of the quartz pore aspect ratio ( α 1 ) and crack density (e) that could have achieved this velocity while keeping the rock matrix constant. Similarly, from Figure 3b, at a constant shear wave velocity of 2900, there were also multiple combinations of the quartz pore aspect ratio ( α 1 ) and crack density (e) that could have achieved this velocity while keeping the rock matrix constant. Therefore, without applying the dual constraints of compressional and shear wave velocities, significant errors may arise.

3.2. Dual-Constraint Numerical Experiments

Using measured data points as examples, we illustrated the differences in the inversion of anisotropic parameters between the single-constraint of compressional wave velocity and the dual constraint of compressional and shear wave velocities. The specific measured data for this point are presented in Table 1. By combining the measured data with the objective function, we analyzed the disparities between the single-constraint of compressional wave velocity and the dual constraint of compressional and shear wave velocities.
Figure 5 illustrates the relationship between the objective functions constructed based on the single-constraint of compressional wave velocity and the dual constraint of compressional and shear wave velocities concerning the quartz pore aspect ratio (a), clay pore aspect ratio (b), and crack density (c). In Figure 5, the red line segment represents the relationship between the objective function and anisotropic parameters when only the compressional wave velocity was used with W p = 1.0 and W s = 0 in Equation (9) for the single constraint. The blue line segment represents the relationship between the objective function and anisotropic parameters when both compressional and shear wave velocities were used with W p and W s satisfying W p + W s = 1.0 in Equation (9) for the dual constraint. It can be observed from Figure 5 that both the objective functions based on the single-constraint of compressional wave velocity and the dual constraint of compressional and shear wave velocities decreased with an increase in the quartz and clay pore aspect ratios and crack density. When the objective functions were the same, the curves of the single-constraint of compressional wave velocity and the dual constraint of compressional and shear wave velocities exhibited significant differences, which gradually increased with a decrease in these three parameters. This indicated that when the objective functions were constructed to be the same, the predicted anisotropic parameters using the single-constraint of compressional wave velocity and the dual constraint of compressional and shear wave velocities showed distinct differences.
To further demonstrate the accuracy of the results, the error was apportioned to the compressional and shear wave velocities based on Equation (9) when the objective functions were equal. Through a statistical analysis of the data, it was determined that the best accuracy for predicting anisotropic parameters was achieved when W p = 0.25 and W s = 0.75. The specific comparison of anisotropic parameters between the single constraint of compressional wave velocity and the dual constraint of compressional and shear wave velocities is presented in Table 1. It shows that the accuracy of anisotropic parameters predicted by the dual constraint of compressional and shear wave velocities was significantly better than that predicted by the single constraint of compressional wave velocity and was closer to the true values. The difference between the transverse wave velocity obtained by the single-constraint of compressional wave velocity and the actual measured data is twice as large as the difference between the transverse wave velocity obtained by the dual constraint of compressional and shear wave velocities and the actual measured data. This indicated that the anisotropic parameters predicted by the dual constraint of compressional and shear wave velocities were notably superior to those predicted by the single constraint of compressional wave velocity. Therefore, the proposed method of compression–transverse wave velocity dual constraint ensured that the predicted anisotropic parameters aligned more accurately with reality and demonstrated the feasibility of inverting anisotropic parameters using both compressional and shear wave velocities.

4. Practical Applications

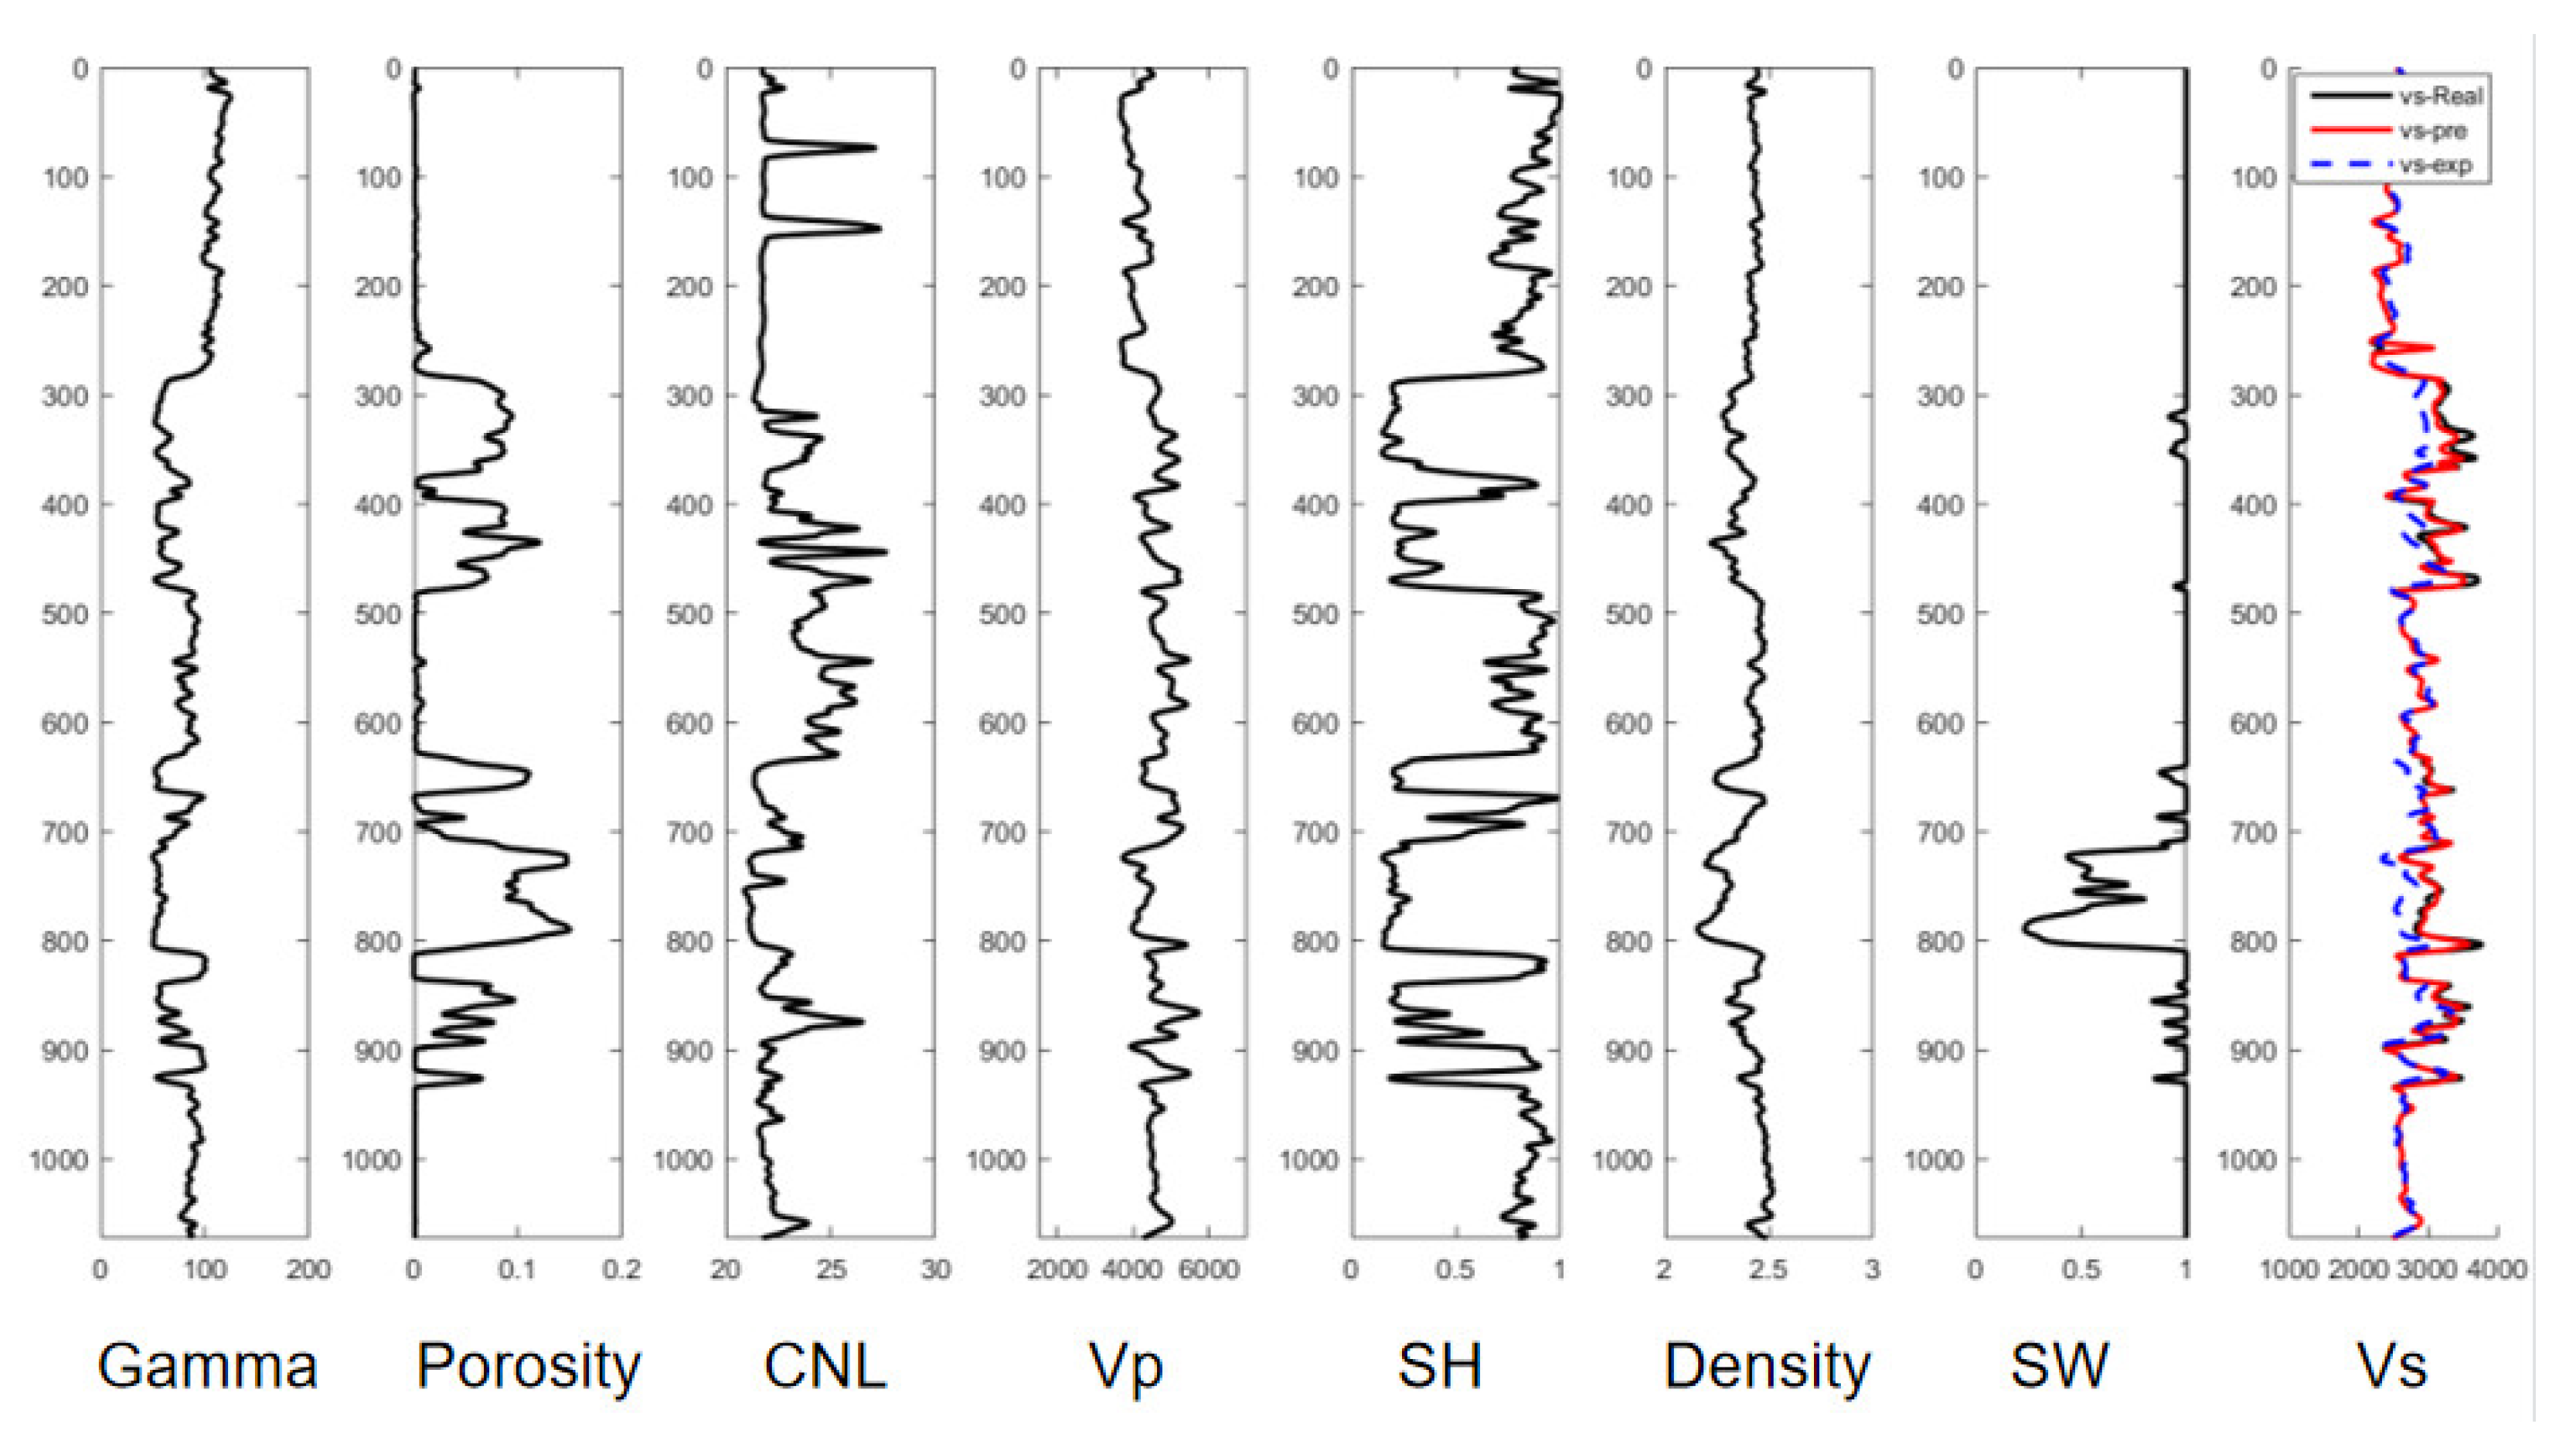
The method proposed in this paper was applied to Well Y in the Junggar Basin, which consists primarily of tight sandstone. The predictions of shear wave velocity using CNNs and the calculation of anisotropic parameters based on compressional and shear wave velocities with dual constraint were validated. In Figure 6, the black curves represent various parameters such as gamma rays, porosity, neutron porosity, measured compressional wave velocity, clay content, density, water saturation, and shear wave velocity at depths ranging from 0 to 1000 m in Well Y. The red curve represents the shear wave velocity predicted by the CNN, while the blue curve represents the shear wave velocity predicted by empirical formulas. It can be observed from Figure 6 that the shear wave velocity curve predicted by the CNN showed a closer agreement with the true values compared to the empirical formula. Therefore, the prediction accuracy of shear wave velocity based on CNNs was high, which met the requirements of practical production.
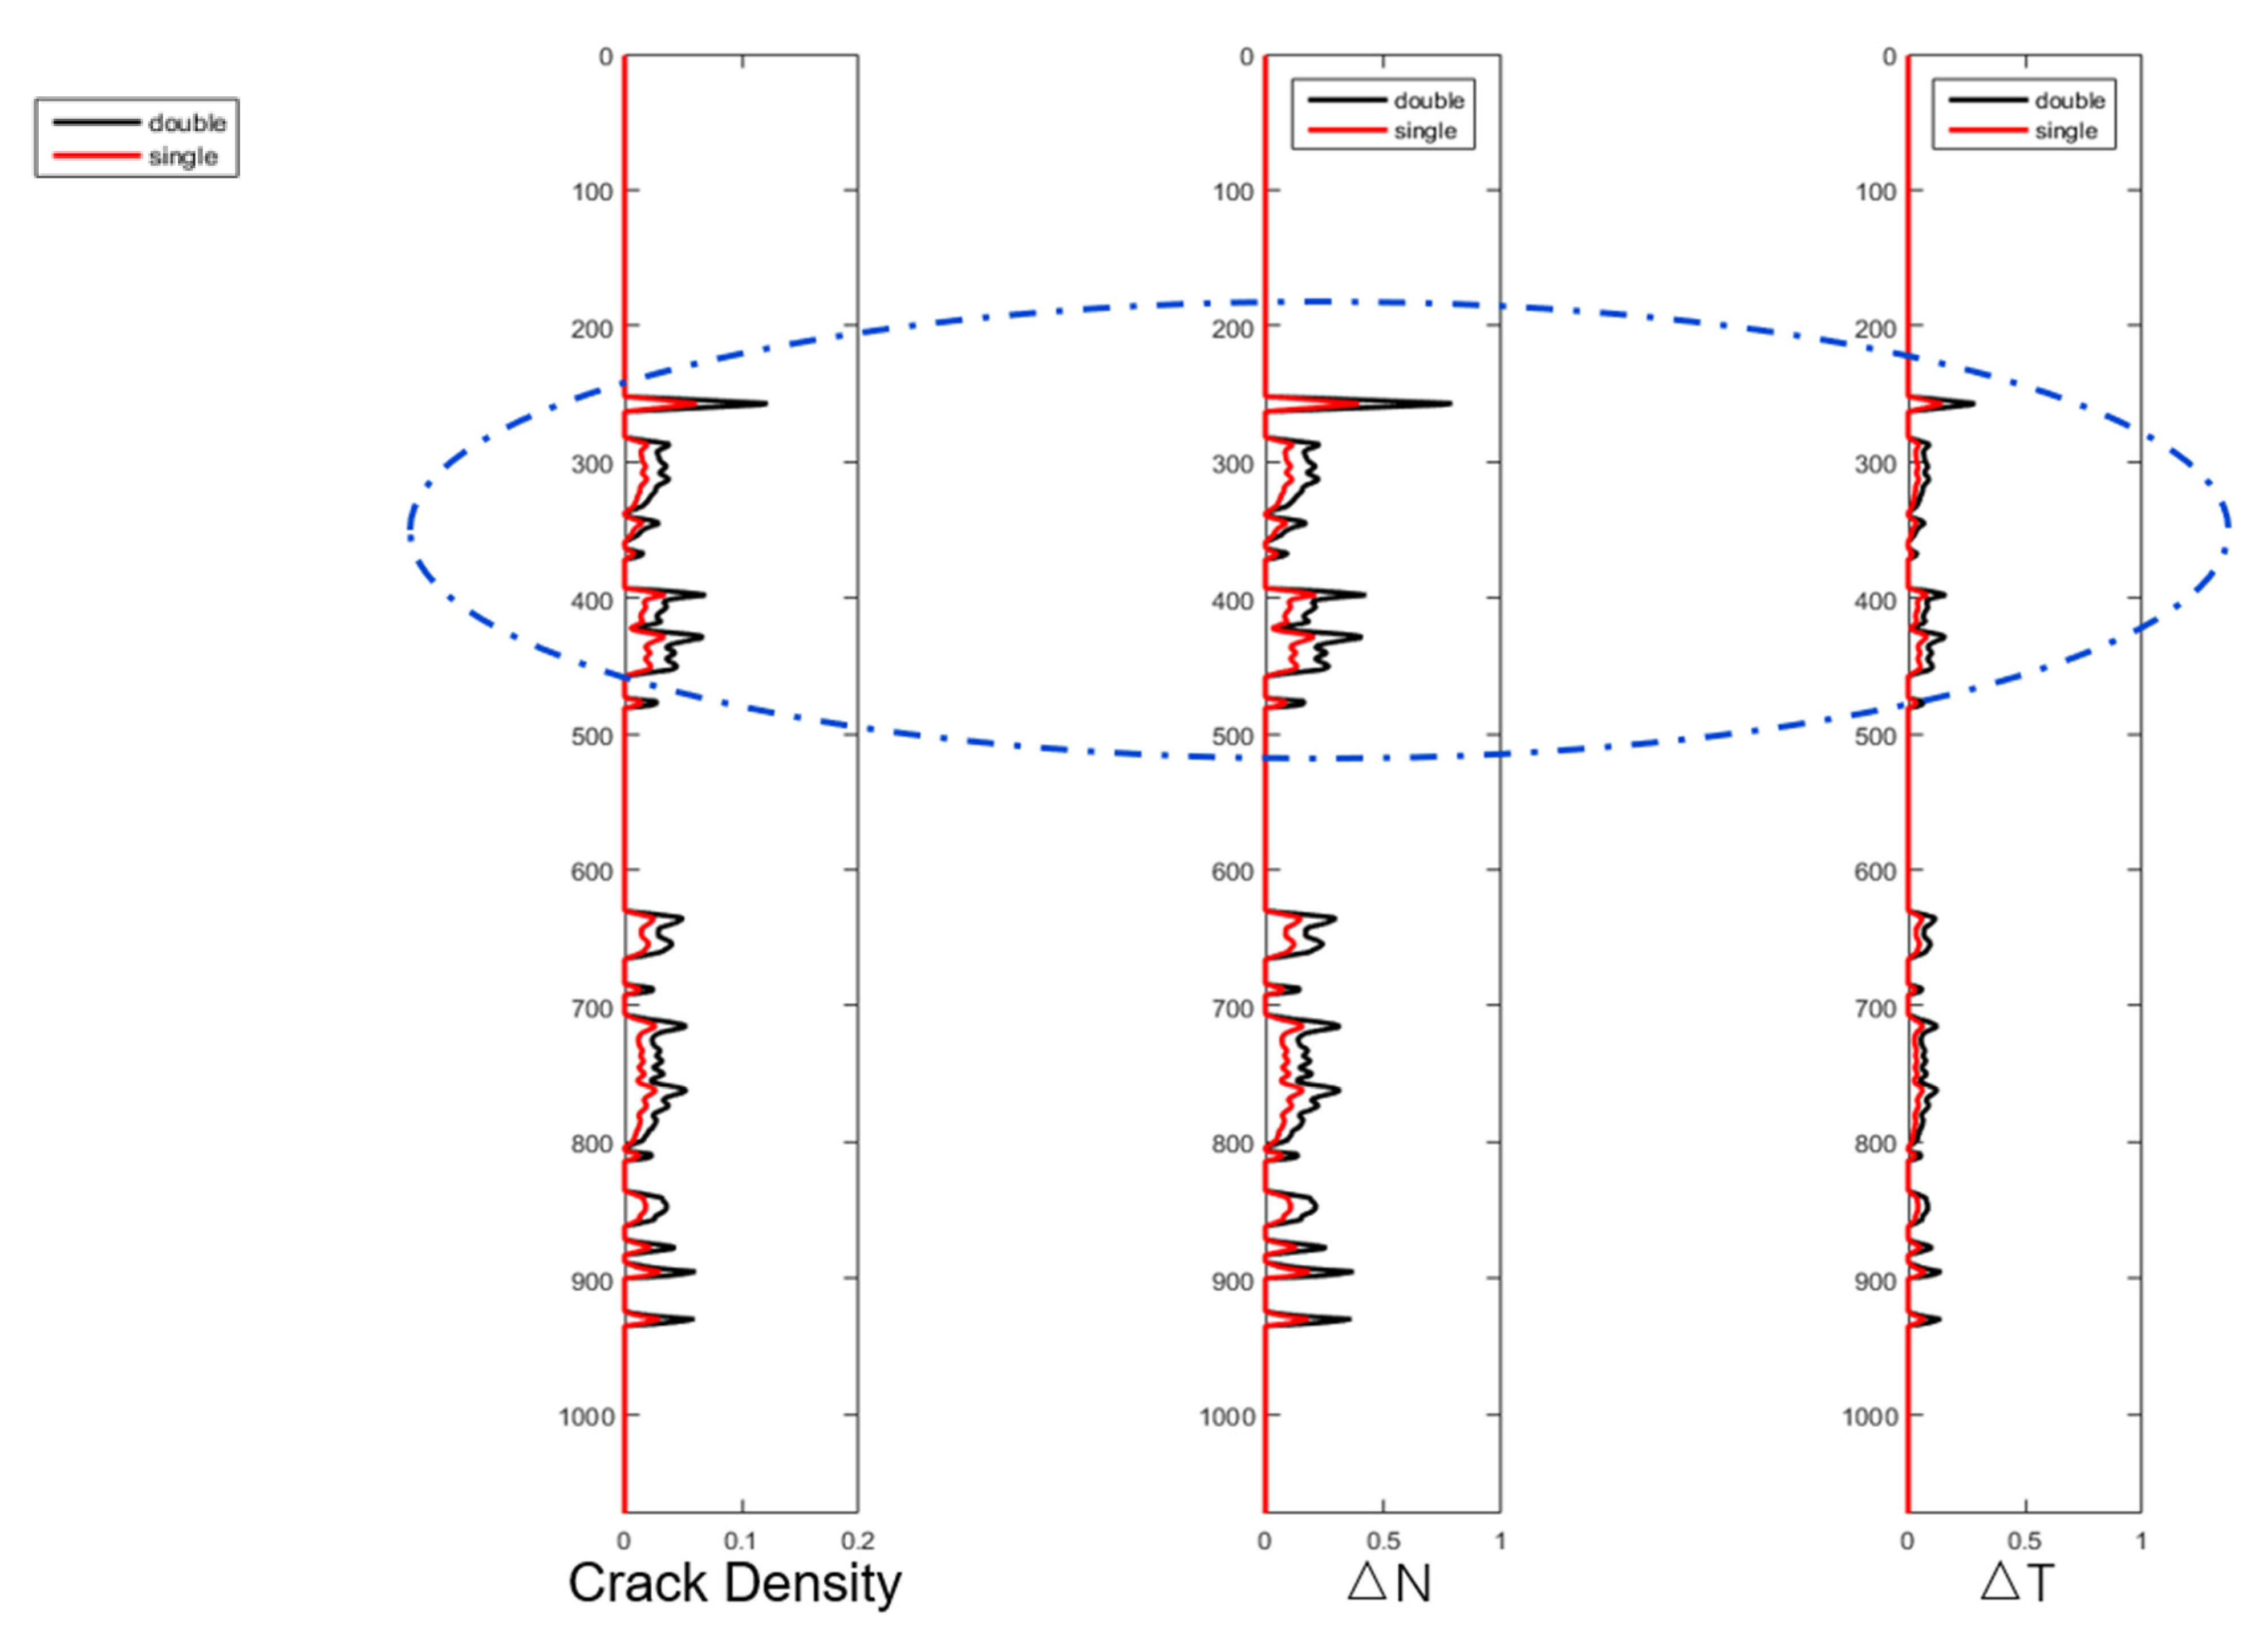
In Figure 7, the black curve represents the prediction of anisotropic parameters in the local area using the dual constraints of compressional and shear wave velocities based on the prediction of transverse wave velocity by CNNs. The red curve represents the prediction of anisotropic parameters in the local area based on a single constraint of compressional wave velocity. From Figure 7, it is evident that there was a significant difference between the prediction of anisotropic parameters using a single constraint of compressional wave velocity and the prediction using dual constraints of compressional and shear wave velocities. This confirmed the feasibility of predicting anisotropic parameters using the dual constraints of compressional and shear wave velocities. Moreover, within the region marked by the dashed circle in Figure 7, there was a substantial variation in the anisotropic parameters compared to other intervals. By considering the well log interpretation, it was concluded that fractures were present in the region.

5. Conclusions

This paper presented a novel approach for predicting shear wave velocity using convolutional neural networks and estimating anisotropic parameters based on the dual constraints of compressional and shear wave velocities. The key methods employed and the conclusions drawn from this study are as follows:
(1)
Using CNNs, the proposed method outperformed conventional techniques in predicting shear wave velocity, yielding higher prediction accuracy.
(2)
The anisotropic rock physics model developed for tight sandstone revealed that both compressional and shear wave velocities increased with the quartz and clay porosity ratios, while they decreased as the fracture density increased. The influence of the clay mineral porosity ratio on the model was relatively minor.
(3)
The results obtained from both the model and actual data collected from the Junggar Basin validated the prediction that anisotropic parameters based on the dual constraints of compressional and shear wave velocities would achieve superior accuracy compared to relying solely on the single constraint of compressional wave velocity.

Author Contributions

Conceptualization, J.L. and G.G.; methodology, J.L.; software, J.L.; validation, J.L., Q.W. and Y.L. (Yizhuo Liu); formal analysis, J.L.; investigation, G.G.; resources, Z.G.; data curation, Y.L. (Yonggen Li); writing—original draft preparation, J.L.; writing—review and editing, J.L. and G.G.; visualization, J.L.; supervision, G.G. and Z.G.; project administration, Z.G. and Y.L. (Yonggen Li); funding acquisition, Z.G. All authors have read and agreed to the published version of the manuscript.

Funding

This research was funded by state key program of National Natural Science Foundation of China and scientific research & technology development project of china national petroleum corporation. grant number [No. 2021DJ3704] And The APC was funded by state key program of National Natural Science Foundation of China and scientific research & technology development project of china national petroleum corporation.

Data Availability Statement

Data available on request due to restrictions eg privacy or ethical. The data presented in this study are available on request from the corresponding author. The data are not publicly available due to privacy.

Acknowledgments

The authors would like to thank editors and anonymous reviewers for their insightful and constructive comments to greatly improve this manuscript. This work is supported by the scientific research & technology development project of China national petroleum corporation (Grant No. 2021DJ3704).

Conflicts of Interest

The authors declare no conflict of interest.

References

  1. Wang, H.-F.; Ma, J.-F.; Li, L.; Wang, D.-X.; Wang, Y.-G. Research on predicting S-wave velocity in tight reservoir: Sulige gas field for example. Prog. Geophys. 2019, 34, 1521–1529. (In Chinese) [Google Scholar] [CrossRef]
  2. Chen, Y.; Sun, Z.T.; Xu, K. Pre-stack multi-parameter seismic inversion in shale-gas reservoirs. Geophys. Prospect. Pet. 2022, 61, 1016–1027. [Google Scholar]
  3. Liu, Q.W.; Hu, W.; Li, Q. Application of Pre-stack optimized AVO inversion based on Xu-White model in the deep sea turbidite reservoir. Miner. Explor. 2023, 14, 214–222. [Google Scholar]
  4. Castagna, J.P.; Batzle, M.L.; Eastwood, R.I. Relationship between compressional wave and shear wave velocities in clastic rocks. Geophysics 1985, 50, 571–581. [Google Scholar] [CrossRef]
  5. Han, D.H.; Nur, A.; Morgan, D. Effects of porosity and clay content on wave velocities. Geophysics 1986, 51, 2093–2107. [Google Scholar] [CrossRef]
  6. Russell, B.H.; Hedlin, K. Fluid-property discrimination with AVO: A Biot-Gassman perspective. Geophysics 2003, 68, 29–39. [Google Scholar] [CrossRef] [Green Version]
  7. Hossain, Z.; Mukerji, T.; Fabricius, I.L. Vp-Vs relationship and amplitude variation with offset modelling of glauconitic greensand. Geophys. Prospect. 2015, 60, 117–137. [Google Scholar] [CrossRef]
  8. Mabrouk, W.M.; Pennington, W.D. Compressional and shear wave velocity in terms of petrophysical parameters in clean formations. J. Pet. Sci. Eng. 2009, 65, 62–66. [Google Scholar] [CrossRef]
  9. Ojha, M.; Sain, K. Velocity-porosity and velocity-density relationship for shallow sediments in the Kerala-Konkan basin of western Indian margin. J. Geol. Soc. India 2014, 84, 187–191. [Google Scholar] [CrossRef]
  10. Rezaee, M.R.; Ilkhchi, A.K.; Barabadi, A. Prediction of shear wavevelocity from petrophysical data utilizing intelligent systems: An example from a sandstone reservoir of Canarvon Basin, Australia. J. Pet. Sci. Eng. 2007, 55, 201–212. [Google Scholar] [CrossRef] [Green Version]
  11. Asoodeh, M.; Bagheripour, P. Prediction of compressional, shear and stoneley wave velocities from conventional well log data using a committee machine with intelligent systems. Rock Mech. Rock Eng. 2012, 45, 45–63. [Google Scholar] [CrossRef]
  12. Akhundi, H.; Ghafoori, M.; Lashkaripour, G.R. Prediction of shear wave velocity using artificial neural network technique, multiple regression and petrophysical data: A case study in Asmari reservoir (SWIran). Open J. Geol. 2014, 4, 303–313. [Google Scholar] [CrossRef] [Green Version]
  13. Wang, P.; Peng, S. On a new method of estimating shear wave velocity from conventional well logs. J. Pet. Sci. Eng. 2019, 180, 105–123. [Google Scholar] [CrossRef]
  14. Xiong, W.; Ji, X.; Ma, Y. Seismic fault detection with convolutional neural network. Geophysics 2018, 83, O97–O103. [Google Scholar] [CrossRef]
  15. Das, V.; Pollack, A.; Wollner, U.; Mukerji, T. Convolutional neural network for seismic impedance inversion. Geophysics 2019, 84, R869–R880. [Google Scholar] [CrossRef]
  16. Das, V.; Mukerji, T. Petrophysical properties prediction from prestack seismic data using convolutional neural networks. Geophysics 2020, 85, N41–N55. [Google Scholar] [CrossRef]
  17. Wang, K.X.; Huang, Q.H.; Wu, S.H. Application of long short-term memory neural network in geoelectric field data processing. Chin. J. Geophys. 2020, 63, 3015–3024. [Google Scholar]
  18. Pham, N.; Wu, X.M.; Naeini, E.Z. Missing well log prediction using convolutional long short-term memory network. Geophysics 2020, 85, WA159–WA171. [Google Scholar] [CrossRef]
  19. Graves, A.; Mohamed, A.R.; Hinton, G. Speech recognition with deep recurrent neural networks. In Proceedings of the IEEE International Conference on Acoustics, Speech and Signal Processing (ICASSP), Vancouver, BC, Canada, 26–31 May 2013; pp. 6645–6649. [Google Scholar]
  20. Sun, Y.H.; Liu, Y. Prediction of S-wave velocity based on GRU neural network. Oil Geophys. Prospect. 2020, 55, 484–492. [Google Scholar]
  21. Nur, A. Critical porosity and the seismis velocities in rocks. EOS Trans. Am. Geophys. Union 1992, 73, 43–66. [Google Scholar]
  22. Xu, S.; White, R.E. A new velocity model for clay-sand mixture. Geophys. Prospect. 1995, 43, 91–118. [Google Scholar] [CrossRef]
  23. Bai, J.Y.; Yue, C.Q.; Liang, Y.Q.; Song, Z.X.; Ling, S.; Zhang, Y.; Wu, W. Variable aspect ratio method in the Xu-White model for shear-wave velocity estimation. J. Geophys. Eng. 2013, 10, 035008-1–035008-6. [Google Scholar] [CrossRef]
  24. Liu, Z.; Sun, S.Z. The differential Kuster–Toksoz rock physics model for predicting S-wave velocity. J. Geophys. Eng. 2015, 12, 839–848. [Google Scholar] [CrossRef]
  25. Yang, Y.-H.; Gao, G.; Wei, H.-M.; Zhang, J.-Z.; Gui, Z.-X. Application of pre-stack simultaneous inversion in reservoir and fluid identification of the calcareous development zone. Prog. Geophys. 2017, 32, 332–338. (In Chinese) [Google Scholar]
  26. Xu, S.Y.; Payne, M.A. Modeling elastic properties in carbonate rocks. Lead. Edge 2009, 28, 66–74. [Google Scholar] [CrossRef]
  27. Zhang, G.Z.; Li, C.C.; Yin, X.Y.; Zhang, J.Q. Corrected Xu-White model for carbonate S-wave velocity estimation. Oil Geophys. Prospect. 2012, 32, 717–722. (In Chinese) [Google Scholar]
  28. Huang, X.R.; Huang, J.P.; Li, Z.C. Anisotropic seismic rock physics model of tight oil sandstone based on double-porosity theory. Acta Pet. Sin. 2015, 36, 1248–1259. [Google Scholar]
  29. Yuan, H.Z. Study of Anisotropic Rock Physics Model and Application. Ph.D. Thesis, China University of Petroleum, Beijing, China, 2007. [Google Scholar]
  30. Guo, Z.-Q.; Liu, C.; Liu, X.-W.; Dong, N.; Liu, Y.-W. Research on anisotropy of shale oil reservoir based on rock physics model. Appl. Geophys. 2016, 13, 382–392. [Google Scholar] [CrossRef]
  31. Chen, S.; Zhong, Q.; Li, Z.; Zhang, M.; Zhao, X.; Li, X. Petrophysical modeling of horizontal bedding-parallel fractures and its seismic response characteristics. Oil Gas Geol. 2020, 41, 1273–1281, 1287. [Google Scholar] [CrossRef]
  32. Hudson, J.A. Overall properties of a cracked solid. Math. Proc. Camb. Philos. Soc. 1980, 88, 371–384. [Google Scholar] [CrossRef]
  33. Hudson, J.A. Wave speeds and attenuation of elastic waves in material containing cracks. Geophys. J. R. Astron. Soc. 1981, 64, 133–150. [Google Scholar] [CrossRef]
  34. Kumar, M.; Han, D. Pore shape effect on elastic properties of carbonate rocks. SEG Tech. Program Expand. Abstraetsl 2005, 24, 1477–1480. [Google Scholar]
  35. Zhang, G.-Z.; Chen, H.-Z.; Wang, Q.; Yin, X.-Y. Estimation of S-wave velocity and anisotropic parameters using fractured carbonate rock physics model. Chin. J. Geophys. 2013, 56, 1707–1715. (In Chinese) [Google Scholar] [CrossRef]
  36. Chen, H.-Z.; Yin, X.-Y.; Gao, J.-H.; Liu, B.-Y.; Zhang, G.-Z. Seismic inversion for underground fractures detection based on effective anisotropy and fluid substitution. Sci. China Earth Sci. 2015, 58, 805–814. [Google Scholar] [CrossRef]
  37. Thomsen, L. Weak elastic anisotropy. Geophysics 1986, 51, 1954–1966. [Google Scholar] [CrossRef]
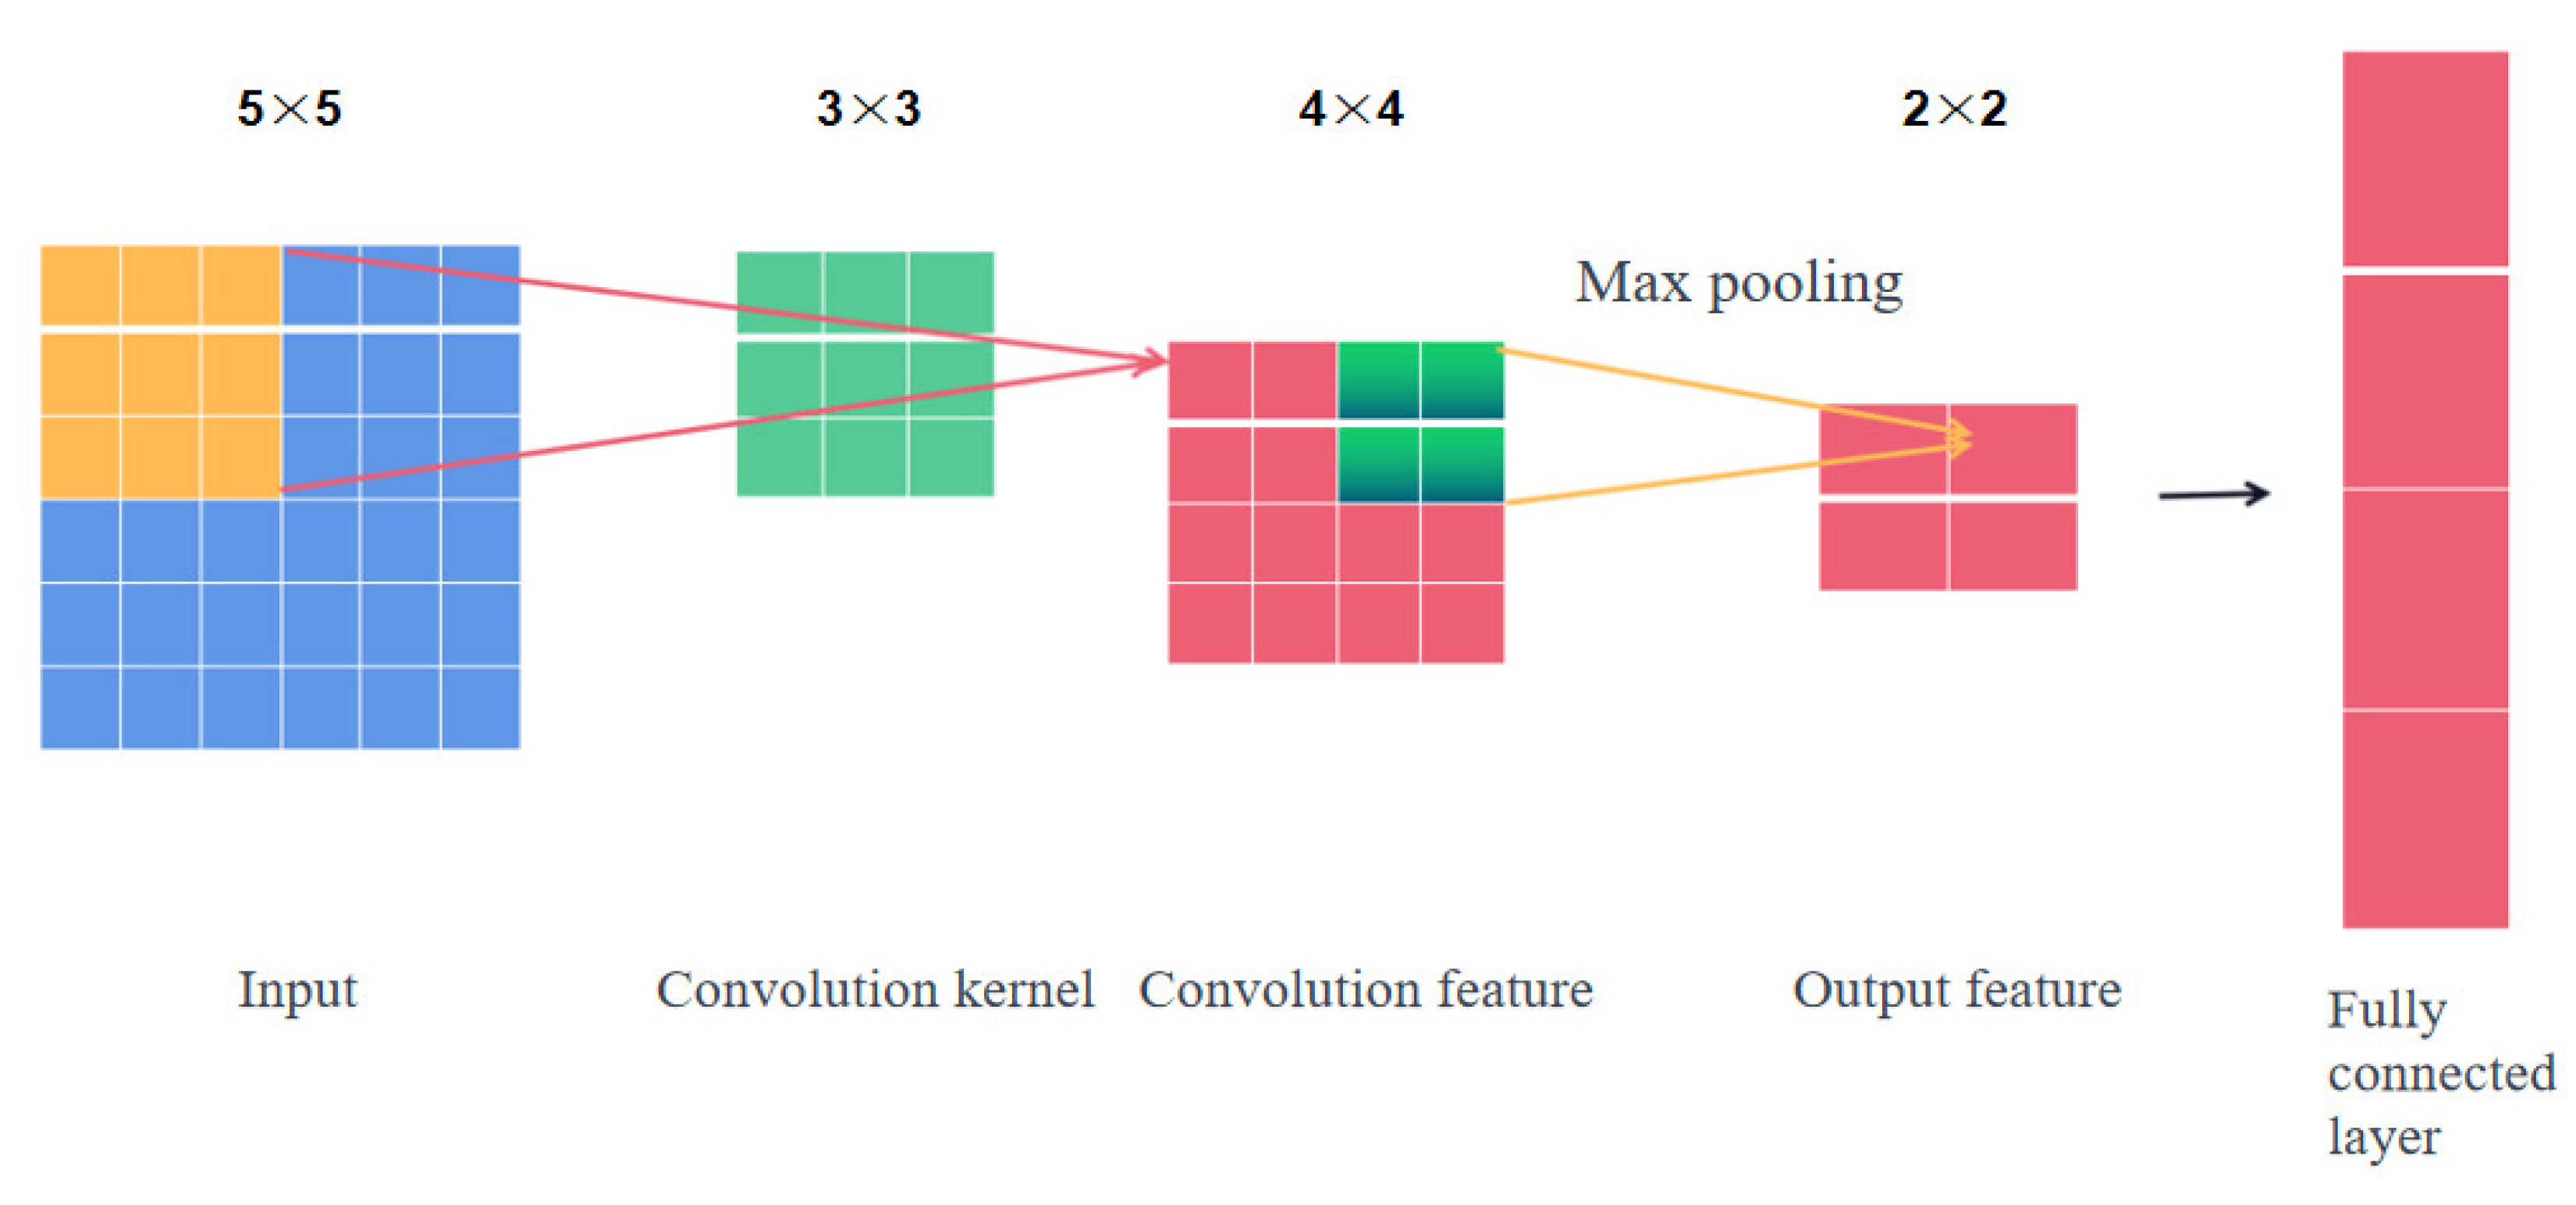
Figure 1. The structure of CNN and its expanded network.
Processes 11 02356 g001
Figure 2. Process for Predicting Anisotropic Parameters with Dual Constraints of Compressional and Shear Wave Velocities.
Processes 11 02356 g002
Figure 3. Plot of compressional and shear wave velocities with respect to quartz pore aspect ratio ( α 1 ).
Processes 11 02356 g003
Figure 4. Plot of compressional and shear wave velocities with respect to the clay pore aspect ratio ( α 2 ).
Processes 11 02356 g004
Figure 5. The objective functions of the singleconstraint of compressional wave velocity and the dual constraint of compressional and shear wave velocities were compared for variations in the quartz and clay pore aspect ratios and crack density.
Processes 11 02356 g005
Figure 6. Convolutional neural network shear wave velocity prediction results.
Processes 11 02356 g006
Figure 7. A comparison between predicting anisotropic parameters using the dual constraints of shear and compressional wave velocities and predicting anisotropic parameters using only the compressional wave velocity constraint (single constraint).
Processes 11 02356 g007
Table 1. Comparison of anisotropic parameters predicted by compressional wave velocity single-constraint and compressional—shear wave velocities dual constraint.
VpVs φ ρ e Δ N Δ T α 1 α 2
Actual Data4015226800.12382.16240.010.04710.02320.150.03
Dual Constraint412127610.12382.16240.0090.04310.02090.130.05
Single Constraint422028150.12382.16240.0030.01450.0070.10.08
Disclaimer/Publisher’s Note: The statements, opinions and data contained in all publications are solely those of the individual author(s) and contributor(s) and not of MDPI and/or the editor(s). MDPI and/or the editor(s) disclaim responsibility for any injury to people or property resulting from any ideas, methods, instructions or products referred to in the content.