
Removal of Cd2+ and Pb2+ from an Aqueous Solution Using Modified Coal Gangue: Characterization, Performance, and Mechanisms


Abstract
:1. Introduction
2. Experimental Section
2.1. Materials
2.2. Preparation of Modified Coal Gangue
2.3. Adsorption of Cd2+ and Pb2+ in Aqueous Solution
2.3.1. Adsorption Capacity Test
2.3.2. Adsorption Kinetic Test
2.4. Modified CG Characterization
3. Results and Discussion
3.1. Properties of Modified CG Samples
3.2. Adsorption of Cd2+ and Pb2+ by Modified CG Samples
3.2.1. Adsorption Capacity
3.2.2. Adsorption Kinetics
3.3. Adsorption Mechanism
3.3.1. XRD
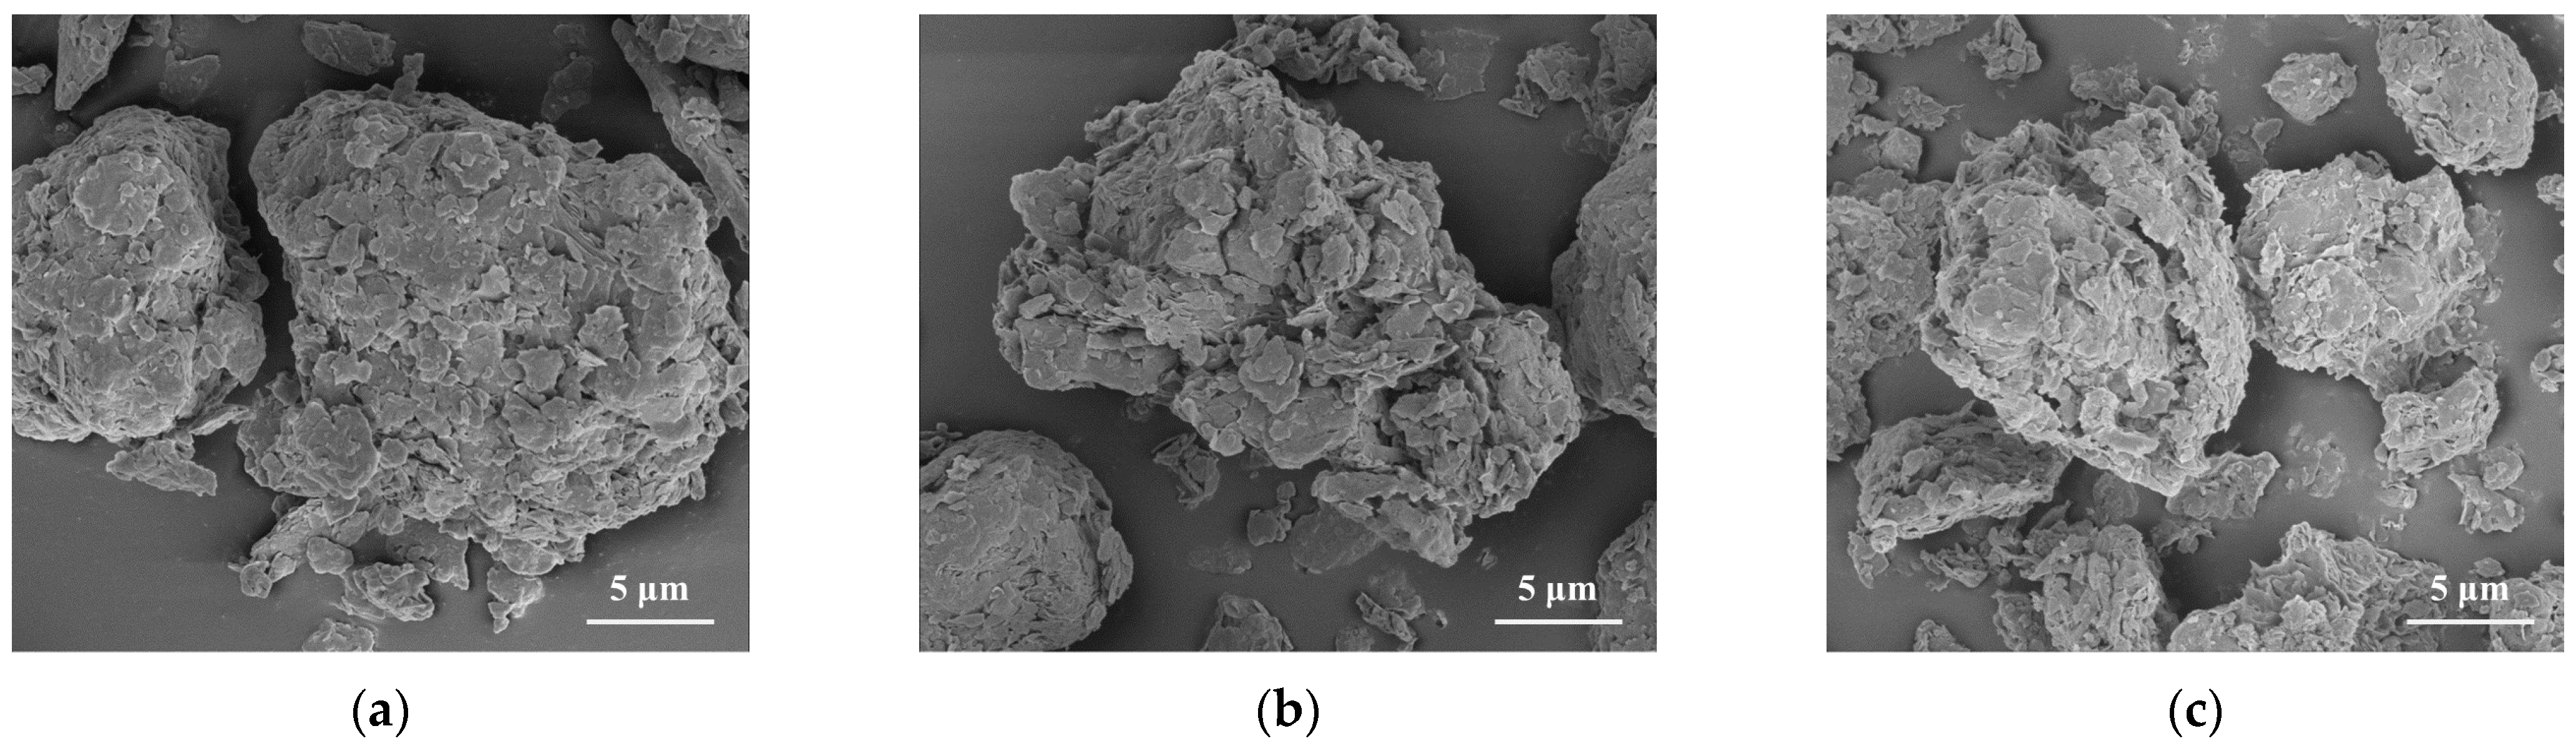
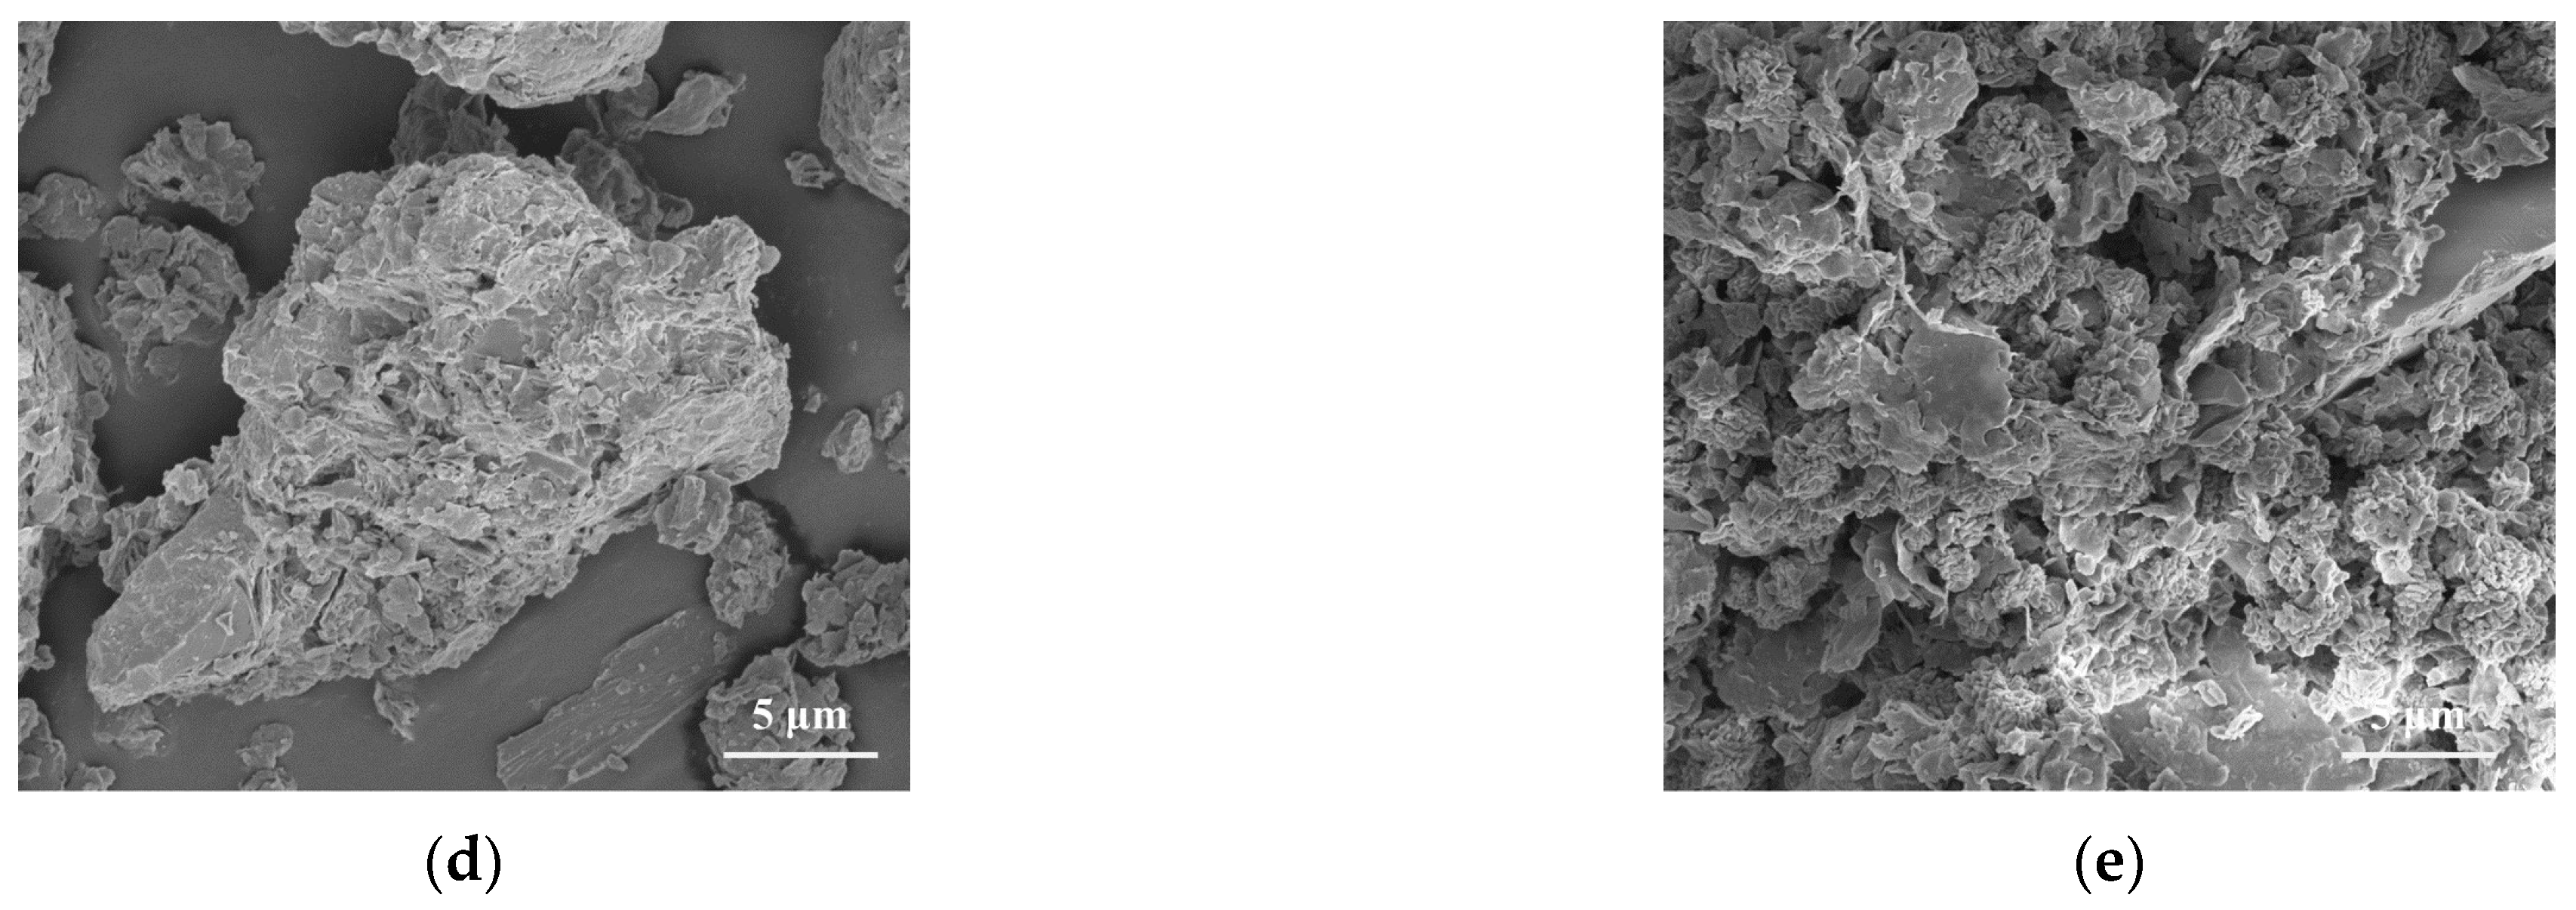
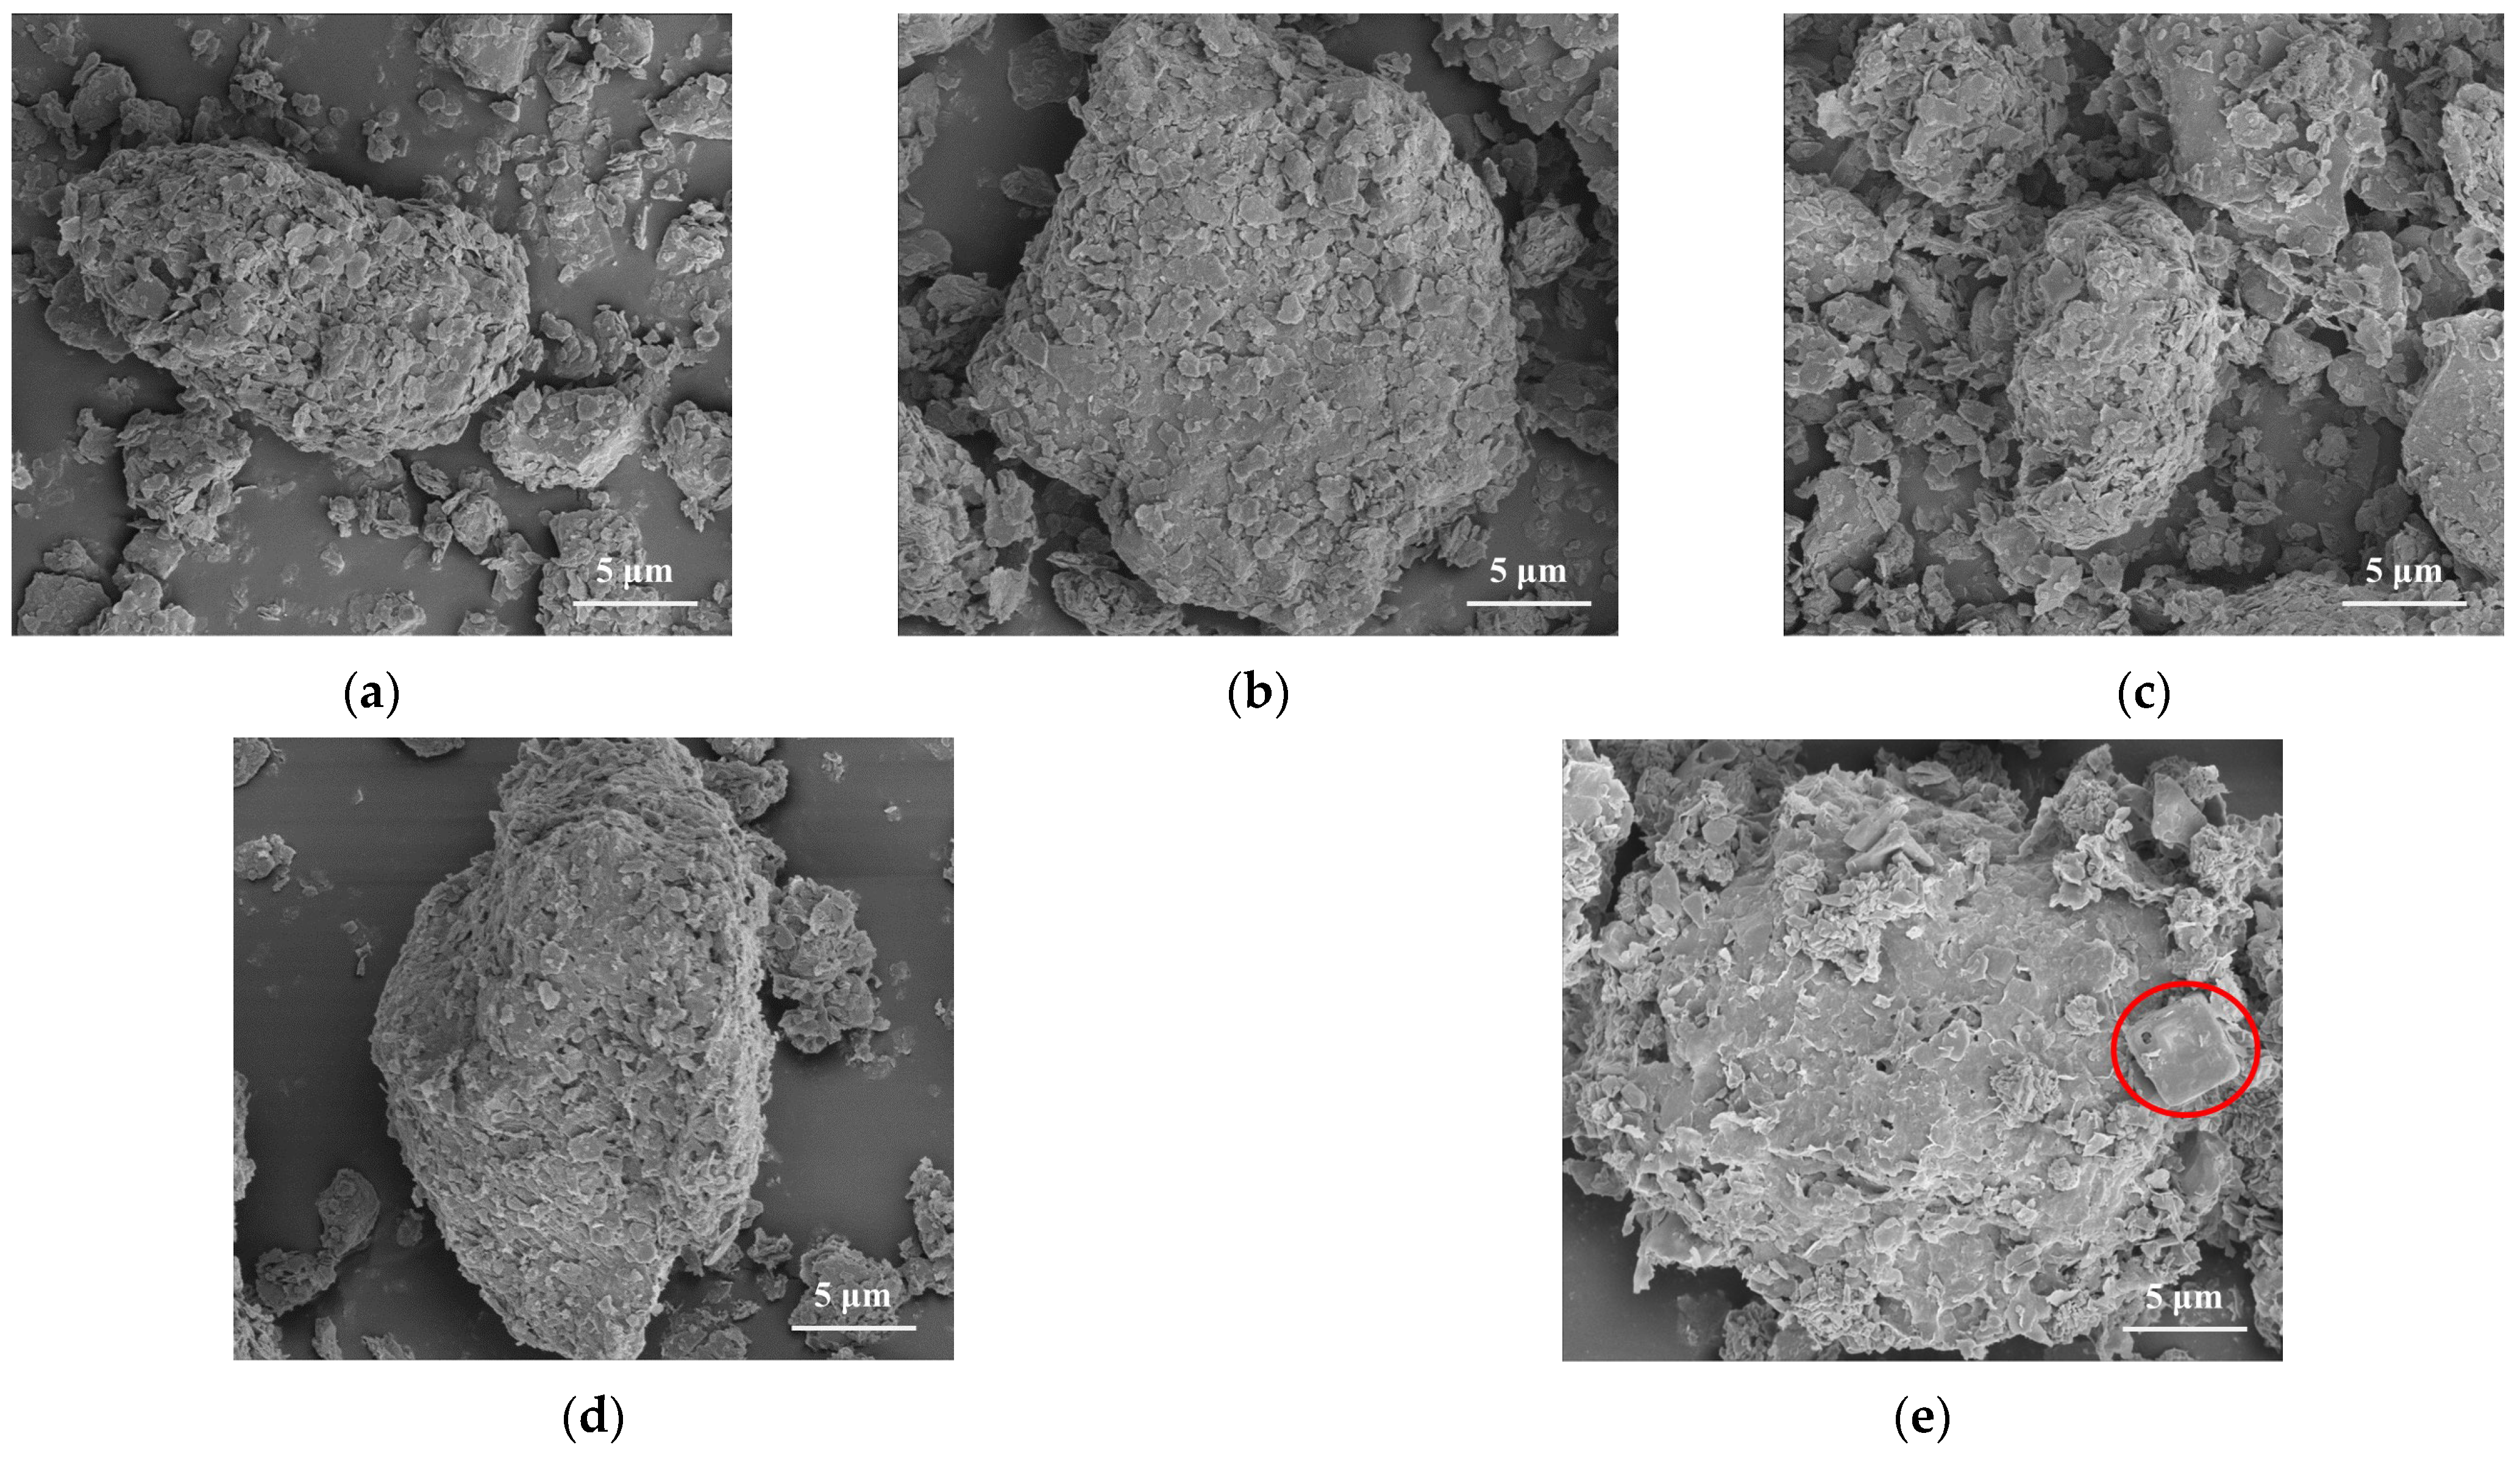
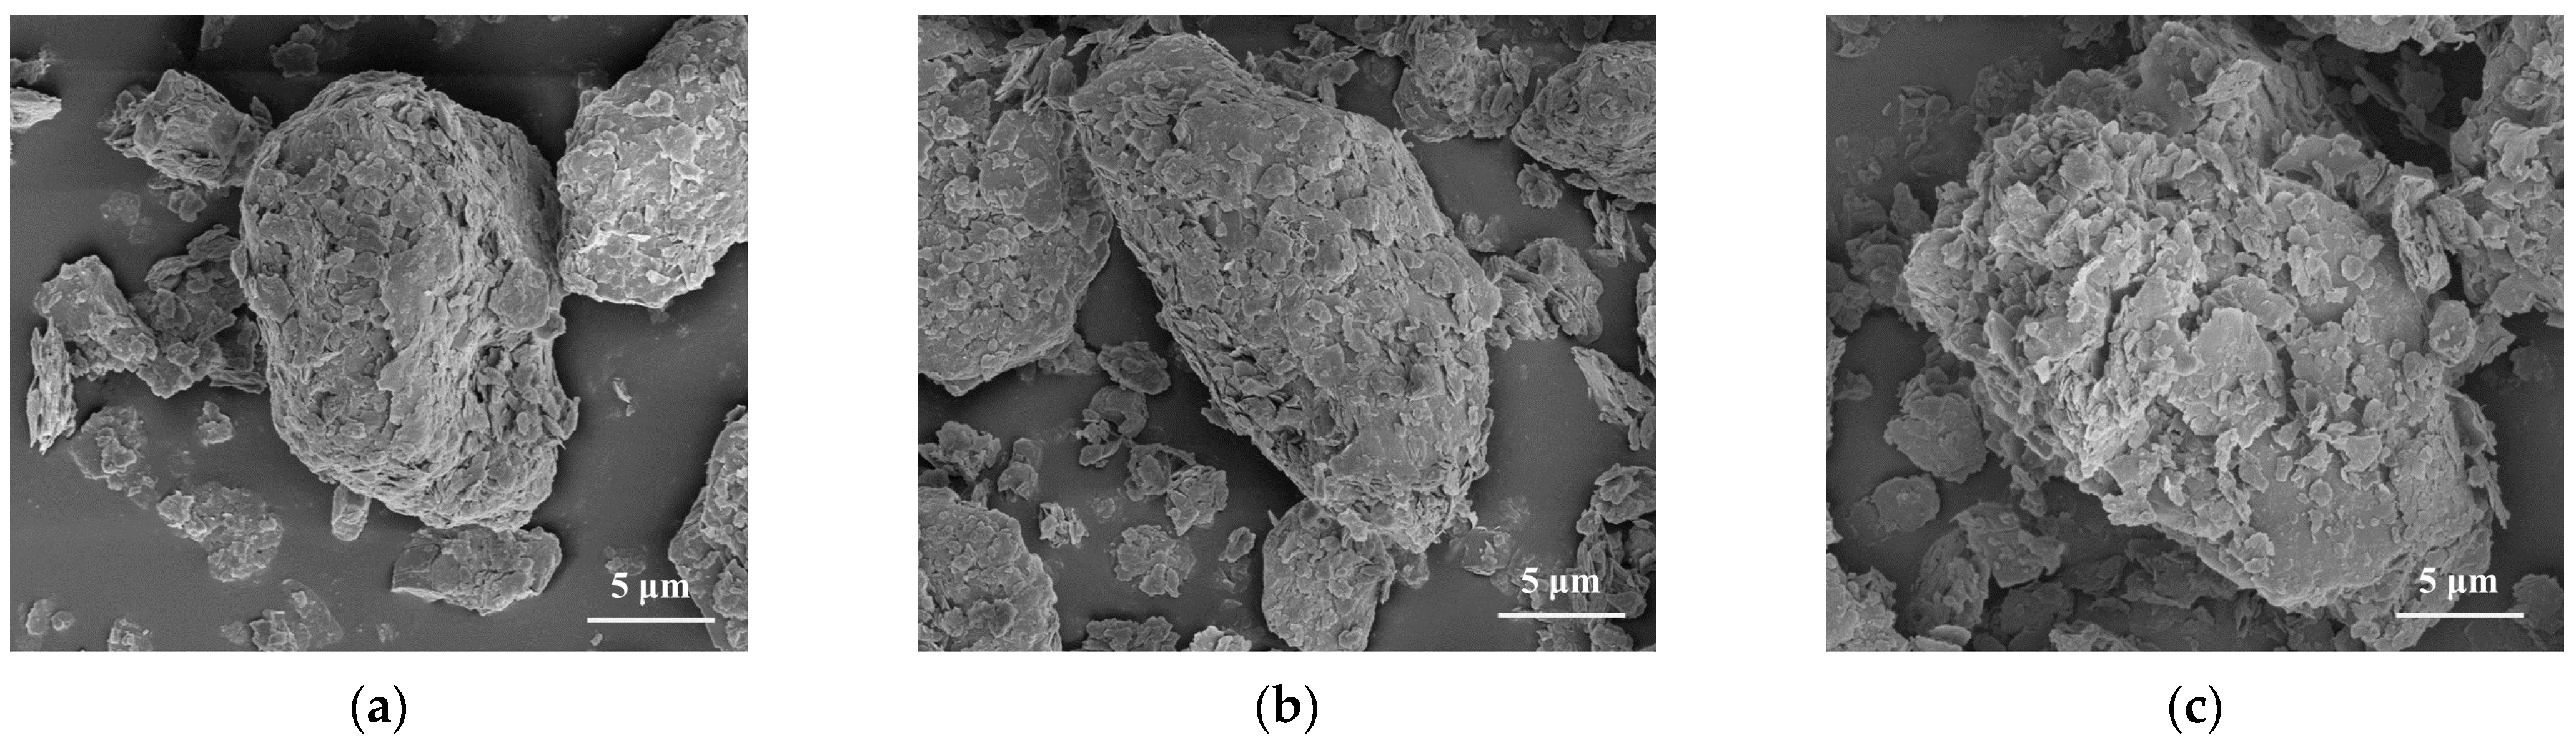
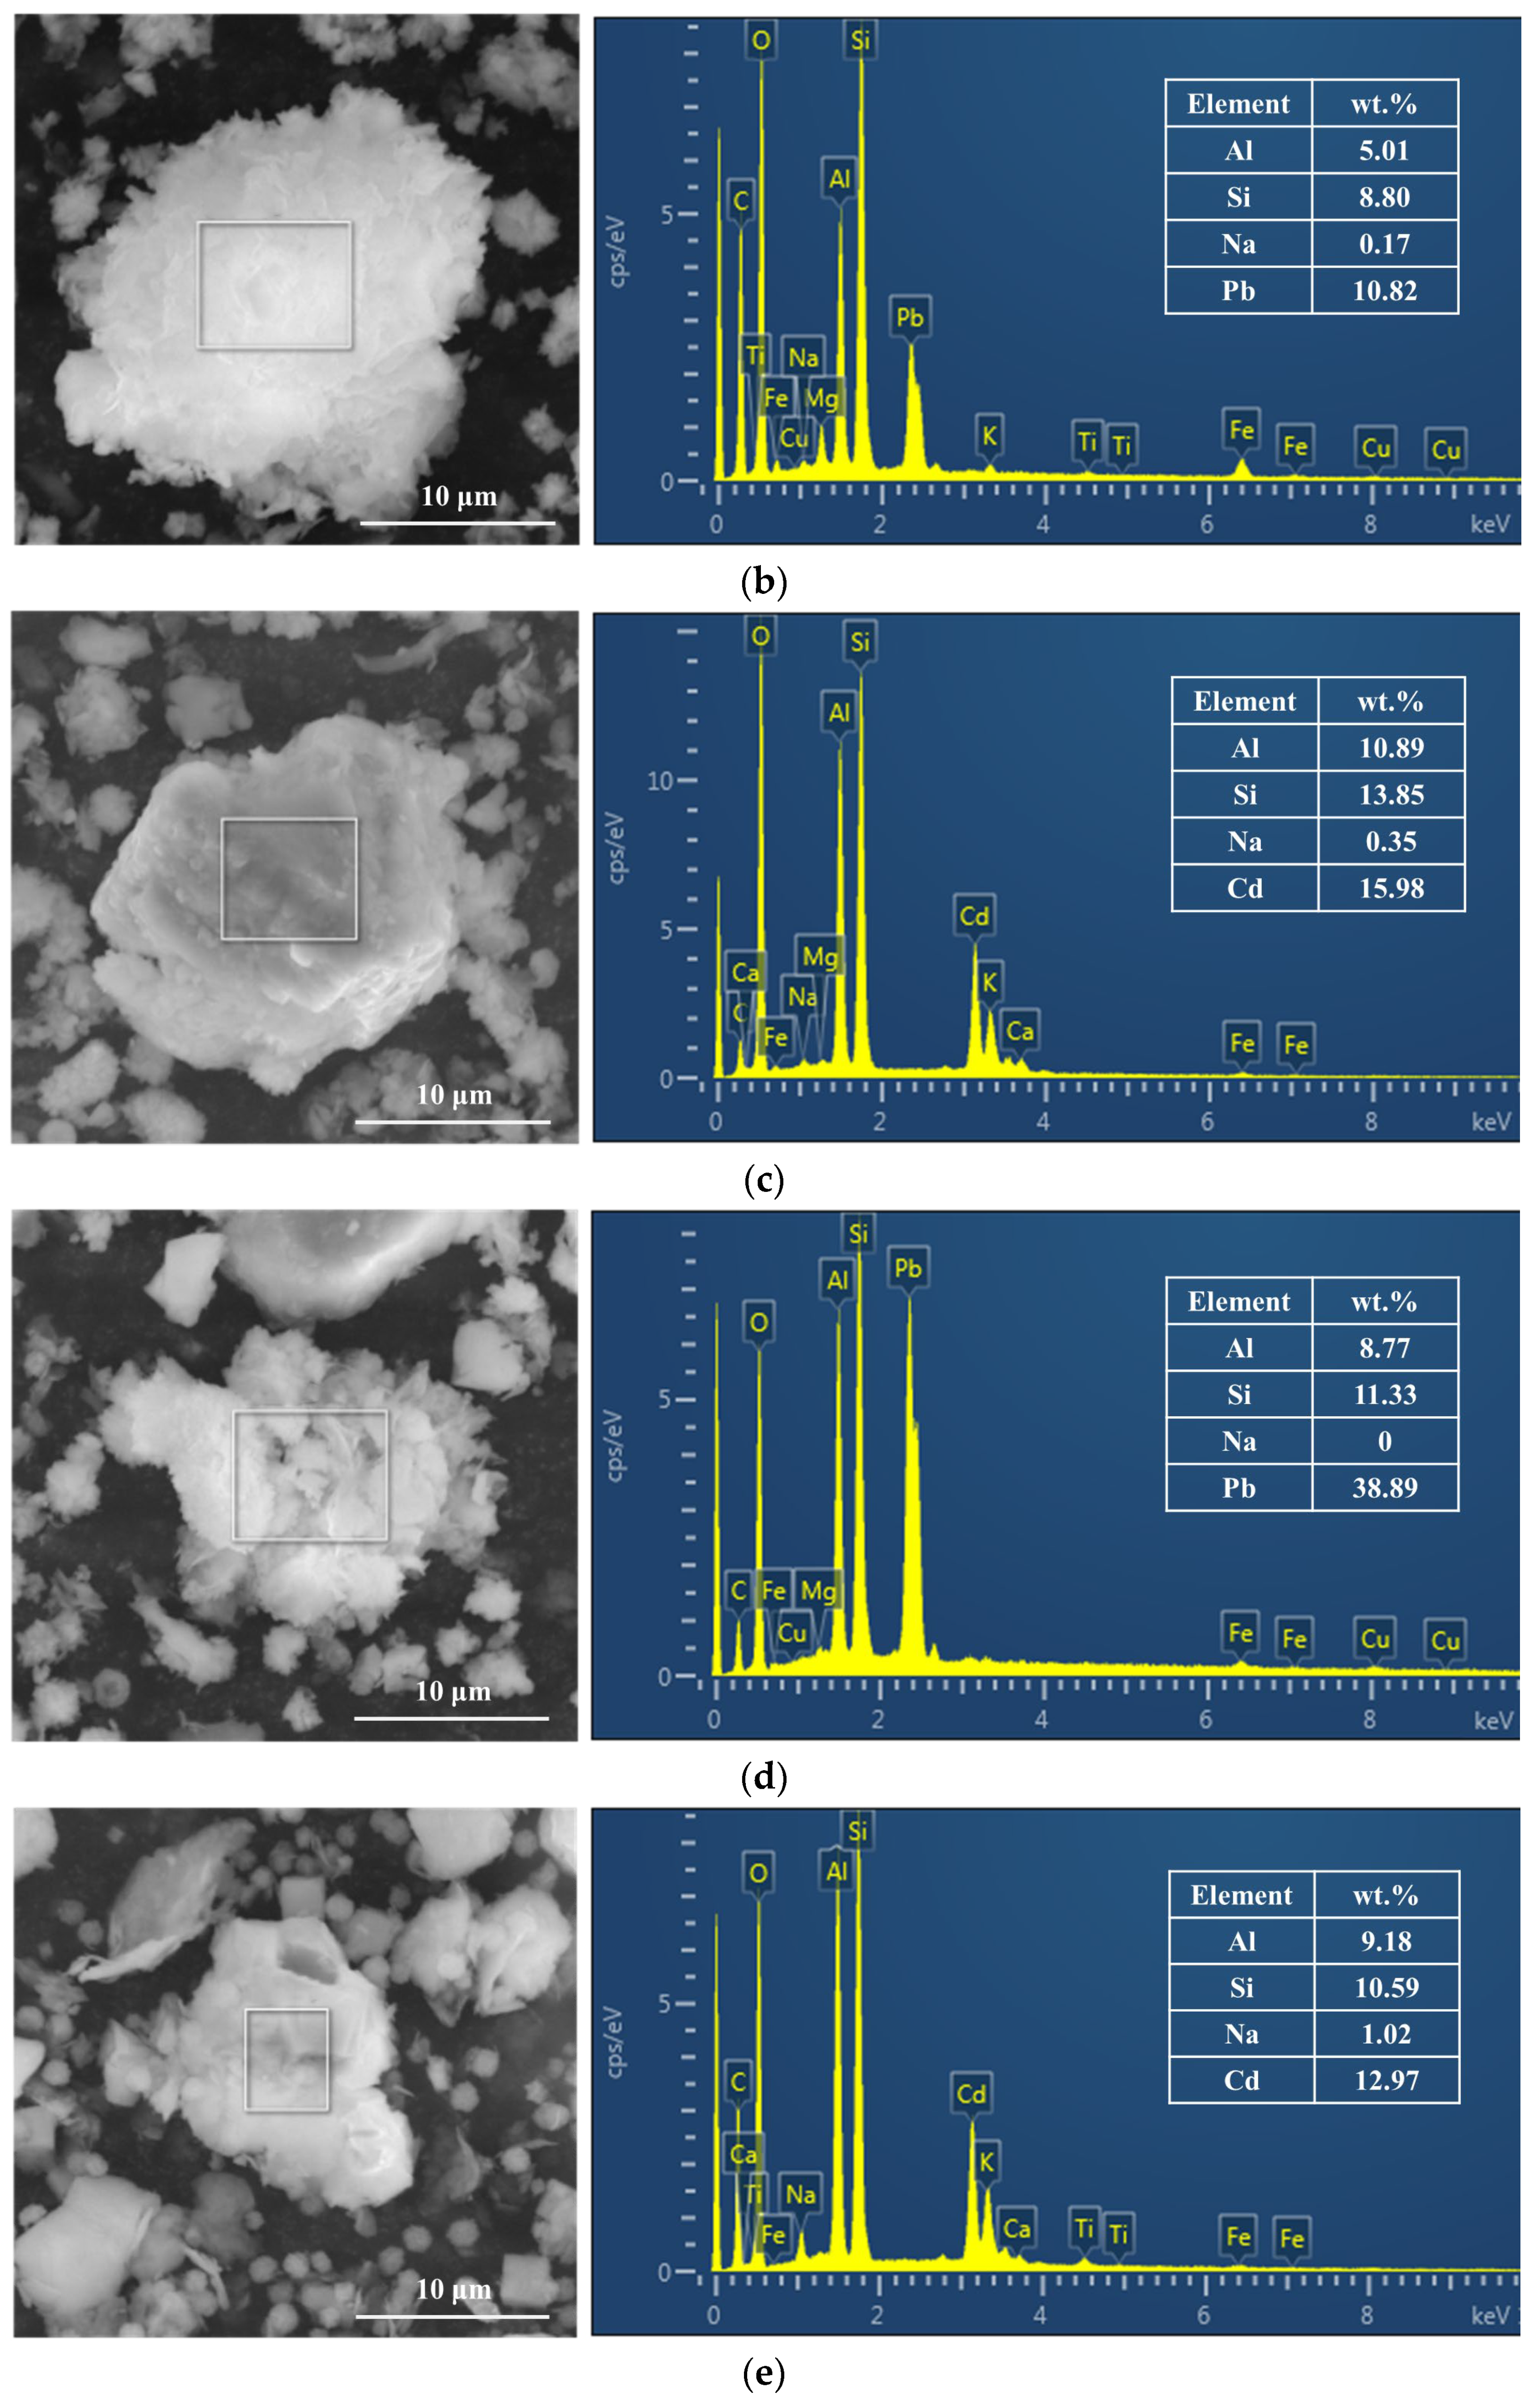
3.3.2. SEM-EDX
3.3.3. N2 Adsorption–Desorption
3.3.4. FTIR
3.4. Limitations and Implications of This Study
4. Conclusions
- (1)
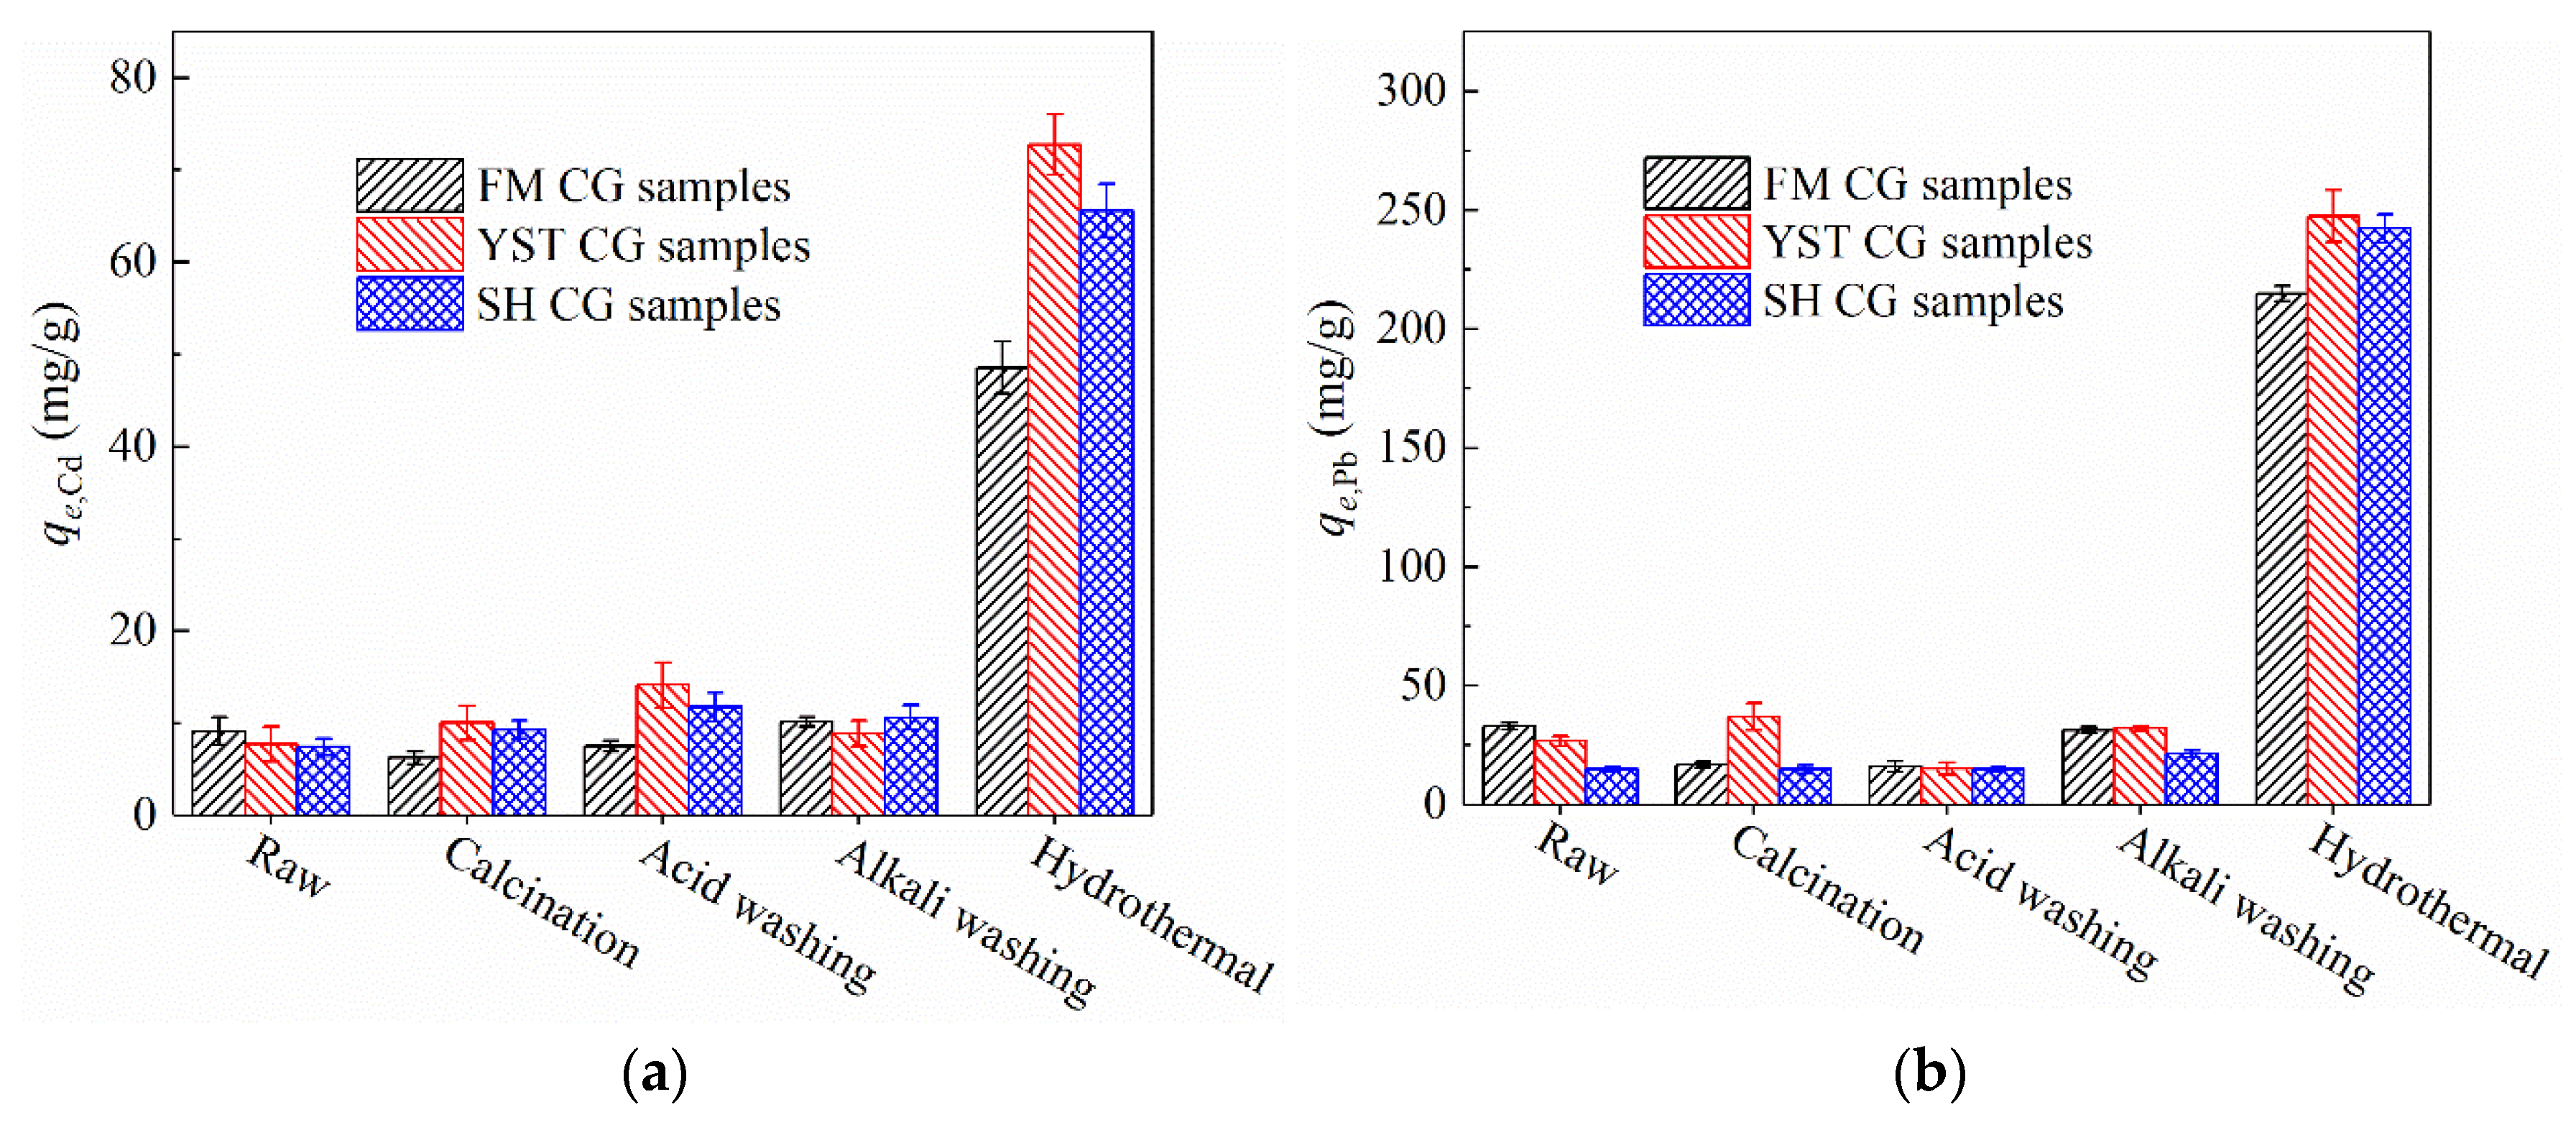
- The initial adsorption capacities of the unmodified CG samples for Cd2⁺ and Pb2⁺ were approximately 10 and 25 mg/g, respectively. These values remain largely unchanged following calcination, acid washing, and alkali washing. In contrast, hydrothermal treatment produces NaP and NaA zeolites, leading to substantial increases in the adsorption capacities for Cd2⁺ and Pb2⁺, reaching values of 48.5–72.7 and 214.9–247.5 mg/g, respectively.
- (2)
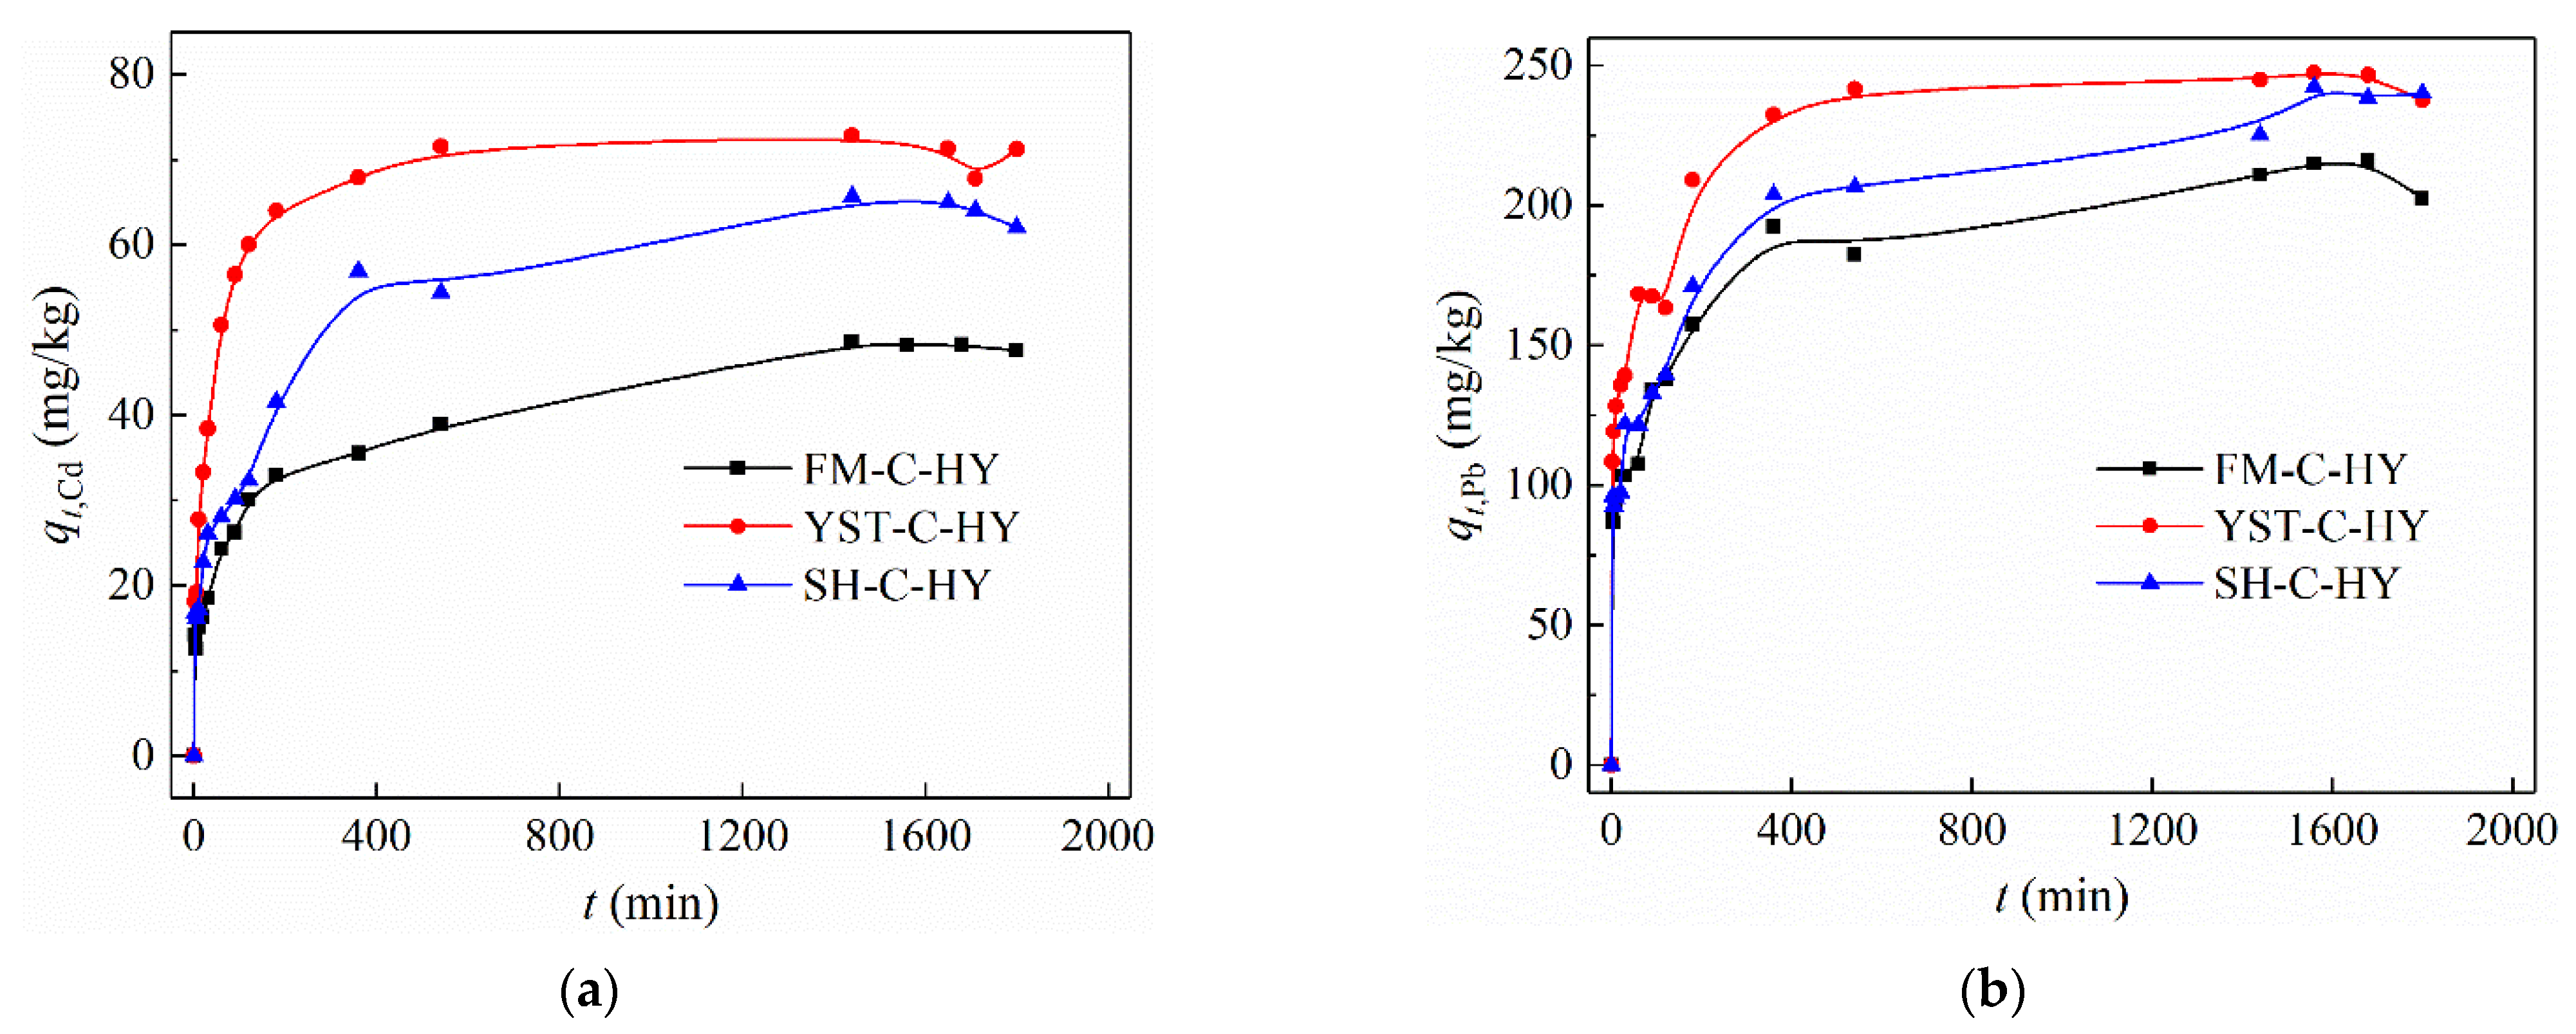
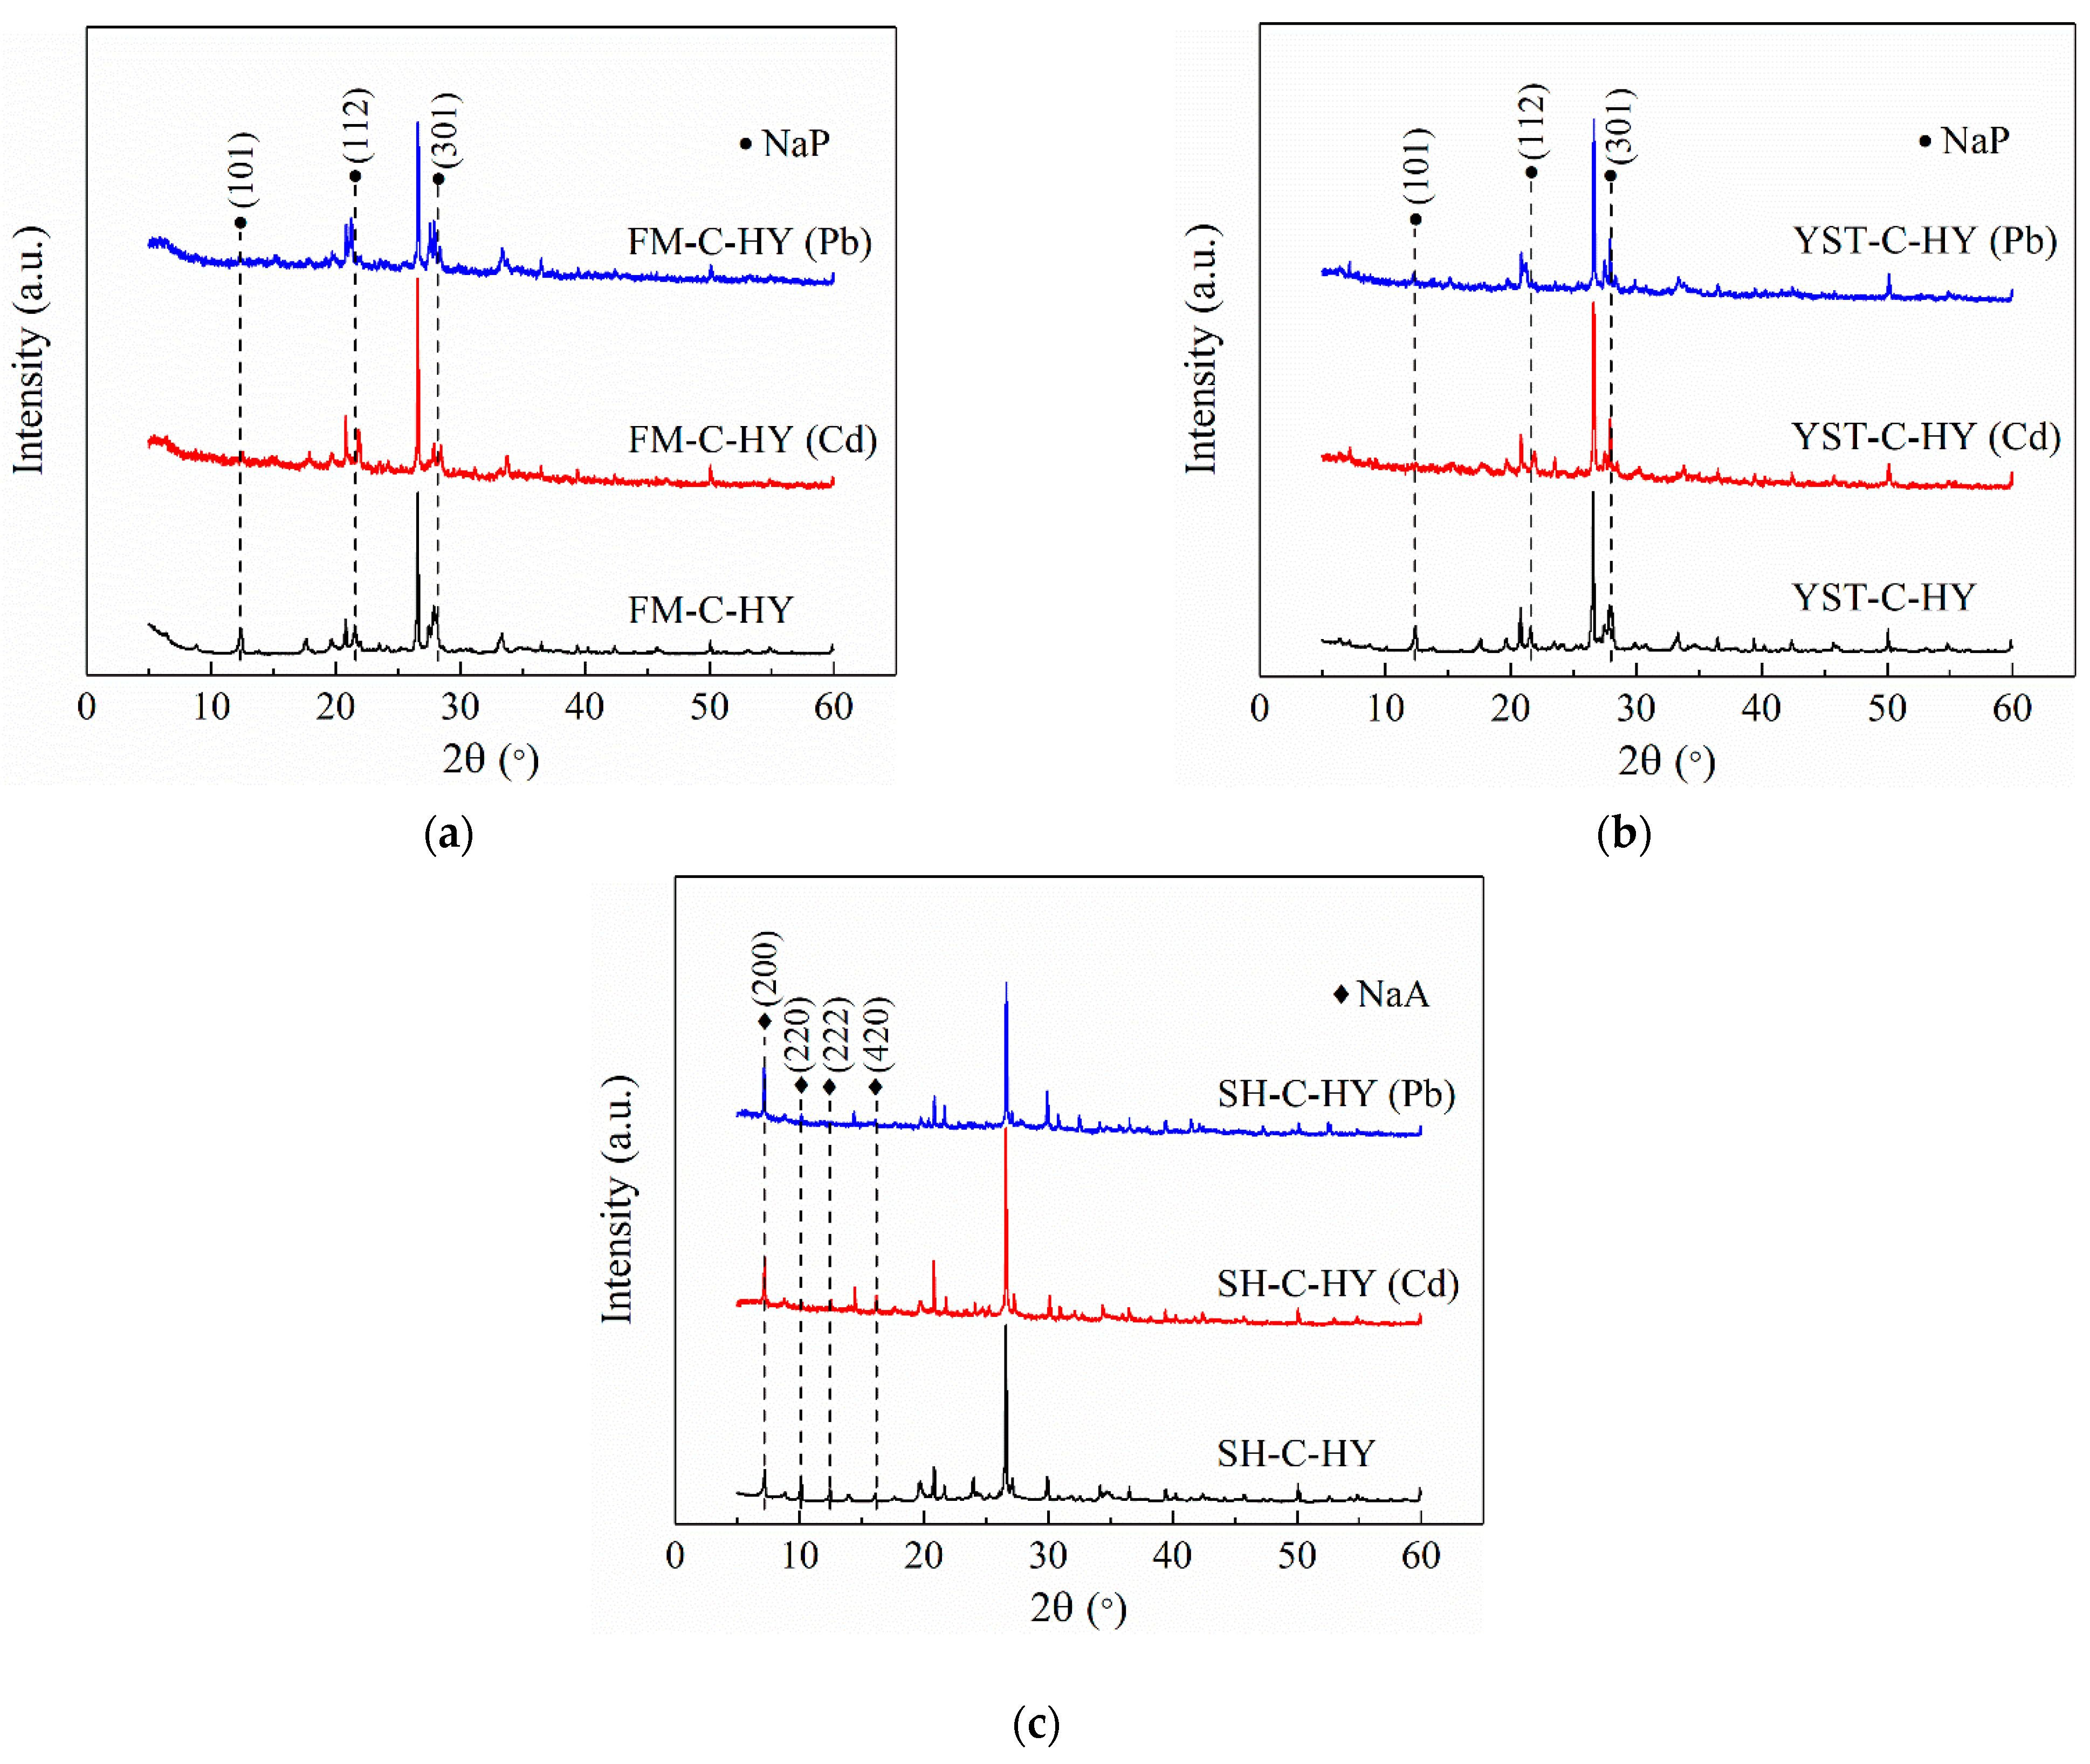
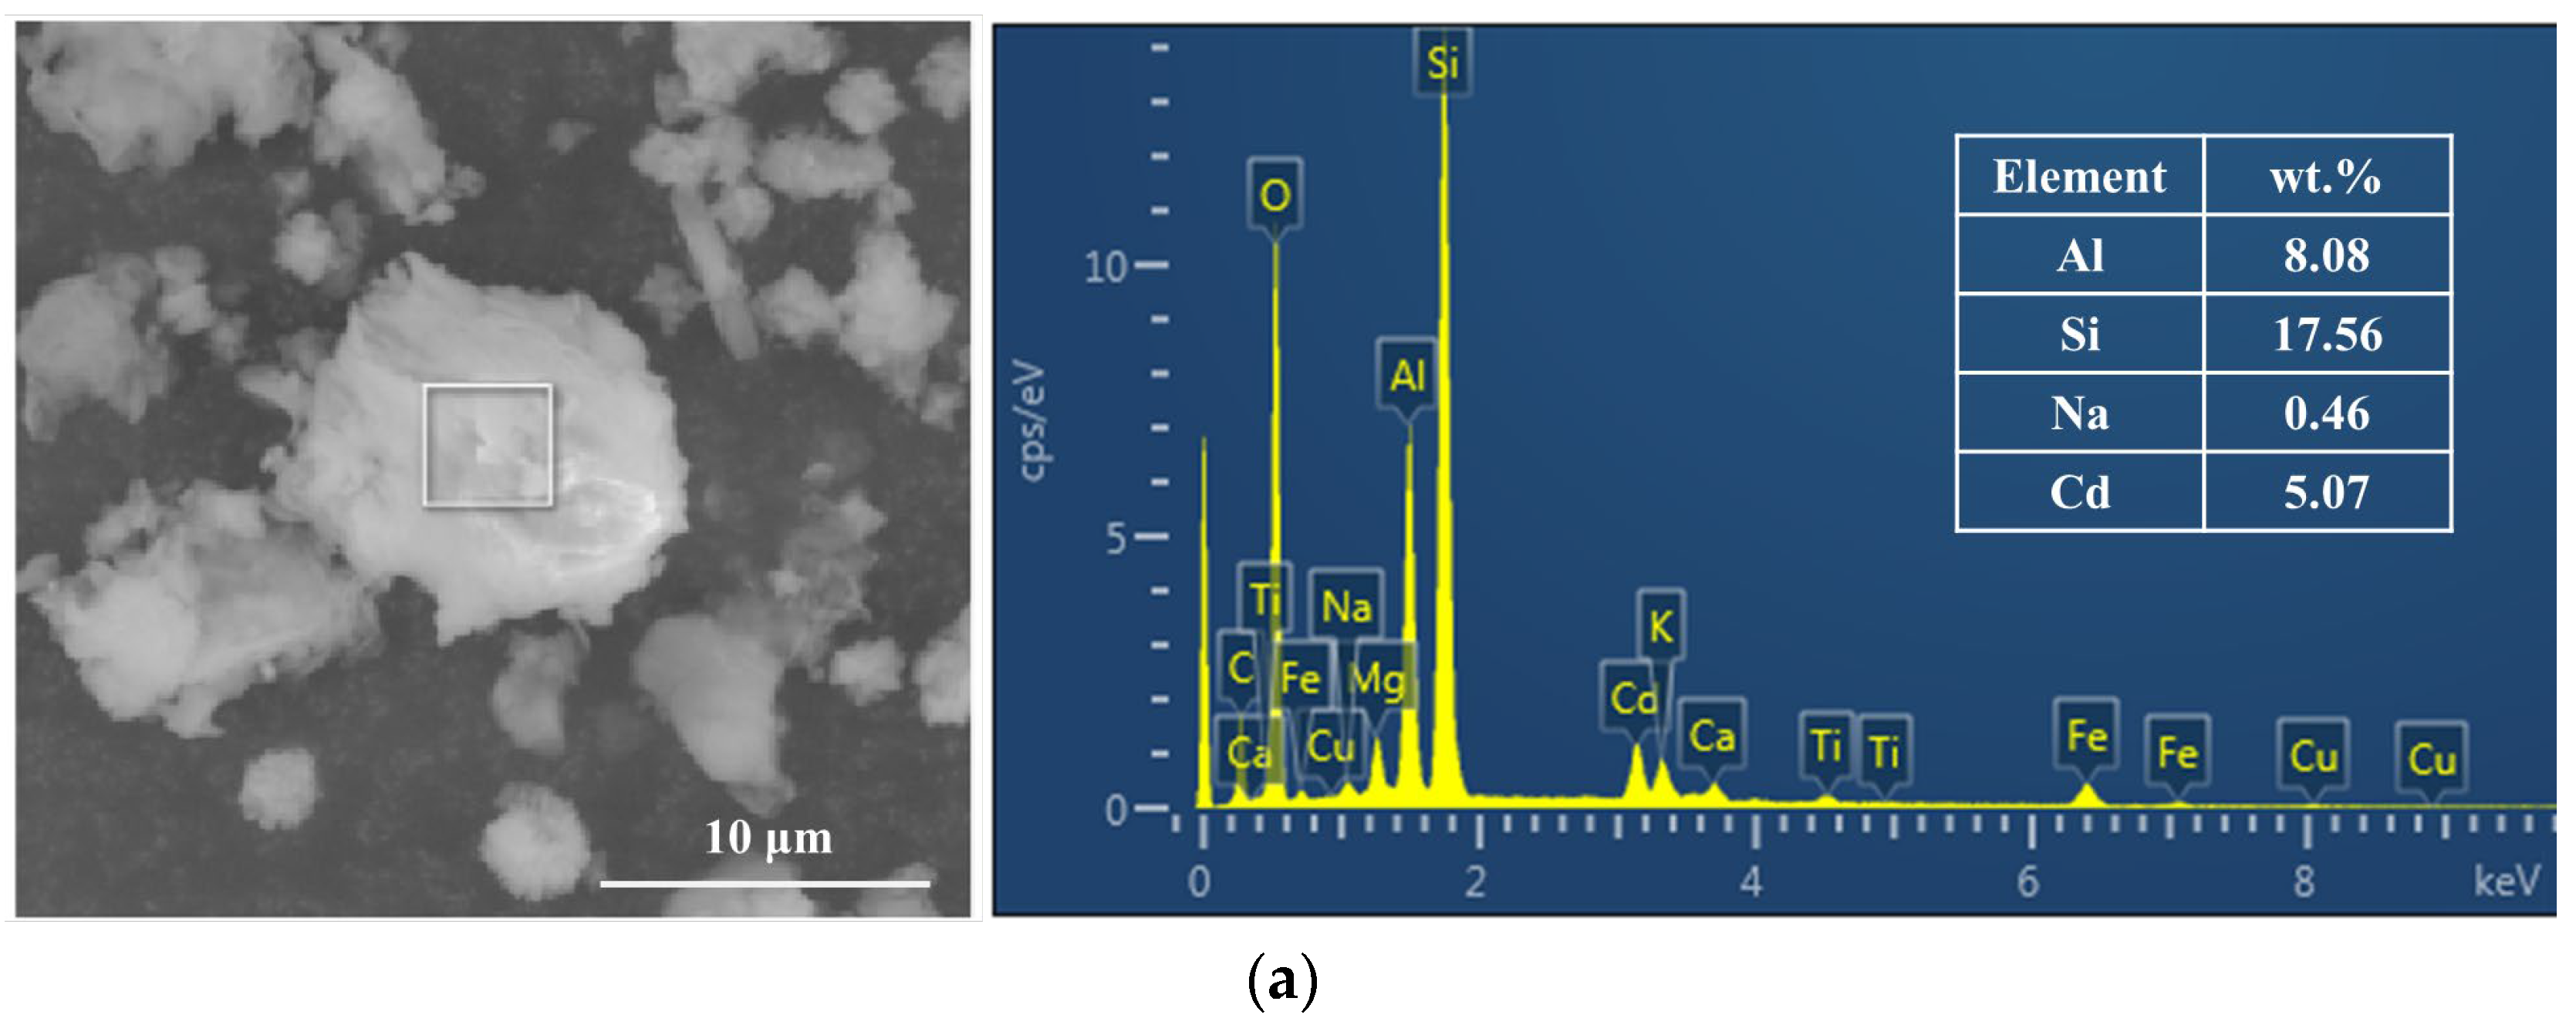
- Hydrothermally modified CG samples primarily remove Cd2⁺ and Pb2⁺ through ion exchange with Na⁺ within the zeolite framework, facilitating the ingress of these ions into the zeolite’s pore channels. The adsorption data are well described by the pseudo-second-order kinetic model, indicating that chemisorption is the dominant mechanism.
- (3)
- The study highlights the effective removal of Cd2⁺ and Pb2⁺ by hydrothermally modified CG samples, establishing hydrothermal treatment as an efficient and cost-effective modification strategy. Future research should aim at optimizing the hydrothermal process and exploring methods to increase the number of adsorption sites on the CG samples.
Author Contributions
Funding
Data Availability Statement
Conflicts of Interest
References
- Mahmoud, E.R.I.; Aly, H.M.; Hassan, N.A.; Aljabri, A.; Khan, A.L.; El-Labban, H.F. Biochar from date palm waste via two-step pyrolysis: A modified approach for Cu (II) removal from aqueous solutions. Processes 2024, 12, 1189. [Google Scholar] [CrossRef]
- Zuo, J.; Ren, J.; Jiang, L.; Tan, C.; Li, J.; Xia, Z.; Wang, W. Preparation of PVA/SA-FMB microspheres and their adsorption of Cr(VI) in aqueous solution. Processes 2024, 12, 443. [Google Scholar] [CrossRef]
- Zheng, L.; Peng, D.; Meng, P. Promotion effects of nitrogenous and oxygenic functional groups on cadmium (II) removal by carboxylated corn stalk. J. Clean Prod. 2018, 201, 609–623. [Google Scholar] [CrossRef]
- Liu, L.; Huang, Y.; Zhang, S.; Gong, Y.; Su, Y.; Cao, J.; Hu, H. Adsorption characteristics and mechanism of Pb(II) by agricultural waste-derived biochars produced from a pilot-scale pyrolysis system. Waste Manag. 2019, 100, 287–295. [Google Scholar] [CrossRef]
- Ge, Q.; Moeen, M.; Tian, Q.; Xu, J.; Feng, K. Highly effective removal of Pb2+ in aqueous solution by Na-X zeolite derived from coal gangue. Environ. Sci. Pollut. Res. 2020, 27, 7398–7408. [Google Scholar] [CrossRef]
- Bu, N.; Liu, X.; Song, S.; Liu, J.; Yang, Q.; Li, R.; Zheng, F.; Yan, L.; Zhen, Q.; Zhang, J. Synthesis of NaY zeolite from coal gangue and its characterization for lead removal from aqueous solution. Adv. Powder Technol. 2020, 31, 2699–2710. [Google Scholar] [CrossRef]
- Zhang, X.; Li, C.; Zheng, S.; Di, Y.; Sun, Z. A review of the synthesis and application of zeolites from coal-based solid wastes. Int. J. Miner. Metall. Mater. 2022, 29, 1–21. [Google Scholar] [CrossRef]
- Shakoor, M.B.; Shafaqat, A.; Muhammad, R.; Farhat, A.; Irshad, B.; Muhammad, R.; Usman, K.; Nabeel, K.N.; Jörg, R. A review of biochar-based sorbents for separation of heavy metals from water. Int. J. Phytoremediat. 2019, 22, 111–126. [Google Scholar] [CrossRef]
- Otunola, B.O.; Ololade, O.O. A review on the application of clay minerals as heavy metal adsorbents for remediation purposes. Env. Technol. Innov. 2020, 18, 100692. [Google Scholar] [CrossRef]
- Jabłońska, B.; Kityk, A.V.; Busch, M.; Huber, P. The structural and surface properties of natural and modified coal gangue. J. Env. Manag. 2017, 190, 80–90. [Google Scholar] [CrossRef]
- Qiu, R.; Cheng, F. Modification of waste coal gangue and its application in the removal of Mn2+ from aqueous solution. Water Sci. Technol. 2016, 74, 524–534. [Google Scholar] [CrossRef] [PubMed]
- Yang, K.; Hu, L.; Zhu, J.; Luo, Z.; Zhang, Z.; He, J.; Chen, X. Adsorption performance of calcined coal gangue for ethyl mercaptan. Energy Sources Part A Recovery Util. Environ. Eff. 2023, 45, 4050–4063. [Google Scholar] [CrossRef]
- Qiu, R.; Cheng, F.; Huang, H. Removal of Cd2+ from aqueous solution using hydrothermally modified circulating fluidized bed fly ash resulting from coal gangue power plant. J. Clean Prod. 2018, 172, 1918–1927. [Google Scholar] [CrossRef]
- Gao, Y.; Huang, J.; Li, M.; Dai, Z.; Jiang, R.; Zhang, J. Chemical modification of combusted coal gangue for U(Vi) adsorption: Towards a waste control by waste strategy. Sustainability 2021, 13, 8421. [Google Scholar] [CrossRef]
- Peng, L.; Wang, R.; Cheng, H.; Zhang, L.; He, Y.; Yin, C.; Zhang, X. Investigation on the adsorption performance of modified coal gangues to p-hydroxybenzenesulfonic acid. Korean J. Chem. Eng. 2023, 40, 1767–1774. [Google Scholar] [CrossRef]
- Li, Z.; Wu, L.; Sun, S.; Gao, J.; Zhang, H.; Zhang, Z.; Wang, Z. Disinfection and removal performance for escherichia coli, toxic heavy metals and arsenic by wood vinegar-modified zeolite. Ecotoxicol. Env. Saf. 2019, 174, 129–136. [Google Scholar] [CrossRef]
- Shang, Z.; Zhang, L.W.; Zhao, X.; Liu, S.; Li, D. Removal of Pb(II), Cd(II) and Hg(II) from aqueous solution by mercapto-modified coal gangue. J. Env. Manag. 2019, 231, 391–396. [Google Scholar] [CrossRef]
- Zhang, X.; Li, M.; Su, Y.; Du, C. A novel and green strategy for efficient removing Cr(VI) by modified kaolinite-rich coal gangue. Appl. Clay Sci. 2021, 211, 106208. [Google Scholar] [CrossRef]
- Jin, Y.; Li, L.; Liu, Z.; Zhu, S.; Wang, D. Synthesis and characterization of low-cost zeolite NaA from coal gangue by hydrothermal method. Adv. Powder Technol. 2021, 32, 791–801. [Google Scholar] [CrossRef]
- Zhou, J.; Zheng, F.; Li, H.; Wang, J.; Bu, N.; Hu, P.; Gao, J.; Zhen, Q.; Bashir, S.; Louise Liu, J. Optimization of post-treatment variables to produce hierarchical porous zeolites from coal gangue to enhance adsorption performance. Chem. Eng. J. 2020, 381, 122698. [Google Scholar] [CrossRef]
- GB/T 212-2008; General Administration of Quality Supervision, Inspection and Quarantine of the People’s Republic of China, Proximate Analysis of Coal. National Standards of the People’s Republic of China: Beijing, China, 2008.
- Watanabe, H.; Ohmori, H. Dual-wavelength spectrophotometric determination of Cadmium with cadion. Talanta 1979, 26, 959–961. [Google Scholar] [CrossRef] [PubMed]
- Inada, M.; Eguchi, Y.; Enomoto, N.; Hojo, J. Synthesis of zeolite from coal fly ashes with different silica-alumina composition. Fuel 2005, 84, 299–304. [Google Scholar] [CrossRef]
- Zhang, X.; Tang, D.; Zhang, M.; Yang, R. Synthesis of NaX zeolite: Influence of crystallization time, temperature and batch molar ratio SiO2/Al2O3 on the particulate properties of zeolite crystals. Powder Technol. 2013, 235, 322–328. [Google Scholar] [CrossRef]
- Jin, Y.; Liu, Z.; Han, L.; Zhang, Y.; Li, L.; Zhu, S.; Li, Z.P.J.; Wang, D. Synthesis of coal-analcime composite from coal gangue and its adsorption performance on heavy metal ions. J. Hazard Mater. 2022, 423, 127027. [Google Scholar] [CrossRef]
- Liang, Z.; Gao, Q.; Wu, Z.; Gao, H. Removal and kinetics of cadmium and copper ion adsorption in aqueous solution by zeolite NaX synthesized from coal gangue. Environ. Sci. Pollut. Res. 2022, 29, 84651–84660. [Google Scholar] [CrossRef] [PubMed]
- Wingenfelder, U.; Nowack, B.; Furrer, G.; Schulin, R. Adsorption of Pb and Cd by amine-modified zeolite. Water Res. 2005, 39, 3287–3297. [Google Scholar] [CrossRef] [PubMed]
- Marhoon, A.A.; Hasbullah, S.A.; Asikin-Mijan, N.; Mokhtar, W.N.A.W. Hydrothermal synthesis of high-purity zeolite X from coal fly ash for heavy metal removal: Kinetic and isotherm analysis. Adv. Powder Technol. 2023, 34, 104242. [Google Scholar] [CrossRef]
- Pu, X.; Yao, L.; Yang, L.; Jiang, W.; Jiang, X. Utilization of industrial waste lithium-silicon-powder for the fabrication of novel nap zeolite for aqueous Cu(II) removal. J. Clean Prod. 2020, 265, 121822. [Google Scholar] [CrossRef]
- Steinike, U.; Jancke, K.; Lutz, W.; Schreier, E.; Walther, G. NaA-zeolites modified by Me2+-cations. Mater. Sci. Forum 1996, 228, 669–676. [Google Scholar] [CrossRef]
- Lv, Y.; Ma, B.; Liu, Y.; Wang, C.; Chen, Y. Adsorption behavior and mechanism of mixed heavy metal ions by zeolite adsorbent prepared from lithium leach residue. Microporous Mesoporous Mater. 2022, 329, 111553. [Google Scholar] [CrossRef]
- Cui, W.L.; Tang, K.; Chen, Y.; Chen, Z.; Lan, Y.; Hong, Y.B.; Lan, W.G. Regulating the particle sizes of NaA molecular sieves toward enhanced heavy metal ion adsorption. New J. Chem. 2024, 48, 7863–7874. [Google Scholar] [CrossRef]
- Król, M.; Mozgawa, W.; Jastrzbski, W.; Barczyk, K. Application of IR spectra in the studies of zeolites from D4R and D6R structural groups. Microporous Mesoporous Mater. 2012, 156, 181–188. [Google Scholar] [CrossRef]
- Wen, J.; Yan, C.; Xing, L.; Wang, Q.; Yuan, L.; Hu, X.H. Simultaneous immobilization of As and Cd in a mining site soil using HDTMA-modified zeolite. Env. Sci. Pollut. Res. 2021, 28, 9935–9945. [Google Scholar] [CrossRef] [PubMed]
- Zhang, W.; Xu, F.; Wang, Y.; Luo, M.; Wang, D. Facile control of zeolite NaA dispersion into xanthan gum-alginate binary biopolymer network in improving hybrid composites for adsorptive removal of Co2+ and Ni2+. Chem. Eng. J. 2014, 255, 316–326. [Google Scholar] [CrossRef]


| Sample | SiO2 | Al2O3 | Fe2O3 | K2O | Na2O | CaO | MgO | SO3 | P2O5 | Others | SiO2/Al2O3 |
|---|---|---|---|---|---|---|---|---|---|---|---|
| FM | 66.59 | 20.64 | 4.10 | 2.13 | 1.25 | 1.97 | 1.99 | 0.12 | 0.25 | 0.96 | 5.49 |
| YST | 64.64 | 21.43 | 3.56 | 3.59 | 0.87 | 2.51 | 0.92 | 0.30 | 0.18 | 2.00 | 5.13 |
| SH | 56.34 | 34.71 | 1.05 | 4.15 | 1.19 | 0.24 | 0.55 | 0.22 | 0.05 | 1.50 | 2.86 |
| Sample | Mad | Ad | Vd | FCd |
|---|---|---|---|---|
| FM | 7.06 | 94.05 | 5.78 | 0.17 |
| YST | 2.39 | 86.18 | 8.42 | 5.40 |
| SH | 0.97 | 87.91 | 7.61 | 4.47 |
| Adsorption | Experimental qe (mg/g) | Pseudo-First-Order Model | Pseudo-Second-Order Model | ||||
|---|---|---|---|---|---|---|---|
| k1 | R2 | Calculated qe (mg/g) | k2 (×10−4) | R2 | Calculated qe (mg/g) | ||
| FM-C-HY (Cd2+) | 48.6 | 0.0024 | 0.879 | 30.9 | 3.48 | 0.987 | 48.8 |
| YST-C-HY (Cd2+) | 72.8 | 0.0066 | 0.942 | 40.7 | 6.03 | 0.999 | 73.9 |
| SH-C-HY (Cd2+) | 65.6 | 0.0033 | 0.877 | 46.3 | 2.27 | 0.988 | 67.0 |
| FM-C-HY (Pb2+) | 215.0 | 0.0024 | 0.931 | 108.4 | 1.12 | 0.997 | 216.9 |
| YST-C-HY (Pb2+) | 247.5 | 0.0030 | 0.831 | 95.5 | 1.61 | 0.999 | 250.0 |
| SH-C-HY (Pb2+) | 242.4 | 0.0016 | 0.836 | 122.8 | 0.92 | 0.995 | 239.2 |
| Sample | SBET (m2·g–1) a | Smicro (m2·g–1) b | Sext (m2·g–1) c | Vtotal (cm3·g–1) d | Vmicro (cm3·g–1) b | Dpore (nm) e |
|---|---|---|---|---|---|---|
| FM-C-HY | 23.27 | 0 | 23.27 | 0.076 | 0 | 3.399 |
| FM-C-HY (Cd) | 13.84 | 0 | 13.84 | 0.067 | 0 | 3.403 |
| FM-C-HY (Pb) | 20.57 | 0 | 20.57 | 0.077 | 0 | 3.400 |
| YST-C-HY | 20.22 | 0 | 20.22 | 0.081 | 0 | 3.402 |
| YST-C-HY (Cd) | 12.11 | 0 | 12.11 | 0.072 | 0 | 3.405 |
| YST-C-HY (Pb) | 9.11 | 0 | 9.11 | 0.054 | 0 | 3.403 |
| SH-C-HY | 13.01 | 0 | 13.01 | 0.073 | 0 | 3.404 |
| SH-C-HY (Cd) | 20.31 | 2.04 | 18.27 | 0.088 | 0.001 | 3.402 |
| SH-C-HY (Pb) | 14.41 | 0 | 14.41 | 0.058 | 0 | 3.402 |
Disclaimer/Publisher’s Note: The statements, opinions and data contained in all publications are solely those of the individual author(s) and contributor(s) and not of MDPI and/or the editor(s). MDPI and/or the editor(s) disclaim responsibility for any injury to people or property resulting from any ideas, methods, instructions or products referred to in the content. |
© 2024 by the authors. Licensee MDPI, Basel, Switzerland. This article is an open access article distributed under the terms and conditions of the Creative Commons Attribution (CC BY) license (https://creativecommons.org/licenses/by/4.0/).
Share and Cite
Chang, Z.; Lu, C.; Bai, L.; Guo, N.; Xing, Z.; Yan, Y. Removal of Cd2+ and Pb2+ from an Aqueous Solution Using Modified Coal Gangue: Characterization, Performance, and Mechanisms. Processes 2024, 12, 2095. https://doi.org/10.3390/pr12102095
Chang Z, Lu C, Bai L, Guo N, Xing Z, Yan Y. Removal of Cd2+ and Pb2+ from an Aqueous Solution Using Modified Coal Gangue: Characterization, Performance, and Mechanisms. Processes. 2024; 12(10):2095. https://doi.org/10.3390/pr12102095
Chicago/Turabian StyleChang, Zhibing, Chunwei Lu, Lu Bai, Nan Guo, Zhenguo Xing, and Yinuo Yan. 2024. "Removal of Cd2+ and Pb2+ from an Aqueous Solution Using Modified Coal Gangue: Characterization, Performance, and Mechanisms" Processes 12, no. 10: 2095. https://doi.org/10.3390/pr12102095