Article

The Indicative Role of Geochemical Characteristics of Fracturing Flowback Fluid in Shale Gas Wells on Production Performance

by
Xingping Yin
1,
Xiugen Fu
1,
Yuqiang Jiang
1,2,*,
Yonghong Fu
1,2,*,
Haijie Zhang
3,
Lin Jiang
3,
Zhanlei Wang
1 and
Miao Li
1
1
School of Geoscience and Technology, Southwest Petroleum University, Chengdu 610500, China
2
Resources Evaluation Laboratory, PetroChina Key Laboratory of Unconventional Oil and Gas, Chengdu 610500, China
3
Chongqing Shale Gas Exploration and Development Company Limited, Chongqing 610213, China
*
Authors to whom correspondence should be addressed.
Processes 2024, 12(10), 2097; https://doi.org/10.3390/pr12102097
Submission received: 1 September 2024 / Revised: 18 September 2024 / Accepted: 21 September 2024 / Published: 27 September 2024
(This article belongs to the Section Energy Systems)

Abstract

:
The geochemical properties of fracturing flowback fluids indirectly indicate the fracturing efficiency of the reservoir, the interaction between the reservoir and injected water, and the preservation of oil and gas, thereby offering robust data support for identifying fracturing flowback fluid sources, assessing fracturing effects, and proposing stimulation strategies. In this study, the ion characteristics, total salinity, and stable isotope ratio of fracturing flowback fluids of the Z202H1 and Z203 wells in Western Chongqing were measured. The findings suggest that with the extension of flowback time, the geochemical properties of fracturing flowback fluids evolve toward higher salinity and heavier stable isotope ratios, ultimately stabilizing. Upon comparing the water–rock reaction intensity and the rate of total salinity increase in the fracturing flowback fluids, it is concluded that fracturing flowback fluids contain a mixture of formation water. Because water–rock reactions elevate the total salinity of fracturing flowback fluids, we introduce the Water–Rock Reaction Intensity Coefficient (IR) to denote the intensity of these reactions. Based on the IR value, the binary mixture model for fracturing fluids in fracturing flowback fluids was adjusted. With the increase in flowback time, the content of fracturing fluids in fracturing flowback fluids of Z202H1 and Z203 stabilized at about 55% and 40% respectively. During the same flowback period, the fracturing flowback fluids of the Z203 well exhibit a higher total salinity, a heavier stable isotope ratio, a greater IR, and a lower fracturing fluid content in fracturing flowback fluids. This suggests that the fracturing effect of the Z203 well is superior to that of the Z202H1 well, leading to a higher production capacity of the Z203 well.

1. Introduction

The Lower Paleozoic Wufeng and Longmaxi formation shale gas in the Sichuan basin with a buried depth of less than 3500 m has been commercially developed, and the shale gas with a buried depth of more than 3500 m has also made a major breakthrough [1,2]. The pattern of trillion ~m3 reserves and 10 billion ~m3 output in southern Sichuan is well-defined, which shows the great exploration potential of unconventional oil and gas [3,4]. Hydraulic fracturing is an effective stimulation means for shale gas development [5,6,7], but geological conditions and fracturing techniques can significantly influence the flowback characteristics of horizontal wells in shale gas [8,9,10,11,12]. The geochemical properties of fracturing flowback fluids (FFF) can accurately reflect the degree of interaction between fracturing fluids (FF) and formation rocks, and then indirectly reflect the fracturing effect [13,14]. Therefore, it is of great significance to analyze the properties of FFF, study the flowback behavior, and evaluate the flowback effect to improve shale gas recovery.
At present, scholars’ analyses of the chemical properties of FFF mainly focus on dissolved solids [15], ion types and concentrations, total salinity [16,17], suspended solids [18,19,20], and radioactive elements [21,22] in FFF, so as to improve the treatment and recovery efficiency of FFF. There are few reports to analyze the effect of the fracturing process through the chemical properties, stable isotope content, and flowback behavior of FFF. Meanwhile, some scholars have established a “fracture complexity index” through microseisms to evaluate the fracturing effect [23], pointing out that the larger the value is, the more complex the fracturing fracture will be, and the larger the reconstruction volume will be, the better the reconstruction effect will be. However, the microseismic detection results also greatly depend on the accuracy of the model. It is in great demand to analyze the fracturing effect by opening up other ways to analyze it to confirm and supplement each other with microseisms, in order to improve the accuracy of the fracturing effect analysis. The scientific basis for the formulation of drainage and production measures after shale gas fracturing construction is weak [24]. It is of great significance to improve the recovery of single wells by introducing the research results of the flowback behavior of FFF and reasonably adjusting the drainage and production measures.
Above all, research on FFF primarily focuses on specific time points of shale gas wells in different regions, lacking long-term continuous monitoring. Secondly, studies on the geochemical properties of FFF often concentrate on analyses of reuse and the source of the fluid, but they lack a correlation analysis between the geochemical properties of FFF and production effects. Our research utilizes two wells (Z202H1 and Z203) located in the western part of Chongqing in the Sichuan Basin, and employs a combination of experimental and theoretical methods to systematically analyze the ion concentration, stable isotope ratio, and their flowback patterns over time for FFF. The paper’s main focus is on addressing the following issues: (1) the long-term flowback pattern of geochemical properties of FFF; (2) the composition and source of FFF; and (3) the correlation between the geochemical properties of FFF and production effects.

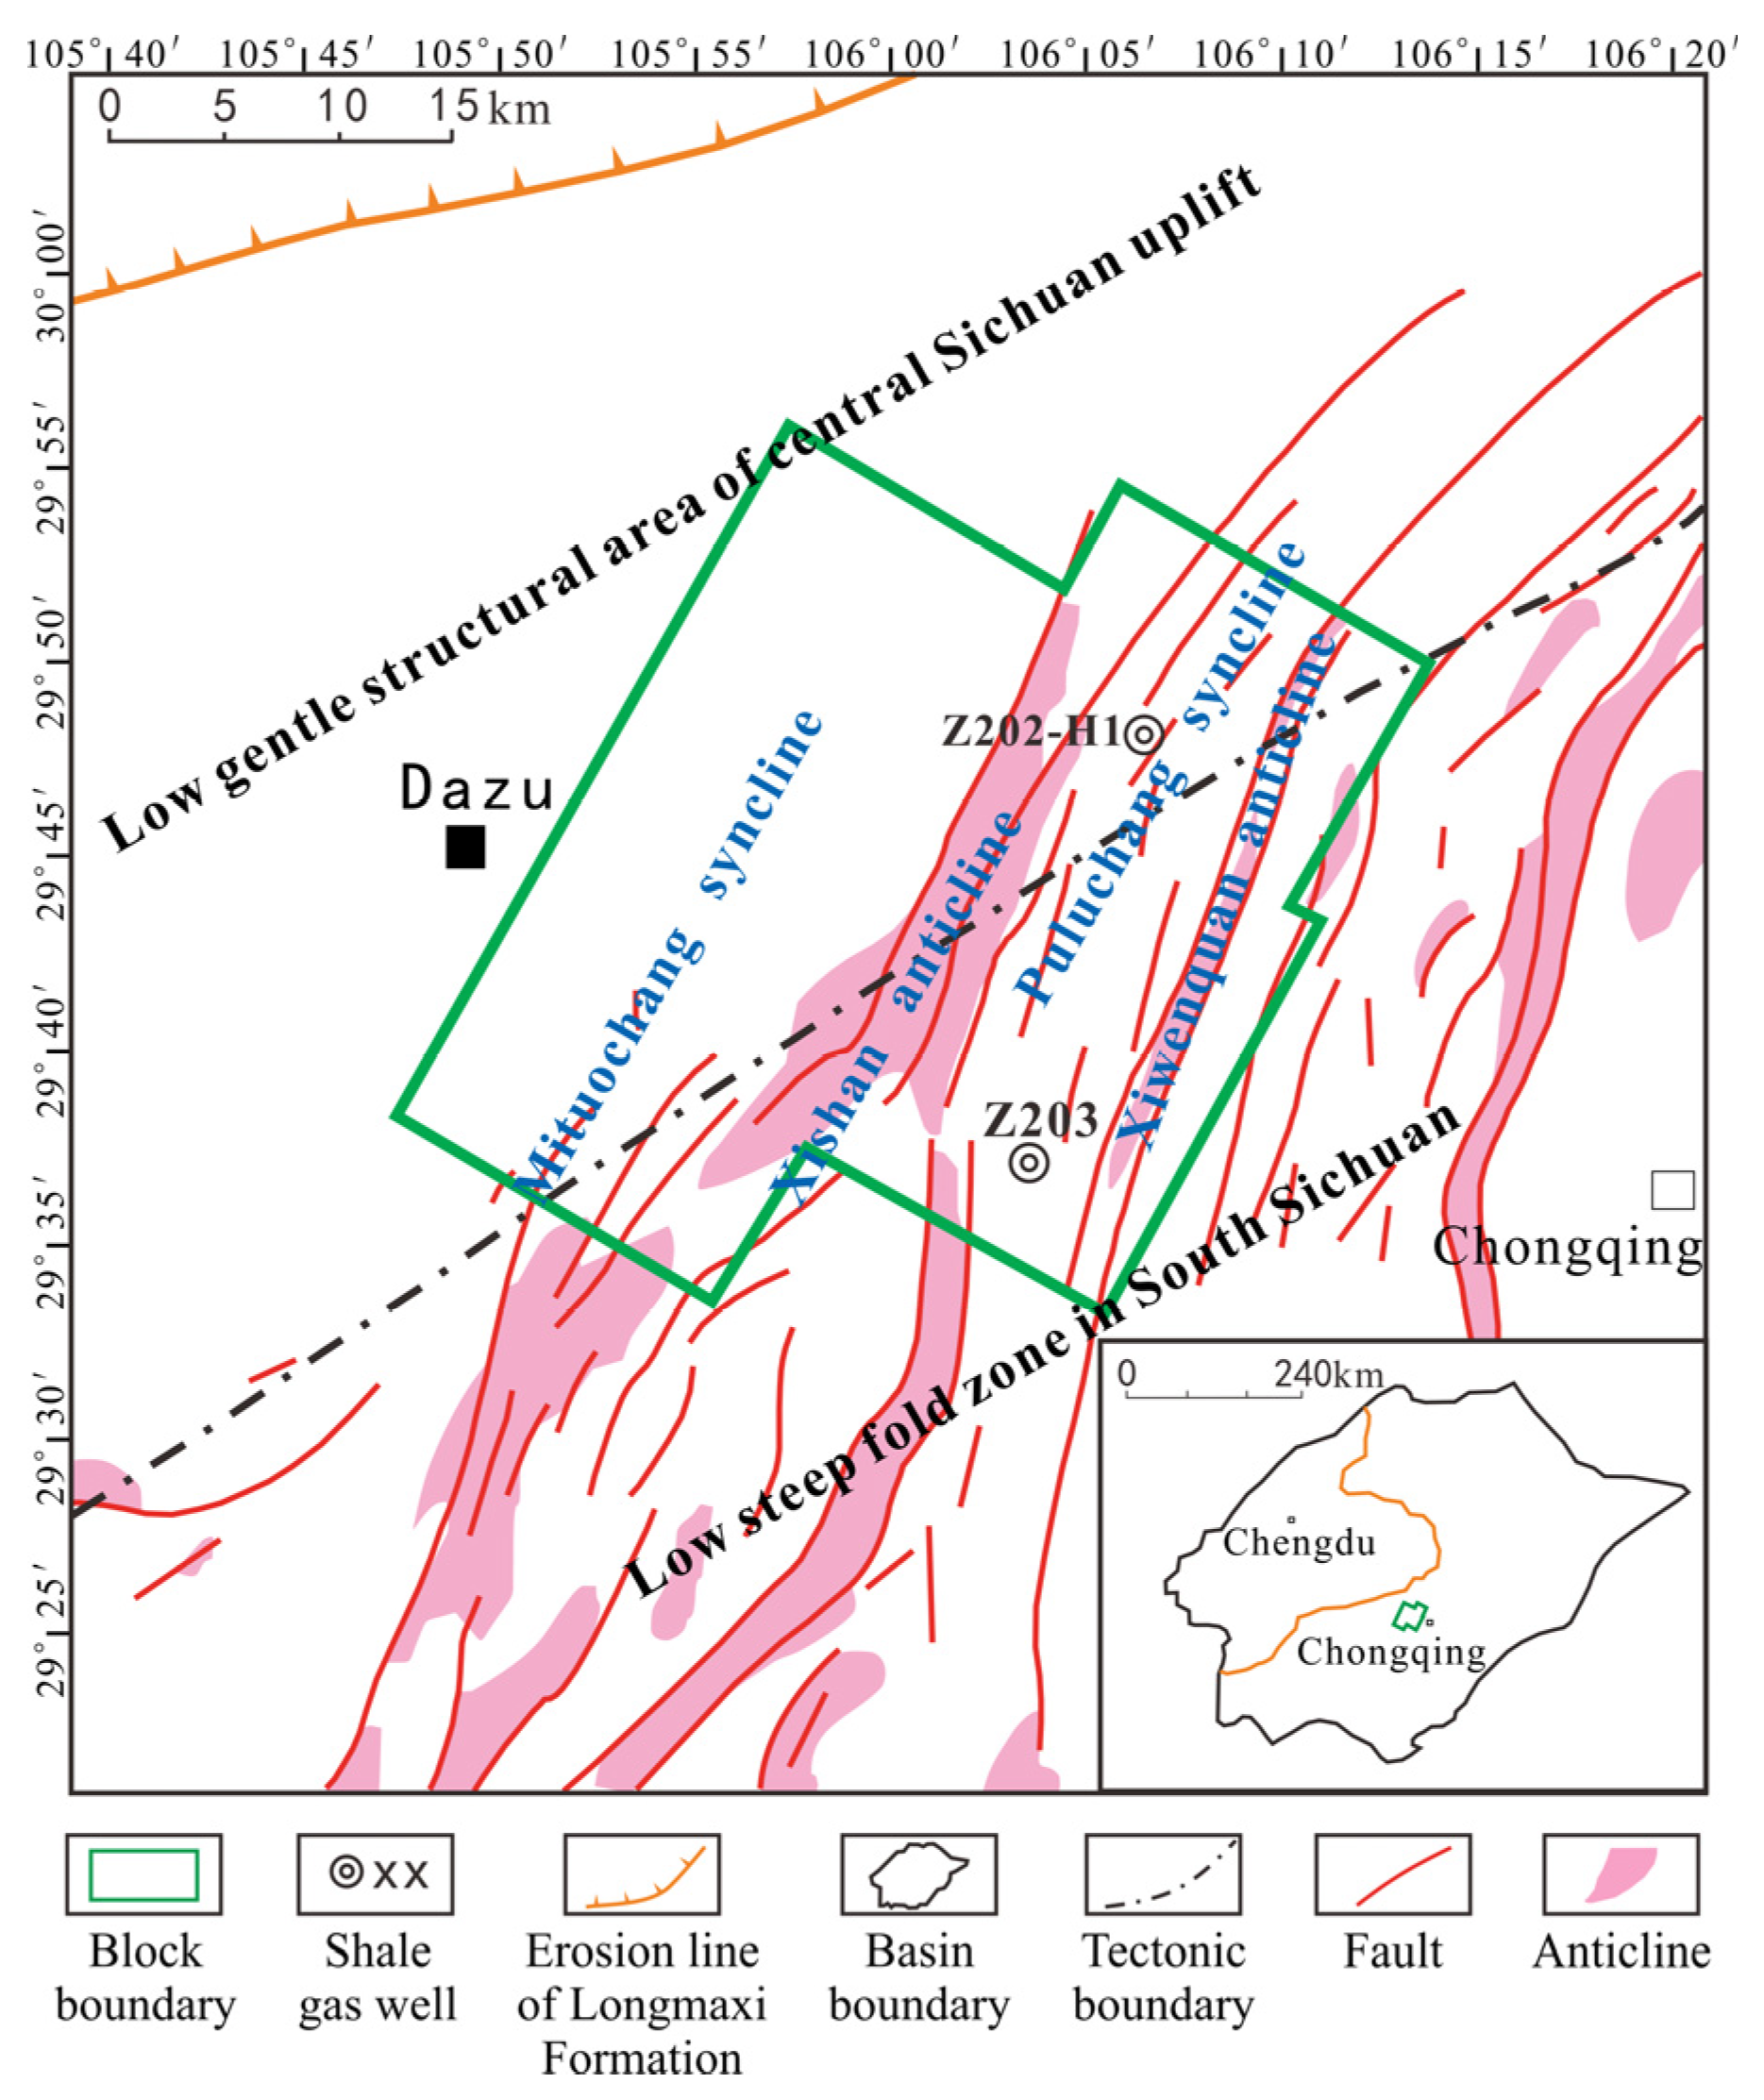
2. Geological Setting

In the late Ordovician, the uplift of strata gradually exposed the uplift in Central Guizhou, and the scope of the craton basin in the upper Yangtze block where the Sichuan Basin is located was also reduced. As a result, the restricted sea area formed by the sedimentary characteristics of the sea area was surrounded by the underwater uplift in the early Middle Ordovician, forming a large-area reduced sedimentary environment with low hydrodynamic conditions and poor oxygen [25,26]. From the end of Ordovician to the Early Silurian, large-scale transgression occurred, depositing a set of black graptolite-rich siliceous shale-containing radiolarian layers, which is the main gas-producing formation (L1 sub-layer) for shale gas exploration and development at present [27,28]. Western Chongqing is located in the southeast of the Sichuan Basin, including Dazu, Tongliang, Bishan, Rongchang, and other areas. The main shale gas exploration and development area is Dazu–Bishan area. Dazu area has the Xishan structure in the west, the Xiwenquan and Libixia structures in the East, and the Dongshan structure in the south. The Xishan structure is relatively steep, and the Libixia and Xiwenquan structures are narrow. Under compression, the study area has a structural pattern of two uplifts and one depression. The Z202H1 and Z203 wells selected for this study are distributed in a plunging syncline, with a flat stratum and similar geological conditions (Figure 1).

3. Materials and Experiment

3.1. Sample Collection

Since the same FF formulation system was adopted for the fracturing of the Z202H1 and Z203 wells, 500 mL FF was collected before fracturing, and its geochemical properties were measured as a reference. After the fracturing and shut in of the shale gas horizontal well for a period of time, the flowback began, and water samples were collected simultaneously. The 500 mL of FFF used for experimental analysis was collected on-site at 22:30 every day and sealed in plastic bottles and taken back to the laboratory. Z202H1 and Z203 wells were sampled for 108 days and 38 days, respectively. Some photos of the FFF from well Z203 are shown in Figure 2. The photos reveal that the color of the FFF gradually darkens and then lightens as the flowback time increases. The sampling rule is to conduct continuous sampling for the first 15 days, and then collect samples every 2 days. It is noteworthy that during the sampling process, if the shale gas well is shut in during the flowback process, the initial sampling after shut in should be excluded before proceeding with normal sampling. A total of 82 experimental analysis samples were collected including FF samples. Chemical composition and stable isotope ratio analysis of the collected FFF samples must be completed within 3 days to avoid mutual conversion between CO32− and HCO3. In order to better analyze whether there is FW in FFF, the production water (PW) of an adjacent well in the study area after 380 days of production was collected.

3.2. Methodology

The collected FF and FFF samples needed to be filtered through a 0.45 μm filter membrane before the ion test, then the filtered samples were divided into three equal parts, which were used for the cation test, anion test, and stable isotope ratio test, respectively.

3.2.1. Ion Concentration Test

The cation concentrations (Ca2+, Mg2+, K+, Na+, Mn2+, Sr2+, Ba2+, Li+, etc.) were analyzed using an Optima 5300DV Inductively Coupled Plasma Optical Emission Spectrophotometer (ICP-OES) equipped with a concentric glass atomizer, a glass cyclone spray chamber, a semi detachable EMT torch, and a 2 mm aperture quartz Central tube. Through a series of standard solution tests, the spectrophotometer was calibrated by the insertion method. The accuracy of cation measurement of water was less than 5%, and the relative error was less than 2%. The anion concentrations (Cl, Br, F, SO42−, etc.) were analyzed by 792 basic Ion Chromatography produced by the Metrohm company in Switzerland. The measurement accuracy of anions and cations was the same. The test value of each ion concentration was the average of five consecutive test results.

3.2.2. Stable Isotope Ratio Test

Stable isotope compositions (δD and δ18O) of filtered FF and FFF water samples were analyzed using a Los Gatos Research (LGR) Laser Absorption Water-Vapor Isotope Spectrometer produced in the USA. The measurement results of all stable isotopic ratios were expressed in per mil (‰), relative to the use of δ notation by the international Vienna Standard Mean Ocean Water (V-SMOW) standard. The measurement results’ standard deviation for δD and δ18O was 0.5‰ and 0.1‰, respectively. The ratio of stable isotope was the average of three consecutive test results.

4. Results

4.1. FF and Production Water Geochemical Characteristics

In order to compare and analyze the geochemical characteristics of FFF, we tested the stable isotope composition ratio, ion concentration, and total salinity of FF and production water (at 380 days), and the detailed results are listed in Table 1. From the test data, we can observe that the ratio of stable isotopes (δD and δ18O) in PW is heavier, and the ion concentration and total salinity are higher, with this difference ranging from several times to hundreds of times. The reason may be the presence of a large amount of FW in PW after one year of production.

4.2. Relationship between Ion Concentration of FFF and Flowback Time

After the fracturing and well opening of shale gas well, FFF will flow back to the ground with natural gas, and the ion concentration changes regularly. Through ion concentration analysis, it is found that the FFF of the shale gas well mainly contain cations such as Na+, Ca2+, Mg2+, K+, Mn2+, Sr2+, and Ba2+ and anions such as Cl, HCO3−, SO42−, and Br (Figure 3).The cation concentration has the characteristics of Na+ > Ba2+ > Ca2+ > Sr2+ > K+ > Mg2+, and the anion concentration has the characteristics of Cl > HCO3− > Br. Overall, the concentration of anions and anions increased rapidly at first and then tended to be stable (Figure 3a,b). For the Z202H1 well, the ion concentration of FFF in the first 4 days was very similar to that of FF, and the ion concentration was low. The concentrations of Na+, Cl, Ba2+, Ca2+, Mg2+, and HCO3− were about 35.37 mg/L, 18.70 mg/L, 0.29 mg/L, 49.16 mg/L, 8.64 mg/L, and 215.56 mg/L. From day 5 to day 31, the cation and anion concentrations of Z202H1 increased rapidly, and then plateaued. On day 31, the cation concentrations of Na+, Ba2+, Ca2+, and Mg2+ increased to 10,805 mg/L, 513 mg/L, 410 mg/L, and 69 mg/L, respectively, and anion concentrations of Cl and HCO3− increased to 14,795 mg/L and 891 mg/L, respectively. Then, the ion concentration increased slowly (Figure 3a). For the Z203 well, only the ion concentration of FFF on the first day was very similar to that of FF. At day 5, the concentrations of Na+, K+, Cl, Ba2+, Ca2+, Mg2+, and HCO3− increased rapidly to 7205.55 mg/L, 137.20 mg/L, 12,221.39 mg/L, 365.70 mg/L, 456.60 mg/L, 83.78 mg/L, and 1630.20 mg/L, respectively. From day 5 to day 11, all ion concentrations increased slowly. During the flowback process, the construction error caused a wellbore blockage, and the ion concentration was reduced by adding acetone for breakdown. After blockage removal, the ion concentration quickly recovered to a higher concentration and slowly increased (Figure 3b). The Ca2+ in the Z202H1 well and the Sr2+ in the Z203 well exhibited distortions at 37 and 14 days, respectively. This may have been due to the impact of the flowback measures or the long waiting time for sample transportation during the flowback process of the shale gas wells, leading to the precipitation of Ca2+ and Sr2+, resulting in the concentration distortion of these two ions.
Figure 3c shows that there is a good positive logarithmic relationship between the total salinity of the two wells and the flowback time. The total salinity of the Z202H1 well increased to 33,330.4 mg/L at 108 days of flowback. However, on the 38th day of flowback of the Z203 well, the total salinity reached 37,116.74 mg/L. It can be seen that the increased rate of total salinity of the Z203 well with flowback time is much higher than that of the Z202H1 well.

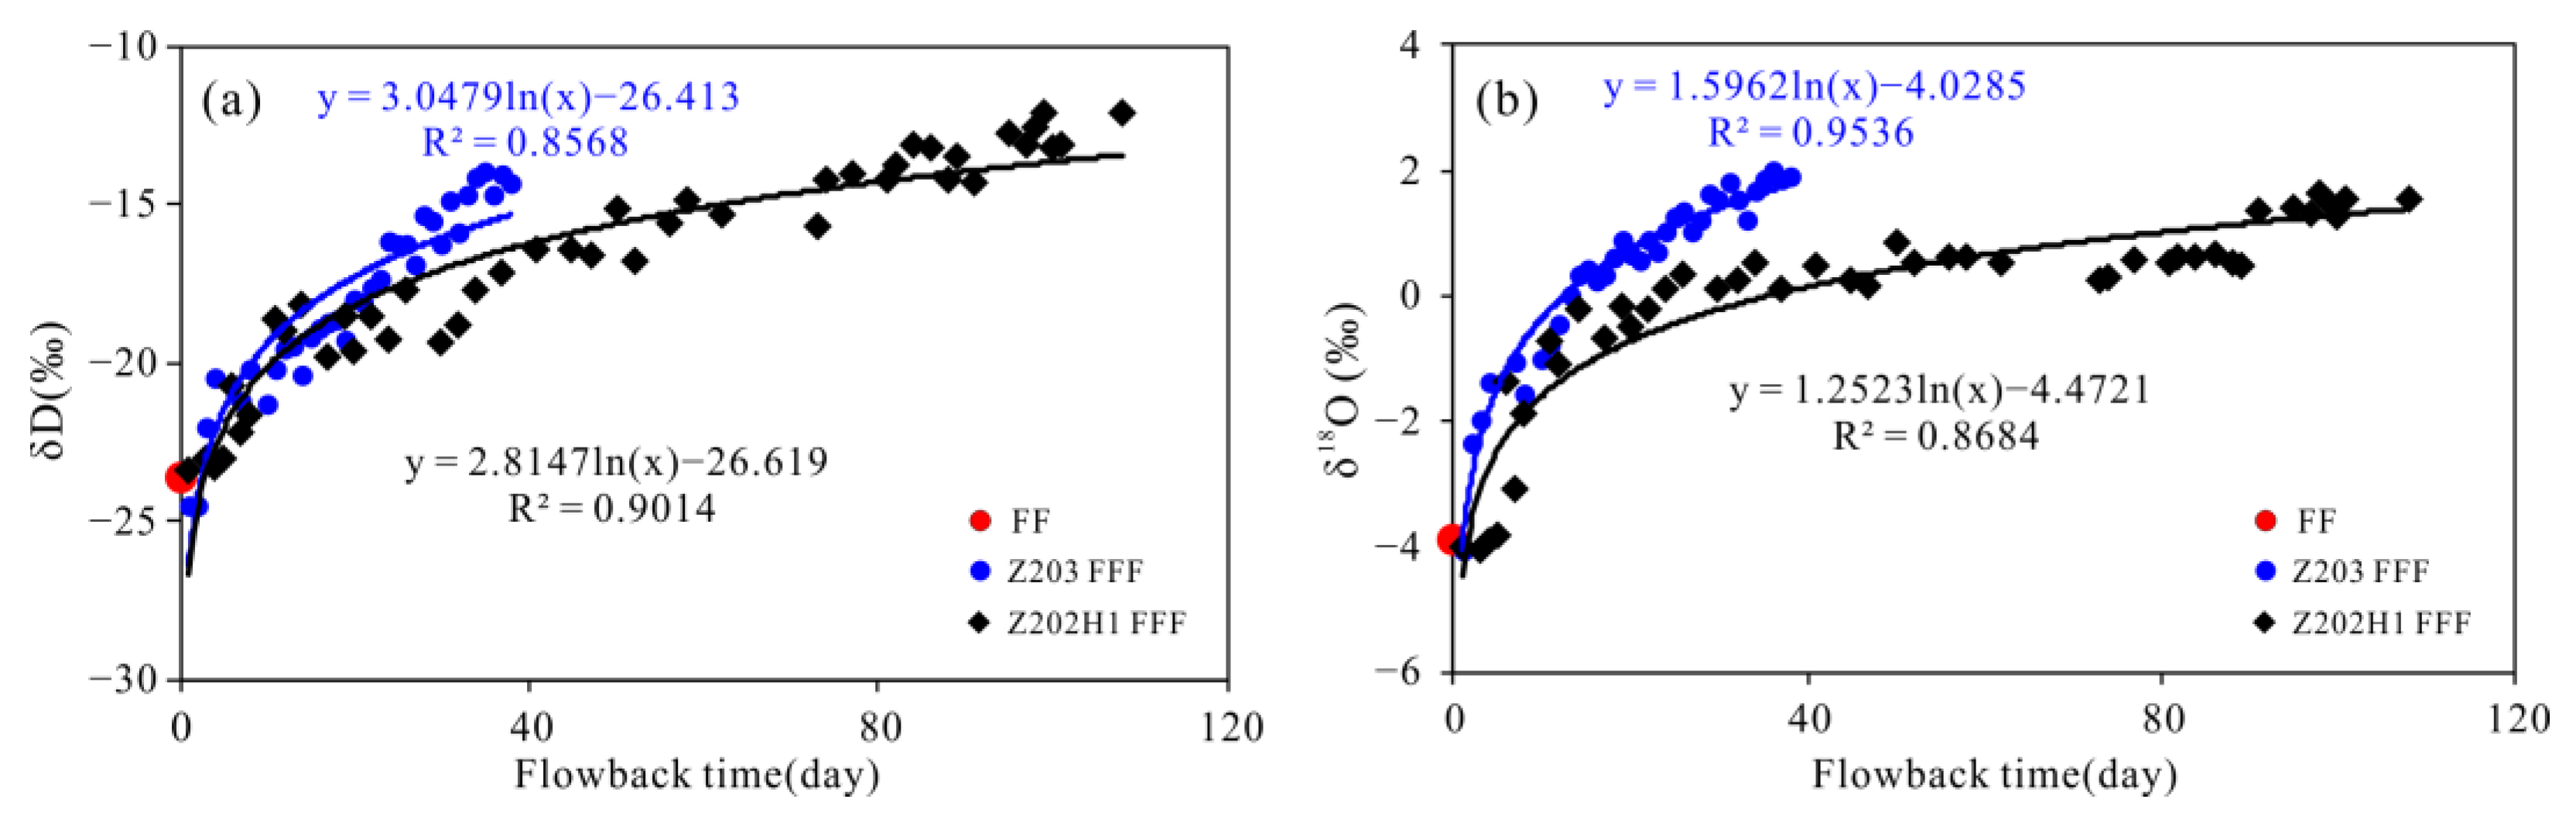
4.3. Relationship between Stable Isotope Ratio of FFF and Flowback Time

The stable isotopic ratios of hydrogen and oxygen (δD and δ18O) values in FF with low salinity are −23.59‰ and −3.91‰. Similar to the total salinity, the δD and δ18O ratios became heavier and heavier with the increase in flowback time, and showed a good positive logarithmic relationship with the flowback time (Figure 4). The δD values of Z202H1 increased from −23.41‰ to −12.59‰ after 108 days of flowback, and of Z203 from −24.51‰ to −14.32‰ after 38 days (Figure 4a). The δ18O values of Z202H1 increased from −4.01‰ to 1.92‰ after 108 days of flowback, and of Z203 from −4.07‰ to 1.62‰ after 38 days (Figure 4). It can be seen that the stable isotope composition of Z203 is heavier than that of Z202H1 within the same flowback time.

5. Discussion

5.1. Source of Ions and Stable Isotope in FFF

Fully understanding the ion source of FFF and the sedimentation during flowback is of great significance for optimizing the fracturing fluid system, improving the fracturing effect, and guiding flowback measures. Previous studies have shown that a large amount of low-salinity FF will inevitably interact with reservoir rocks [16,17], and there is also ion release caused by matrix imbibition of the shale reservoir [15], which makes the chemical components in FFF more complex. Meanwhile, some scholars believe that the reason why the geochemical properties of FFF are complex is due to the mixing of FW [29,30,31]. Therefore, there are some differences in understanding the source of ions and stable isotope composition in FFF.
After FF is injected into the shale reservoir, a water–rock reaction will inevitably occur in the process of fracture formation and runoff, exchanging and redistributing ions. The Longmaxi formation shale is a marine deposit with a relatively stable distribution, and the reservoir properties of shale gas wells in the same block are basically the same [1]. Meanwhile, the FF formulation systems of Z202H1 and Z203 are the same. So the main influencing factor of water–rock reaction intensity lies in external factors, such as temperature, reaction time, pressure, mineral solubility, and other factors [32,33]. For this reason, scholars soaked shale core samples with distilled water under certain temperature and pressure conditions in the laboratory, and tested the value of total salinity at different time periods [20,34]. For the convenience of comparison, we integrated the data and calculated the maximum rate of increase in total salinity every 24 h, and the results are shown in Figure 5. We can see that the increased rate of total salinity in Longmaxi formation shale after the water–rock reaction is 560.37 mg/L/day. However, the increase rate of the total salinity in the actual production wells Z202H1 and Z203 is 1704.09 mg/L/day and 6119.98 mg/L/day, respectively, which is much greater than the increasing rate of the water–rock reaction. This indicates that there are other sources besides the water–rock reaction for the increase in total salinity and the stable isotope ratio of FFF.
The stable isotope ratio of water is one of the direct pieces of evidence for determining the water source, as δD VS δ18O crossplot evolution law can effectively reflect the sources of water [35]. The stable isotopic ratios (δD and δ18O) in FF were –23.6‰ and –3.9‰, respectively, and were located on the left side of the Chinese meteoric water trendline (CMWL) (δD = 8.17δ18O + 10.56) [36]. The stable isotope ratios of Z202H1 flowback for the first 4 days of FFF and Z203 for the first day of FFF were distributed on the left side of the CMWL and were close to the CMWL. With the increase in flowback time, stable isotope ratios evolve away from the right side of the CMWL, and the stable isotope ratios become heavier and heavier (Figure 6). This phenomenon fully indicates that FW in the shale reservoir is mixed into FFF.

5.2. Calculation of FF Content in FFF

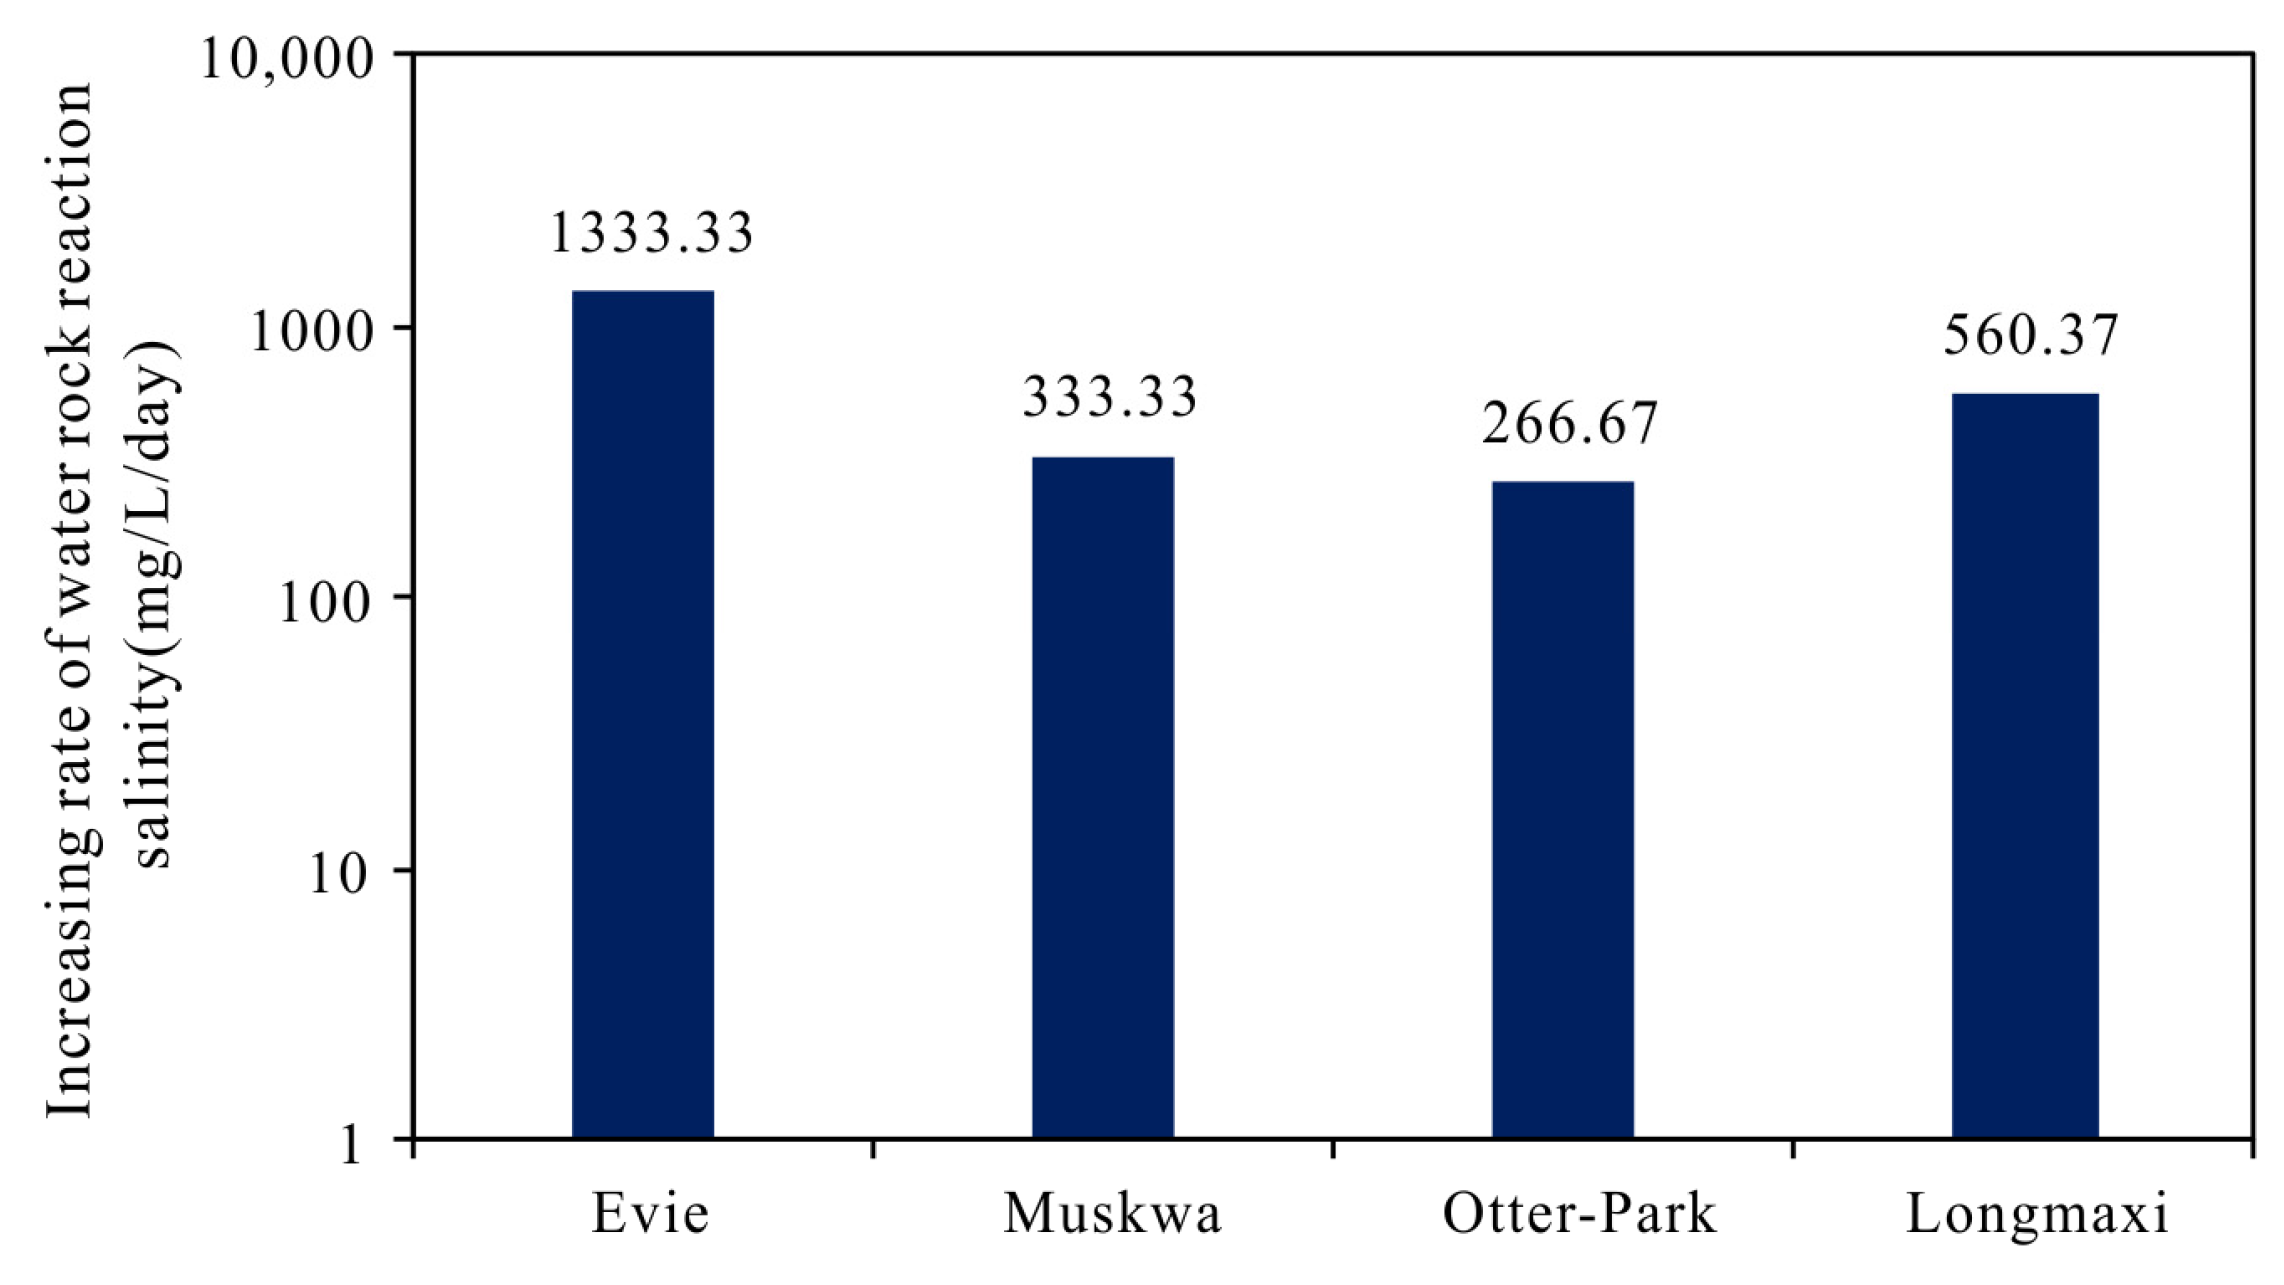
5.2.1. Water–Rock Reaction Intensity

From Section 5.1, it has been recognized that the water–rock reaction will cause an increase in ion concentration and stable isotope composition in FFF. To accurately calculate the content of FF in FFF, it is necessary to know which ions are increased or decreased after the water–rock reaction. Chloride can be regarded as a conservative tracer of the flushing of FF by in situ FW [37]. During the fracturing and flowback process, if the water–rock reaction is not considered, then there are only two components in FFF: FW and FF. With the increase in flowback time, the value of total salinity and stable isotope ratio will be larger and larger (Figure 3c and Figure 4), indicating that the formation’s water content is higher and higher, and the FFF eventually evolve into FW. It has been considered that the PW after one year of production can be approximately regarded as FW [20]. Therefore, fluids during the fracturing and flowback process can be regarded as the mixing process of FF and FW. Ions mainly come from the mixing of FW and the water–rock reaction. So, the uniform mixing model between the geochemical properties of FF and FW can be established and used as the basis for ion absorption or release in the process of the water–rock reaction [38].
Because chloride ion is relatively stable, it basically does not participate in any chemical reactions in the flowback process [38]. The source can be identified by the change relationship between different ion concentrations and Cl. The red line in Figure 7 is the connecting line between the FF and PW, which can be regarded as the uniform mixing between the FF and FW. Stable isotopes mainly indicate the source of water, and other sources can be basically ignored [35]. So, on the intersection diagram of the Cl concentration and δ18O ratio, the FFF are distributed near the mixing model (Figure 7a), which shows that Cl is relatively stable in the fracturing flowback process. Figure 7b,c show that the concentration of Ca2+ and Mg2+ in FFF of well Z202H1 increases rapidly, and the overall distribution position is above the mixing model, which reflects that there is not only the mixing of formation water, but also an additional supplement from the water–rock reaction in the process of fracturing flowback. Figure 7d,e show that the concentration of Ba2+ and Sr2+ also has an increasing trend, but the characteristics of the FFF are distributed below the mixing model, indicating that there are other obvious physical and chemical effects to reduce it such as barite and celestite precipitation. Figure 7f shows that the intersection results of trace ions Mn2+ and Cl show that the ion concentration evolution characteristics of FFF are distributed near the mixing model, indicating that these ions mainly evolve in the direction of formation water, and there is no additional source or other reduction. In the flowback process, there is not only the mixing of the FW, but also the water–rock reaction to generate other ions.
Through the above analysis, it has been recognized that the water–rock reaction will cause an increase in Ca and Mg ions. Therefore, the change law of Ca or Mg ion concentration can be selected to analyze the water–rock reaction intensity. Due to the existence of the water–rock reaction, the concentration of Ca2+ deviates from the mixing model (Figure 7b), and it is inferred that the greater the deviation, the stronger the water–rock reaction intensity. Thus, the water–rock reaction intensity coefficient (IR) is constructed and expressed as follows:
I R = [ C a ] [ C a ] * [ C a ] × 100 %
where [Ca] is the concentration of Ca2+ in FFF, and [Ca]* is the concentration of Ca2+ calculated by the mixing model.
According to the mixing model, [Ca]* can be expressed as:
[Ca]* = k × [Cl] + b
where [Cl] is the concentration of Cl in FFF, k, and b is the constant.
Through Equations (1) and (2), the water–rock reaction intensity coefficients IR of wells Z202H1 and Z203 are calculated. Figure 8 shows that the IR of Z202H1 is relatively small in the first four days of flowback, then increases to the maximum value (67.85%). As the flowback time increases for 31 days, the FW content in the FFF gradually increases, the water–rock reaction intensity decreases, and the IR finally stabilizes at about 18%. In Z203, due to the addition of acetone for plugging removal, the IR appears negative. The maximum IR is 82.21%, which is finally stable at about 25%, much larger than Z202H1. Twenty days before the flowback, due to the need to control pressure and production in shale gas wells, the nozzle was frequently replaced, resulting in significant fluctuations in the geochemical properties of FFF, which also caused fluctuations in the IR value. As the flowback time increased and the nozzle size stabilized, the IR value also stabilized. Well Z203 and well Z202H1 are located within the same structural syncline, and the properties of the reservoirs are similar. The main reason for the difference in IR values is the complexity of the fracture network formed by fracturing. The more complex the fracture network, the larger the area of contact between the FF and the formation rocks, and the more intense the water–rock reaction, resulting in a higher ion concentration in FFF and thus higher IR values.

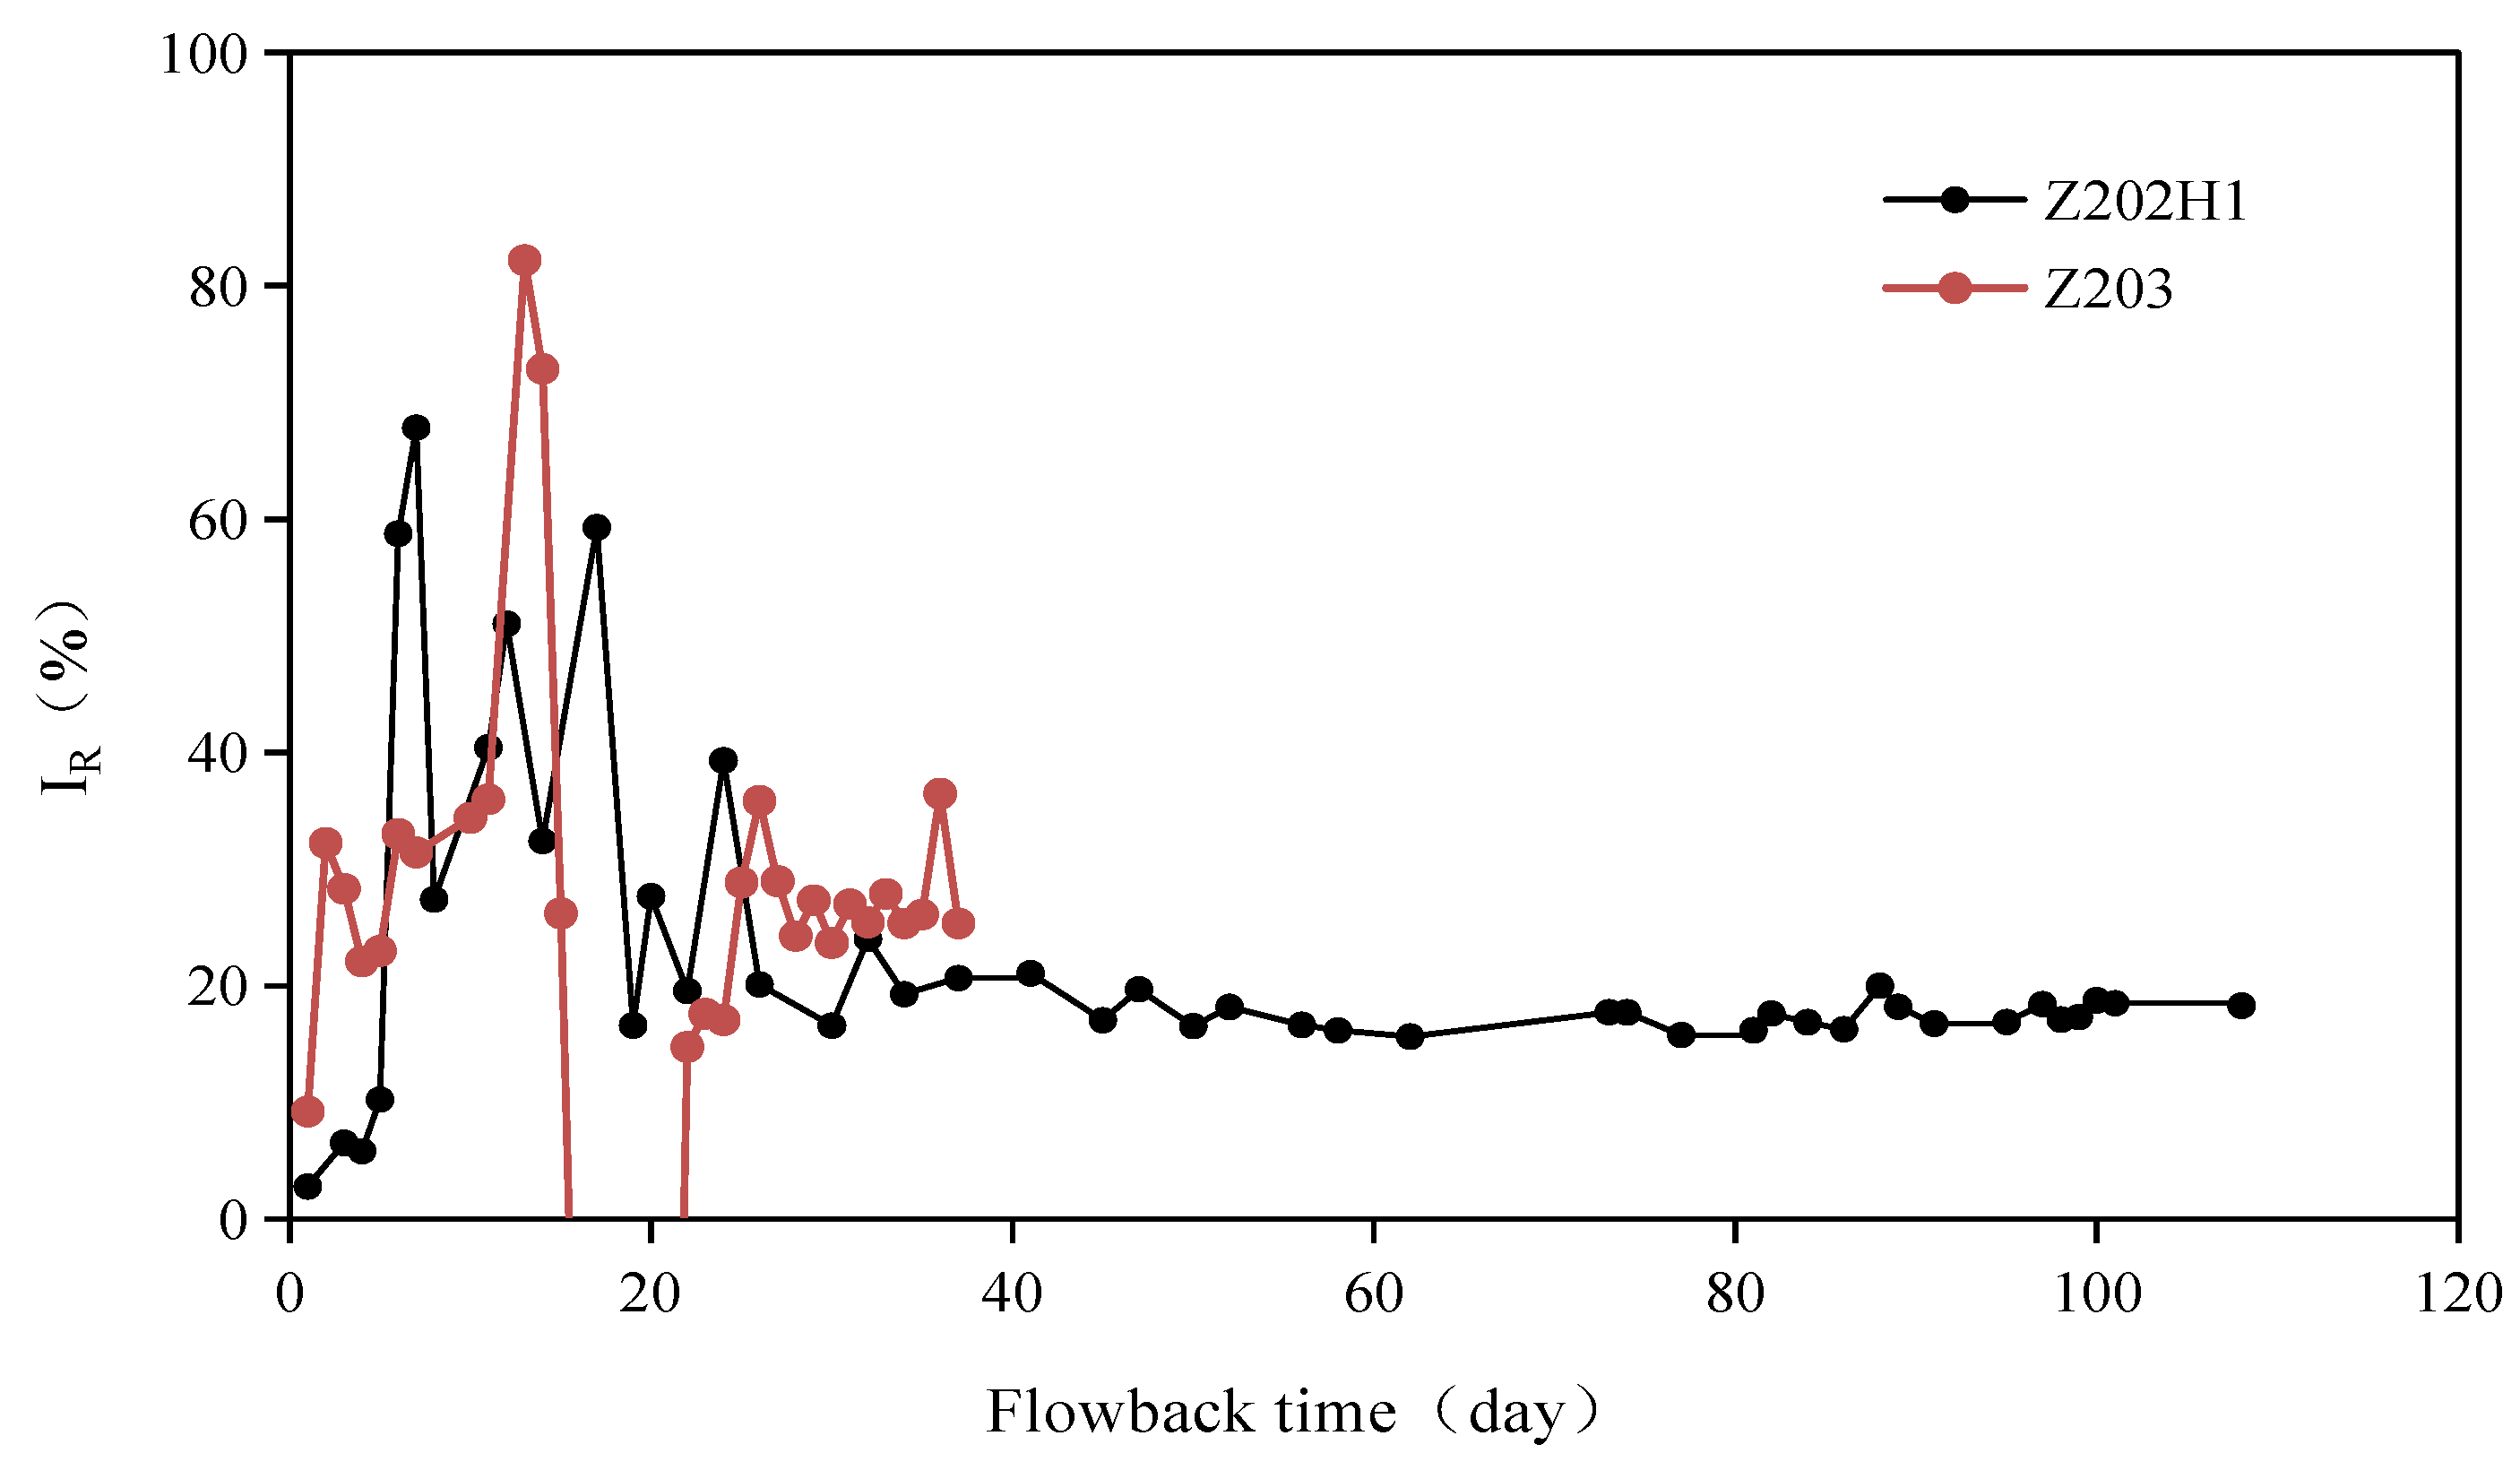
5.2.2. Calculation of FF Content

Calculating the content of FF in FFF is helpful in analyzing the complexity of the fracturing network in shale gas wells [18]. Since the water source in the fracturing flowback process is mainly the injected FF and FW, a two-component mixing model is established to calculate the content of FW in the FFF, and the two end elements are the total salinity of FF and the total salinity of FW, respectively [18,38]. According to the mass balance equation, it can be seen that the total salinity of FFF is expressed as [39]:
A × SFF + B × SFW = SFFF
A + B = 1
where SFF is the total salinity of FF, SFW is the total salinity of FW, SFFF is the total salinity of FFF, and A and B are the proportion coefficients of FF and FW in FFF, respectively.
The water–rock reaction will cause an increase in additional ions and an increase in total salinity. If the water–rock reaction correction is not carried out in the calculation of the FF content in FFF, the calculation result will be low. Therefore, it is necessary to correct the water–rock reaction intensity of the total salinity of FFF to calculate accurately the FF content, and Equation (3) should be rewritten as:
A × SFF + B × SFW = (100 − IR)SFFF/100
According to Equations (4) and (5), the content of FF in FFF can be calculated as follows:
A = ( 100 I R ) S F F F S F W 100 ( S F F S F W )
The proportion of FF in FFF of Z203 and Z202H1 is calculated by Equation (6). In the early stage of flowback, the content of FF in FFF is high, more than 90%, and especially in Z202H1, the content of FF is more than 95% in the first five days of flowback (Figure 9). On the 11th day of flowback, acetone was added to Z203 for plugging removal, resulting in a higher calculated FF content than that of Z202H1. With the increase in flowback time, the content of FF in FFF of Z202H1 and Z203 stabilized at about 55% and 40%, respectively. At the same time, we used the flow equation of wellhead drainage to calculate the proportion of FF in FFF. The results showed that there was almost no difference in the proportion of FF in FFF of the two wells (Figure 9). This is because the amount of fluid discharged during the flowback stage is relatively small compared to the amount of FF injected, resulting in relatively consistent calculation results. This method applies to the analysis of fluid discharge differences in shale gas wells that reuse FFF or have been in production for a long period of time. And our method is more advantageous for early flowback analysis, as this difference will gradually decrease after a long period of production.

5.3. Relationship between Geochemical Flowback Behavior of FFF and Fracturing Effect

Many studies have reported that the fracturing flowback rate of shale gas wells is usually low, and generally speaking, the lower the flowback rate, the better the production effect of shale gas wells [9,10,11,12]. The Longmaxi shale was deposited in a deep-marine shelf setting, in a stable and strong reducing environment [1,27]. In the same work area, the geological conditions are similar, and the high production of shale gas wells mainly depends on the fracturing effect. During fracturing, the shale reservoir will imbibe a large amount of FF and release FW in pores to replace more natural gas, accompanied by a complex water–rock reaction [18,40,41,42]. Therefore, the fracturing effect of shale gas wells can be analyzed by the FF flowback rate, water–rock reaction intensity, total salinity, and stable isotope ratio.
Figure 10 shows that the FF flowback volume of Z202H1 and Z203 was low in the first six days of flowback. The reason is that this stage is dominated by the FF flowback from the wellbore or bottom of the well to the surface. Then, the FF flowback volume of Z202H1 was much higher than that of Z203. On day 108 of flowback, the FF flowback volume of Z202H1 was 6196 m3 and the FF flowback volume of Z202H1 was 1409 m3. This phenomenon shows that during the fracturing process, more FF in Z203 interacted with the formation rock, resulting in a more complex fracture network, which stimulated the shale reservoir to imbibe FF and replace shale gas, and have a stronger water–rock reaction, because the volume of FF in the Z202H1 and Z203 wells was similar, 55,421 m3 and 57,786 m3 respectively. After FF stimulated the shale reservoir to form a fracture network, the well opened for flowback. Due to the large scale of the main artificial fracture, the fluid in the fracture will first flow back, and then flow back to the secondary artificial fracture, while it is difficult for the fluid in the smaller microfracture to flow back [24,30]. The increase in tiny micro-fractures that formed after fracturing made the contact area between FF and the reservoir rock larger, increasing imbibition capacity and water–rock reactions, and more formation water was released. This well explains the phenomenon whereby at the same time of flowback, the total salinity of well Z203 is higher (Figure 3c), the stable isotope ratio is heavier (Figure 4), the water–rock reaction intensity coefficient is larger (Figure 8), and the content of FF in FFF is smaller (Figure 9). Therefore, all these flowback characteristics reveal that the fracturing effect of Z203 is better than that of Z202H1, making the production effect of Z203 better. The cumulative gas production of Z202H1 is 2001 × 104 m3 in two years, while that of Z203 is 1955 × 104 m3 in only one year.
The total SRV (Stimulated Reservoir Volume) by microseismic technology detection of Z202-H1 was 6.71 × 10⁷ m3, which was similar to Z203’s total SRV of 6.12 × 10⁷ m3 [13]. This result does not explain the productivity difference between the two wells very well. However, the difference in productivity can be explained by the fracturing effect through analysis of the difference in geochemical properties of FFF in shale gas wells. Thus, it can be seen that the fracturing effect of shale gas horizontal wells can be indirectly reflected by the backflow law of the geochemical index of FFF, such as the total salinity, stable isotope ratio, water–rock reaction intensity coefficient, and the content of FF in FFF.

6. Conclusions

In this work, a comprehensive analysis was conducted on the ion concentration, total salinity, stable isotope ratio, and flowback behavior of FFF in horizontal shale gas wells. This investigation led to the following key findings and suggestions:
(1) With an increase in flowback time, the total salinity of FFF in shale gas wells increases, and stable isotope ratios become heavier. Moreover, the increased rate of total salinity of Longmaxi formation shale after the water–rock reaction is 560.37 mg/L/day, which is less than that of actual production wells Z202H1 and Z203, 1704.09 mg/L/day and 6119.98 mg/L/day respectively. These phenomena indicate that FW is mixed with FFF.
(2) Based on the uniform mixing model of FF and FW, Ca2+ and Mg2+ ions were identified as increasing the most in the water–rock reaction. Subsequently, the water–rock reaction intensity coefficient (IR) was introduced to characterize the intensity of the water–rock reaction. The IR for the Z203 well eventually stabilized at approximately 25%, which is higher than the Z202H1 well’s 18%, suggesting that the water–rock reaction of Z203 is more intense.
(3) Based on the water–rock reaction intensity coefficient, the binary mixing model for FFF was adjusted, and the content of FF in FFF was calculated. During the initial flowback phase, the content of FF in FFF was very high, exceeding 90%. As the flowback time increased, the FF content in the FFF from Z202H1 and Z203 stabilized at approximately 55% and 40%, respectively. The FF injected into the Z203 well interacted more fully with the reservoir rock, forming a more complex fracture network and improving the fracturing effect. This accounts for the superior production capacity of the Z203 well.
(4) Through our research, we can determine the proportion of FF in FFF during different time periods of flowback. However, there is a lack of understanding regarding the flowback behavior of fracturing fluid during different stages of flowback, especially the lack of standards for dividing the time periods of wellbore drainage, main fracture drainage, secondary fracture drainage, and pore fracture drainage, which makes it difficult to recognize. If these time boundaries are determined, we can accelerate the flowback during the wellbore and main fracture drainage stages, and control the pressure during the secondary fracture and pore fracture drainage stages, so as to better maintain the gas flow space. Therefore, in the future research process, it is necessary to continuously strengthen the long-term monitoring of the geochemical properties of FFF to obtain more geological engineering information and provide guidance for optimizing the fracturing flowback process.

Author Contributions

Methodology, Y.F. and X.Y.; Writing—original draft preparation, X.Y.; Validation, X.F. and H.Z.; Writing—review and editing, Z.W. and L.J.; Supervision, Y.J. and M.L. All authors have read and agreed to the published version of the manuscript.

Funding

This research was jointly supported by the National Natural Science Foundation of China (42272171), the National Natural Science Foundation of China (42302166), and the Science and Technology Cooperation Project of the CNPC-SWPU Innovation Alliance (Grant No. 2020CX020104).

Data Availability Statement

The data presented in this study are available on request from the corresponding author.

Conflicts of Interest

Authors Haijie Zhang and Lin Jiang were employed by the company Chongqing Shale Gas Exploration and Development Company Limited. The remaining authors declare that the research was conducted in the absence of any commercial or financial relationships that could be construed as a potential conflict of interest.

References

  1. Ma, X.; Xie, J. The progress and prospects of shale gas exploration and exploitation in southern Sichuan Basin, NW China. Pet. Explor. Dev. 2018, 45, 161–169. [Google Scholar] [CrossRef]
  2. Zhang, C.; Zhang, J.; Li, W. Deep shale reservoir characteristics and exploration potential of Wufeng-Longmaxi Formations in Dazu area, western Chongqing. Nat. Gas Geosci. 2019, 30, 1794–1804. [Google Scholar]
  3. Li, Q.C.; Li, Y.D.; Cheng, Y.F.; Li, Q.; Wang, F.; Wei, J.; Liu, Y.; Zhang, C.; Song, B.; Yan, C.; et al. Numerical simulation of fracture reorientation during hydraulic fracturing in perforated horizontal well in shale reservoirs. Energy Sources 2018, 40, 1807–1813. [Google Scholar] [CrossRef]
  4. Li, Q.C.; Li, Y.D.; Li, Q. Development and verification of the comprehensive model for physical properties of hydrate sediment. Arab. J. Geosci. 2018, 11, 325. [Google Scholar] [CrossRef]
  5. Zou, C.N.; Dong, D.Z.; Wang, Y.M.; Li, X.; Huang, J.; Wang, S.; Guan, Q.; Zhang, C.; Wang, H.; Liu, H.; et al. Shale gas in China: Characteristics, challenges and prospects (II). Pet. Explor. Dev. 2016, 43, 166–178. [Google Scholar] [CrossRef]
  6. Vincent, M. The next opportunity to improve hydraulic-fracture stimulation. J. Pet. Technol. 2012, 64, 118–127. [Google Scholar] [CrossRef]
  7. Ferrer, I.; Thurman, E.M. Chemical constituents and analytical approaches for hydraulic fracturing waters. Trends Environ. Anal. Chem. 2015, 5, 18–25. [Google Scholar] [CrossRef]
  8. Han, H.F.; He, Q.Y.; Wang, L. The current situation of flowback technology and its further development research for shale-gas wells in Changning block. Drill. Prod. Technol. 2017, 40, 69–71. [Google Scholar]
  9. Vidic, R.D.; Brantley, S.L.; Vandenbossche, J.M.; Yoxtheimer, D.; Abad, J.D. Impact of shale gas development on regional water quality. Science 2013, 340, 1235009. [Google Scholar] [CrossRef]
  10. Ma, L.; Zhang, C.; Liu, D.Q. Preliminary study on the well-soaking adaptability after fracturing in fuling shale gasfield. Spec. Oil Gas Reserv. 2019, 26, 150–154. [Google Scholar]
  11. Ghanbari, E.; Abbasi, M.A.; Dehghanpour, H.; Bearinger, D. Flowback volumetric and chemical analysis for evaluating load recovery and its impact on early-time production. In Proceedings of the SPE Unconventional Resources Conference, Calgary, AB, Canada, 5–7 November 2013. [Google Scholar]
  12. Ghanbari, E.; Gehghanpour, H. Impact of rock fabric on water imbibition and salt diffusion in gas shales. Int. J. Coal Geol. 2015, 138, 55–67. [Google Scholar] [CrossRef]
  13. Fu, Y.H.; Jiang, Y.Q.; Hu, Q.H.; Luo, T.; Li, Y.; Zhian, L.; Wang, Z.; Yin, X. Fracturing flowback fluids from shale gas wells in Western Chongqing: Geochemical analyses and relevance for exploration & development. J. Nat. Gas Sci. Eng. 2021, 88, 103821. [Google Scholar]
  14. Jia, B.; Xian, C.G.; Tsau, J.S.; Zuo, X.; Jia, W. Status and Outlook of Oil Field Chemistry-Assisted Analysis during the Energy Transition Period. Energy Fuels 2022, 36, 12917–12945. [Google Scholar] [CrossRef]
  15. Zolfaghari, A.; Dehghanpour, H.; Noel, M.; Bearinger, D. Laboratory and field analysis of flowback water from gas shales. J. Unconv. Oil Gas Resour. 2016, 14, 113–127. [Google Scholar] [CrossRef]
  16. He, C.; Li, M.; Liu, W.S.; Barbot, E.; Vidic, R.D. Kinetics and equilibrium of barium and strontium sulfate formation in Marcellus shale flowback water. J. Environ. Eng. 2014, 140, 244–248. [Google Scholar] [CrossRef]
  17. Rosenblum, J.; Nelson, A.W.; Ruyle, B.; Schultz, M.K.; Ryan, J.N.; Linden, K.G. Temporal characterization of flowback and produced water quality from a hydraulically fractured oil and gas well. Sci. Total Environ. 2017, 596, 369–377. [Google Scholar] [CrossRef] [PubMed]
  18. Kondash, A.J.; Albright, E.; Vengosh, A. Quantity of flowback and produced waters from unconventional oil and gas exploration. Sci. Total Environ. 2017, 574, 314–321. [Google Scholar] [CrossRef]
  19. Lu, J.; Darvari, R.; Nicot, J.P.; Mickler, P.; Hosseini, S.A. Geochemical impact of injection of Eagle Ford brine on Hosston sandstone formation-Observations of autoclave water-rock interaction experiments. Appl. Geochem. 2017, 84, 26–40. [Google Scholar] [CrossRef]
  20. Li, Y.M.; Huang, T.M.; Pang, Z.H.; Jin, C. Geochemical processes during hydraulic fracturing: A water-rock interaction experiment and field test study. Geosci. J. 2017, 21, 753–763. [Google Scholar] [CrossRef]
  21. Vengosh, A.; Jackson, R.B.; Warner, N.; Darrah, T.H.; Kondash, A. A Critical Review of the Risks to Water Resources from Unconventional Shale Gas Development and Hydraulic Fracturing in the United States. Sci. Total Environ. 2014, 48, 8334–8348. [Google Scholar] [CrossRef]
  22. Liu, W.S.; Liao, S.M.; Xiang, Q. Status quo of fracturing flowback fluids treatment technologies of US shale gas wells and its enlightenment for China. Nat. Gas Ind. 2013, 33, 158–162. [Google Scholar]
  23. Jia, C.Y.; Jia, A.L.; He, D.B. Key factors influencing shale gas horizontal well production. Nat. Gas Ind. 2017, 37, 80–88. [Google Scholar]
  24. Jiang, Y.Q.; Fu, Y.H.; Xie, J.; Dong, D.; Zhou, K.; Cheng, X.; Qi, L.; Zhang, H.; Chen, C.; Ma, T.; et al. Development trend of marine shale gas reservoir evaluation and a suitable comprehensive evaluation system. Nat. Gas Ind. 2020, 7, 205–214. [Google Scholar] [CrossRef]
  25. Zhao, J.H.; Jin, Z.J.; Jin, Z.K. Lithofacics types and sedlimentary cnvironment of shale in Wufeng-Longmaxi Formation, Sichuan Basin. Acta Pet. Sin. 2016, 37, 572–586. [Google Scholar]
  26. Lu, Y.B.; Ma, Y.Q.; Wang, Y.X. The Sedimentary Response to the Major Geological Events and Lithofacies Characteristics of Wufeng Formation-Longmaxi Formation in the Upper Yangtze Area. Earth Sci. 2017, 42, 1169–1184. [Google Scholar]
  27. Ma, X.H.; Xie, J.; Yong, R. Geological characteristics and high production control factors of shale gas in Silurian Longmaxi Formation, southern Sichuan Basin, SW China. Pet. Explor. Dev. 2020, 47, 901–915. [Google Scholar] [CrossRef]
  28. Ma, X.H.; Li, X.Z.; Liang, F.; Wan, Y.; Shi, Q.; Wang, Y.; Zhang, X.; Che, M.; Guo, W. Dominating factors on well productivity and development strategies optimization in Weiyuan shale gas play, Sichuan Basin, SW China. Pet. Explor. Dev. 2020, 47, 555–563. [Google Scholar] [CrossRef]
  29. Fang, C.H.; Huang, Z.L.; Wang, Q.Z. Cause and significance of the ultra-low water saturation in gas-enriched shale reservoir. Nat. Gas Geosci. 2014, 25, 471–476. [Google Scholar]
  30. Engle, M.A.; Rowan, E.L. Geochemical evolution of produced waters from hydraulic fracturing of the Marcellus Shale, northern Appalachian Basin: A multivariate compositional data analysis approach. Int. J. Coal Geol. 2014, 126, 45–56. [Google Scholar] [CrossRef]
  31. Seales, M.; Dilmore, R.; Ertekin, T. Development of a halite dissolution numerical model for hydraulically fractured shale formations (Part I). J. Unconv. Oil Gas Resour. 2016, 15, 66–78. [Google Scholar] [CrossRef]
  32. Graham, C.M. Experimental hydrogen isotope studies III: Diffusion of hydrogen in hydrous minerals, and stable isotope exchange in metamorphic rocks. Contrib Miner. Pet. 1981, 76, 216–228. [Google Scholar] [CrossRef]
  33. Graham, C.M.; Viglino, J.A.; Harmon, R.S. Experimental study of hydrogen isotope exchange between aluminous chlorite and water and of hydrogen diffusion in chlorite. Am. Mineral. 1987, 72, 566–579. [Google Scholar]
  34. Zolfaghari, S.A.; Noel, M.; Dehghanpour, H. Understanding the Origin of Flowback Salts: A Laboratory and Field Study. In Proceedings of the SPE/CSUR Unconventional Resources Conference, Calgary, AB, Canada, 20–22 October 2015. [Google Scholar]
  35. Rowan, E.L.; Engle, M.A.; Kraemer, T.F.; Schroeder, K.T.; Hammack, R.W.; Doughten, M.W. Geochemical and isotopic evolution of water produced from Middle Devonian Marcellus shale gas wells, Appalachian basin, Pennsylvania. AAPG Bull. 2015, 99, 181–206. [Google Scholar] [CrossRef]
  36. Zheng, S.H.; Hou, F.G.; Ni, B.L. Hydrogen and oxygen stable isotopes of precipitation in China. Chin. Sci. Bull. 1983, 28, 801. [Google Scholar]
  37. Neil, M.B.; Rob, W.; David, B. Rapid water-rock interactions evidenced by hydrochemical evolution of flowback fluid during hydraulic stimulation of a deep geothermal borehole in granodiorite: Pohang, Korea. Appl. Geochem. 2019, 111, 104445. [Google Scholar]
  38. Osselin, F.; Nightingale, B.; Hearn, G.; Kloppmann, W.; Gaucher, E.; Clarkson, C.; Mayer, B. Quantifying the extent of flowback of hydraulic fracturing fluids using chemical and isotopic tracer approaches. Appl. Geochem. 2018, 93, 20–29. [Google Scholar] [CrossRef]
  39. Gat, J.R. Isotope Hydrology: A Study of the Water Cycle; Imperial College Press: London, UK, 2010; pp. 122–151. [Google Scholar]
  40. Osselin, F.; Saad, S.; Nightingale, M. Geochemical and sulfate isotopic evolution of flowback and produced waters reveals water-rock interactions following hydraulic fracturing of a tight hydrocarbon reservoir. Sci. Total Environ. 2019, 687, 1389–1400. [Google Scholar] [CrossRef]
  41. Balashov, V.N.; Engelder, T.; Gu, X.; Fantle, M.S.; Brantley, S.L. A model describing flowback chemistry changes with time after Marcellus Shale hydraulic fracturing. AAPG Bull. 2015, 99, 143–154. [Google Scholar] [CrossRef]
  42. Engelder, T.; Cathles, L.M.; Bryndzia, L.T. The fate of residual treatment water in gas shale. J. Unconv. Oil Gas Resour. 2014, 7, 33–48. [Google Scholar] [CrossRef]
Figure 1. Structural location and well location distribution in the study area.
Processes 12 02097 g001
Figure 2. Photo of the water sample with different flowback times.
Processes 12 02097 g002
Figure 3. Variation characteristics of ion concentration and total salinity of FFF in Z202H1 and Z203 with increasing flowback time. (a) Variation characteristics of ion concentration of FFF in Z202H1 with in-creasing flowback time. (b) Variation characteristics of ion concentration of FFF in Z203 with increasing flowback time. (c) Variation characteristics of total salinity of FFF in Z202H1 and Z203 with increasing flowback time.
Processes 12 02097 g003
Figure 4. Variation characteristics of δD (a) and δ18O (b) of FFF in Z202H1 and Z203 with increasing flowback time.
Processes 12 02097 g004
Figure 5. Increase rate of total salinity in different shale reservoirs soaked in distilled water. Data from the literature [20,34].
Processes 12 02097 g005
Figure 6. Relationship between δD and δ18O of FF and FFF samples [36].
Processes 12 02097 g006
Figure 7. The relationships between Cl concentration and δ18O (a), Ca2+ (b), Mg2+ (c), Sr2+ (d), Ba2+(b,e), and Mn2+ (f) concentration of FFF in well Z202H1.
Processes 12 02097 g007
Figure 8. Relationship between water–rock reaction intensity and flowback time.
Processes 12 02097 g008
Figure 9. Proportion of FF in FFF flowback behavior over flowback time.
Processes 12 02097 g009
Figure 10. FF flowback volume over flowback time.
Processes 12 02097 g010
Table 1. Statistics of stable isotopic ratios, ion composition, and total salinity of FF and PW.
ItemδDδ18ONa+K+Ca2+Mg2+Sr2+Ba2+HCO3−ClTotal Salinity
FF−23.59 −3.9112.65 0.30 54.32 8.35 0.30 0.20 85.23 93.45 315.49
PW−6.894.5721,036.22653.56689.32101.35658.841495.541645.6726,684.9557,698.11
Note: the unit of stable isotopic ratio is ‰; the unit of ion concentration and total salinity is mg/L.
Disclaimer/Publisher’s Note: The statements, opinions and data contained in all publications are solely those of the individual author(s) and contributor(s) and not of MDPI and/or the editor(s). MDPI and/or the editor(s) disclaim responsibility for any injury to people or property resulting from any ideas, methods, instructions or products referred to in the content.

