
Harnessing Chitosan Beads as an Immobilization Matrix for Zero-Valent Iron Nanoparticles for the Treatment of Cr(VI)-Contaminated Laboratory Residue


 and
and
Abstract
:
1. Introduction
2. Materials and Methods
2.1. Materials and Chemicals
2.2. Synthesis of NCs
2.3. Characterization of NCs
2.4. Removal of Cr(VI)
2.5. Cr(VI) Removal Capacity Using NCs
2.6. Kinetic Fittings
3. Results and Discussion
3.1. Synthesis and Characterization of Synthesized Materials
3.1.1. Structure of the NCs
3.1.2. XRD
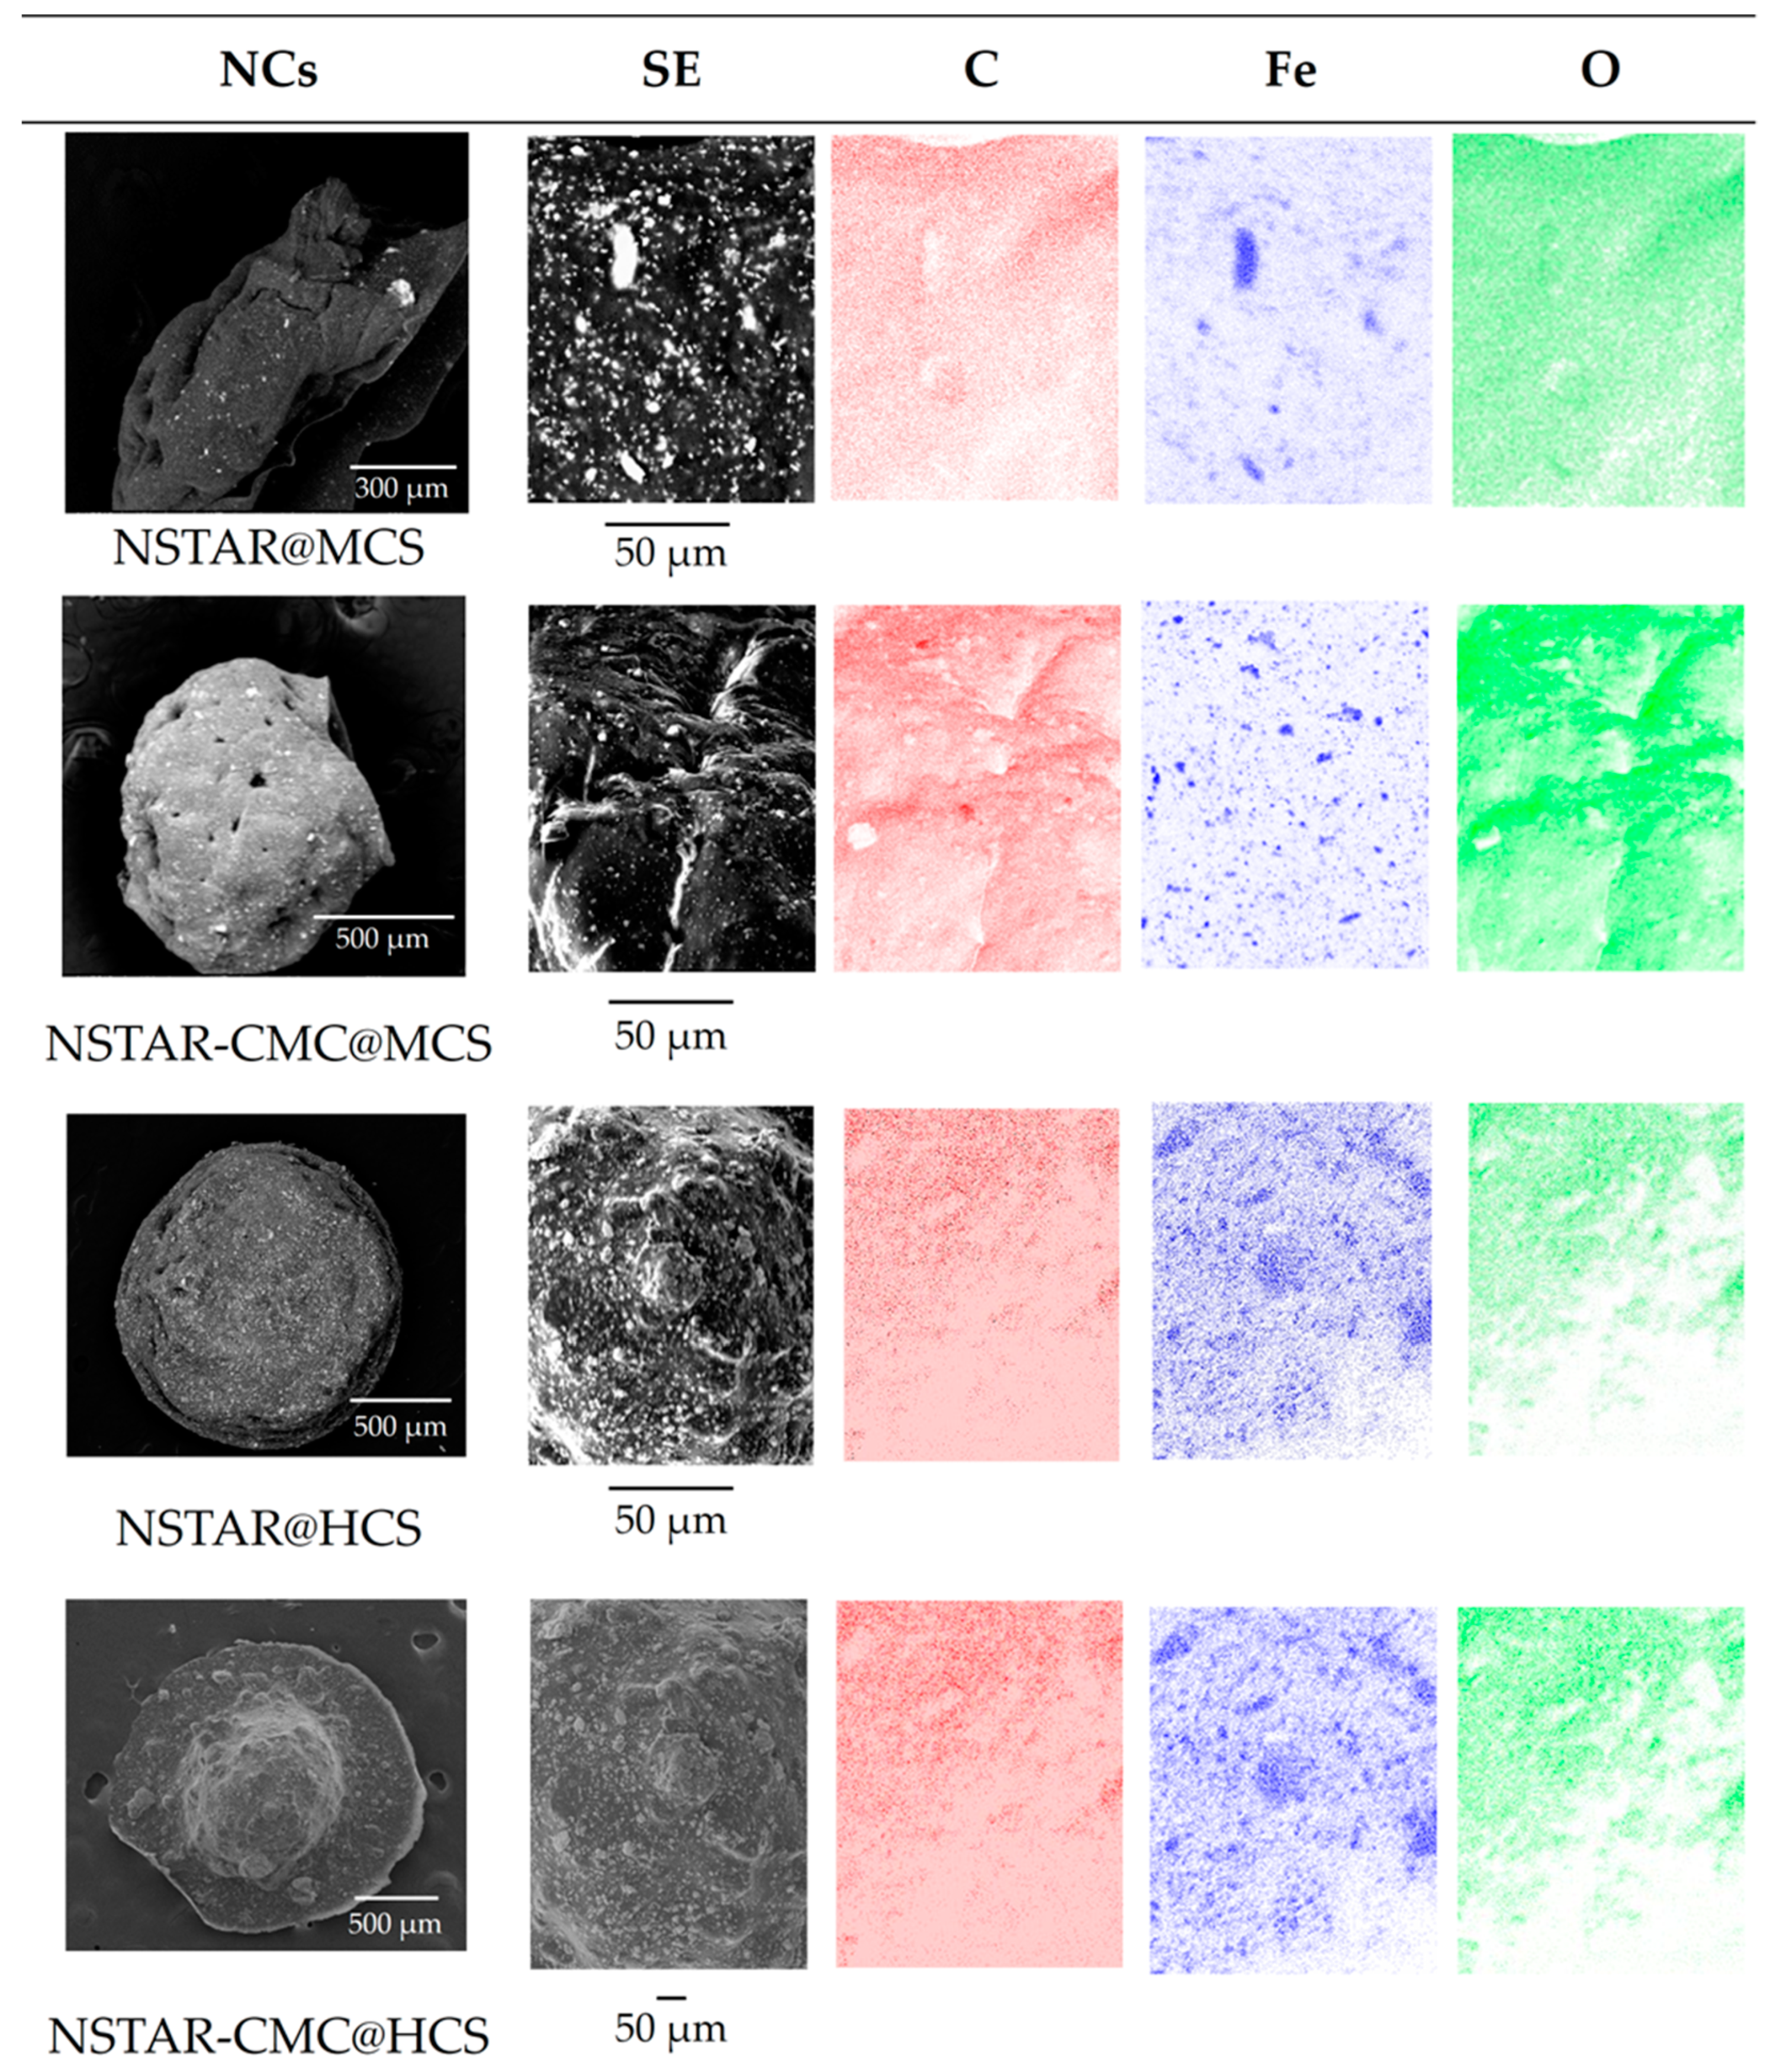
3.1.3. SEM-EDS
3.1.4. Dynamic Mechanical Analysis
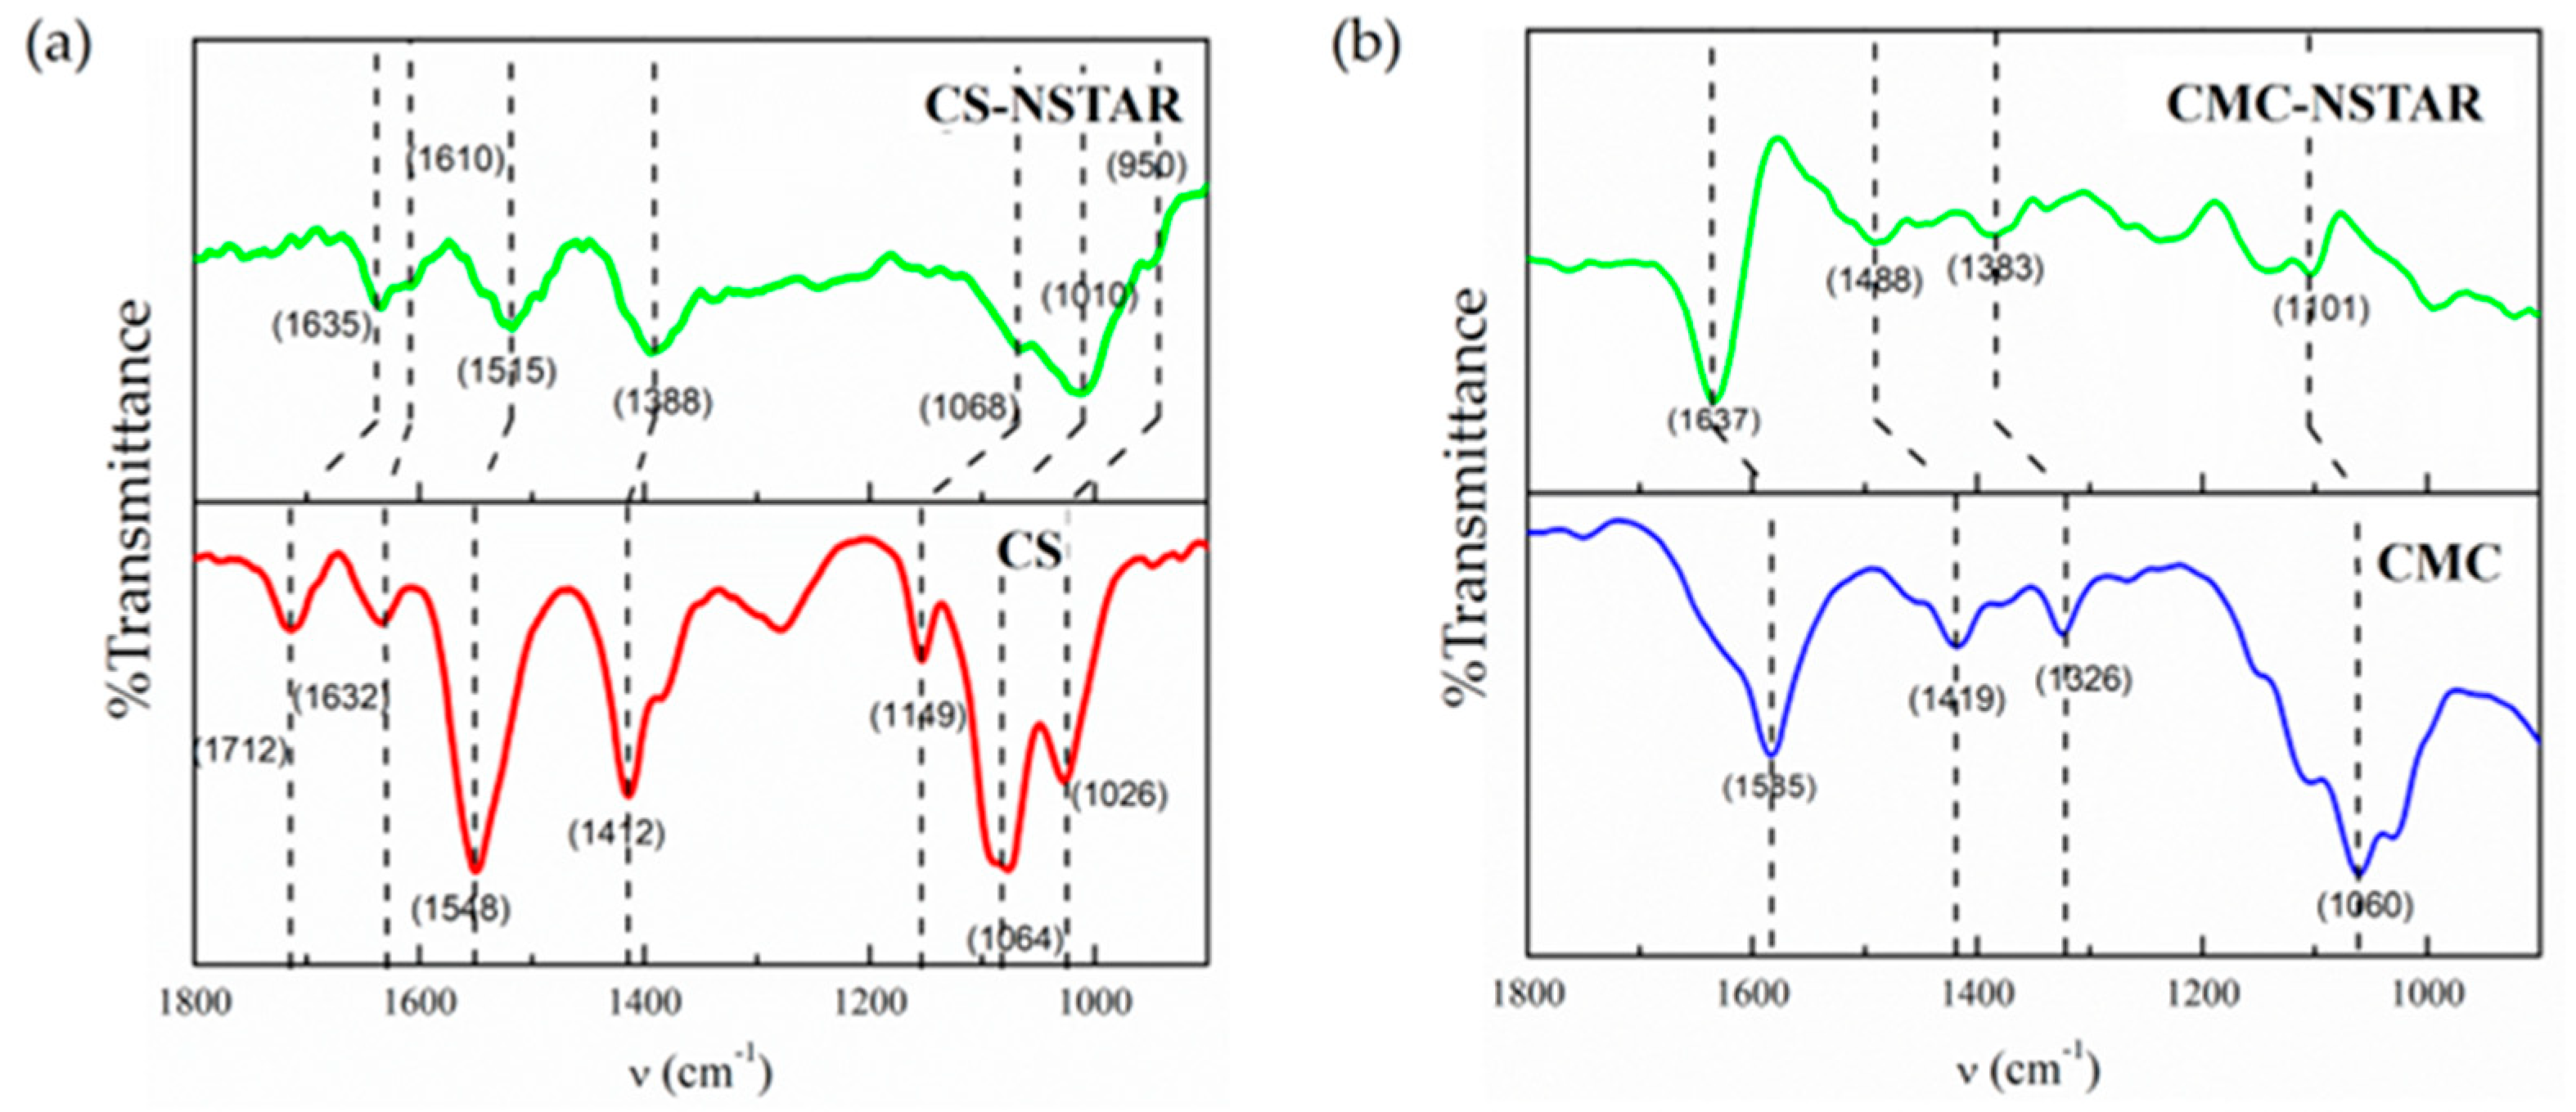
3.1.5. FTIR-ATR
3.2. Removal of Cr(VI)
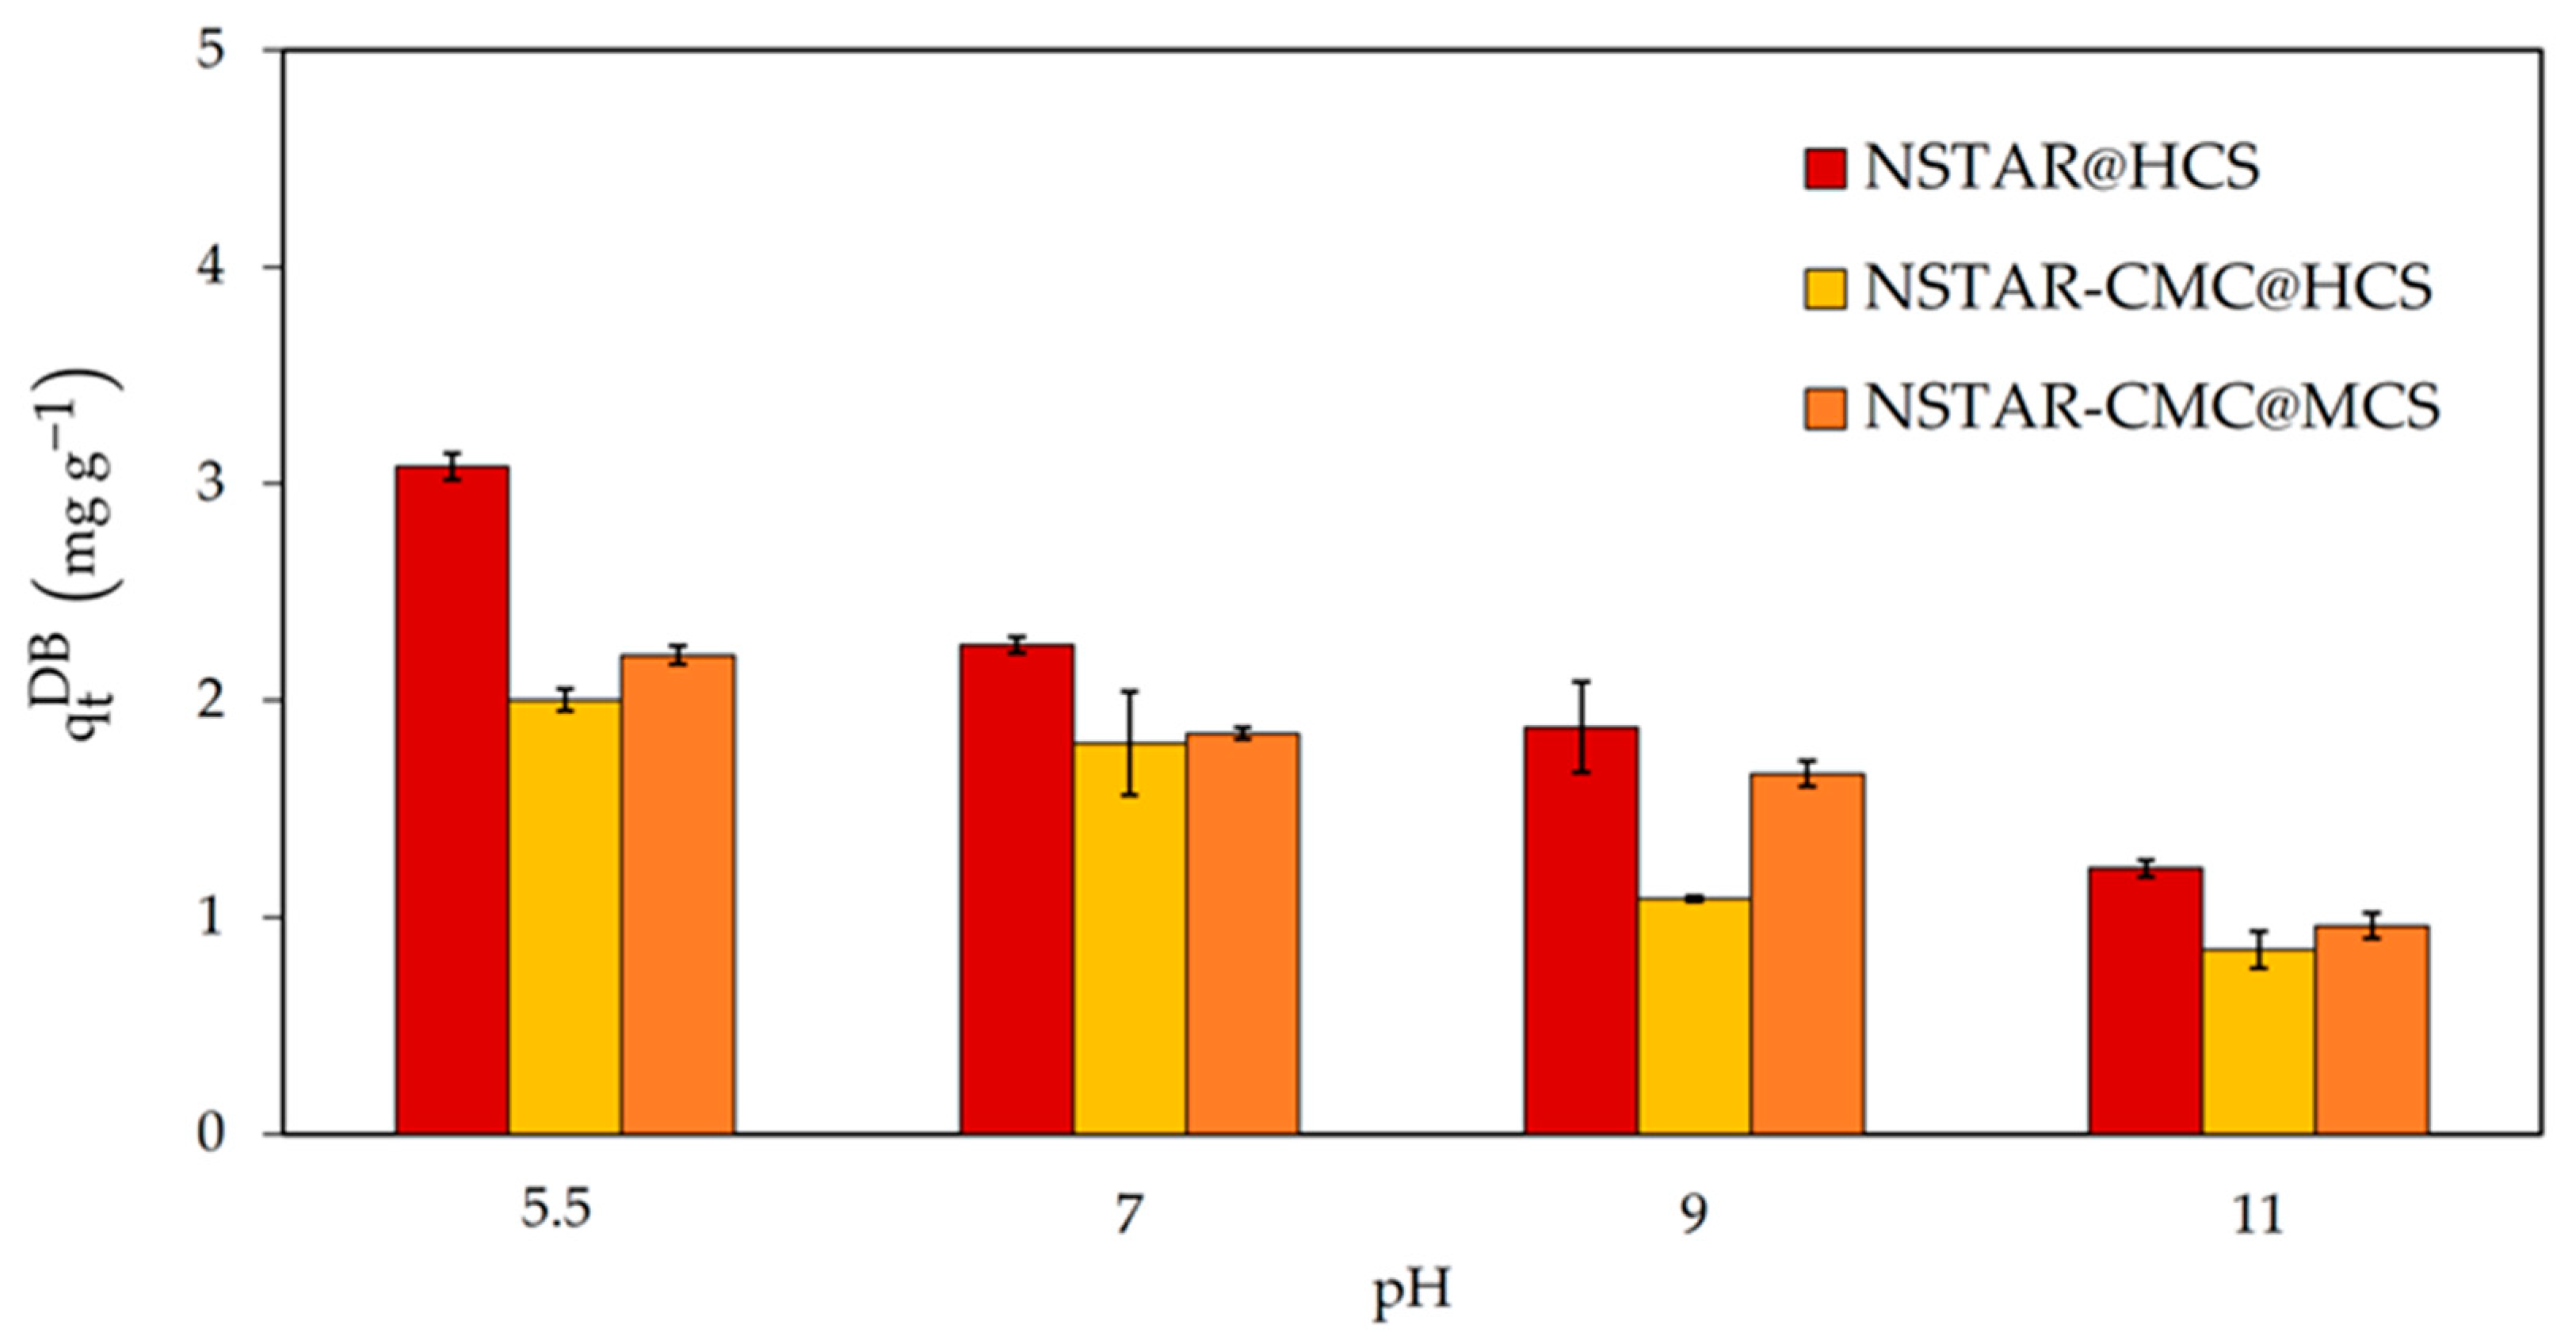
3.2.1. Removal of Cr(VI) in Synthetic Aqueous Solutions: pH and Immobilization and Type of NCs as Variables
3.2.2. Cr(VI) Removal in Real Water: Kinetics
3.2.3. Chromium Removal Capacity in Real Water
3.2.4. Variation of Carbon Content after Treatment
3.2.5. Cost Analysis and Feasibility of NSTAR@HCS for Cr(VI) Effluent Treatment
4. Conclusions
Supplementary Materials
Author Contributions
Funding
Data Availability Statement
Acknowledgments
Conflicts of Interest
References
- De Souza Nascimento, E.; Filho, A.T. Chemical waste risk reduction and environmental impact generated by laboratory activities in research and teaching institutions. Braz. J. Pharm. Sci. 2010, 46, 187–198. [Google Scholar] [CrossRef]
- Osiska, R.M.; Benitez, M.E.; Gimenez, M.C. Gestión y Manejo de Residuos Químicos en el Laboratorio: Una Manera de Prevenir la Contaminación del Medio Ambiente; Reunión de Comunicaciones Científicas y Tecnológicas; Universidad Nacional del Nordeste: Corrientes, Argentina, 2004. [Google Scholar]
- Antoniassi, B.; Araujo, V.; Chaves, M.; Telascrea, M.; Kempa, M.; Bersanetti, B. Analysis of the Economic Viability in the Implementation of the Chemical Waste Management System in Teaching and Research Laboratories. J. Sustain. Dev. 2017, 10, 112. [Google Scholar] [CrossRef]
- Gao, Y.; Yang, X.; Lu, X.; Li, M.; Wang, L.; Wang, Y. Kinetics and Mechanisms of Cr(VI) Removal by nZVI: Influencing Parameters and Modification. Catalysts 2022, 12, 999. [Google Scholar] [CrossRef]
- Liu, A.; Liu, J.; Han, J.; Zhang, W.X. Evolution of nanoscale zero-valent iron (nZVI) in water: Microscopic and spectroscopic evidence on the formation of nano- and micro-structured iron oxides. J. Hazard. Mater. 2017, 322, 129–135. [Google Scholar] [CrossRef] [PubMed]
- Quici, N.; Meichtry, M.; Montesinos, V.N. Use of Nanoparticulated Iron Materials for Chromium, Arsenic, and Uranium Removal from Water. In Iron Nanomaterials for Water and Soil Treatment; Marta, I.L., Quici, N., Meichtry, J.M., Eds.; Pan Stanford Publishing: Palo Alto, CA, USA, 2018; pp. 177–188. [Google Scholar]
- Barka, E.; Noutsopoulos, C.; Galani, A.; Panagou, I.; Kalli, M.; Koumaki, E.; Malamis, S.; Mamais, D. Removal of Contaminants of Emerging Concern from Wastewater Using an Integrated Column System Containing Zero Valent Iron Nanoparticles. Water 2023, 15, 598. [Google Scholar] [CrossRef]
- Li, S.; Wang, W.; Liang, F.; Zhang, W. Heavy metal removal using nanoscale zero-valent iron (nZVI): Theory and application. J. Hazard. Mater. 2016, 322, 163–171. [Google Scholar] [CrossRef]
- Crane, R.A.; Scott, T.B. Nanoscale zero-valent iron: Future prospects for an emerging water treatment technology. J. Hazard. Mater. 2012, 211–212, 112–125. [Google Scholar] [CrossRef]
- Liu, J.; Sun, S.; Zhang, H.; Kong, Q.; Li, Q.; Yao, X. Remediation materials for the immobilization of hexavalent chromium in contaminated soil: Preparation, applications, and mechanisms. Environ. Res. 2023, 237, 116918. [Google Scholar] [CrossRef]
- ACUMAR: Anexos Resolución E 46/2017. Available online: https://servicios.infoleg.gob.ar/infolegInternet/anexos/270000-274999/273042/res46.pdf (accessed on 15 April 2024).
- Raji, M.; Mirbagheri, S.A.; Ye, F.; Dutta, J. Nano zero-valent iron on activated carbon cloth support as Fenton-like catalyst for efficient color and COD removal from melanoidin wastewater. Chemosphere 2021, 263, 127945. [Google Scholar] [CrossRef]
- Ibrahim, H.M.; Awad, M.; Al-Farraj, A.S.; Al-Turki, A.M. Stability and dynamic aggregation of bare and stabilized zero-valent iron nanoparticles under variable solution chemistry. Nanomaterials 2020, 10, 192. [Google Scholar] [CrossRef]
- Subedi, N.; Lähde, A.; Abu-Danso, E.; Iqbal, J.; Bhatnagar, A. A comparative study of magnetic chitosan (Chi@Fe3O4) and graphene oxide modified magnetic chitosan (Chi@Fe3O4GO) nanocomposites for efficient removal of Cr(VI) from water. Int. J. Biol. Macromol. 2019, 137, 948–959. [Google Scholar] [CrossRef] [PubMed]
- Wang, J.; Zhuang, S. Removal of various pollutants from water and wastewater by modified chitosan adsorbents. Crit. Rev. Environ. Sci. Technol. 2017, 47, 2331–2386. [Google Scholar] [CrossRef]
- Ahmadi, M.; Foladivanda, M.; Jaafarzadeh, N.; Ramezani, Z.; Ramavandi, B.; Jorfi, S.; Kakavandi, B. Synthesis of chitosan zero-valent iron nanoparticles-supported for cadmium removal: Characterization, optimization and modeling approach. J. Water Supply Res. Technol. Aqua 2017, 66, 116–130. [Google Scholar] [CrossRef]
- Thomas, S. Advances in Natural Polymers; Springer: Berlin/Heidelberg, Germany, 2013. [Google Scholar]
- Cumbal, L.; Zuñiga, M. Chitosan dispersed with Fe(III) oxide particles: A sorbent used for selective removal of arsenic from contaminated waters. In The Global Arsenic Problem; CRC Press: Boca Raton, FL, USA, 2010. [Google Scholar] [CrossRef]
- Weisz, A.D.; Rodenas, L.G.; Morando, P.J.; Regazzoni, A.E.; Blesa, M.A. FTIR study of the adsorption of single pollutants and mixtures of pollutants onto titanium dioxide in water: Oxalic and salicylic acids. Catal. Today 2002, 76, 103–112. [Google Scholar] [CrossRef]
- Eckert, J.M.; Judd, R.J.; Lay, P.A. Response of chromium (V) to the diphenylcarbazide spectrophotometric method for the determination of chromium (VI). Anal. Chim. Acta 1991, 255, 31–33. [Google Scholar] [CrossRef]
- Liu, J.F.; Zhao, Z.S.; Jiang, G.B. Coating Fe3O4 magnetic nanoparticles with humic acid for high efficient removal of heavy metals in water. Environ. Sci. Technol. 2008, 42, 6949–6954. [Google Scholar] [CrossRef]
- Schwertmann, U.; Carlson, L. Iron Oxides in the Laboratory: Preparation and Characterization, 2nd ed.; John Wiley & Sons: Hoboken, NJ, USA, 2000; pp. 125–147. ISBN 9783527296699. [Google Scholar]
- Kumar, S.; Koh, J. Physiochemical, optical and biological activity of chitosan-chromone derivative for biomedical applications. Int. J. Mol. Sci. 2012, 13, 6102–6116. [Google Scholar] [CrossRef] [PubMed]
- Coreño-Alonso, J.; Teresa Méndez-Bautista, M. Relación estructura-propiedades de polímeros. Educ. Quím. 2010, 21, 291–299. [Google Scholar] [CrossRef]
- Morello, G.; Quarta, A.; Gaballo, A.; Moroni, L.; Gigli, G.; Polini, A.; Gervaso, F. A thermo-sensitive chitosan/pectin hydrogel for long-term tumor spheroid culture. Carbohydr. Polym. 2021, 274, 118633. [Google Scholar] [CrossRef]
- Morello, G.; Polini, A.; Scalera, F.; Rizzo, R.; Gigli, G.; Gervaso, F. Preparation and characterization of salt-mediated injectable thermosensitive chitosan/pectin hydrogels for cell embedding and culturing. Polymers 2021, 13, 2674. [Google Scholar] [CrossRef]
- Wang, C.; Tong, X.; Yang, F. Bioengineered 3D brain tumor model to elucidate the effects of matrix stiffness on glioblastoma cell behavior using peg-based hydrogels. Mol Pharm. 2014, 11, 2115–2125. [Google Scholar] [CrossRef]
- Liu, T.; Sun, Y.; Wang, Z.L. Stabilized chitosan/Fe0-nanoparticle beads to remove heavy metals from polluted sediments. Water Sci. Technol. 2016, 73, 1090–1097. [Google Scholar] [CrossRef]
- Dima, J.B.; Sequeiros, C.; Zaritzky, N.E. Hexavalent chromium removal in contaminated water using reticulated chitosan micro/nanoparticles from seafood processing wastes. Chemosphere 2015, 141, 100–111. [Google Scholar] [CrossRef] [PubMed]
- Horzum, N.; Demir, M.M.; Nairat, M.; Shahwan, T. Chitosan fiber-supported zero-valent iron nanoparticles as a novel sorbent for sequestration of inorganic arsenic. RSC Adv. 2013, 3, 782. [Google Scholar] [CrossRef]
- He, F.; Zhao, D.; Liu, J.; Roberts, C.B. Stabilization of Fe-Pd Nanoparticles with Sodium Carboxymethyl Cellulose for Enhanced Transport and Dechlorination of Trichloroethylene in Soil and Groundwater. Ind. Eng. Chem. Res. 2007, 5, 70–72. [Google Scholar] [CrossRef]
- Socrates, G. Infrared and Raman Characteristic Group Frequencies Contents, 3rd ed.; John Wiley & Sons, Ltd.: Hoboken, NJ, USA, 2001; ISBN 0470093072. [Google Scholar]
- Zia, K.M.; Zuber, M.; Bhatti, I.A.; Barikani, M.; Sheikh, M.A. Evaluation of biocompatibility and mechanical behavior of polyurethane elastomers based on chitin/1,4-butane diol blends. Int. J. Biolog. Macromol. 2009, 44, 18–22. [Google Scholar] [CrossRef]
- Bhatia, S.C.; Ravi, N. A magnetic study of an Fe-chitosan complex and its relevance to other biomolecules. Biomacromolecules 2000, 1, 413–417. [Google Scholar] [CrossRef]
- Jones, F.; Rohl, A.L.; Farrow, J.B.; van Bronswijk, W. Molecular modeling of water adsorption on hematite. Phys. Chem. Chem. Phys. 2000, 2, 3209–3216. [Google Scholar] [CrossRef]
- Montesinos, V.N.; Quici, N.; Litter, M.I. Visible light enhanced Cr(VI) removal from aqueous solution by nanoparticulated zerovalent iron. Catal. Commun. 2014, 46, 57–60. [Google Scholar] [CrossRef]
- Mohan, D.; Pittman, C.U. Activated carbons and low cost adsorbents for remediation of tri- and hexavalent chromium from water. J. Hazard. Mater. 2006, 137, 762–811. [Google Scholar] [CrossRef]
- Takeno, N. Atlas of Eh-pH Diagrams Intercomparison of Thermodynamic Databases; National Institute of Advanced Industrial Science and Technology: Tsukuba, Japan, 2005; ISBN 978-0915567980.
- Xu, P.; Bajaj, G.; Shugg, T.; Van Alstine, W.G.; Yeo, Y. Zwitterionic chitosan derivatives for pH-sensitive stealth coating. Biomacromolecules 2010, 11, 2352–2358. [Google Scholar] [CrossRef] [PubMed]
- Metodiev, A. Electric Properties of Carboxymethyl Cellulose. Chapter 8 in: Cellulose—Fundamental Aspects; InTech: London, UK, 2013. [Google Scholar] [CrossRef]
- Sun, Y.P.; Li, X.; Cao, J.; Zhang, W.; Wang, H.P. Characterization of zero-valent iron nanoparticles. Adv. Colloid Interface Sci. 2006, 120, 47–56. [Google Scholar] [CrossRef] [PubMed]
- Cuba-Chiem, L.T.; Huynh, L.; Ralston, J.; Beattie, D.A. In Situ Particle Film ATR FTIR Spectroscopy of Carboxymethyl Cellulose Adsorption on Talc: Binding Mechanism, pH Effects, and Adsorption Kinetics. Langmuir 2008, 24, 8036–8044. [Google Scholar] [CrossRef]
- Liu, T.; Zhao, L.; Sun, D.; Tan, X. Entrapment of nanoscale zero-valent iron in chitosan beads for hexavalent chromium removal from wastewater. J. Hazard. Mater. 2010, 184, 724–730. [Google Scholar] [CrossRef]
- Liu, T.Y.; Zhao, L.; Wang, Z.L. Removal of hexavalent chromium from wastewater by Fe0-nanoparticles-chitosan composite beads: Characterization, kinetics and thermodynamics. Water Sci. Technol. 2012, 66, 1044–1051. [Google Scholar] [CrossRef] [PubMed]
- Liu, T.; Wang, Z.-L.; Zhao, L.; Yang, X. Enhanced chitosan/Fe0-nanoparticles beads for hexavalent chromium removal from wastewater. Chem. Eng. J. 2012, 189–190, 196–202. [Google Scholar] [CrossRef]
- Jawed, A.; Golder, A.K.; Pandey, L.M. Bio-based iron oxide nanoparticles forming bi-functional chitosan composite adsorbent for Cr(VI) decontamination. Chem. Eng. J. 2024, 481, 148411. [Google Scholar] [CrossRef]
- NANOIRON. Manual for Preparation of an Aqueous Dispersion from NSTAR Powder. 2024. Available online: https://nanoiron.cz/en/products/zero-valent-iron-nanoparticles/nanofer-star (accessed on 15 May 2024).
- Sciscenko, I.; Luca, V.; Ramos, C.P.; Scott, T.B.; Montesinos, V.N.; Quici, N. Immobilization of nanoscale zerovalent iron in hierarchically channelled polyacrylonitrile for Cr(VI) remediation in wastewater. J. Water Process Eng. 2021, 39, 101704. [Google Scholar] [CrossRef]
- Parnis, M.; García, F.E.; Toledo, M.V.; Montesinos, V.N.; Quici, N. Zerovalent Iron Nanoparticles-Alginate Nanocomposites for Cr(VI) Removal in Water—Influence of Temperature, pH, Dissolved Oxygen, Matrix, and nZVI Surface Composition. Water 2022, 14, 484. [Google Scholar] [CrossRef]
- Zhang, B.; Wu, Y.; Fan, Y. Synthesis of Novel Magnetic NiFe2O4 Nanocomposite Grafted Chitosan and the Adsorption Mechanism of Cr(VI). J. Inorg. Organomet. Polym. Mater. 2019, 29, 290–301. [Google Scholar] [CrossRef]
- Wang, T.; Sun, Y.; Bai, L.; Han, C.; Sun, X. Ultrafast removal of Cr(VI) by chitosan coated biochar-supported nano zero-valent iron aerogel from aqueous solution: Application performance and reaction mechanism. Sep. Purif. Technol. 2023, 306, 122631. [Google Scholar] [CrossRef]
- Reinsch, B.C.; Forsberg, B.; Penn, R.L.; Kim, C.S.; Lowry, G.V. Chemical transformations during aging of zerovalent iron nanoparticles in the presence of common groundwater dissolved constituents. Environ. Sci. Technol. 2010, 44, 3455–3461. [Google Scholar] [CrossRef] [PubMed]
- Bae, S.; Collins, R.; Waite, T.; Hanna, K. Advances in Surface Passivation of Nanoscale Zerova-lent Iron A. Critical Review. Environ. Sci. Technol. 2018, 52, 12010–12025. [Google Scholar] [CrossRef] [PubMed]
- Xu, H.; Gao, M.; Hu, X.; Chen, Y.; Li, Y.; Xu, X.; Zhang, R.; Yang, X.; Tang, C.; Hu, X. A novel preparation of S-nZVI and its high efficient removal of Cr(VI) in aqueous solution. J. Hazard. Mater. 2021, 416, 125924. [Google Scholar] [CrossRef]
- Chen, X.L.; Li, F.; Xie, X.J.; Li, Z.; Chen, L. Nanoscale zero-valent iron and chitosan functionalized eichhornia crassipes biochar for efficient hexavalent chromium removal. Int. J. Environ. Res. Public Health 2019, 16, 3046. [Google Scholar] [CrossRef]
- Wojnárovits, L.; Homlok, R.; Kovács, K.; Tegze, A.; Takács, E. Wastewater Characterization: Chemical Oxygen Demand or Total Organic Carbon Content Measurement? Molecules 2024, 29, 405. [Google Scholar] [CrossRef]

 correspond to the stress*–strain curves M1, M2, M3, and M4, respectively, registered for each CS-based sphere.
correspond to the stress*–strain curves M1, M2, M3, and M4, respectively, registered for each CS-based sphere.
correspond to the stress*–strain curves M1, M2, M3, and M4, respectively, registered for each CS-based sphere.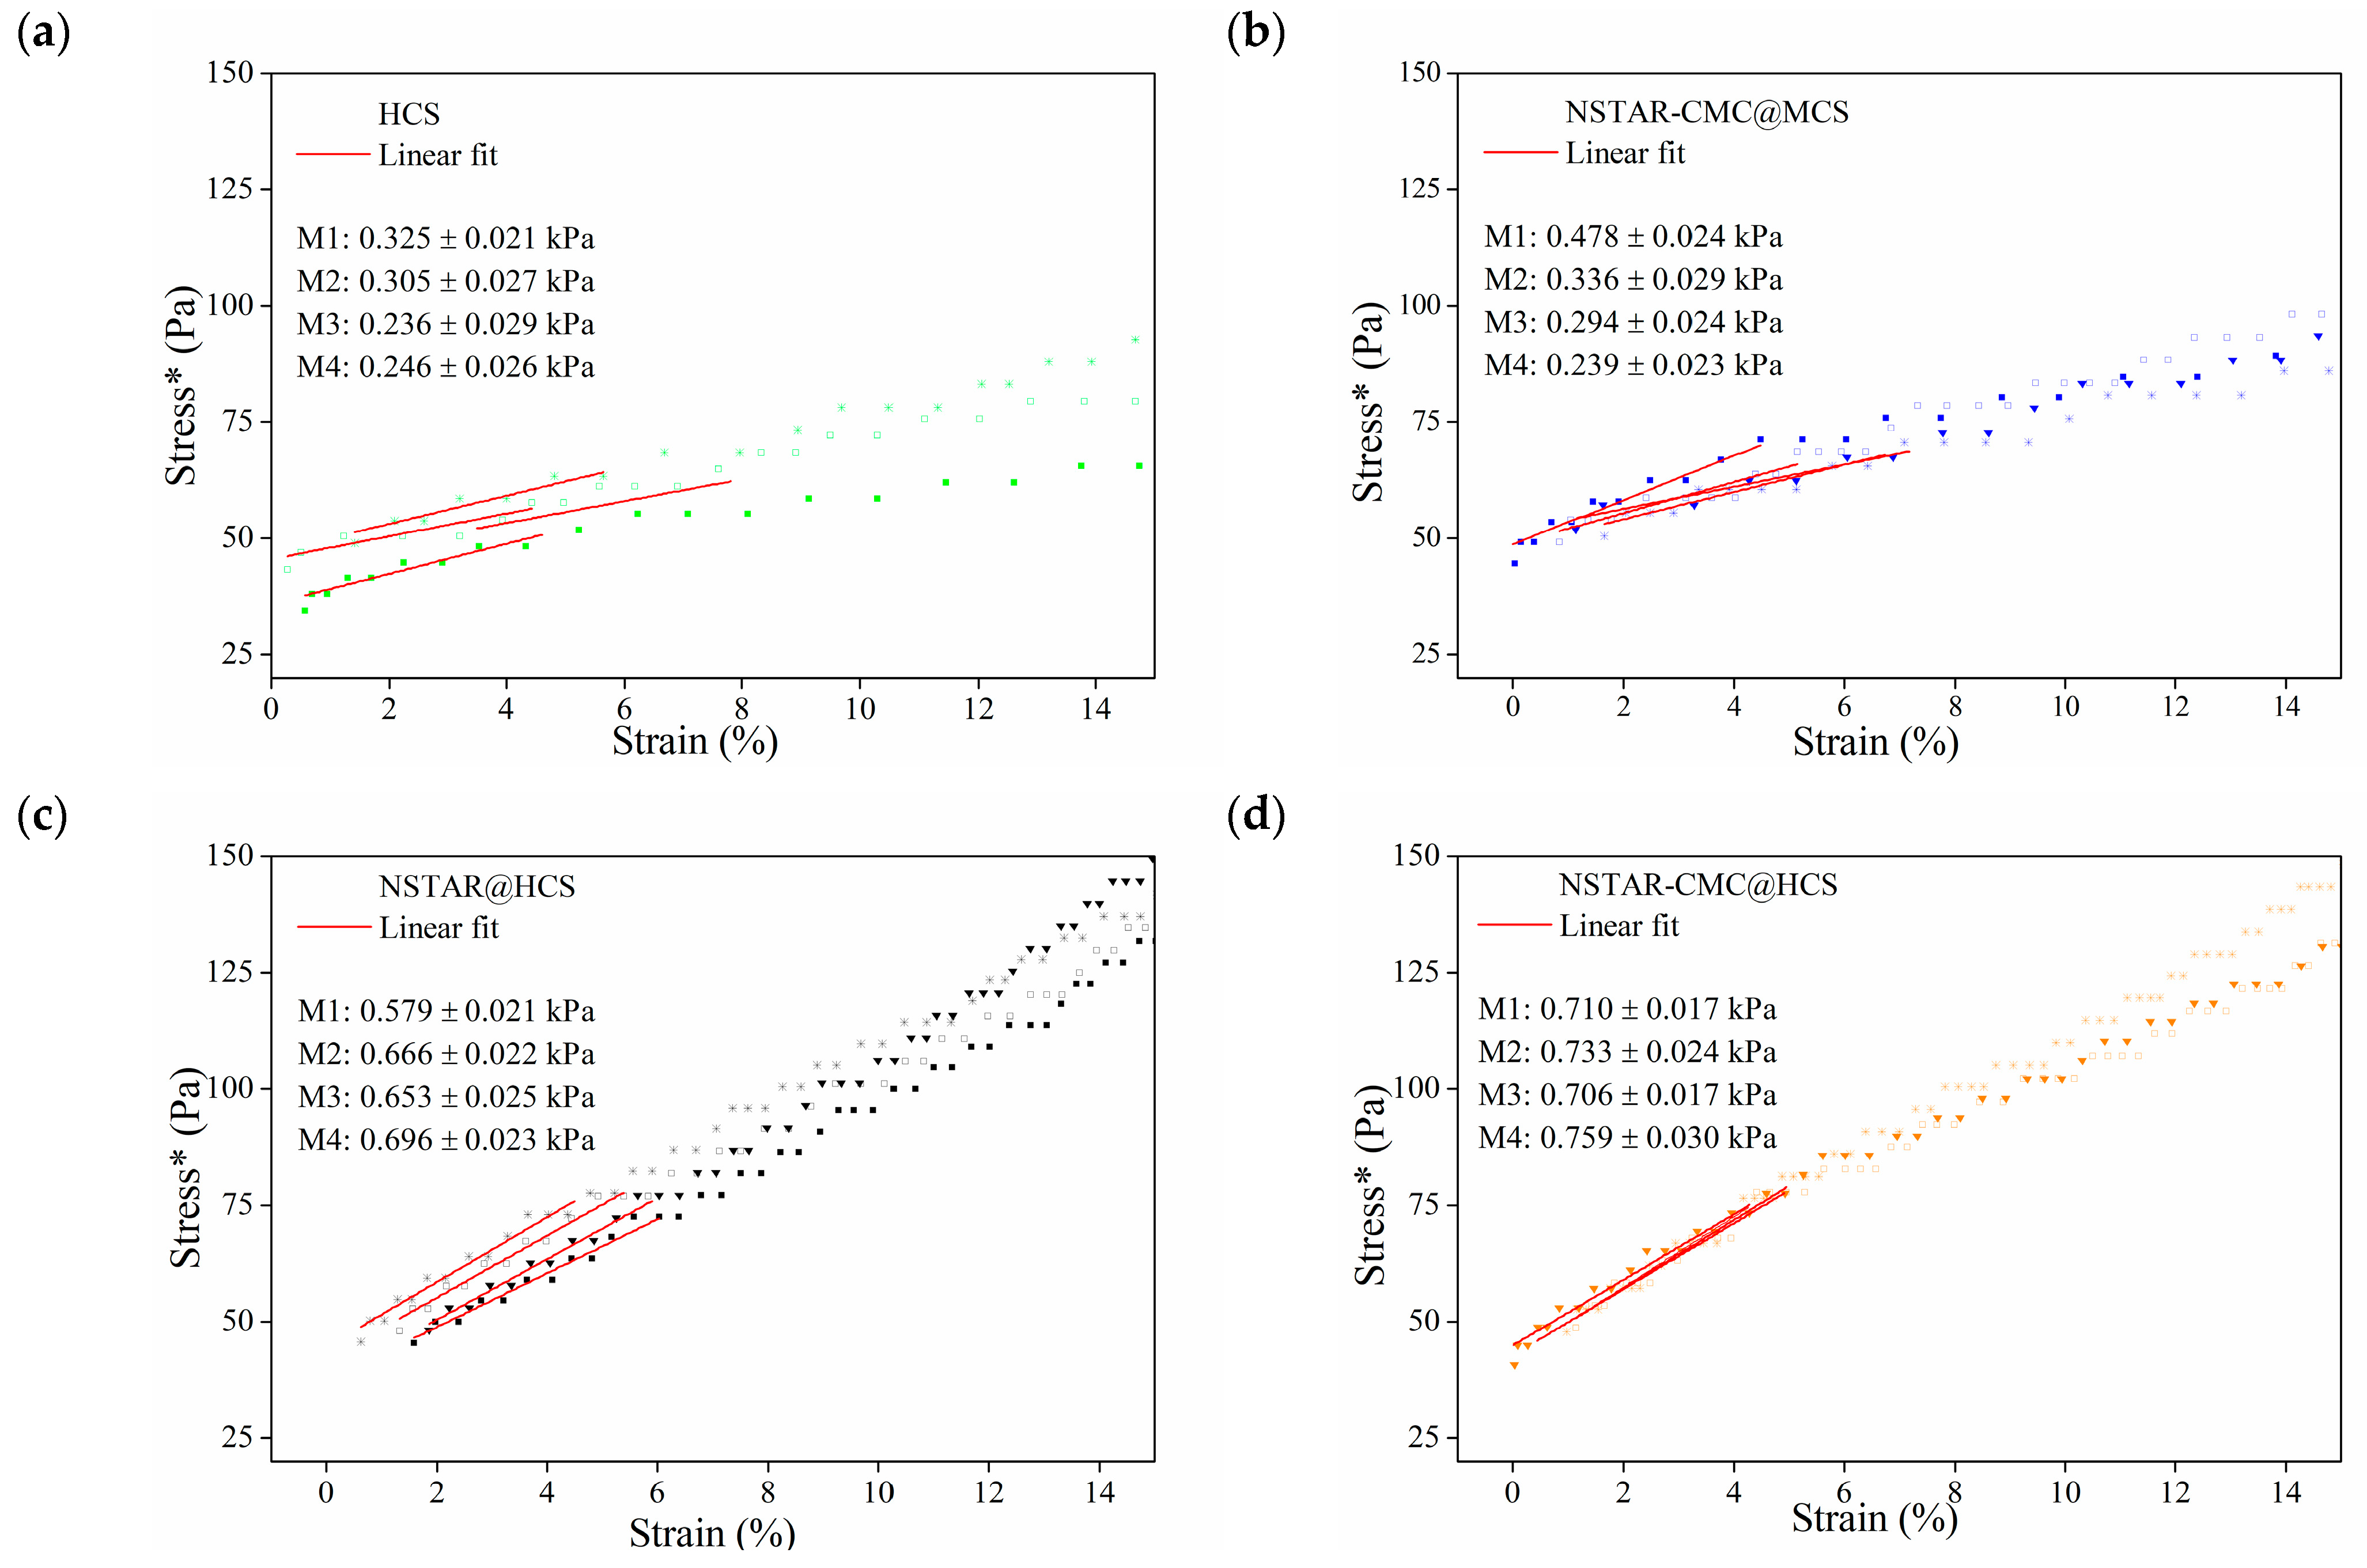

| Sample Type | pH | TOC (ppm) | Composition | Concentration (ppm) |
|---|---|---|---|---|
| Aqueous | 6.5 | TC: 3.77 IC: 3.55 TOC: 0.22 | S | 12.08 ± 0.16 |
| Cl | 64.18 ± 0.31 | |||
| K | 26.98 ± 0.13 | |||
| Ca | 76.96 ± 0.18 | |||
| Cr | 31.94 ± 0.073 | |||
| Fe | 0.055 ± 0.002 | |||
| Zn | 0.03 ± 0.001 |
| Ref. | [Cr(VI)]0 (mM) | Material | pH | t (min) | qtDB (mg Cr(VI) g−1FeNPs) | |
|---|---|---|---|---|---|---|
| NPs | NCs | |||||
| This work | 0.065 | commercial | nZVI@HCS | 5.5 | 120 | 6.4 |
| 7 | 4.7 | |||||
| [43] | 0.385 | commercial | nZVI@CS | 6.4 | 40 | 1.6 |
| [44] | 0.385 | commercial | nZVI@CS | 3.9 | 60 | 4.0 |
| [45] | 0.385 | commercial | nZVI@CS | 3 | 60 | 6.0 |
| [46] | 0.961 | Laboratory synthesized | IONPs@CS | 6 | 480 | 4.4 |
| Model | Experiment (m NCs) | |||||
|---|---|---|---|---|---|---|
| 1 g | 2 g | 3 g | 4 g | 6 g | ||
| Pseudo 1st order | 0.08 | 0.04 | 0.08 | 0.06 | 0.05 | |
| () | 0.18 | 0.19 | 0.18 | 0.22 | 0.18 | |
| 0.96 | 0.95 | 0.89 | 0.93 | 0.91 | ||
| Pseudo 2nd order | ( | |||||
| qeWB (mg g−1) | 0.21 | 0.21 | 0.21 | 0.24 | 0.20 | |
| R2 | 0.95 | 0.97 | 0.95 | 0.97 | 0.96 | |
| Intraparticular diffusion | k | 0.02 | 0.02 | 0.02 | 0.02 | 0.02 |
| R2 | 0.69 | 0.93 | 0.79 | 0.87 | 0.88 | |
| Ref. | Material | Pollutant | Constants Adjustment Pseudo 2nd Order (g min−1mg−1) | R2 |
|---|---|---|---|---|
| This work | nZVI@CS | Cr(VI) | 0.34 | 0.96 |
| [50] | NiFe2O4-CS | Cr(VI) | 0.98 | |
| [51] | CS-nZVI@BC-hydrogel | Cr(VI) | 0.99 | |
| [54] | BC stabilized with nZVI supported in CS | Cr(VI) | 0.99 | |
| [55] | nZVI-BC | Cr(VI) | 0.44 | 0.88 |
| Treatment with NCs | Mass of Material (g) | Cost per Unit Mass (USD/kg) | Total Cost (USD) |
|---|---|---|---|
| NSTAR (NANOIRON) | 43.2 | 430 | 18.6 |
| HCS (GIHON) | 64.8 | 196 | 12.7 |
| Electricity cost | 1.35 USD/h | 10.8 | |
| Synthesis cost (man-hours) | 3.75 USD/h | 30 | |
| NSTAR@HCS | TOTAL | 72.1 | |
Disclaimer/Publisher’s Note: The statements, opinions and data contained in all publications are solely those of the individual author(s) and contributor(s) and not of MDPI and/or the editor(s). MDPI and/or the editor(s) disclaim responsibility for any injury to people or property resulting from any ideas, methods, instructions or products referred to in the content. |
© 2024 by the authors. Licensee MDPI, Basel, Switzerland. This article is an open access article distributed under the terms and conditions of the Creative Commons Attribution (CC BY) license (https://creativecommons.org/licenses/by/4.0/).
Share and Cite
Rychluk, I.D.; Casado, U.; Montesinos, V.N.; Quici, N. Harnessing Chitosan Beads as an Immobilization Matrix for Zero-Valent Iron Nanoparticles for the Treatment of Cr(VI)-Contaminated Laboratory Residue. Processes 2024, 12, 2101. https://doi.org/10.3390/pr12102101
Rychluk ID, Casado U, Montesinos VN, Quici N. Harnessing Chitosan Beads as an Immobilization Matrix for Zero-Valent Iron Nanoparticles for the Treatment of Cr(VI)-Contaminated Laboratory Residue. Processes. 2024; 12(10):2101. https://doi.org/10.3390/pr12102101
Chicago/Turabian StyleRychluk, Ignacio Daniel, Ulises Casado, Víctor Nahuel Montesinos, and Natalia Quici. 2024. "Harnessing Chitosan Beads as an Immobilization Matrix for Zero-Valent Iron Nanoparticles for the Treatment of Cr(VI)-Contaminated Laboratory Residue" Processes 12, no. 10: 2101. https://doi.org/10.3390/pr12102101