Article

Adsorption of Methylene Blue and Eriochrome Black T onto Pinecone Powders (Pinus nigra Arn.): Equilibrium, Kinetics, and Thermodynamic Studies

Department of Environmental Protection and Control-Iskenderun Vocational School of Higher Education, Iskenderun Technical University, Hatay 31200, Turkey
Processes 2024, 12(9), 2044; https://doi.org/10.3390/pr12092044
Submission received: 16 April 2024 / Revised: 30 April 2024 / Accepted: 20 September 2024 / Published: 22 September 2024

Abstract

:
In this study, methylene blue (MB) and eriochrome black T (EBT) dyes were removed with the waste Pinus nigra Arn. powders from Anatolian black pinecone (PC-PnA) within the framework of sustainability. UV–Vis spectroscopy, X-ray diffraction (XRD), scanning electron microscope (SEM), energy dispersive X-ray (EDX), fourier transform infrared spectroscopy (FTIR), thermogravimetry–differential thermal analysis (TGA-DTA), Brunauer–Emmett–Teller (BET) surface area, and point of zero charge (pHpzc) analyses were performed for the characterization of PC-PnAs. The effects of pH, amount of adsorbent, time, initial concentration and temperature were determined by batch adsorption experiments. Four kinetic and isotherm models were examined, and error function tests were used for the most suitable model. According to this, the average pore diameters, mass losses at 103.9 and 721.6 °C and pHpzc values of PC-PnAs were found as 61.661 Å, 5.9%, 30%, and 5.77, respectively. Additionally, the most suitable kinetic and isotherm models for the removal of both dyes were Langmuir and pseudo-second-order. The maximum removal efficiencies (qmax) for MB and EBT dyes was calculated as 91.46 and 15.85 mg/g, respectively and the adsorption process was found to be endothermic. As a result, PC-PnA particles can be used as an alternative sorbent for the removal of MB and EBT dyes.

1. Introduction

As a result of uncontrolled growth ignoring environmental sensitivities, excessive amounts of wastewater are discharged into the ecosystem. On the other hand, limited water resources and increasing demand for safe water show the seriousness of the situation. Agricultural, industrial and domestic wastewater discharged into the aquatic ecosystem contains many polluting elements [1]. These are wastewaters containing toxic pollutants such as dyes, heavy metals, surfactants, personal care products, fertilizers, agricultural products, pesticides, and pharmaceuticals [2]. Among these wastewaters, one of the wastewaters that is most threatening and toxic to the environment is paint wastewater [3]. Approximately 7 × 10⁷ tons of synthetic dyes are produced annually in the world, and these dyes are used in many sectors such as textile, plastic, food, feed, cosmetics, tanneries, and printing houses. More than 10,000 tons of these dyes are used by textile industries [4]. It is inevitable that colored waste will emerge as a result of these dyes being used [5].
These wastewaters discharged into the ecosystem contain many different pollutants such as organic, inorganic and heavy metals. Approximately 72 toxic chemicals have been detected in water resulting from textile dyeing alone [6]. When these dyes are uncontrolledly discharged into the aquatic ecosystem, they disrupt the balance of photosynthesis by increasing biochemical and chemical oxygen demand [7]. Dyes suppress plant growth by interacting with synthetic intermediates or degradation products. They also increase potential toxicity, mutagenicity and carcinogenicity for flora and fauna through biomagnification within the food chain [3,8]. Among these toxic dyes, EBT MB dyes are the most used ones and those that exhibit significant resistance to environmental degradation and cause permanent effects [9,10,11]. EBT, a naphthol azo dye, is resistant to oxidative biodegradation [12,13]. MB, which is also in the same cationic dye class, is a dye with an aromatic heterocyclic ring containing chemically sulfur and nitrogen atoms, which has negative effects on the aquatic ecosystem [14].
Various physicochemical and microbial processes have been tried by researchers for the purification of dyes, and accordingly various techniques such as chemical oxidation, ozonation, coagulation, ion exchange, electrochemical processes, membrane methods and adsorption have been developed [15,16,17,18]. Among these methods, the adsorption technique, which is one of the methods that attracts the attention of researchers, is considered as one of the easiest, simplest, flexible, functional, insensitive to harmful pollutants and economically suitable methods in wastewater treatment [16,19]. Biosorbents such as plant residues, bacteria, algae, fungi, external parts of animals and fruits, activated sludge, and biopolymers are available to remove pollutants from wastewater [20,21,22]. Since cost is a very important parameter for any adsorbent, researchers have recently shown interest in the use of agricultural wastes such as almond shells, wheat bran, rice husks, and pinecone wood as low-cost adsorbents for dye removal [23]. Agricultural and vegetal wastes are preferred in adsorption applications due to their abundance in nature and easy availability, compared to the high cost of activated carbon and other adsorbents [24]. Plant parts, like most plant-based biomaterials, can sequester pollutants in wastewater through intra- and extracellular accumulation, surface adsorption/precipitation, and passive binding to non-living cells. Plant peels are among the most widely applied low-cost biomass materials in studies on the removal of pollutants from the aqueous environment [25].
Among these adsorbents, one of the most promising ones for dye removal but does not have any commercial value is pinecones, which are pine tree waste. Pinecones, which are abundant in forests, consist of cellulose, hemicellulose, lignin, resin and tannins in terms of chemical structure [26]. Pinecones in raw, powder, or granular size are used in some adsorption applications, especially dye and heavy metal removal [27,28]. Black pine (Pinus nigra JF Arnold), a large coniferous, evergreen tree belonging to the Pinaceae family and growing widely in the Mediterranean region, is a conifer of outstanding economic and ecological importance. It is distributed in a wide variety of habitats in Southern and Central Europe, Asia Minor, and North Africa [29].
This study presents a successful and sustainable environmentally friendly method for removing toxicological EBT and MB dyes from water. A biosorbent adsorbent was prepared from pinecones, which is a low-cost and abundant waste material. The adsorption performance on two dyes, EBT and MB, was carried out by batch adsorption experiments. In the study, PC-PnA produced from waste pinecones was used as a potential adsorbent to remove EBT and MB dye from the water environment. The structure of PC-PnA was characterized by various techniques, such as XRD, SEM-EDX, FTIR, TGA-DTA, UV–Vis spectrophotometry, and pHpzc. In addition, kinetics, isotherms and thermodynamics studies, which are the three important components of the adsorption study, were carried out. The effects of temperature and pH on adsorption and thermodynamic parameters were calculated and discussed. Additionally, different kinetic and isotherm models were tried, and the most suitable model was determined with the help of error test functions

2. Materials and Methods

2.1. Chemicals

In laboratory studies, methylene blue in powder form (C16H18ClN3S·xH2O, 319.85 g/mol, ≥95%, Sigma-Aldrich), Eriochrome black T in powder form (C20H12N3NaO7S, 461.38 g/mol, Merck), sodium hydroxide in pellet form (NaOH, 40.00 g/mol, ≥99.0%, Sigma-Aldrich), and sulfuric acid in liquid form (H2(SO4)3, 1.81 g/cm3, ≥90–91%, Merck) were used.

2.2. Preparation of PC-PnA

Cones of the PnA tree in Diyarbakır province (Türkiye) were collected from nature for use in batch adsorption tests. These cones were washed first with tap water and then with distilled water 4–5 times to remove any dirt. Then, it was kept in sunlight for 2 days to dry. Afterward, the size was reduced in the shredding machine and then it was ground into powder in the mill. Then, it was passed through a mechanical sieve with a pore size of 75 microns and was ready to be used in adsorption tests.

2.3. Physicochemical Characterization of PC-PnA

XRD (Rigaku, Minifex 600, Japan) analysis was performed to identify the crystal properties of raw PC-PnA particles, BET analysis (Gemini VII, Micromeritics) was performed to determine surface area, pore volume and pore diameter. Additionally, TG/DTA (Hitachi Exstar, SII TG/DTA 7300) analysis was performed to determine the resistance of raw particles to heat. Additionally, UV-Vis (Hach DR6000, Germany) analysis was performed to detect the distribution of particles in aqueous solution and pHpzc analysis was performed. On the other hand, an attempt was made to determine the morphological structures of both raw and dye-loaded PC-PnA particles with SEM (Leo-Evo 40, England) images. and the elemental compositions of the particles were determined by EDX (Bruker-125 eV, Germany). On the other hand, an attempt was made to determine the morphological structures of both raw and dye-loaded PC-PnA particles with SEM (Leo-Evo 40, England) images, and the elemental compositions of the particles were determined by EDX (Bruker-125 eV, Germany). On the other hand, surface functional groups of raw and dye-loaded particles were determined by FTIR analyzes (FT/IR-6700, Jasco, Japan).

2.4. Adsorption Studies

Stock solutions of MB (500 mg/L) and EBT (250 mg/L) dyes were prepared in laboratory studies. By making dilutions from these stock solutions, intermediate standard solutions were prepared, and the calibration curve was prepared on the UV–Vis spectrometer (DR6000, Hach, Germany). For MB dye, concentration measurement was performed using the equation y = 0.2097x + 0.0131 (R2 = 0.9996) at a wavelength of 668 nm, y = 0.2097x + 0.0131 (R2 = 0.9996) [30] For EBT dye, concentration measurements were made using the equation y = 0.0257x + 0.0126 (R2 = 0.9995) at a wavelength of 526 nm [31]. Batch experiments were performed on an orbital shaker device (Heidolp, Unimax1010, Germany). At the end of the experiment, a sample was taken from the upper phase water to measure the dye concentration in the solution and after centrifugation at 4500 for 5 min, measurements were made at the specified wavelengths on the spectrophotometer.
Equations (1) and (2) were used to interpret the numerical values obtained in laboratory studies.
R % = C 0 C e C 0 × 100
In Equation (1), the removal efficiency was calculated for MB and EBT dyes when the reaction reached equilibrium. Here, the expressions C 0 and C e define the concentrations (mg/L) of MB/EBT in the sediment at the initial and equilibrium state, respectively.
q e = ( C 0 C e ) × V m
Equation (2) was used to determine the amount of dye removed per unit adsorbent. Here, the expressions C 0 and C e define the equilibrium concentration of the dyes at the beginning and end of the reaction (mg/L), the expression m defines the amount of adsorbent (g), and the expression V defines the solution volume (L).

2.4.1. Effect of Experimental Parameters

The effects of environmental parameters on the adsorption of MB and EBT dyes on PC-PnA adsorbent were examined. In this context, studies were carried out primarily at room temperature in an orbital shaker at 200 rpm. The methodology of the experimental studies is as follows. First of all, the optimum pH was determined by keeping other parameters constant. Then, the optimum amount of adsorbent, then the effect of time and finally effect of the initial dye concentration were determined. First of all, the effect of variable pH was determined for MB dye. For this purpose, other parameters were kept constant. Experiments were carried out at varying pHs (3, 5, 7, 9 and 11) with a reaction time of 60 min in the presence of a fixed 1.0 g/L PC-PnA at a fixed initial concentration (C0:10 mg/L) in a volume of 10 mL at room temperature. Then, to determine the optimum amount of adsorbent, experiments were carried out in 50 mL volume at pH 3, room temperature, 60 min reaction time, constant initial concentration (C0:10 mg/L) and variable adsorbent amounts (0.4–1.8 g/L). After pH and adsorbent dosage were clarified, the effect of time on adsorption was tried to be determined. For this purpose, dye concentration measurements were made over time in the presence of 1.6 g/L adsorbent at pH 3.0, at an initial dye concentration of 10 mg/L in a volume of 100 mL. Finally, in order to determine the effect of the initial dye concentration, experiments were carried out with an initial concentration of 13.17–150 mg/L in a reaction time of 60 min at a dosage of 1.0 g/L adsorbent at pH 3.0.
To find the optimum pH in the EBT dye, an experiment was carried out for 60 min at room temperature, at a constant 5.0 mg/L dye concentration in a volume of 10 mL and at varying pHs (3, 5, 7, 9, and 11) in the presence of 1.0 g/L PC-PnA. Then, to determine the optimum amount of adsorbent, a variable amount of adsorbent (0.4–1.8 g/L) was studied in a volume of 50 mL at pH 3.0 at a dye concentration of 5.0 mg/L. Then, the effect of time was determined in the presence of 1.4 g/L adsorbent at pH 3.0 at an initial dye concentration of 5.0 mg/L in a volume of 100 mL. Then, in the 60 min experiment in the presence of 1.0 g/L adsorbent at pH 3.0, the initial concentration was changed between 13.17–150 mg/L, and the effect of the initial concentration on the adsorption efficiency was determined.

2.4.2. Adsorption Kinetics

Four different kinetic models were tested to interpret the numerical data obtained in laboratory studies. The mathematical equations of these models are presented in Table 1.
Here, the expressions q e and q t express the pollutant removed per unit adsorbent (mg/g) in equilibrium and at any time t, and K 1 represents the model constant (1/min). On the other hand, K 2 is the constant of that kinetic model (1/min). In addition, α represents the initial adsorption rate (mg/g) and β represents the constant of the model (g/mg). Finally, the term K i d indicates the model constant.

2.4.3. Adsorption Isotherms

Four different isotherm models were tested to interpret the data obtained from experimental studies. The mathematical equations of these models are presented in Table 2.
Here, C e refers to the dye concentration (mg/L) at equilibrium, and q e refers to the pollutant removed per unit adsorbent (mg/g) at equilibrium. Additionally, the terms K F and n are model constants. Again, the term R L is the dispersion constant, and the terms K L and a L are model constants. On the other hand, B term is the cautious constant (J/mol), R term is the universal gas constant (8.314 J/mol.K), T is the temperature (K), and b T is the isotherm heat (kj/mol). On the other hand, K S refers to the isotherm constant (L/g), β S refers to the model exponet and finally a S refers to the isotherm constant (L/g).

3. Results and Discussion

3.1. Characteristic of PC-PnA

3.1.1. Scanning Electron Microscopy (SEM) and Energy-Dispersive X-ray (EDX)

Morphological images of PC-PnAs particles in their raw, MB- and EBT-dye-loaded states were analyzed by SEM (Thermo Fisher Scientific Apreo S). In addition, information about the elemental distributions of the samples was provided by EDS analyses. The findings obtained are presented in Figure 1. The general state of the surface of PC-PnA particles and the state of their active pores are depicted in the figure. In these images, the raw SEM-EDS image of the particles is seen in Figure 1a, the version of the pores and the surface coated with MB dye is seen in Figure 1b, and the version coated with EBT is seen in Figure 1c. In general, when the SEM appearance is examined, the raw images of PC-PnA particles are quite clear, while the images of MB and EBT loaded states are blurrier due to adsorption. Some cracks, irregular shapes, aggregated structures, micropores, and mesopores have been detected in PC-PnA particles [42]. When the elemental weights of PC-PnA particles were examined, it was determined that there were predominantly C and O elements, as well as the presence of Si and Ca elements.

3.1.2. Fourier Transform Infrared Spectroscopy

In experimental studies, FT-IR spectroscopic analysis of raw and loaded PC-PnA was performed (Spotlight 400, Perkin Elmer). In this context, differences in functional groups before and after the reaction were determined. Additionally, the chemical composition of the substance was tried to be determined. The FT-IR spectrum of raw and MB- and EBT-loaded states of PC-PnA is presented in Figure 2.
Vibrations originating from OH groups were observed in the 3200 cm−1 regions in both raw and loaded PC-PnAs [43]. It represents the -CH2 bond in the bands 2903–2920 [44]. 2020–2400 refers to C≡N and C≡C bonds [45]. The peaks seen from 1590–1610 represent C=O bonds [46]. Again, peaks were observed at 1017–1290 cm−1 in all three samples. These peaks are thought to originate from the C-C bonds in the pyranose ring of the cellulose chain, as stated in the literature. [43]. –C–N– and –C–C– bonds are seen between the 520 and 1000 bands [46].

3.1.3. BET Surface Area and Porosity

The surface area, pore volume, and pore diameter of the adsorbent are the main physical properties that determine its quality, intended use and performance. Each material has its own specific properties. Thanks to this specific feature, the intended use can be determined. When the specific specifications of the material are determined, information can be obtained about the adsorption capacity of the pollutant. BET (Gemini VII, Micromeritics) analysis was used to determine the specific surface area of PC-PnA. The average pore size obtained from the analysis, together with the total surface area and pore volume of the material, is presented in Table 3. Additionally, the nitrogen adsorption/desorption isotherm of the obtained adsorbent is presented in Figure 3. According to the figure, an increase in the adsorption/desorption ratio was observed as a result of the increase in the relative pressure applied to the material. The results obtained were close to those of similar biosorbents [47,48].

3.1.4. pHpzc of the PC-PnA

The pHpzc value refers to the value at which the density of electrical charge on the surface of the adsorbent is zero. The charge density is related to the amino and hydroxyl groups, which in turn depend on the pH value of the solution. As the pH of the solution changes, groups on the surface accept/give H+ or OH-. If the pH value of the solution is equal to pHpzc, the adsorbent is neutral. If the pH value is higher than pHpzc, the adsorbent is negatively charged, but if the pH value is below pHpzc, the adsorbent is positively charged. The graphic obtained as a result of the experiment conducted to determine this is presented in Figure 4.
The graph obtained from the difference between the initial pH value and the final pH value gives the pHpzc value. In this study, pHpzc value was calculated as 5.77. When the literature is examined, the pHpzc value of pinecone biochar is in the range of 4.6–4.8 [49], the pHpzc value of pinecone biochar [50], and it was also reported that the pHpzc value of the modified pinecone was determined to be 5.96 to 4.33 [51].

3.2. Influence of Experimental Parameters

3.2.1. Effect of pH

pH is one of the most important parameters in the adsorption process. The effect of pH on the adsorption of MB and EBT dyes on the PC-PnA adsorbent was determined. For this purpose, 10 mg PC-PnA was added to a 10 mL volume solution with an initial concentration of 10 mg/L in 5 falcon tubes containing 10 mg/L MB dye in an orbital shaker at 200 rpm at room temperature and shaken for 60 min. Again, for EBT dye, the apparatus was prepared under the same conditions, but the initial EBT concentration was set as 5.0 mg/L. At the end of the experiment, dye concentrations were measured in the upper phase liquids after centrifugation and the results are presented in Figure 5.
While the removal efficiency of MB dye in OH- environment (pH: 11) was 82.30%, when the pH was neutral, the removal reached 98.6%, and when the H+ concentration increased, the removal efficiency reached 98.8%. The removal efficiency may have been high because the PC-PnA surface active site was high at low pH. On the other hand, it may also be related to the solubility of the dye solution. In addition, since the presence of OH- ions is high at high pH values, it forms an interface with the cationic dye, so the removal efficiency may be low in a basic environment and high in an acidic environment [52]. As a result of the experiments, the optimum pH for MB dye was determined to be 3.0. In a study in the literature where rice husk was used as an adsorbent, it was determined that MB dye removal reached higher efficiency in an acidic environment [53].
A similar situation was observed in EBT dye as in MB dye. Namely, while the removal efficiency was 10% at pH 11, it increased to 18.40% at pH neutral, and while it was 34.6% at pH 5, it increased to 93.2% at pH 3. As can be seen, EBT dye removal is quite high in the presence of H+ ions. This is due to the change in the PC-PnA surface charge due to the presence of high OH- ions. At low pHs, the material surface is positively charged since it is lower than the pHpzc value of PC-PnA (5.77). In this case, EBT is an anionic dye, and a strong electrostatic attraction occurred between the material and the dye. Thus, this anionic dye has a higher removal efficiency in acidic conditions. In the complete sweat condition, when the presence of OH- ions in the environment is high, the material surface is negatively charged. In this case, the removal efficiency is low due to the repulsive force between the material and the anionic dye. As a result of the experiments, the optimum pH for MB dye was determined to be 3.0. When looking at the literature, it was determined that the removal efficiency was high in acidic conditions in the removal study conducted with tea pulp [10]. On the other hand, in the EBT dye removal study conducted with wood industry waste, it was reported that there was a similarly high removal efficiency at low pH [54].

3.2.2. Effect of Adsorbent Amount

The change in the amount of adsorbent in the adsorption process directly affects the removal efficiency and the amount of pollutant removed per unit adsorbent. In order to evaluate this situation in MB dye, PC-PnA was added in amounts ranging from 20 mg to 90 mg to 50 mL dye solutions with an initial concentration of 10 mg/L under the same environmental conditions. For EBT dye, experiments were carried out under the same environmental conditions but with an initial dye concentration of 5.0 mg/L. The results obtained are presented in Figure 6.
When examined specifically for MB dye, the removal efficiency was 77% when the initial PC-PnA concentration was 0.4 g/L, but when the amount of adsorbent was increased, that is, when it reached 0.8 g/L, the efficiency increased to 96.5%. When the PC-PnA concentration reached 1.8 g/L, the efficiency exceeded 99.9%. Accordingly, it is clearly seen that the removal efficiency increases when the amount of PC-PnA is increased. As a result of the experiments, the optimum adsorbent dosage for MB dye was determined to be 1.6 g/L. A similar situation is observed for EBT dye. Namely, while the removal efficiency was 71.46% at 0.4 g/L PC-PnA concentration, the efficiency increased above 99.9% when the dosage was refined, that is, when it reached 1.8 g/L. As a result of the experiments, the optimum adsorbent dosage for EBT dye was determined to be 1.4 g/L. Thus, it was observed that the dye removal efficiency increased when the PC-PnA dosage was increased in EBT dye, as in MB dye. When the amount of adsorbent is increased, which is valid for both dyes, an increase in dye removal efficiency has been observed as the surface area to perform adsorption naturally increases [54].

3.2.3. Effect of Time

During the adsorption process, the contact time between the adsorbent and the pollutant is very important in terms of removal efficiency. In this context, in order to determine the effect of contact time on MB dye removal efficiency, 160 mg PC-PnA (1.6 g/L) was added to a 100 mL solution containing 10 mg/L MB and samples were taken at certain time intervals and analyzed. For EBT dye, 140 mg PC-PnA (1.4 g/L) was added to a 100 mL volume solution containing 5.0 mg/L EBT under similar conditions, and samples were taken and analyzed at certain time intervals. The results obtained are presented in Figure 7.
When the graph created for MB dye was examined, the removal efficiency was calculated as 53.10% in the 1st minute of the reaction, while the efficiency reached 94.9% in the 5th minute and finally reached 99% in the 20th minute. Similarly, when the situation was evaluated for EBT dye, the removal efficiency was calculated as 46.6% in the 1st minute of the reaction, the efficiency reached 89% in the 5th minute, and finally the efficiency exceeded 98% in the 75th minute. Since removal efficiency is around 90% for both dyes, the appropriate removal time can be considered as 5 min. When both dyes are evaluated together, it means that the interaction time between PC-PnA and dyes increases and the active sites on the surface of PC-PnAs are filled by dye molecules. In addition, as the dye concentration in the solution decreases, the contact time does not extend and the removal efficiency decreases [52].

3.2.4. Effect of Initial Concentration

One of the factors that is very effective in determining the efficiency and the capacity of the adsorbent to hold the pollutant in the adsorption process is the initial pollutant concentration in the solution. In order to detect this effect on MB dye removal, experiments were carried out by adding 10 mg PC-PnA to 10 mL volumes and dye at varying MB concentrations (13.17–150 mg/L). Again, the results obtained from the experiments carried out under the same conditions for EBT dye are presented in Figure 8.
When the figure is examined specifically for MB dye, when the initial dye concentration is 13.17 mg/L, the removal efficiency is over 99% and the q e value is calculated as 13.15 mg/g. When the dye concentration was 29.63 mg/L, the removal efficiency was calculated as 97.64% and q e was calculated as 28.93 mg/g. When the dye concentration reached 100 mg/L, the removal efficiency decreased to 82.4% and q e increased to 82.4 mg/g. When the dye concentration increased to 150 mg/L, the removal efficiency decreased to 59.87%, but the q e value increased to 89.8 mg/g. Considering the EBT dye, when the initial concentration was 13.17 mg/L, the removal efficiency was calculated as 32.4% and the q e value was calculated as 4.22 mg/g. When the dye concentration was increased to 29.63 mg/L, the efficiency decreased to 25.41%, but the value was calculated as 7.53 mg/g. Likewise, when the dye concentration was 100 mg/L, the removal efficiency was 11.4% and the q e value was calculated as 11.40 mg/g. When the dye concentration reached 150 mg/L, the efficiency decreased to 9.2%, but the q e value was calculated as 13.80 mg/g. When evaluated together for both dyes, it is seen that the removal efficiency decreases as the initial dye concentration increases, but a clear increase is observed in the amount of pollutant removed per unit adsorbent. Accordingly, when the initial dye concentration increases, the mutual repulsive force between the dye molecules increases, and this repulsive force facilitates mass transfer [10,55].

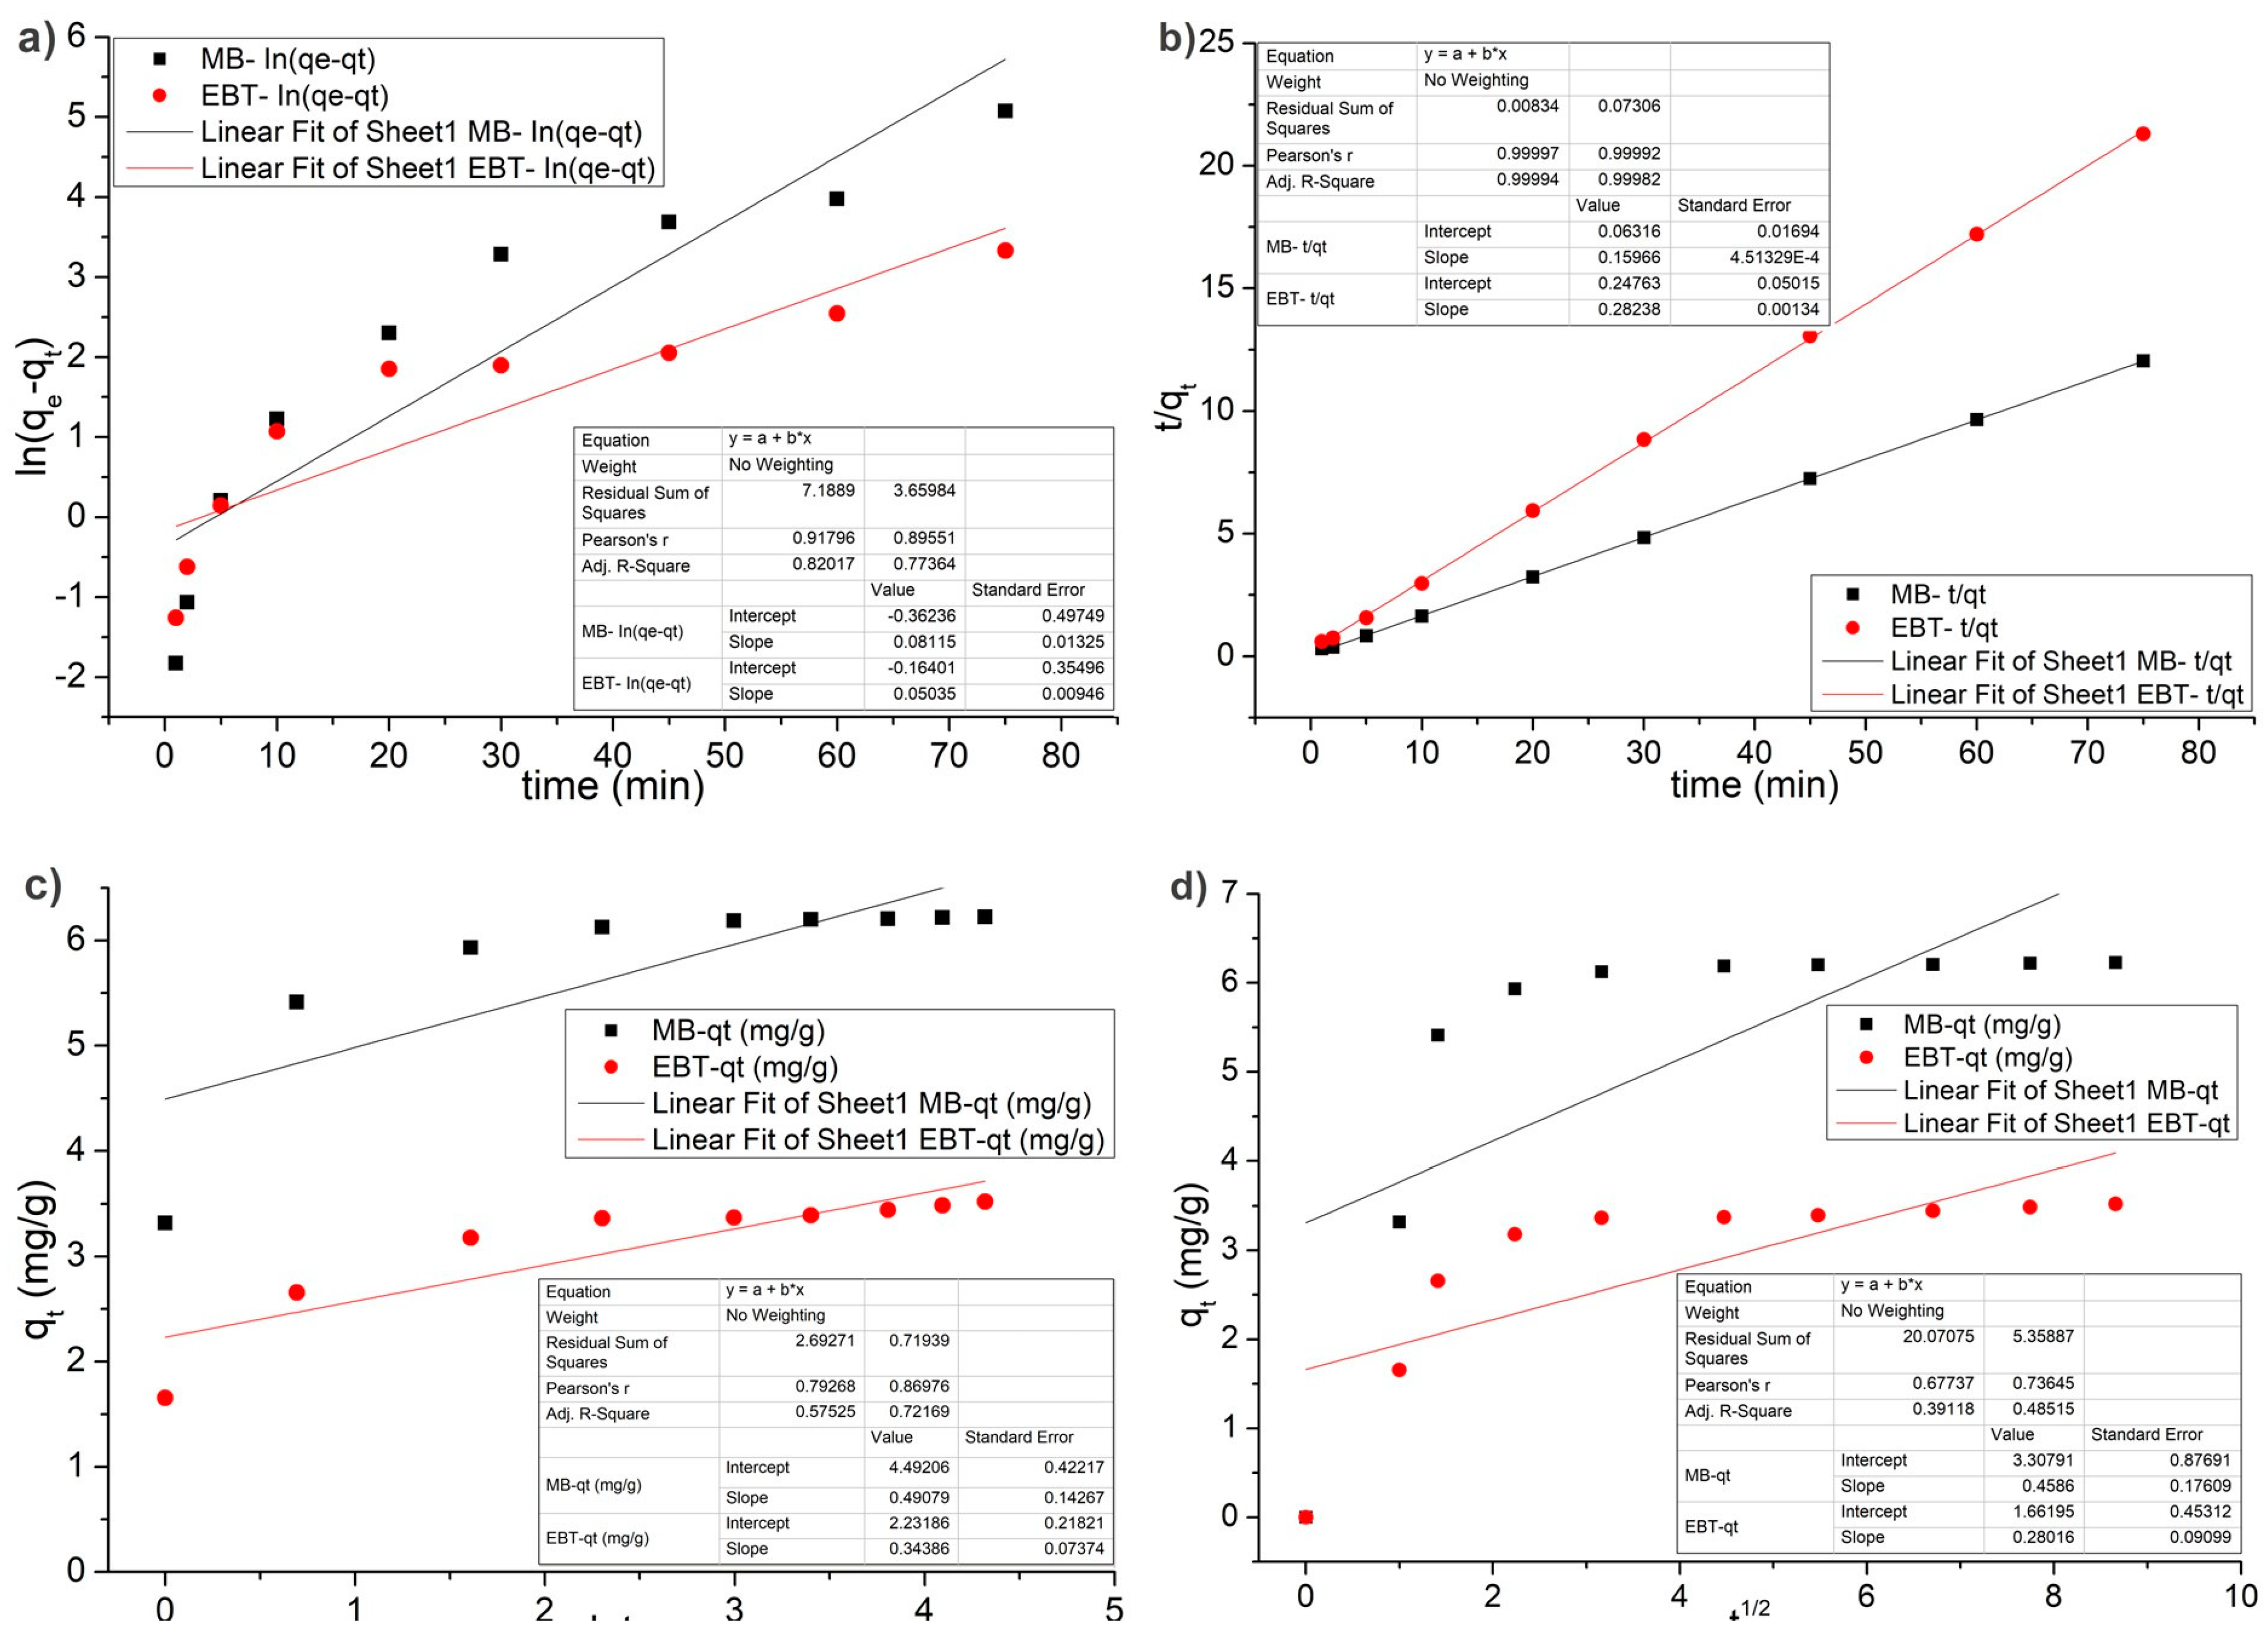
3.3. Adsorption Kinetics

Kinetic models were used to interpret numerical data obtained from experimental studies. Thanks to the kinetic model, the pollutant removal performance of an adsorbent is evaluated. Additionally, information is obtained about the elimination mechanism. In this context, the results obtained from the kinetic models used in this study are presented in Table 4. In addition, the regression curves created for each model are presented in Figure 9, and the change graph of experimental and theoretical q t values against time is presented in Figure 10.
For both dyes, ln(qeqt) values versus time are plotted and presented in Figure 9a (pseudo-first-order), a graph of t/qt versus time is drawn and presented in Figure 9b (pseudo-second-order), the plot of qt values against lnt value is drawn and presented in Figure 9c (Elovich). Finally, the graph of qt values against t1/2 values was drawn and presented in Figure 9d (intra-particle diffusion). The closer the R2 values used for the consistency of the results obtained in experimental studies to 1.0, the more meaningful the result. In this context, when the MB dye was evaluated, the R2 values of the pseudo-first-order, Elovich and intra-particle diffusion models were calculated as 0.918, 0.793, and 0.677, respectively. In addition, when we look at the internal consistency of the R2 values and the standard deviation of the slope and intercept, the lowest value was determined to be pseudo-second-order. In addition, error functions were used to determine which of the models used was suitable for our study. Definitions of the error functions used are presented in the “Supplementary Materials” file (Table S1). Using the error functions used, the error amounts of each model were determined and given in Table 4. However, the R2 value of the pseudo-second-order kinetic model was calculated as 0.999. When looking at the SSE value that supports these values, it was calculated as 1.43 in the pseudo-second-order model, 44.36 in the pseudo-first-order, 2.69 in the Elovich model, and 4.29 in the intra-particle diffusion model. When we look at the total of absolute errors between q e , e x p and q e , c a l values, the lowest value is seen in the pseudo-second-order model with 1.66. Similarly, when looking at the HYBRID, MPSD, and X2 lines, it is clear that the pseudo-second-order model is the most suitable.
When evaluated specifically for EBT dye, it was determined that the highest R2 value was 0.999 in the pseudo-second-order kinetic model. Again, when error functions are to be examined, for example, the Non-linear Chi-Square test offers a stronger interpretation in terms of detection. Accordingly, while the value of Similarly, in other error functions tests, it is seen that the lowest value is in the pseudo-second-order kinetic model. Accordingly, it can be said that the most appropriate model to explain the removal of EBT dye is the pseudo-second-order kinetic model.
When looking at the literature, it was determined that the most appropriate kinetic parameter in the removal studies carried out with pinecone and Acid Black 26, Acid Green 25, and Acid Blue 7 dyes was the pseudo-second-order kinetic model with R2:1 value [56]. In a different study in which CR dye was removed with pinecone powder, it was reported that the most appropriate kinetic model was pseudo-second-order [57].

3.4. Adsorption Isotherms

Adsorption isotherms are used to determine the performance of the reaction in equilibrium. Sufficient time is required for this, and this varies depending on the pH, temperature, and other physical properties of the solution. In this context, adsorption isotherms were used to determine the MB and EBT dye removal performance of PC-PnA particles. A summary of four different isotherm models used to interpret the removal of MB and EBT dyes in this study is presented in Table 5. Additionally, the regression curves calculated for each of the tested models are presented in Figure 11. The graph obtained from experimental studies and isotherm models is of the amount of pollutants removed per unit amount of adsorbent versus the dye concentrations remaining in the solution and is presented in Figure 12.
When the table is examined, the R2 values of the Temkin, Freundlich, and Sips models, specific to MB dye, were calculated as 0.955, 0.993, and 0.974, respectively, while the R2 value of the Langmuir model was calculated as 0.999. When the SSE values were examined to deepen the comparison between the models, it was 79.33, while it was calculated as 213.07, 236.38, and 446.74 in the Temkin, Sips, and Freundlich models, respectively. Again, if we look at the ratio of the sum of the absolute error between the values obtained from the experimental calculations and the model to the experimental results (ARE), the smallest value is again seen in the Langmuir isotherm model, with 6.95. Again, when HYBRID, MPSD and X2 values are examined, they can be seen in the Langmuir isotherm model.
When the EBT dye was examined, the R2 value of the Temkin and Sips models was calculated as 0.989, and the Freundlich model was calculated as 0.970. However, the R2 value of the Langmuir isotherm model was calculated as 0.995. Again, when the error functions were checked and the diversity (SSE) of the data between q e , e x p and q e , c a l values was examined, the values of the Temkin, Sips, and Freundlich models were calculated as 1.45, 3.69, and 5.21, respectively. In the Langmuir isotherm model, this value is calculated as 1.41. On the other hand, when ARE, HYBRID, MPSD, and X2 values are examined, it is seen that the Langmuir isotherm model is the lowest. It seems that the most suitable model for this model is Langmuir.
The Langmuir isotherm model is a model frequently used in the literature to determine the adsorption capacity of many adsorbents [39]. When the literature was examined, it was determined that the most suitable model for removing Lanasol Yellow 2R dye with pinecone was Langmuir with an R2 value of 0.996 [58]. Again, in the study where phenol and chlorophenols removal was performed using pinecone, the most suitable model was found to be Langmuir [46].

3.5. Adsorption Thermodynamics

The adsorption process was examined from a thermodynamic perspective and the spontaneous occurrence of the reaction was evaluated. In this context, temperature is a very effective parameter. In this way, it can be determined whether the reaction is exothermic or endothermic [56]. Then, 10 mg PC-PnA was added to a 10 mL volume of MB dye at an initial concentration of 12 mg/L. For EBT dye, the initial concentration was set to 15 mg/L. Removal efficiencies were evaluated for both dyes at three different temperatures (298, 308, and 328 K). Equations (3)–(5) were used for this evaluation.
G = R T L n K
G ° = H ° T S °
LnK = S R H R T
Additionally, thermodynamic parameters such as Gibbs free energy changes ( G ° ), enthalpy ( H ° ) and entropy ( S ° ) were examined. The results obtained are shown in Table 6, and the graph created with the data obtained from these results is presented in Figure 13.
The removal efficiency of both dyes increased with increasing temperature. In the calculations made for MB dye within the scope of the study, H ° and S ° values were calculated as 23.49 KJ/mol and 112.15 J/K.mol, respectively. For EBT dye, H ° and S ° values were calculated as 4.35 KJ/mol and 12.47 J/K.mol, respectively. To make a general evaluation for both dyes, the removal efficiency increased with increasing temperature. The fact that these two values are positive indicates that the reaction is endothermic. The fact that G ° value decreases with the increase in temperature means that the efficiency increases at high temperatures. Similarly, in the literature, it has been reported that the reaction is endothermic in the thermodynamic interpretation of the removal of CR dye with pinecone [59].

3.6. Comparison of the Study and the Results Obtained with the Literature

The results obtained in experimental studies and a summary of similar studies conducted in the literature are presented in Table 7. In this context, in the study where MB dye was removed with pinecone, experiments were carried out at 0.37–122.82 mg/L MB dye concentrations in 50 mL volume and the most suitable isotherm and kinetic model was reported to be Langmuir and pseudo-second-order, and the maximum removal efficiency was determined as 142.25 mg/g [60]. It was also determined that the surface area of the modified pinecone was 0.3378 m2/g, and the average pore width was 109.76 Å. In the study in which safranine O., brilliant green, and malachite green dyes were removed with this material, it was reported that a maximum dye removal efficiency of 182.71 mg/g was achieved [61]. On the other hand, MB dye removal was achieved with raw pine leaf and the maximum removal efficiency was determined to be 36.88 mg/g [62]. Additionally, MB dye removal was carried out with Casuarina equisetifolia pines, and it was reported that a removal efficiency of 41.35 mg/g was achieved [63]. In this study, the most suitable isotherm and kinetic model for MB and EBT dyes were determined as Langmuir and pseudo-second-order, respectively, while the maximum removal efficiencies was calculated as 91.46 and 15.85 mg/g, respectively.

4. Conclusions

In this study, in which MB and EBT dyes were removed along with the characterization of PC-PnA particles, the characteristic structure of the raw, MB and EBT loaded states of PC-PnA particles was introduced to the literature. Also UV–Vis spectroscopy (Figure S1) and XRD (Figure S2) results are discussed. The surface area of PC-PnA particles used as adsorbent was measured as 0.771 m2/g and the average pore diameter was 61.66 Å. In addition, when looking at the behavior of particles against heat, the mass losses were obtained as 5.9% and 30% at 103.9 and 721.6 °C, respectively (Figure S3). In addition, the pHpzc value of the particles was determined as 5.77. Considering the MB and EBT dye removal performances of PC-PnA particles, q m a x values were calculated as 91.46 and 15.85 mg/g, respectively. The most suitable kinetic model for both dyes was determined to be pseudo-second-order, while the most suitable isotherm model was determined to be Langmuir. In addition, the adsorption process was found to be endothermic. On the other hand, the morphological structures of both raw and MB and EBT loaded particles were tried to be explained by SEM-EDX and FTIR analyses. This study concluded that PC-PnA particles can be a low-cost biosorbent for the removal of MB and EBT dyes.

Supplementary Materials

The following supporting information can be downloaded at: https://www.mdpi.com/article/10.3390/pr12092044/s1, Figure S1. UV-visible measurements of PC-PnAs in aqueous solution form. Figure S2. XRD diagram of PC-PnAs. Figure S3. Temperature dependent TGA-DTA curve of PC-PnA. Table S1. Error functions.

Funding

This research received no external funding.

Data Availability Statement

The data presented in this study are available on request from the corresponding author.

Conflicts of Interest

The author declares no conflicts of interest.

References

  1. Deniz, F. Dye Biosorption from Water Employing Chemically Modified Calabrian Pine Cone Shell as an Effective Biosorbent. Environ. Prog. Sustain. Energy 2015, 34, 1267–1278. [Google Scholar] [CrossRef]
  2. Rashid, R.; Shafiq, I.; Akhter, P.; Iqbal, M.J.; Hussain, M. A State-of-the-Art Review on Wastewater Treatment Techniques: The Effectiveness of Adsorption Method. Environ. Sci. Pollut. Res. 2021, 28, 9050–9066. [Google Scholar] [CrossRef] [PubMed]
  3. Al-Tohamy, R.; Ali, S.S.; Li, F.; Okasha, K.M.; Mahmoud, Y.A.-G.; Elsamahy, T.; Jiao, H.; Fu, Y.; Sun, J. A Critical Review on the Treatment of Dye-Containing Wastewater: Ecotoxicological and Health Concerns of Textile Dyes and Possible Remediation Approaches for Environmental Safety. Ecotoxicol. Environ. Saf. 2022, 231, 113160. [Google Scholar] [CrossRef]
  4. Chandanshive, V.; Kadam, S.; Rane, N.; Jeon, B.-H.; Jadhav, J.; Govindwar, S. In Situ Textile Wastewater Treatment in High Rate Transpiration System Furrows Planted with Aquatic Macrophytes and Floating Phytobeds. Chemosphere 2020, 252, 126513. [Google Scholar] [CrossRef] [PubMed]
  5. Tkaczyk, A.; Mitrowska, K.; Posyniak, A. Synthetic Organic Dyes as Contaminants of the Aquatic Environment and Their Implications for Ecosystems: A Review. Sci. Total Environ. 2020, 717, 137222. [Google Scholar] [CrossRef] [PubMed]
  6. Kant, R. Textile Dyeing Industry an Environmental Hazard. Nat. Sci. 2012, 4, 17027. [Google Scholar] [CrossRef]
  7. Solayman, H.M.; Hossen, M.d.A.; Abd Aziz, A.; Yahya, N.Y.; Leong, K.H.; Sim, L.C.; Monir, M.U.; Zoh, K.-D. Performance Evaluation of Dye Wastewater Treatment Technologies: A Review. J. Environ. Chem. Eng. 2023, 11, 109610. [Google Scholar] [CrossRef]
  8. Patel, Y.; Chhaya, U.; Rudakiya, D.M.; Joshi, S. Biological Decolorization and Degradation of Synthetic Dyes: A Green Step Toward Sustainable Environment. In Microbial Rejuvenation of Polluted Environment; Springer: Singapore, 2021; pp. 77–110. [Google Scholar]
  9. Yang, P.; Lu, Y.; Zhang, H.; Li, R.; Hu, X.; Shahab, A.; Elnaggar, A.Y.; Alrefaei, A.F.; AlmutairiI, M.H.; Ali, E. Effective Removal of Methylene Blue and Crystal Violet by Low-Cost Biomass Derived from Eucalyptus: Characterization, Experiments, and Mechanism Investigation. Environ. Technol. Innov. 2024, 33, 103459. [Google Scholar] [CrossRef]
  10. Bansal, M.; Patnala, P.K.; Dugmore, T. Adsorption of Eriochrome Black-T (EBT) Using Tea Waste as a Low Cost Adsorbent by Batch Studies: A Green Approach for Dye Effluent Treatments. Curr. Res. Green Sustain. Chem. 2020, 3, 100036. [Google Scholar] [CrossRef]
  11. Mosoarca, G.; Popa, S.; Vancea, C.; Dan, M.; Boran, S. Modelling and Optimization of Methylene Blue Adsorption Process on Leonurus Cardiaca L. Biomass Powder. Processes 2023, 11, 3385. [Google Scholar] [CrossRef]
  12. Langer, I.; Atassi, G.; Robberecht, P.; Résibois, A. Eriochrome Black T Inhibits Endothelial Cell Growth through S-Phase Blockade. Eur. J. Pharmacol. 2000, 399, 85–90. [Google Scholar] [CrossRef] [PubMed]
  13. Mittal, A.; Gupta, V.K. Adsorptive Removal and Recovery of the Azo Dye Eriochrome Black T. Toxicol. Environ. Chem. 2010, 92, 1813–1823. [Google Scholar] [CrossRef]
  14. Iwuozor, K.O.; Ighalo, J.O.; Ogunfowora, L.A.; Adeniyi, A.G.; Igwegbe, C.A. An Empirical Literature Analysis of Adsorbent Performance for Methylene Blue Uptake from Aqueous Media. J. Environ. Chem. Eng. 2021, 9, 105658. [Google Scholar] [CrossRef]
  15. Nourmoradi, H.; Ghiasvand, A.R.; Noorimotlagh, Z. Removal of Methylene Blue and Acid Orange 7 from Aqueous Solutions by Activated Carbon Coated with Zinc Oxide (ZnO) Nanoparticles: Equilibrium, Kinetic, and Thermodynamic Study. Desalination Water Treat. 2015, 55, 252–262. [Google Scholar] [CrossRef]
  16. Uddin, M.J.; Ampiaw, R.E.; Lee, W. Adsorptive Removal of Dyes from Wastewater Using a Metal-Organic Framework: A Review. Chemosphere 2021, 284, 131314. [Google Scholar] [CrossRef]
  17. Teo, S.H.; Ng, C.H.; Islam, A.; Abdulkareem-Alsultan, G.; Joseph, C.G.; Janaun, J.; Taufiq-Yap, Y.H.; Khandaker, S.; Islam, G.J.; Znad, H.; et al. Sustainable Toxic Dyes Removal with Advanced Materials for Clean Water Production: A Comprehensive Review. J. Clean. Prod. 2022, 332, 130039. [Google Scholar] [CrossRef]
  18. Solmaz, A.; Turna, T.; Baran, A. Ecofriendly Synthesis of Selenium Nanoparticles Using Agricultural Citrus Fortunella Waste and Decolourization of Crystal Violet from Aqueous Solution. Can. J. Chem. Eng. 2024, 102, 2051–2067. [Google Scholar] [CrossRef]
  19. Solmaz, A.; Sari, Z.A.; Karta, M.; Turna, T.; Yücel, A.; Depci, T. Production and Characterization of Activated Carbon from Pomegranate Peel for Pharmaceutical Waste (Paracetamol) Removal: Response Surface Methodology Application. Water Air Soil Pollut. 2023, 234, 645. [Google Scholar] [CrossRef]
  20. Beni, A.A.; Esmaeili, A. Biosorption, an Efficient Method for Removing Heavy Metals from Industrial Effluents: A Review. Environ. Technol. Innov. 2020, 17, 100503. [Google Scholar] [CrossRef]
  21. Praveen, S.; Jegan, J.; Bhagavathi Pushpa, T.; Gokulan, R.; Bulgariu, L. Biochar for Removal of Dyes in Contaminated Water: An Overview. Biochar 2022, 4, 10. [Google Scholar] [CrossRef]
  22. Bulgariu, L.; Escudero, L.B.; Bello, O.S.; Iqbal, M.; Nisar, J.; Adegoke, K.A.; Alakhras, F.; Kornaros, M.; Anastopoulos, I. The Utilization of Leaf-Based Adsorbents for Dyes Removal: A Review. J. Mol. Liq. 2019, 276, 728–747. [Google Scholar] [CrossRef]
  23. Gemici, B.T.; Ucun Ozel, H.; Ozel, H.B. Adsorption Behaviors of Crystal Violet from Aqueous Solution Using Anatolian Black Pine (Pinus Nigra Arnold.): Kinetic and Equilibrium Studies. Sep. Sci. Technol. 2020, 55, 406–414. [Google Scholar] [CrossRef]
  24. Zulu, C.B.; Onyango, M.S.; Ren, J.; Lwesifi, T.Y. Modified Pine Cone for Dye Pollutants Removal from Aqueous Solution. In Proceedings of the Sustainable Research and Innovation Conference, Juja, Kenya, 3–5 May 2017; pp. 23–29. [Google Scholar]
  25. Ighalo, J.O.; Adeniyi, A.G. Adsorption of Pollutants by Plant Bark Derived Adsorbents: An Empirical Review. J. Water Process Eng. 2020, 35, 101228. [Google Scholar] [CrossRef]
  26. Ayrilmis, N.; Buyuksari, U.; Avci, E.; Koc, E. Utilization of Pine (Pinus Pinea L.) Cone in Manufacture of Wood Based Composite. For. Ecol. Manage 2009, 259, 65–70. [Google Scholar] [CrossRef]
  27. Aldemir, A.; Turan, A.; Kul, A.R.; Koyuncu, H. Comprehensive Investigation of Basic Red 46 Removal by Pinecone Adsorbent: Experimental, Isotherm, Kinetic and Thermodynamic Studies. Int. J. Environ. Sci. Technol. 2023, 20, 2601–2622. [Google Scholar] [CrossRef]
  28. Sarıcı Özdemir, Ç. Equilibrium, Kinetic, Diffusion and Thermodynamic Applications for Dye Adsorption with Pine Cone. Sep. Sci. Technol. 2019, 54, 3046–3054. [Google Scholar] [CrossRef]
  29. Olsson, S.; Grivet, D.; Cattonaro, F.; Vendramin, V.; Giovannelli, G.; Scotti-Saintagne, C.; Vendramin, G.G.; Fady, B. Evolutionary Relevance of Lineages in the European Black Pine (Pinus Nigra) in the Transcriptomic Era. Tree Genet. Genomes 2020, 16, 30. [Google Scholar] [CrossRef]
  30. Hameed, B.; Din, A.; Ahmad, A. Adsorption of Methylene Blue onto Bamboo-Based Activated Carbon: Kinetics and Equilibrium Studies. J. Hazard. Mater. 2007, 141, 819–825. [Google Scholar] [CrossRef]
  31. Khnifira, M.; Boumya, W.; Abdennouri, M.; Sadiq, M.; Achak, M.; Serdaroğlu, G.; Kaya, S.; Şimşek, S.; Barka, N. A Combined Molecular Dynamic Simulation, DFT Calculations, and Experimental Study of the Eriochrome Black T Dye Adsorption onto Chitosan in Aqueous Solutions. Int. J. Biol. Macromol. 2021, 166, 707–721. [Google Scholar] [CrossRef]
  32. Lagergren, S.K. About the Theory of So-Called Adsorption of Soluble Substances. K. Sven. Vetenskapsakademiens Handl. 1898, 24, 1–39. [Google Scholar]
  33. Ho, Y.S.; Wase’, D.; Forster, C.F. Removal of Lead Ions from Aqueous Solution Using Sphagnum Moss Peat as Adsorbent. Water Sa 1996, 22, 214–219. [Google Scholar]
  34. Kumar, P.S.; Ramalingam, S.; Kirupha, S.D.; Murugesan, A.; Vidhyadevi, T.; Sivanesan, S. Adsorption Behavior of Nickel(II) onto Cashew Nut Shell: Equilibrium, Thermodynamics, Kinetics, Mechanism and Process Design. Chem. Eng. J. 2011, 167, 122–131. [Google Scholar] [CrossRef]
  35. Boyd, G.E.; Adamson, A.W.; Myers, L.S. The Exchange Adsorption of Ions from Aqueous Solutions by Organic Zeolites. II. Kinetics. J. Am. Chem. Soc. 1947, 69, 2836–2848. [Google Scholar] [CrossRef] [PubMed]
  36. Freundlich, H.M.F. Over the Adsorption in Solution. J. Phys. Chem. 1906, 57, 1100–1107. [Google Scholar]
  37. Wang, J.; Guo, X. Adsorption Isotherm Models: Classification, Physical Meaning, Application and Solving Method. Chemosphere 2020, 258, 127279. [Google Scholar] [CrossRef]
  38. Langmuir, I. The Constitution and Fundamental Properties of Solids and Liquids. Part I. Solids. J. Am. Chem. Soc. 1916, 38, 2221–2295. [Google Scholar] [CrossRef]
  39. Foo, K.Y.; Hameed, B.H. Insights into the Modeling of Adsorption Isotherm Systems. Chem. Eng. J. 2010, 156, 2–10. [Google Scholar] [CrossRef]
  40. Temkin, M.I. Kinetics of Ammonia Synthesis on Promoted Iron Catalysts. Acta Physiochim. URSS 1940, 12, 327–356. [Google Scholar]
  41. Al-Ghouti, M.A.; Da’ana, D.A. Guidelines for the Use and Interpretation of Adsorption Isotherm Models: A Review. J. Hazard. Mater. 2020, 393, 122383. [Google Scholar] [CrossRef]
  42. Subbiah, K.; Lee, H.-S.; Mandal, S.; Park, T. Conifer Cone (Pinus Resinosa) as a Green Corrosion Inhibitor for Steel Rebar in Chloride-Contaminated Synthetic Concrete Pore Solutions. ACS Appl. Mater. Interfaces 2021, 13, 43676–43695. [Google Scholar] [CrossRef]
  43. Varshney, S.; Jain, P.; Srivastava, S. Removal and Recovery of Chromium from E-Waste by Functionalized Wood Pulp: A Green Bio-Hydrometallurgical Approach. Natl. Acad. Sci. Lett. 2019, 42, 99–103. [Google Scholar] [CrossRef]
  44. Assefi, M.; Davar, F.; Hadadzadeh, H. Green Synthesis of Nanosilica by Thermal Decomposition of Pine Cones and Pine Needles. Adv. Powder Technol. 2015, 26, 1583–1589. [Google Scholar] [CrossRef]
  45. Kaya, N.; Yıldız Uzun, Z.; Altuncan, C.; Uzun, H. Adsorption of Congo Red from Aqueous Solution onto KOH-Activated Biochar Produced via Pyrolysis of Pine Cone and Modeling of the Process Using Artificial Neural Network. Biomass Convers. Biorefin. 2022, 12, 5293–5315. [Google Scholar] [CrossRef]
  46. Kumar, N.S.; Asif, M.; Al-Hazzaa, M.I. Adsorptive Removal of Phenolic Compounds from Aqueous Solutions Using Pine Cone Biomass: Kinetics and Equilibrium Studies. Environ. Sci. Pollut. Res. 2018, 25, 21949–21960. [Google Scholar] [CrossRef] [PubMed]
  47. Almendros, A.I.; Martín-Lara, M.A.; Ronda, A.; Pérez, A.; Blázquez, G.; Calero, M. Physico-Chemical Characterization of Pine Cone Shell and Its Use as Biosorbent and Fuel. Bioresour. Technol. 2015, 196, 406–412. [Google Scholar] [CrossRef] [PubMed]
  48. Debnath, S.; Das, R. Strong Adsorption of CV Dye by Ni Ferrite Nanoparticles for Waste Water Purification: Fits Well the Pseudo Second Order Kinetic and Freundlich Isotherm Model. Ceram. Int. 2023, 49, 16199–16215. [Google Scholar] [CrossRef]
  49. Blázquez, G.; Martín-Lara, M.A.; Dionisio-Ruiz, E.; Tenorio, G.; Calero, M. Evaluation and Comparison of the Biosorption Process of Copper Ions onto Olive Stone and Pine Bark. J. Ind. Eng. Chem. 2011, 17, 824–833. [Google Scholar] [CrossRef]
  50. Chebbi, M.; Ounoki, S.; Youcef, L.; Amrane, A. Synthesis and Characterization of Pine Cones Biochar for the Removal of an Antibiotic (Metronidazole) from Aqueous Solutions. J. Ind. Eng. Chem. 2023, 126, 327–339. [Google Scholar] [CrossRef]
  51. Pholosi, A.; Naidoo, E.B.; Ofomaja, A.E. Sequestration of As(III) Pollutant from Water Using Chemically Activated Pine Cone Biomass: Evaluation of Interaction and Mechanism. Int. J. Environ. Sci. Technol. 2019, 16, 6907–6920. [Google Scholar] [CrossRef]
  52. Sah, M.K.; Edbey, K.; EL-Hashani, A.; Almshety, S.; Mauro, L.; Alomar, T.S.; AlMasoud, N.; Bhattarai, A. Exploring the Biosorption of Methylene Blue Dye onto Agricultural Products: A Critical Review. Separations 2022, 9, 256. [Google Scholar] [CrossRef]
  53. Han, R.; Wang, Y.; Yu, W.; Zou, W.; Shi, J.; Liu, H. Biosorption of Methylene Blue from Aqueous Solution by Rice Husk in a Fixed-Bed Column. J. Hazard. Mater. 2007, 141, 713–718. [Google Scholar] [CrossRef] [PubMed]
  54. Akhouairi, S.; Ouachtak, H.; Addi, A.A.; Jada, A.; Douch, J. Natural Sawdust as Adsorbent for the Eriochrome Black T Dye Removal from Aqueous Solution. Water Air Soil Pollut. 2019, 230, 181. [Google Scholar] [CrossRef]
  55. Lafi, R.; Montasser, I.; Hafiane, A. Adsorption of Congo Red Dye from Aqueous Solutions by Prepared Activated Carbon with Oxygen-Containing Functional Groups and Its Regeneration. Adsorpt. Sci. Technol. 2019, 37, 160–181. [Google Scholar] [CrossRef]
  56. Mahmoodi, N.M.; Hayati, B.; Arami, M.; Lan, C. Adsorption of Textile Dyes on Pine Cone from Colored Wastewater: Kinetic, Equilibrium and Thermodynamic Studies. Desalination 2011, 268, 117–125. [Google Scholar] [CrossRef]
  57. Dawood, S.; Sen, T.K. Removal of Anionic Dye Congo Red from Aqueous Solution by Raw Pine and Acid-Treated Pine Cone Powder as Adsorbent: Equilibrium, Thermodynamic, Kinetics, Mechanism and Process Design. Water Res. 2012, 46, 1933–1946. [Google Scholar] [CrossRef] [PubMed]
  58. Deniz, F. Color Removal from Aqueous Solutions of Metal-Containing Dye Using Pine Cone. Desalination Water Treat. 2013, 51, 4573–4581. [Google Scholar] [CrossRef]
  59. Dawood, S.; Sen, T.K.; Phan, C. Synthesis and Characterisation of Novel-Activated Carbon from Waste Biomass Pine Cone and Its Application in the Removal of Congo Red Dye from Aqueous Solution by Adsorption. Water Air Soil Pollut. 2014, 225, 1818. [Google Scholar] [CrossRef]
  60. Yagub, M.T.; Sen, T.K.; Ang, M. Removal of Cationic Dye Methylene Blue (MB) from Aqueous Solution by Ground Raw and Base Modified Pine Cone Powder. Environ. Earth Sci. 2014, 71, 1507–1519. [Google Scholar] [CrossRef]
  61. Debnath, S.; Ballav, N.; Maity, A.; Pillay, K. Competitive Adsorption of Ternary Dye Mixture Using Pine Cone Powder Modified with β-Cyclodextrin. J. Mol. Liq. 2017, 225, 679–688. [Google Scholar] [CrossRef]
  62. Sen, T.K. Adsorptive Removal of Dye (Methylene Blue) Organic Pollutant from Water by Pine Tree Leaf Biomass Adsorbent. Processes 2023, 11, 1877. [Google Scholar] [CrossRef]
  63. Chandarana, H.; Senthil Kumar, P.; Seenuvasan, M.; Anil Kumar, M. Kinetics, Equilibrium and Thermodynamic Investigations of Methylene Blue Dye Removal Using Casuarina Equisetifolia Pines. Chemosphere 2021, 285, 131480. [Google Scholar] [CrossRef] [PubMed]
  64. Bouguettoucha, A.; Chebli, D.; Mekhalef, T.; Noui, A.; Amrane, A. The Use of a Forest Waste Biomass, Cone of Pinus Brutia for the Removal of an Anionic Azo Dye Congo Red from Aqueous Medium. Desalination Water Treat. 2015, 55, 1956–1965. [Google Scholar] [CrossRef]
  65. Litefti, K.; Freire, M.S.; Stitou, M.; González-Álvarez, J. Adsorption of an Anionic Dye (Congo Red) from Aqueous Solutions by Pine Bark. Sci. Rep. 2019, 9, 16530. [Google Scholar] [CrossRef] [PubMed]
  66. Kavci, E. Malachite Green Adsorption onto Modified Pine Cone: Isotherms, Kinetics and Thermodynamics Mechanism. Chem. Eng. Commun. 2021, 208, 318–327. [Google Scholar] [CrossRef]
  67. Sen, T.K.; Afroze, S.; Ang, H.M. Equilibrium, Kinetics and Mechanism of Removal of Methylene Blue from Aqueous Solution by Adsorption onto Pine Cone Biomass of Pinus Radiata. Water Air Soil Pollut. 2011, 218, 499–515. [Google Scholar] [CrossRef]
Figure 1. SEM-EDX diagrams of PC-PnA before and after the reaction; (a) Raw PC-PnA, (b) MB charged PC-PnA, (c) EBT charged PC-PnA.
Processes 12 02044 g001
Figure 2. FTIR diagram of PC-PnA before and after reaction; Black line: Raw PC-PnA, Red line: MB charged PC-PnA, Blue line: EBT charged PC-PnA.
Processes 12 02044 g002
Figure 3. Nitrogen adsorption–desorption isotherm of the adsorbent PC-PnA.
Processes 12 02044 g003
Figure 4. pHpzc of PC-PnA.
Processes 12 02044 g004
Figure 5. Effect of the initial pH value for MB (V: 10 mL, C0: 10 mg/L, T: 298 K, dosage of PC-PnA: 1.0 g/L, pH: 3–11, reaction time: 60 min) and for EBT (V: 10 mL, C0: 5 mg/L, T: 298 K, dosage of PC-PnA: 1.0 g/L, pH: 3–11, reaction time: 60 min).
Processes 12 02044 g005
Figure 6. Effect of the PC-PnA dosage; (a) for MB; V: 50 mL, C0: 10 mg/L; T: 298 K, dosage of PC-PnA: 0.4–1.8 g/L, pH: 3.0, reaction time: 60 min, and (b) for EBT; V: 50 mL, C0: 5.0 mg/L; T: 298 K, dosage of PC-PnA: 0.4–1.8 g/L, pH: 3.0, reaction time: 60 min.
Processes 12 02044 g006
Figure 7. Effect of the contact time; (a) for MB; V:100 mL; C0:10 mg/L, dosage of PC-PnA: 1.6 g/L; T: 298 K; pH: 3.0, and (b) for EBT; V:100 mL; C0: 5.0 mg/L, dosage of PC-PnA: 1.4 g/L; T: 298 K; pH: 3.0.
Processes 12 02044 g007
Figure 8. Effect of the initial dye concentration; (a) for MB; V:10 mL; C0:13.17–150 mg/L, dosage of PC-PnA: 1.0 g/L; T: 298 K; pH: 3.0, time: 60 min. and (b) for EBT; V:10 mL; C0:13.17–150 mg/L, dosage of PC-PnA: 1.0 g/L; T: 298 K; pH: 3.0. time: 60 min.
Processes 12 02044 g008
Figure 9. Linear form graphics of kinetic models; (a) pseudo-first-order, (b) pseudo-second-order, (c) Elovich, (d) intra-particle diffusion.
Processes 12 02044 g009
Figure 10. Variation of experimental and theoretical q t values versus t, (a) For MB, (b) For EBT.
Processes 12 02044 g010
Figure 11. Linear form graphics of isotherm models; (a) Freundlich, (b) Langmuir, (c) Temkin, and (d) Sips.
Processes 12 02044 g011
Figure 12. Variation of experimental and theoretical q t values versus C e values, (a) For MB, (b) For EBT.
Processes 12 02044 g012
Figure 13. Regression plot of thermodynamic results.
Processes 12 02044 g013
Table 1. Kinetic models.
ModelsNonlinear FormLinear FormReferences
Pseudo-first-order q t = q e ( 1 e k 1 t ) l n ( q e q t ) = l n ( q e ) k 1 t [32]
Pseudo-second-order q t = q e 2 k 2 t 1 + q e k 2 t t q t = 1 k 2 q e 2 + t q e [33]
Elovich q t = β l n ( α β t ) q t = 1 β ln α β + 1 β ln t [34]
Intra-particle diffusion q t = K i d t 1 / 2 + C q t = k i d t 1 2 + a [35]
Table 2. Isotherms models.
ModelNonlinear FormLinear FormReferences
Freundlich q e = K F C e 1 / n l o g ( q e ) = l o g ( k F ) + 1 n l o g ( C e ) [36,37]
Langmuir q e = q m a x K L C e 1 + K L C e   R L = 1 1 + a L C e C e q e = 1 q m a x k L + C e q m a x [38,39]
Temkin q e = B l n ( A T C e )   B = R T b T q e = R T b T ln ( k T ) + R T b T ln ( C e ) [39,40]
Sips β S l n C e = l n K S q e + l n a S q e = K S C e β S 1 + a S C e β S [41]
Table 3. Surface area, pore volume and pore size distribution of the PC-PnA.
Surface Area
(ABET) (m2/g)
Pore Volume
(Vtotal) (cm3/g)
Mean Pore Size (D) (Å)
0.77100.00118861.6608 Å
Table 4. Results of kinetic models calculated for the adsorption of MB and EBT onto PC-PnA.
KineticsPseudo-First-OrderPseudo-Second-OrderElovichIntra-Particle Diffusion
MBEBTMBEBTMBEBTMBEBT
Parametersk1 = 0.052k1 = 0.052k2 = 0.404k2 = 0.322β = 2.038β = 2.91ki = 0.218ki = 0.159
qe = 6.26qe = 3.54α = 4633.0α = 226.56a = 4.77a = 2.40
R20.9180.8960.9990.9990.7930.8700.6770.736
SSE44.3616.441.430.1342.690.7194.291.38
SAE14.059.321.660.8253.992.064.722.63
ARE39.7348.986.234.7611.8211.5014.4115.17
HYBRID55.6268.575.440.1112.892.994.385.21
MPSD0.9940.9960.9710.9340.9650.9660.9690.971
X28.746.020.4230.0600.6380.3201.090.658
Table 5. Results of isotherm models calculated for the adsorption of MB and EB onto PC-PnA.
IsothermsFreundlichLangmuirTemkinSips
MBEBTMBEBTMBEBTMBEBT
ParameterskF = 34.72kF = 1.895kL = 0.751kL = 0.04BT = 0.223BT = 0.709n = 1.625n = 0.893
1/n = 0.2691/n = 0.42RL = 0.014RL = 0.612kT = 52.63kT = 0.398ks = 0.965ks = 0.055
qmax = 91.46qmax = 15.85
R20.9740.9700.9990.9950.9550.9890.9930.989
SSE446.745.2179.331.41213.071.45236.383.69
SAE41.154.9416.982.1728.842.1630.433.99
ARE12.749.306.953.9413.084.0513.397.99
HYBRID2.522.446.810.585.961.098.866.51
MPSD0.9640.9640.9740.9500.9720.9560.9760.973
X26.130.4831.580.1265.390.1365.690.383
Table 6. Thermodynamic parameters for the adsorption of MB and EBT dyes onto PC-PnA.
Temp (K)KLΔG0 (KJ/mol)ΔH0 (KJ/mol)ΔS0 (J/K.mol)R2
MBEBTMBEBTMBEBTMBEBTMBEBT
29854.560.777−9.910.62423.494.35112.1512.470.9990.998
30875.920.818−11.090.514
31899.000.868−12.150.374
Table 7. Comparison of the obtained values with the literature.
This Study[64][65][60][66][28][61][67]
Biosorbent OriginPinus nigra Arn.Pinus brutiaPinus pinasterPineconePineconePineconeModified pineconePinus radiata
BET surface area (m2/g)0.771--0.1065--0.3378-
Average pore width (Å)61.66-----109.76-
pHpzc5.77-3.4-- 4.63-
Experiment volume (mL)10–100501005050505050
Mixing speed (rpm)200-100150175400200–300120
Experiment time (min)751807 days250120120400340
Working pHs3–113–112–92.01–9.23–10.3-2–103.47–7.28
Optimum pH3429.02>6->57.28
Working Temperature (°C)25, 35, 4522, 40, 6025–6030, 40, 50, 6025, 35, 4525, 40, 5025, 35, 4530, 45, 60
Pollutant type removedMB and EBTCRCRMBMGMBSO, BG, MBMB
Working pollutant conc. (mg/L)13.17–1501–2505–1000.37–122.8230–20050–25050–180020–60
Best fitted kinetic modelPseudo-second-orderIntraparticle diffusionPseudo-second-orderPseudo-second-orderPseudo-second-orderPseudo-second-orderPseudo-second-orderPseudo-second-order
Best fitted kinetic model (R2)MB and EBT: 0.9990.999 >0.995>0.9921>0.95>0.99
Best fitted isotherm modelLangmuirSipsFreundlichLangmuirLangmuirLangmuirLangmuirLangmuir
Best fitted isotherm model (R2)MB: 0.999, EBT: 0.9950.996 >0.9950.994>0.98>0.950.997
Adsorption capacity (mg/g)MB: 91.6
EBT: 15.85
102.80.3–1.6129.87–142.25111.1125SO: 182.71,
BG: 158.61
MB: 136.71
109.89
Disclaimer/Publisher’s Note: The statements, opinions and data contained in all publications are solely those of the individual author(s) and contributor(s) and not of MDPI and/or the editor(s). MDPI and/or the editor(s) disclaim responsibility for any injury to people or property resulting from any ideas, methods, instructions or products referred to in the content.

