1. Introduction
The study of milk flow fluctuations during milking is of scientific and practical interest in order to accurately measure them for automating the control of milking machines operation modes. In addition, an essential physiological aspect is the control of the end of the milking process in order to exclude overexposure of the teat cups and the harmful effect of vacuum pressure on the animal. At the same time, it is important to minimize the duration of determining the parameters of milk flow, at which the timely switching off and removal of the milking machine should be performed.
Optical methods for monitoring flow inhomogeneities and composition of multiphase liquid media are promising, since they have high sensitivity and speed, and can also carry out non-contact and non-destructive diagnostics [
1,
2,
3,
4,
5,
6,
7,
8,
9,
10,
11,
12,
13,
14]. Since it is recommended to use devices for measuring milk flow that do not cause a significant pressure drop in the milk hose, optical diagnostic methods can improve the efficiency of the farm equipment. Among them, fluorescence methods should be especially noted as having high selectivity [
10,
11,
12], as well as light scattering methods [
4,
5,
6,
7,
8] and methods for measuring optical extinction [
13,
14] as completely relevant for dispersed media, which represent a random collection of small particles. In the case of milk, these are micelles of caseins and fat globules.
Due to the inertia of chamber flow meters, direct flow meters are increasingly used, for example, the FFS30 infrared milk sensor from SCR (Netanya, Israel) [
15] or meters with contact electrodes [
16,
17]. The simultaneous measurements of milk yield and the component composition of milk (fat, protein, lactose, etc.) are necessary for determining the productivity and quality of animal milk [
18,
19]. At the present time, there is no system that provides simultaneous measurement of both the flow rate and the composition of milk in one device. Most modern farms have only a flow meter installed in the milking machine, while the milk quality analyzer is a separate sample analyzer or samples are sent to specialized laboratories for quality analysis. Methods using NIR analyzers with more advanced data processing algorithms are being developed and improved [
20,
21,
22]. So far, only one system is known that provides a simultaneous analysis of the quality and measurement of milk yield, including a combination of rather complicated devices in operation [
23,
24]. Thus, the current trend in milking automation is to increase the functionality of milk meters by combining measurements of quantitative (flow rate, milk yield) and qualitative characteristics of milk flow (fat, protein, lactose, etc.), which are recommended to be carried out using the same physical principles, mainly optical spectrometry [
25].
It should be borne in mind that since milk contains dissolved air and an ionic component, long-lived ion-stabilized nanobubbles must be present in it [
26]. In addition, shear stresses in air-saturated milk lead to the formation of both microbubbles and macrobubbles during transportation in a milk pipeline [
27,
28,
29,
30,
31]. Thus, it turns out that the milk moving in the pipeline of a milking machine is actually a milk-air mixture. Moreover, the operation of the milking machine in the mode of milk plugs should be particularly considered, when the milk is separated by continuous air gaps in the milk pipeline.
The complexity of the movement of milk-air mixture in the hose of a milking machine and the time limitation cause certain difficulties in measuring a portion of milk when it moves in the flow. Therefore, it is necessary to define a model for estimating milk flow parameters and study the variances of these parameters.
It is important to note that in the process of express assessment of milk quality directly on the farm, specialists are primarily interested in abnormal deviations of the measured milk components in order to take appropriate preventive measures for feeding or treating animals. A more accurate periodic assessment can be carried out already in biochemical laboratories.
In this work, we investigated the processes of transporting milk flows in milking machines in order to find out the possibility of simultaneous measurement of the flow rate, quantity and component composition of milk.
2. Methods
For measuring milk flow, international standard ISO 5707 Milking machine installations—Construction and performance recommends using certified devices that cause a pressure drop of no more than +3 kPa and have an error of no more than +5% [
32,
33]. In milking robots, it is required to control the rate of milk flow by a quarter, which actualizes the creation of small-sized high-precision sensors. The main criteria for assessing the studied parameters of the milk flow can be attributed to: the speed of movement of the milk portion
(m/s) and its length
(m), the filling factor of the free section of the hose with milk
(%), the volumetric concentration of air bubbles in 1 cm
3 of the milk portion
, the size of the air bubbles
(μm), the particle size of the milk constituents (fat, protein, lactose)
(μm), the discreteness of scanning the sections of the milk plug along the length
(m) and in time
(s). It is obvious that the full functional of the requirements for hybrid milk flow sensors and milk composition can be written as follows:
where
are the corresponding functionals: milk flow rates, error relativity, vacuum pressure stability, sampler, milk component composition (fat, protein, lactose, etc.); ∧, ⊻ are logical operators.
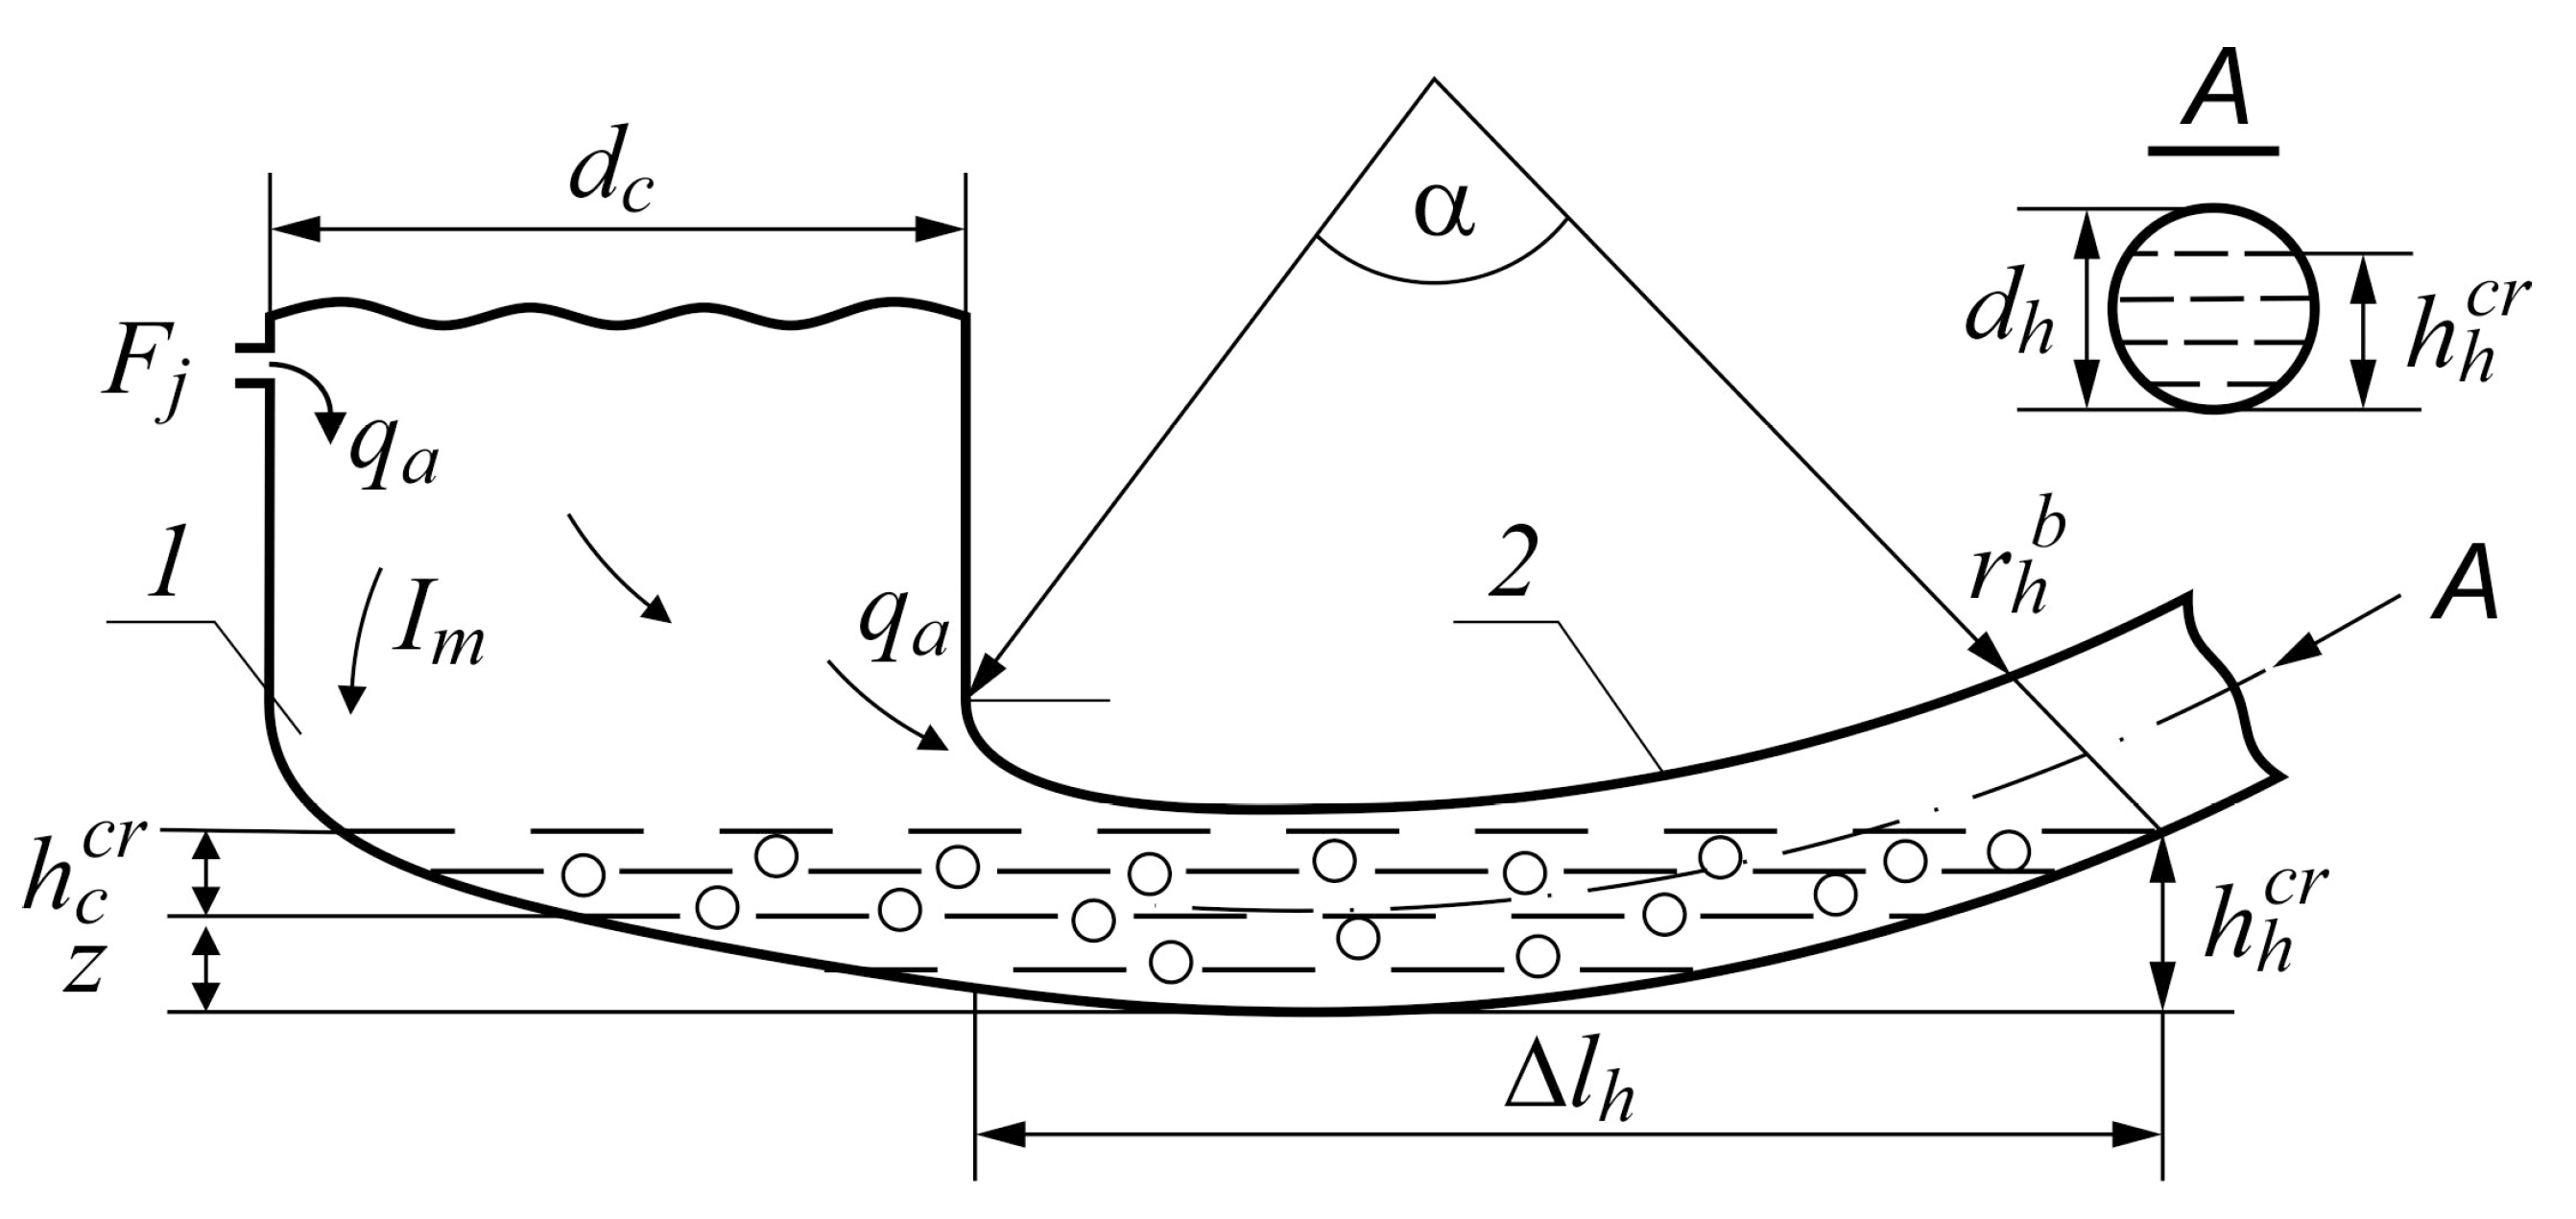
To estimate the parameters of milk flow theoretically, we propose a model of the formation and movement of milk portions in the system: milking machine-milk pipeline, considering it as a capacitive flow-through hydraulic system with preliminary accumulation of a certain critical volume of milk
(
Figure 1), which consists of two components: the volume of milk in the collector
and the volume of milk in the milk hose
, corresponding to the arc length
(Equation (2)). Due to the difference in the flow rates of milk (
) and air (
), a milk plug is formed.
Under the influence of the resulting pressure drop, the milk plug begins to move along the milk hose into the milk line (
Figure 2).
Expression for the volume of milk in the manifold is:
where
is the diameter of the milk chamber of the collector (m),
is the critical milk level in the collector (m). Taking into account the parameters of the hose, we have:
where
is the critical milk level in the hose (m),
is the difference in height between the lowest point of the collector and the hose (m). The critical volume of milk in the hose can be written by analogy as:
where
is the milk hose filling factor,
is the hose arc length,
is the hose bend radius,
is the center angle corresponding to the hose arc
. Thus, expression (5) will be written as follows:
Finally, expression (2) takes the form:
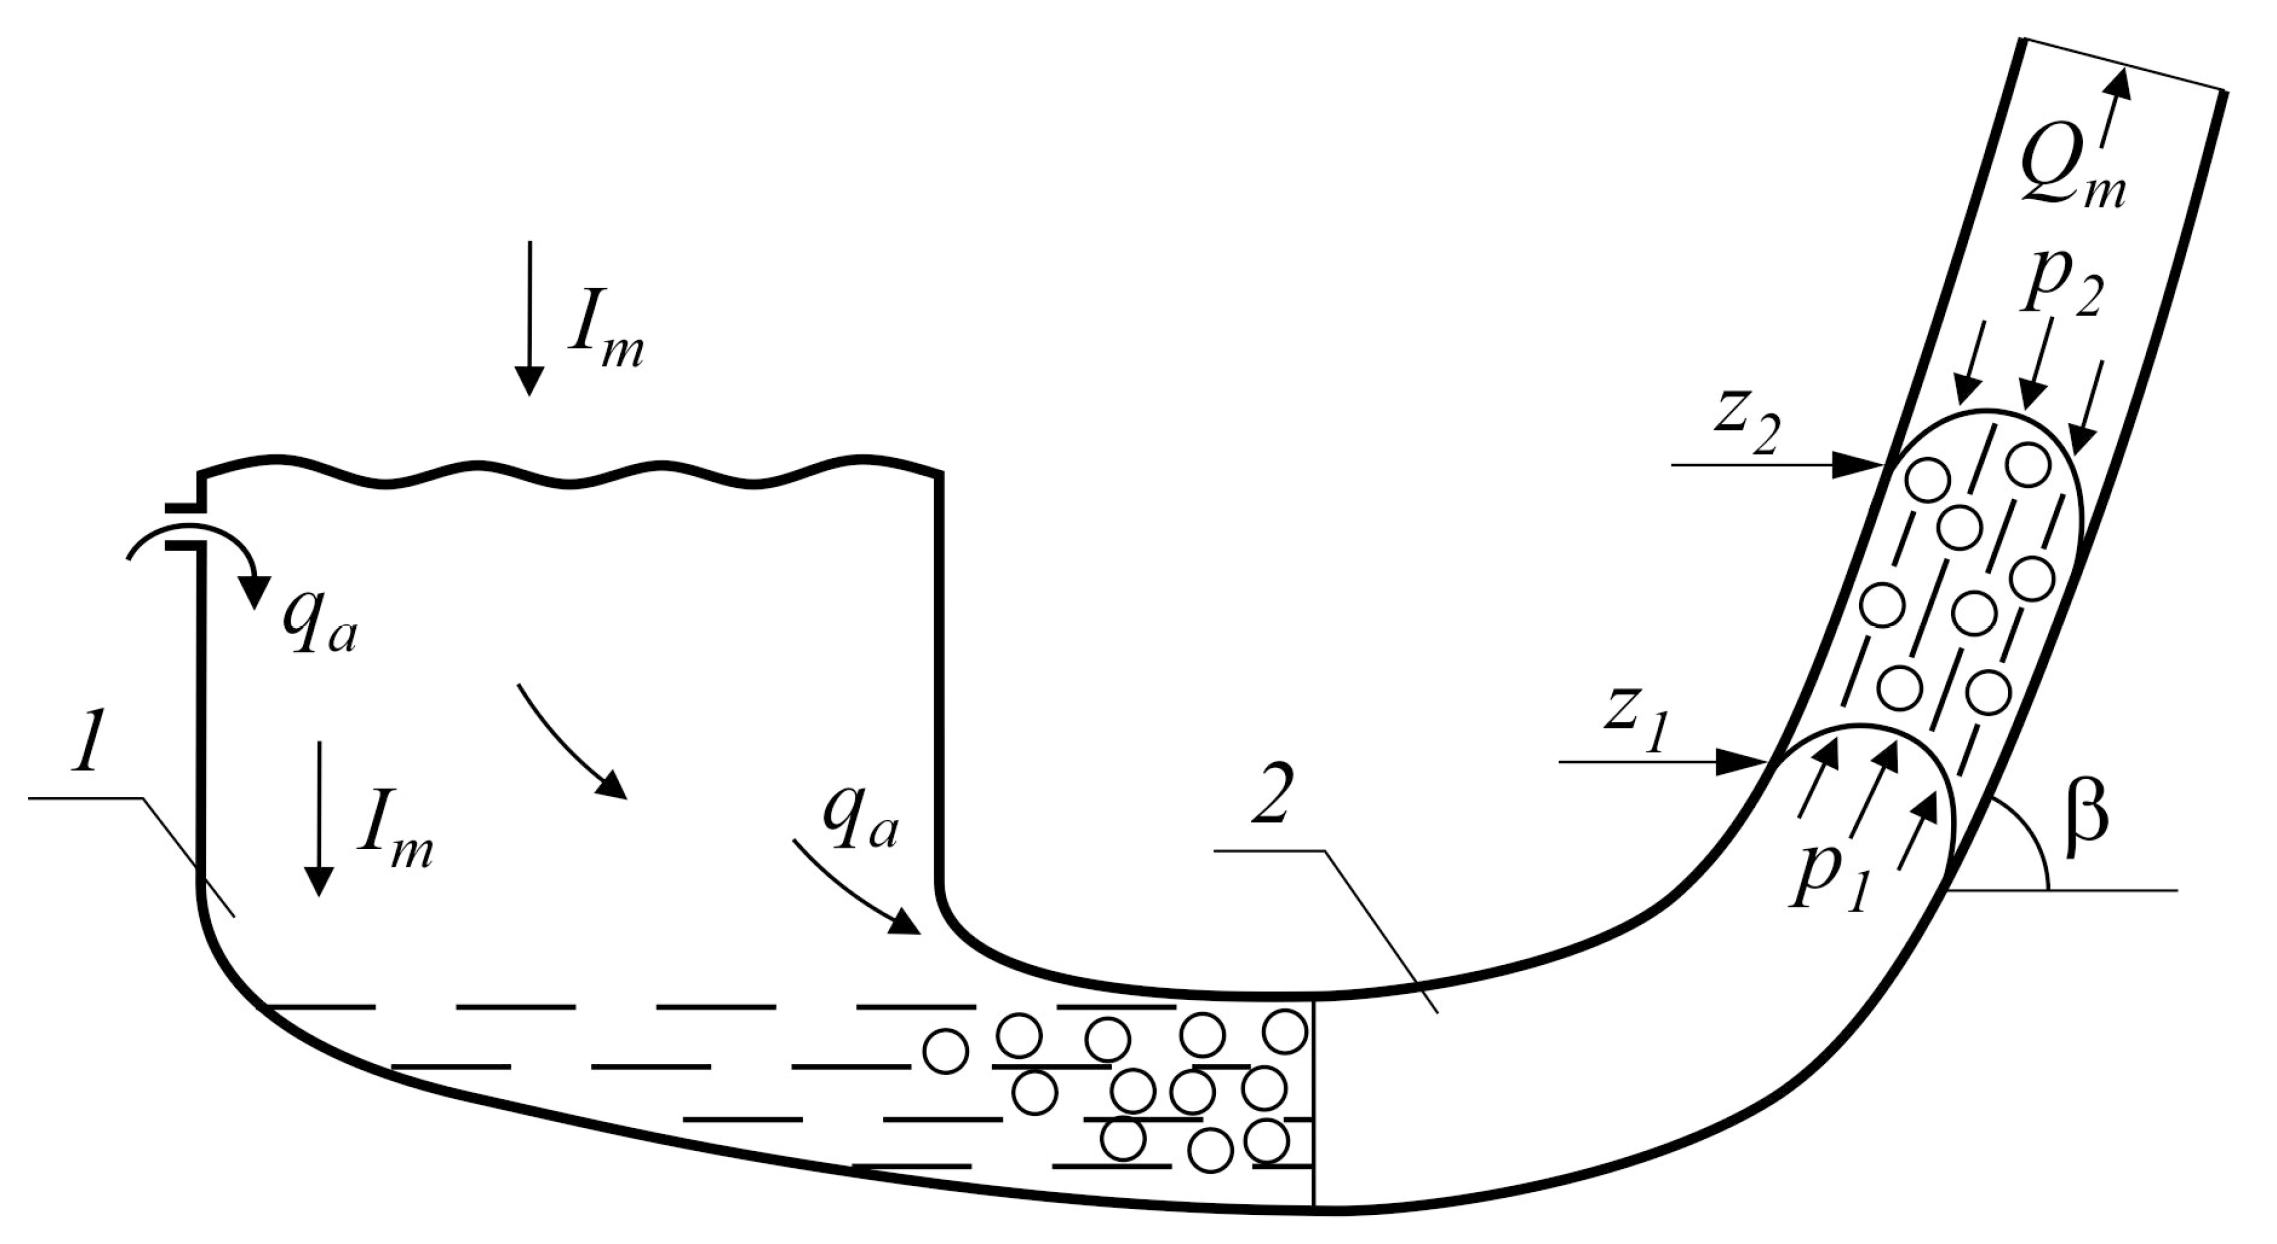
Next, consider the scheme of the steady-state movement of the milk flow in the hose of the milking machine (
Figure 2). For the plug mode, we will use the well-known equation of motion of the milk plug [
34], which in the transformed form is written as:
where
is the speed of the milk plug (m/s);
,
is the pressure difference on the plug from below and from above, Pa;
is the plug length (m);
is correction for the amount of motion;
is the angle of inclination of the hose (degrees);
is the density of the milk-air mixture (kg/m
3); d is the diameter of the milk hose (m);
λ is coefficient of hydraulic resistance of the milk hose,
is the acceleration of gravity. The steady-state mode of movement is characterized by the constancy of the milk flow rate in a certain area, where it is advisable to place the milk flow sensor, while the first term on the right side of Equation (8) vanishes and the expression will be rewritten as follows:
Solving (9) with respect to
leads to the formula:
where
is the pressure difference at the ends of the plug.
Considering that the plug has the shape of a cylinder, its length can be determined through the value of the critical volume of milk
:
Taking into account Equation (11), expression (10) for the theoretical speed of the milk plug can be rewritten as:
Knowing the parameters of the pumping system used in the milking machine, the derived formula allows us to calculate the theoretical speed of the milk plug. The calculated value of the milk plug velocity can be extrapolated to the velocity of the entire pulsating milk-air flow and then the theoretical calculation can be compared with the value of the flow velocity measured in the experimental setup by an optical method.
Obviously, the
value will vary for different types of milking machines, having a significant effect on the speed and length of milk plugs. At the same time, fluctuations of the density of the milk-air mixture
depending on the milk flow rate, contamination of milk-air flows can be, according to various estimates, from 0.5 to … 0.94 kg/L, having a significant effect on the accuracy of measuring the mass flow of milk [
35]. It is quite difficult to theoretically estimate the air saturation indicators of the milk plug due to the strong variation in the indicators of milk flow rate, pressure drop and air flow rate. Therefore, the most appropriate way to solve this problem can be the use of optical spectroscopy methods with measuring the scattering angles of a moving liquid saturated with air bubbles.
Let us consider a schematic diagram of measuring the speed of the movement of a milk plug with steady motion on a segment of hose with a length of
(
Figure 3).
We denote the moments when the bow part of the milk plug passes the initial and final sections, respectively:
and
. With a small assumption, taking into account the low compressibility (extensibility) of the milk plug, we can accept the equality of the velocities of the bow part
and the stern part
of the milk plug:
Formula (13) can be used to experimentally determine the flow rate by detecting the moments of entry and exit of a milk plug from the pipe segment at the ends of which optical detectors are placed. Then the actual parameters of the milk plug (length, volume, mass) and flow rate
can be determined by the known expressions:
where
,
are, respectively, the moments of the beginning and the end of the passage of the milk plug of the initial point of the controlled section of the hose.
It should be noted that the method for measuring milk flow using the transit time of the milk plug is known and previously implemented, for example, in [
36], while we propose new laser sensing methods based on the discreteness of the milk components.
To measure milk flow parameters, we applied laser fluorescence and extinction methods, which have been implemented in experimental setups with the use of diode lasers, laser beam rasterization, array photodetectors, and multichannel fiber-optic bundles. Information signals were recorded by a digital oscilloscope. Fiber optic probe structures have been optimized for biological fluids, including dairy products, in terms of radiation intensity and signal-to-noise ratio.
3. Results
We developed two experimental setups that exhibit the principles of laser fluorescence and extinction for measuring the flow rate and composition of the milk in a milking machine. The measurements of the milk flow velocity were compared with theoretical estimates using the Formula (12).
The influence of air bubbles on the characteristics of milk flow in milking machines was studied experimentally using laser-induced fluorescence method (
Figure 4). The setup (
Figure 4) employs semiconductor lasers operating at a wavelength of 405 nm and a TCD1304DG CCD linear image sensor (Toshiba, Tokyo, Japan).
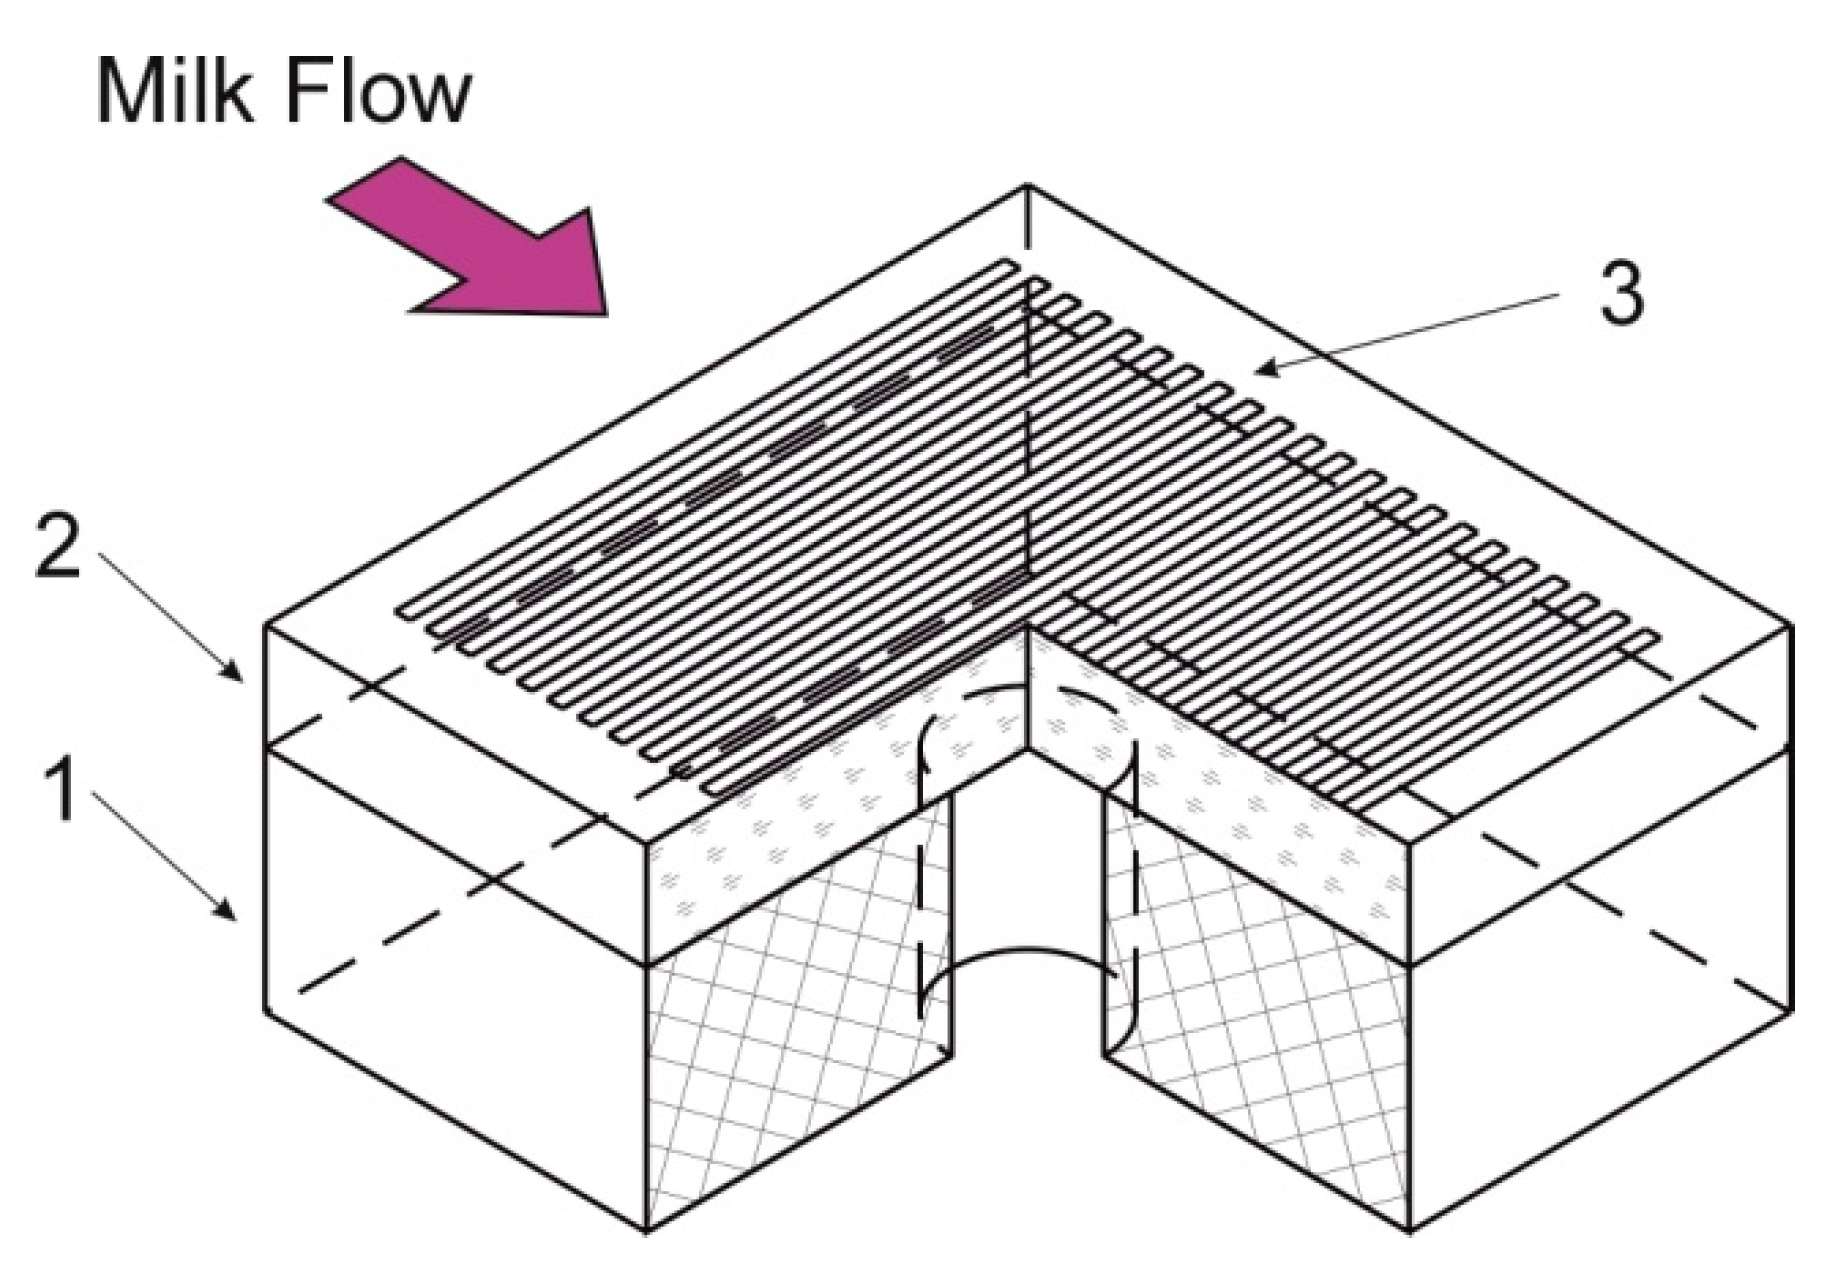
To obtain a narrow spatial distribution of the laser beam, we use a raster consisting of a sequence of metal strips deposited on optically transparent glass with equal intervals between them. The raster design is shown in
Figure 5.
We employed two replaceable rasters with a stripe width of 100 and 200 micron. These rasters were attached to an opaque base with a 1 mm hole in the center to narrow the laser beam aperture. The laser beam passed first the hole and then the raster, so that the transverse distribution of the laser beam intensity got rectangular shape, and thus the laser-irradiated area had a narrow width of ~100 microns and sharp boundaries. The raster is left-aligned with a bandpass filter as milk flows from left to right in the diagram shown. This alignment is necessary to record the spatial profile of the fluorescence signal from the portions of milk moving from left to right. The fact is that the fluorescence does not decay immediately and the milk particles excited by the UV laser at the beginning of the CCD array still continue to emit light after passing a distance of ~1000 CCD pixels.
The CCD has 3648 pixels. Actually, not all of the CCD pixels are used. The CCD length is 29 mm and the filter length is 19 mm. Thus, only about 2400 are in use. We deliberately do not use the entire length of the CCD, because on the one hand, the initial pixels may not work distinctly, and on the other hand, the distribution of the fluorescence signal along the CCD has a width of no more than about 2000, so the remaining pixels are not required. Below we show a photograph of the setup (
Figure 6), the scheme of which is shown above in
Figure 4.
Initial experimental results showed that the fluorescent response propagates and is fixed at distances of up to 20 mm along the length of the milk tube in the sensor (
Figure 7). With the passage of air bubbles, a clearly visible change in the slope of the fluorescence intensity distribution along the pipe is observed. The
X-axis is the pixel numbers of the CCD array. Pixel pitch is 0.008 mm. Pixel range 500 to 3000 corresponds to 20 mm distance along the milk pipeline.
It can be assumed that the small peaks on the fluorescent signal distribution curves (
Figure 7) exhibit dispersed milk components, presumably fat globules.
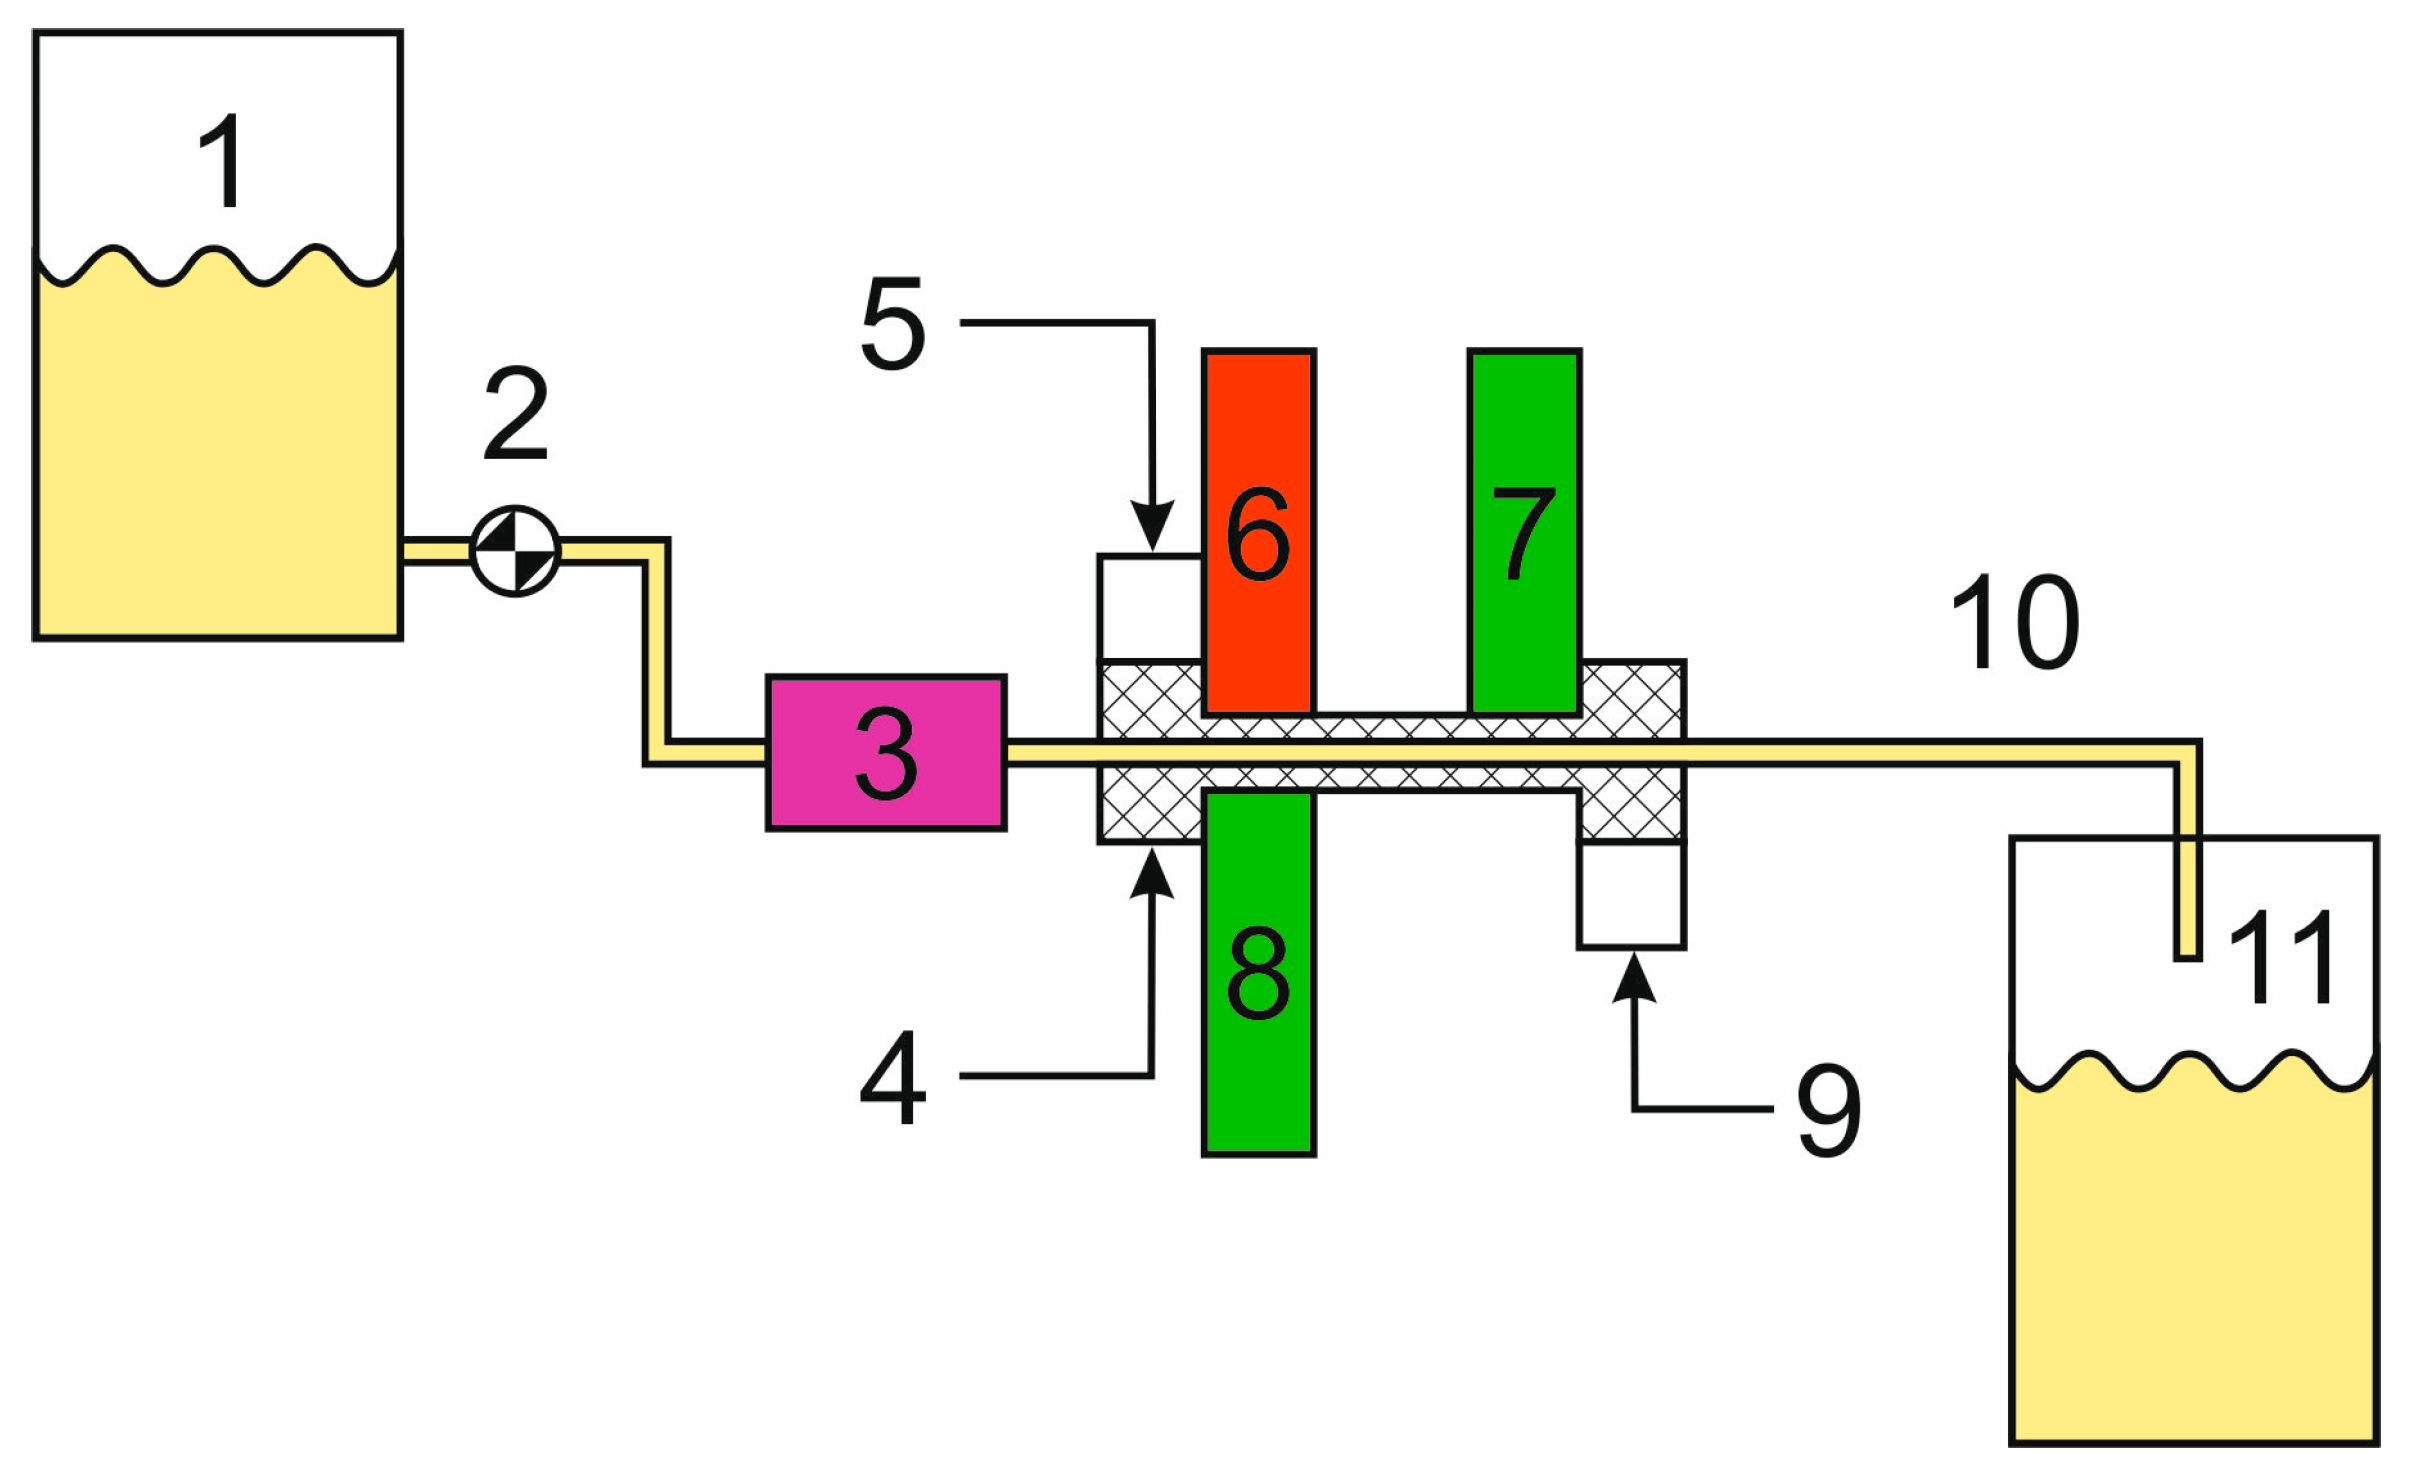
The study of milk-air mixture movement along the milk pipeline by the optical extinction method in the spectral range of 800–850 nm showed that the use of randomized multichannel fiber optic bundles enables the determination of fluctuations in the milk flow. A schematic of the experimental setup is shown in
Figure 8. An important feature of the multichannel fiber optic bundles is mixing optical modes, which eliminates the appearance of speckles and heat transfer from the laser heated during operation to the milk pipe.
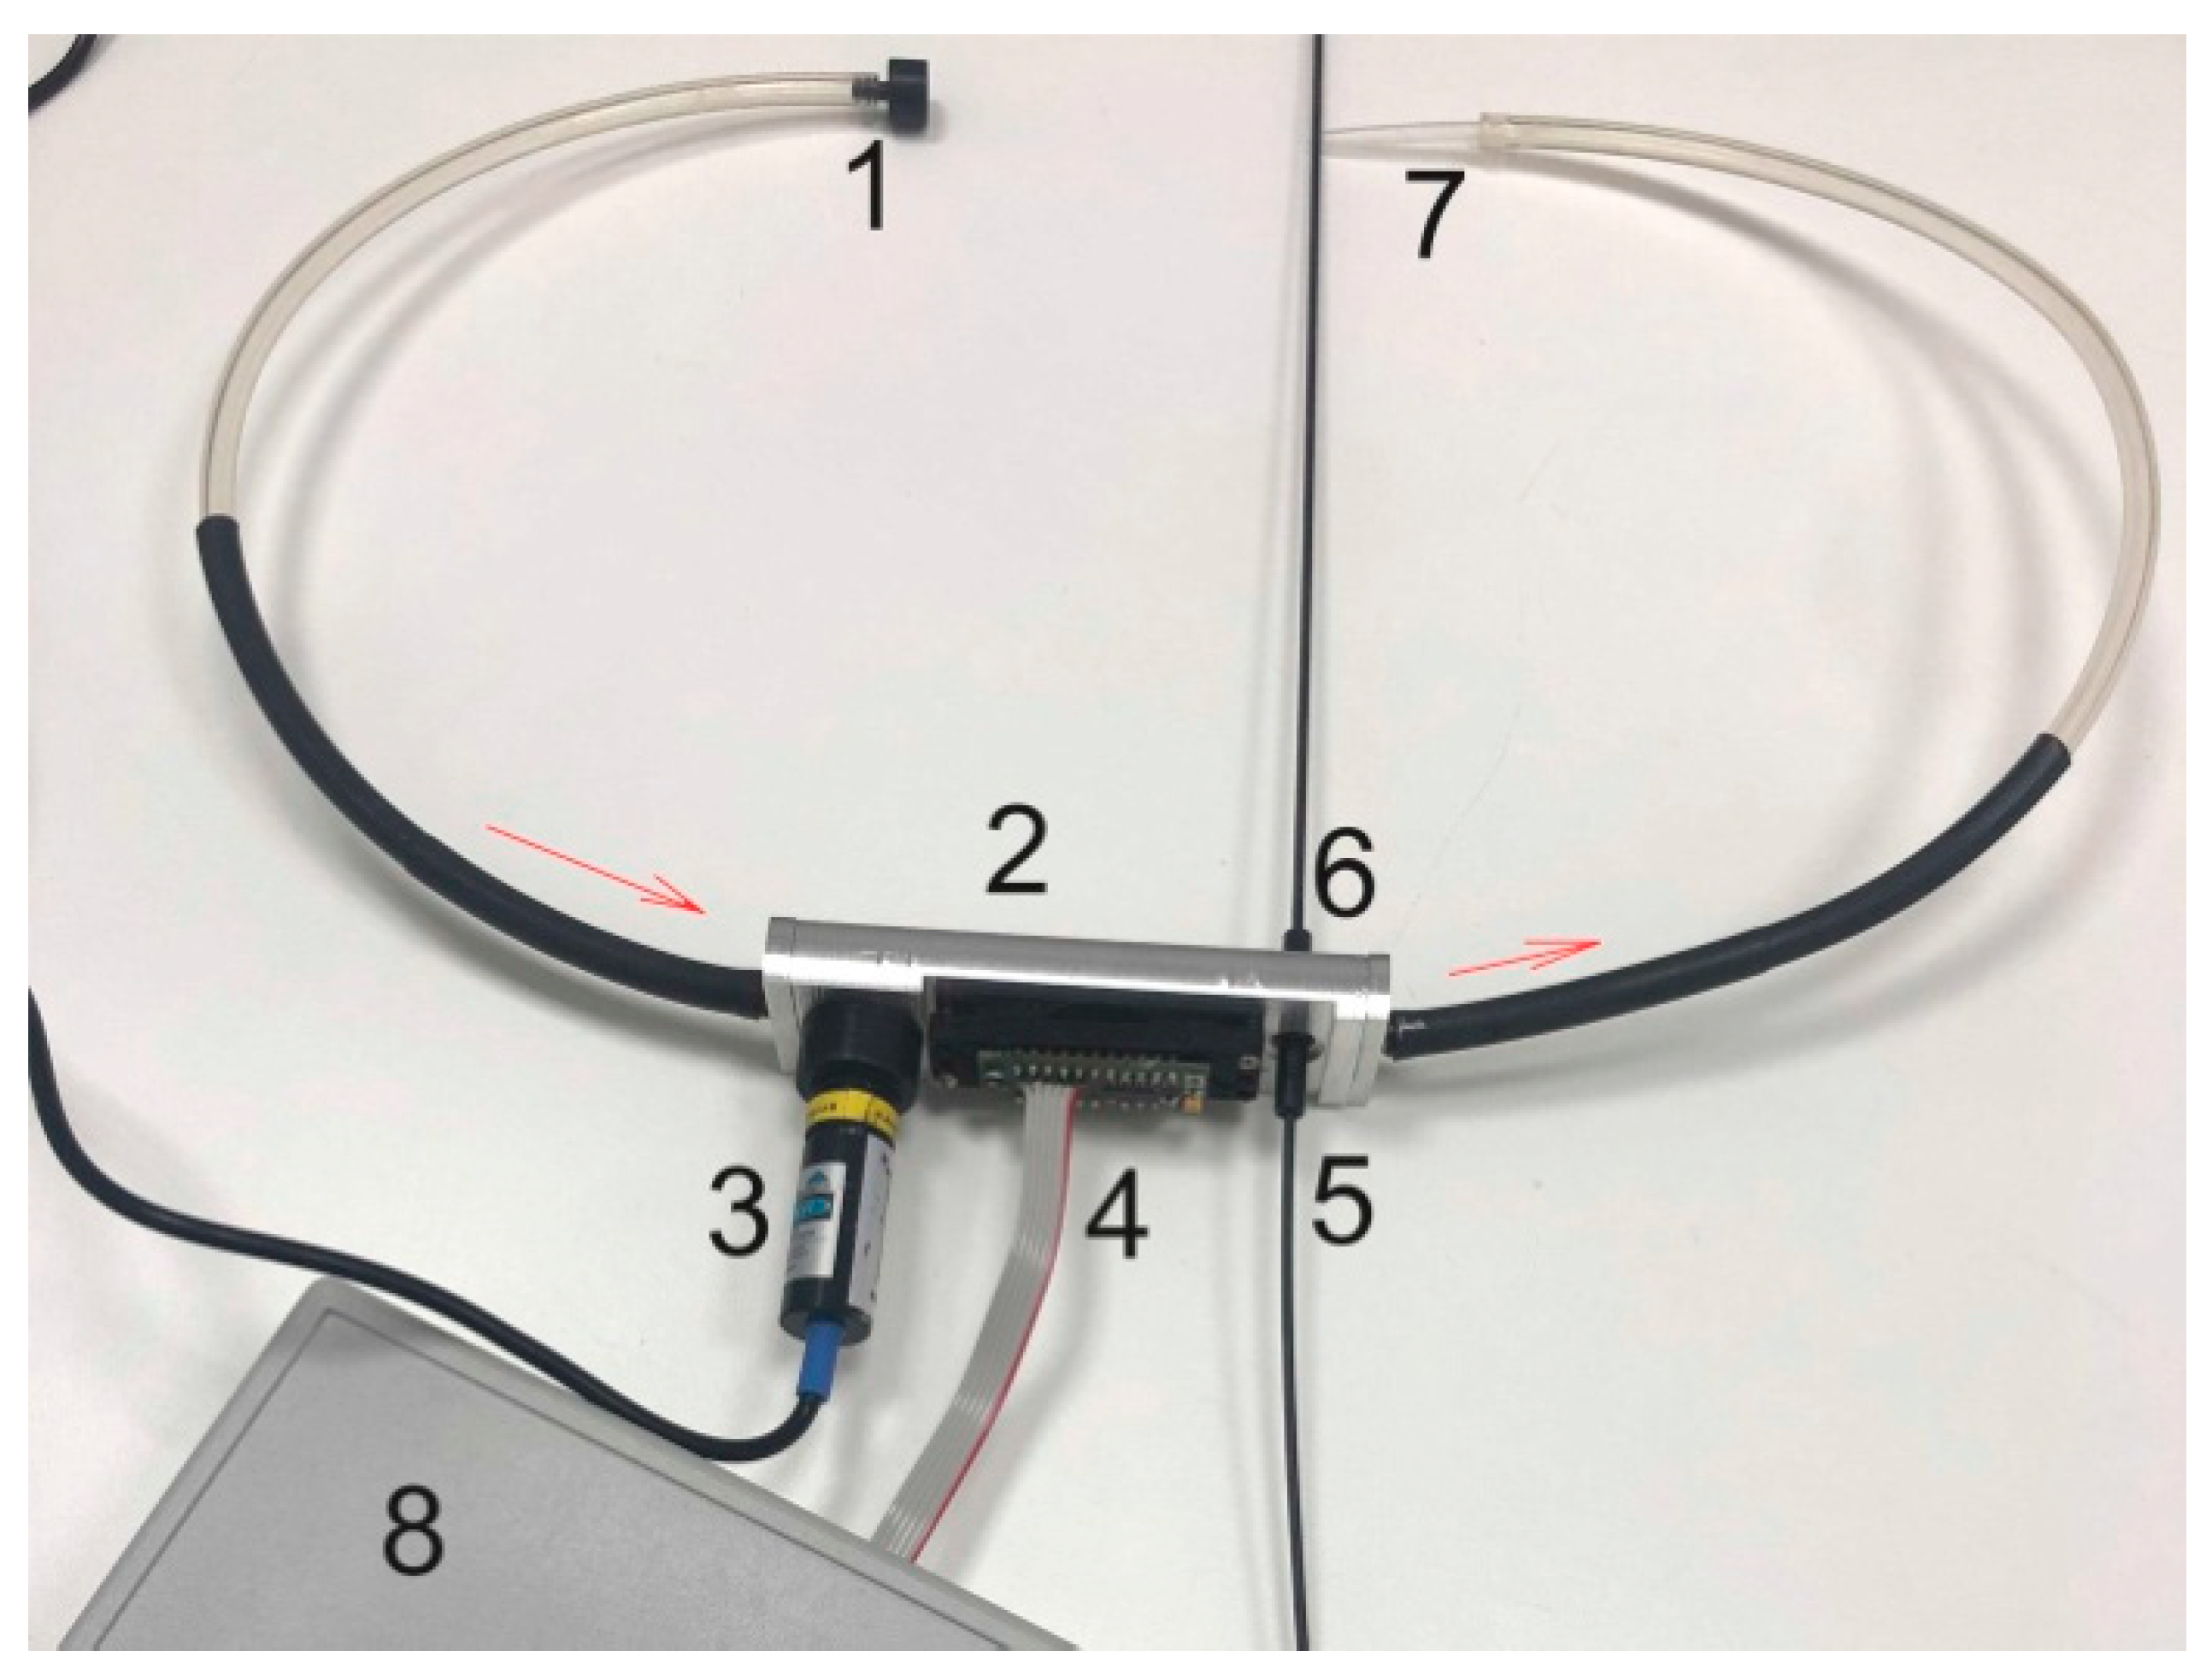
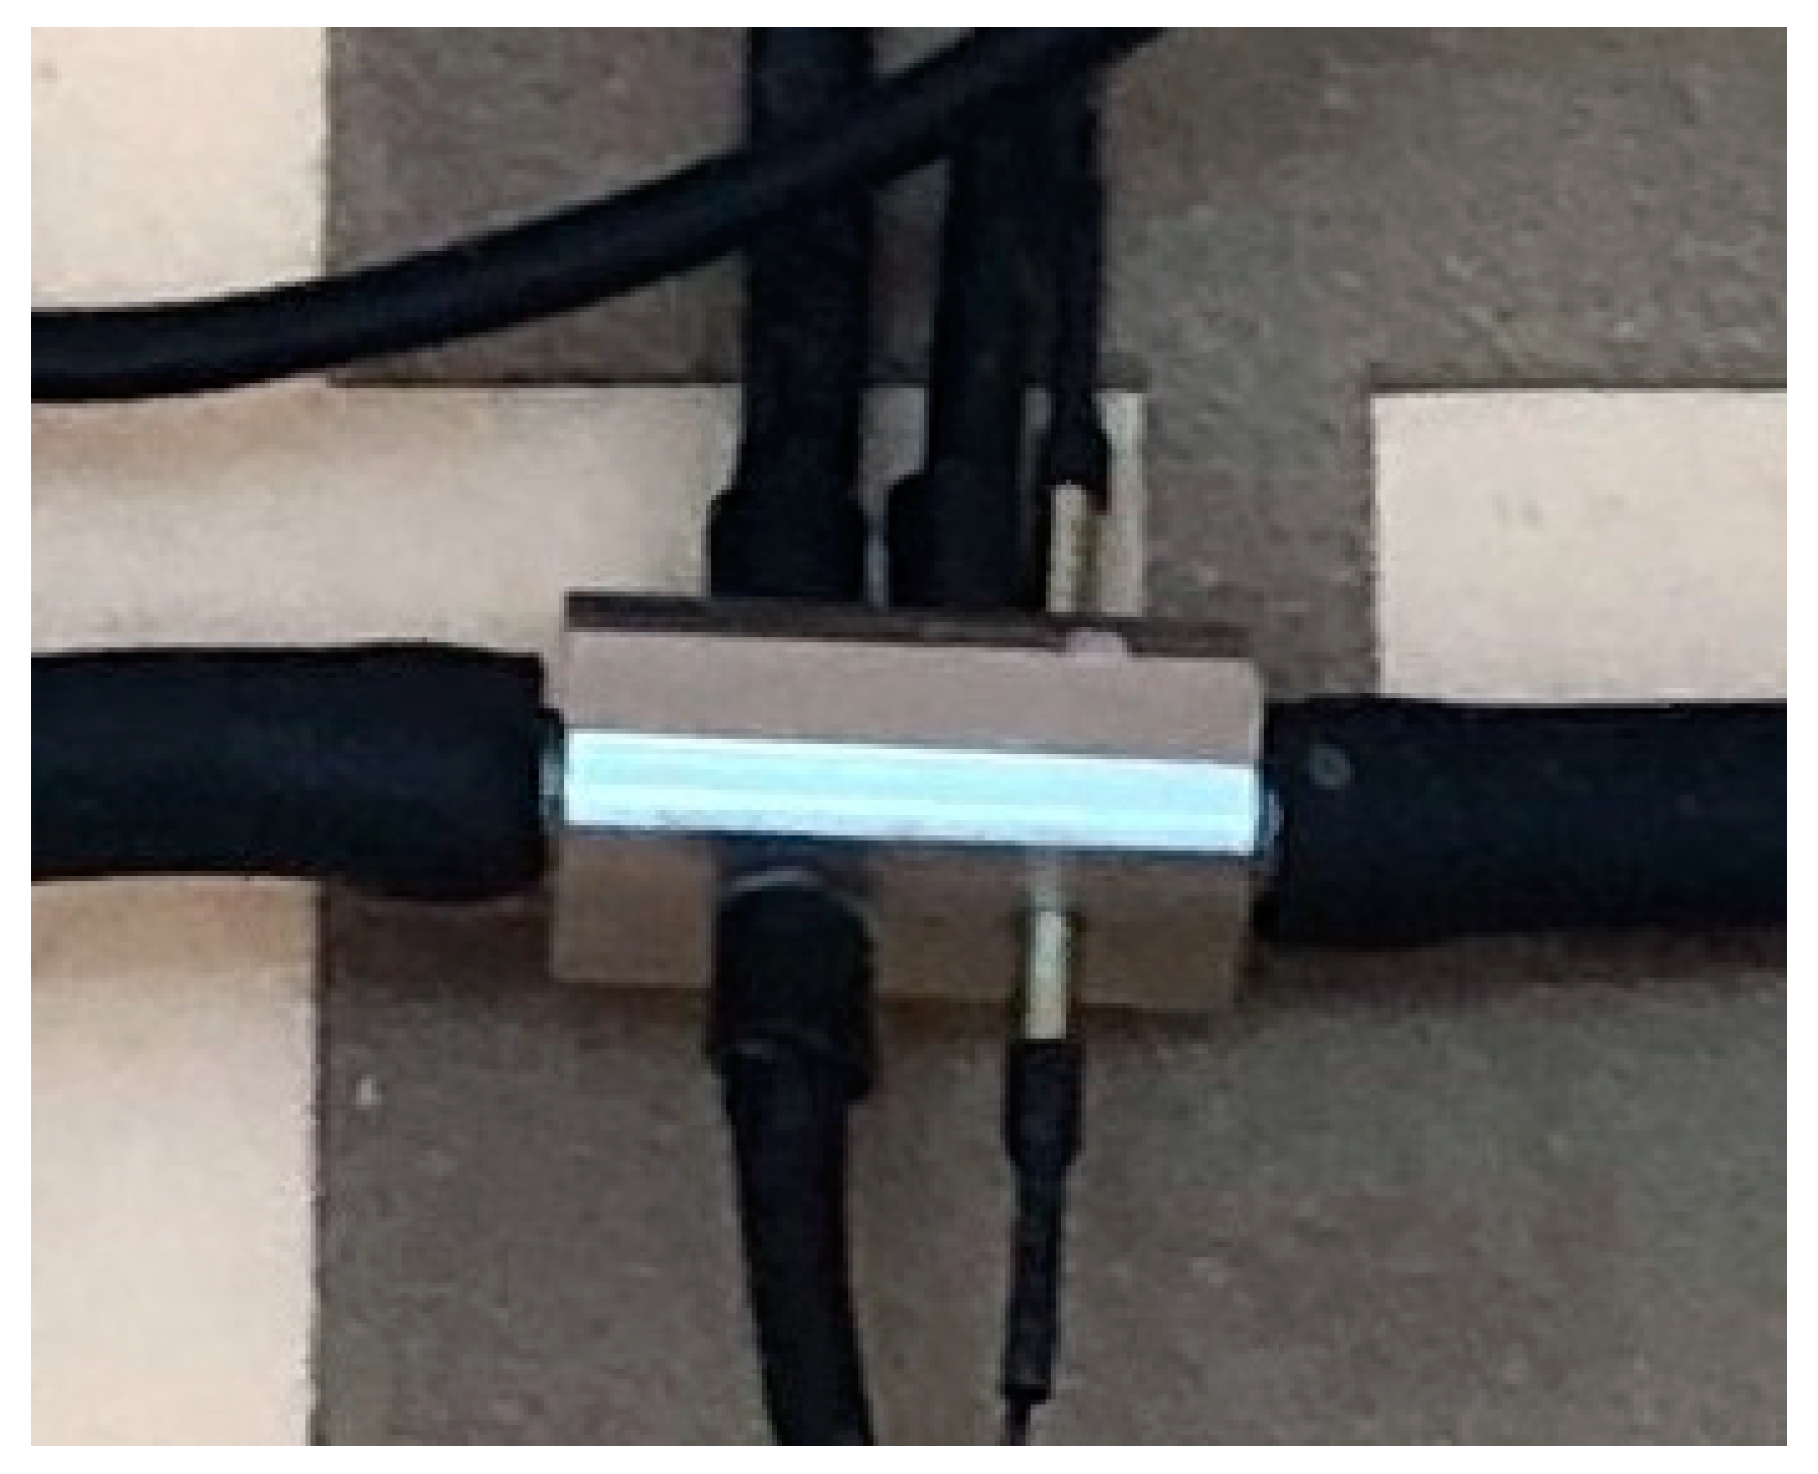
The experimental setup (
Figure 8 and
Figure 9) provides an imitation of the milking machine operation due to the bubble generator. The milk flow in the milk pipe is not constant, but a succession of air and milk parts of unequal size. The elements 6 and 8 constitute together a fiber optic based optocoupler. Accordingly, the receiver 8 measures the extinction of the intensity of the laser source 6 after passing across the tube in which the milk flows. The optical extinction during the passage of dispersed milk components through the laser beam has the form of short pulses in time. The highest pulses on the oscillograms are obviously given by fat globules as they are the largest among other milk components and most attenuate the light beam. Since we are dealing with a moving milk-air mixture, the flow of milk is not continuous but fragmented by air gaps (large bubbles). During the passage of a large bubble that approached 8, the receiver 8 stops measuring extinction pulses from small particles of milk (specifically, fat globules) and serves in conjunction with the receiver 7 to detect the number of bubbles passing per unit time. The reference signal coming from the receiver 8 has a double function. First, it is necessary for analyzing the composition of milk by detecting pulses of extinction from dispersed components in the milk plug, primarily fat globules, in order to thus determine the fat content in milk. In addition, assuming that the speed of the milk plug is proportional to the number of pulses per second, the milk flow velocity can be evaluated. Second, it can detect the moment of arrival of large bubbles, which are essentially air gaps in the milk flow. At the same time, the receiver 7 can be used to detect the moment when the bubble passed the distance between 7 and 8; and, in turn, from the bubble transit time, the speed of the entire air-milk flow can be also determined.
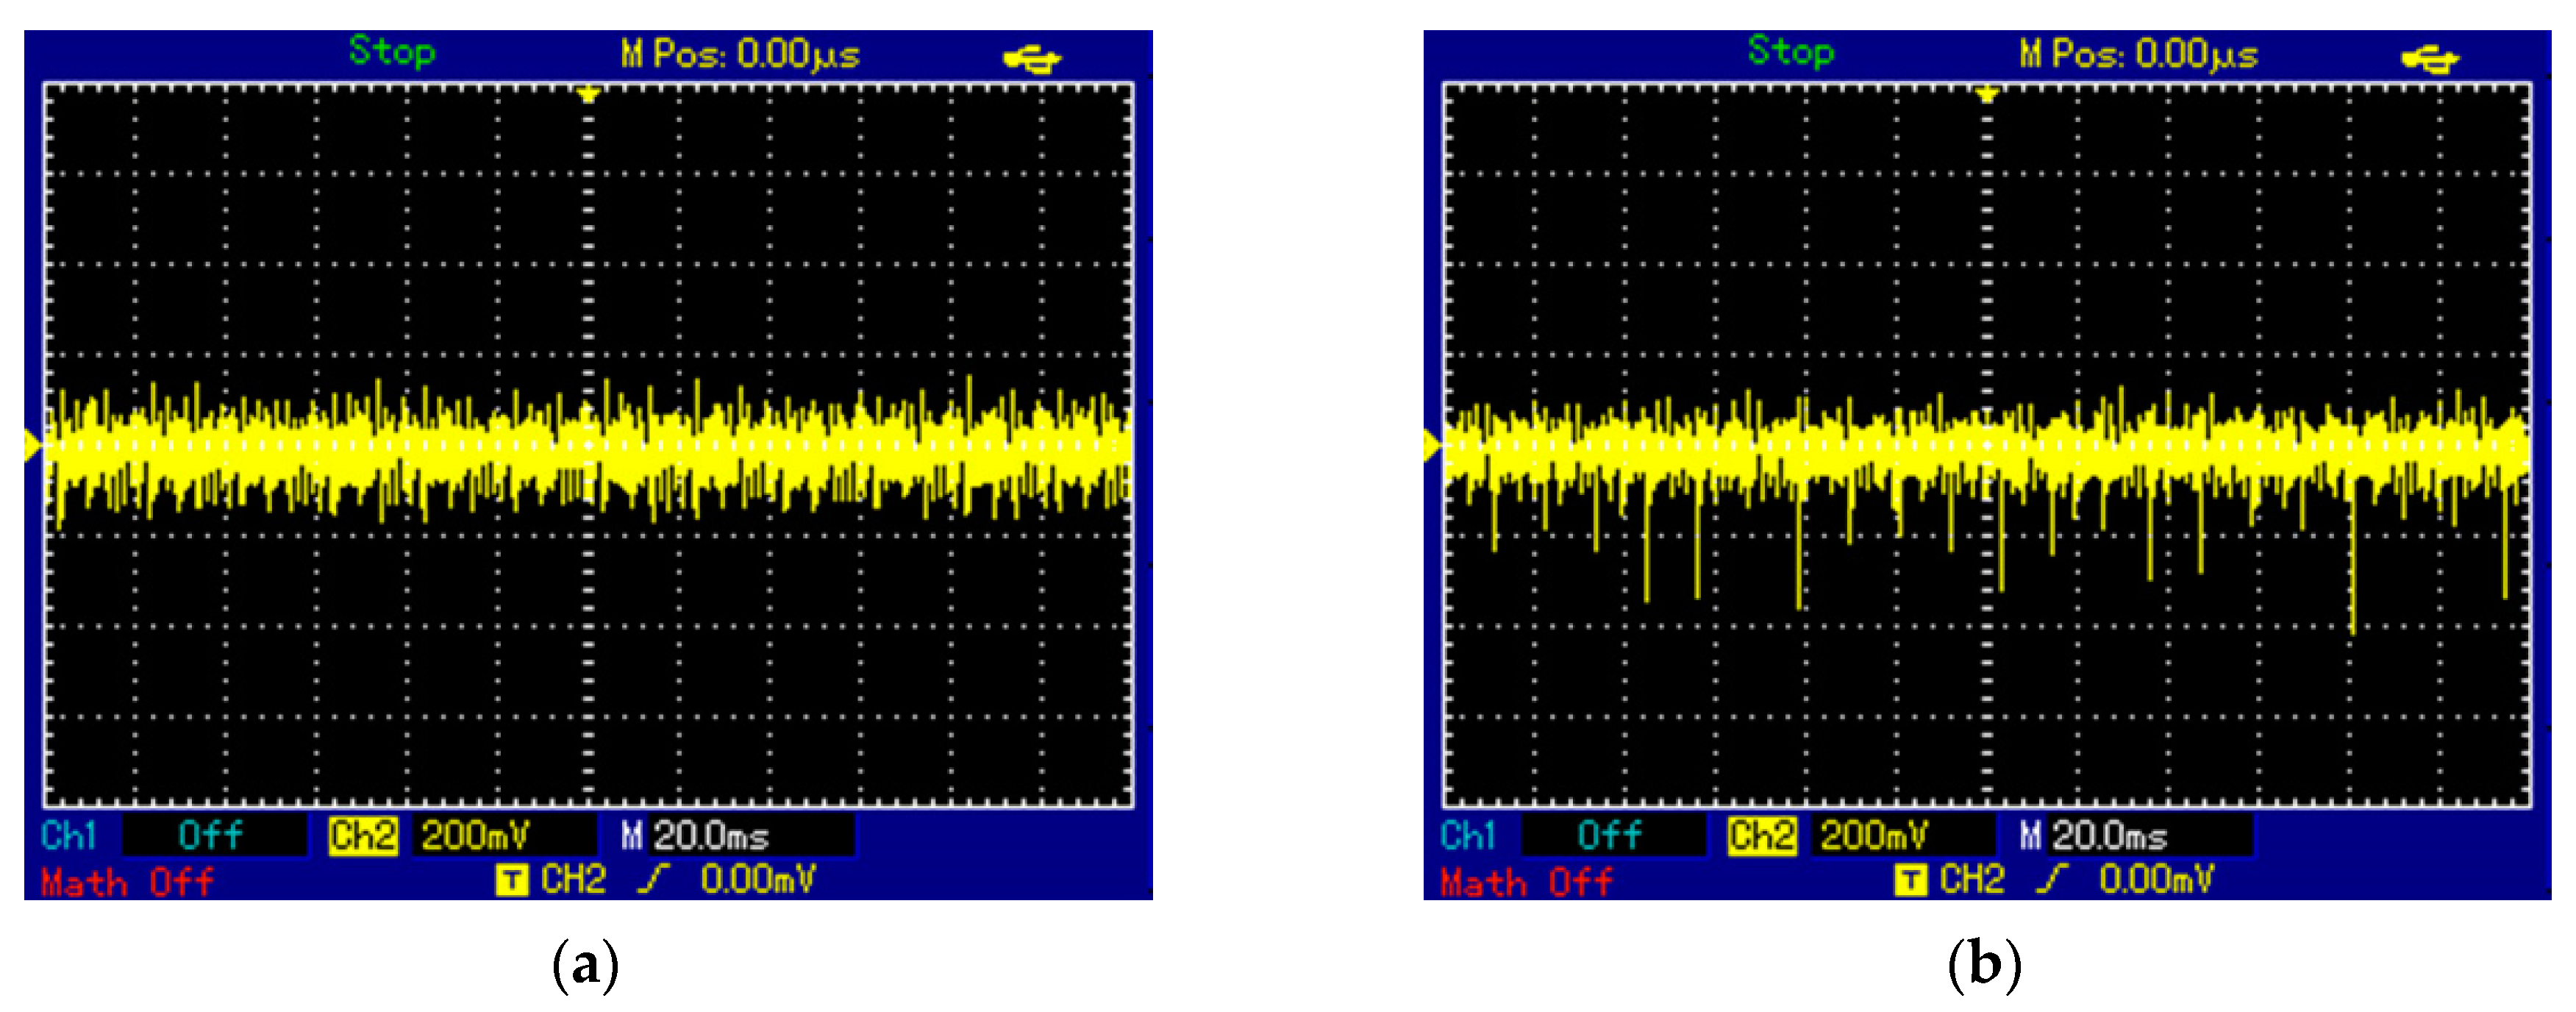
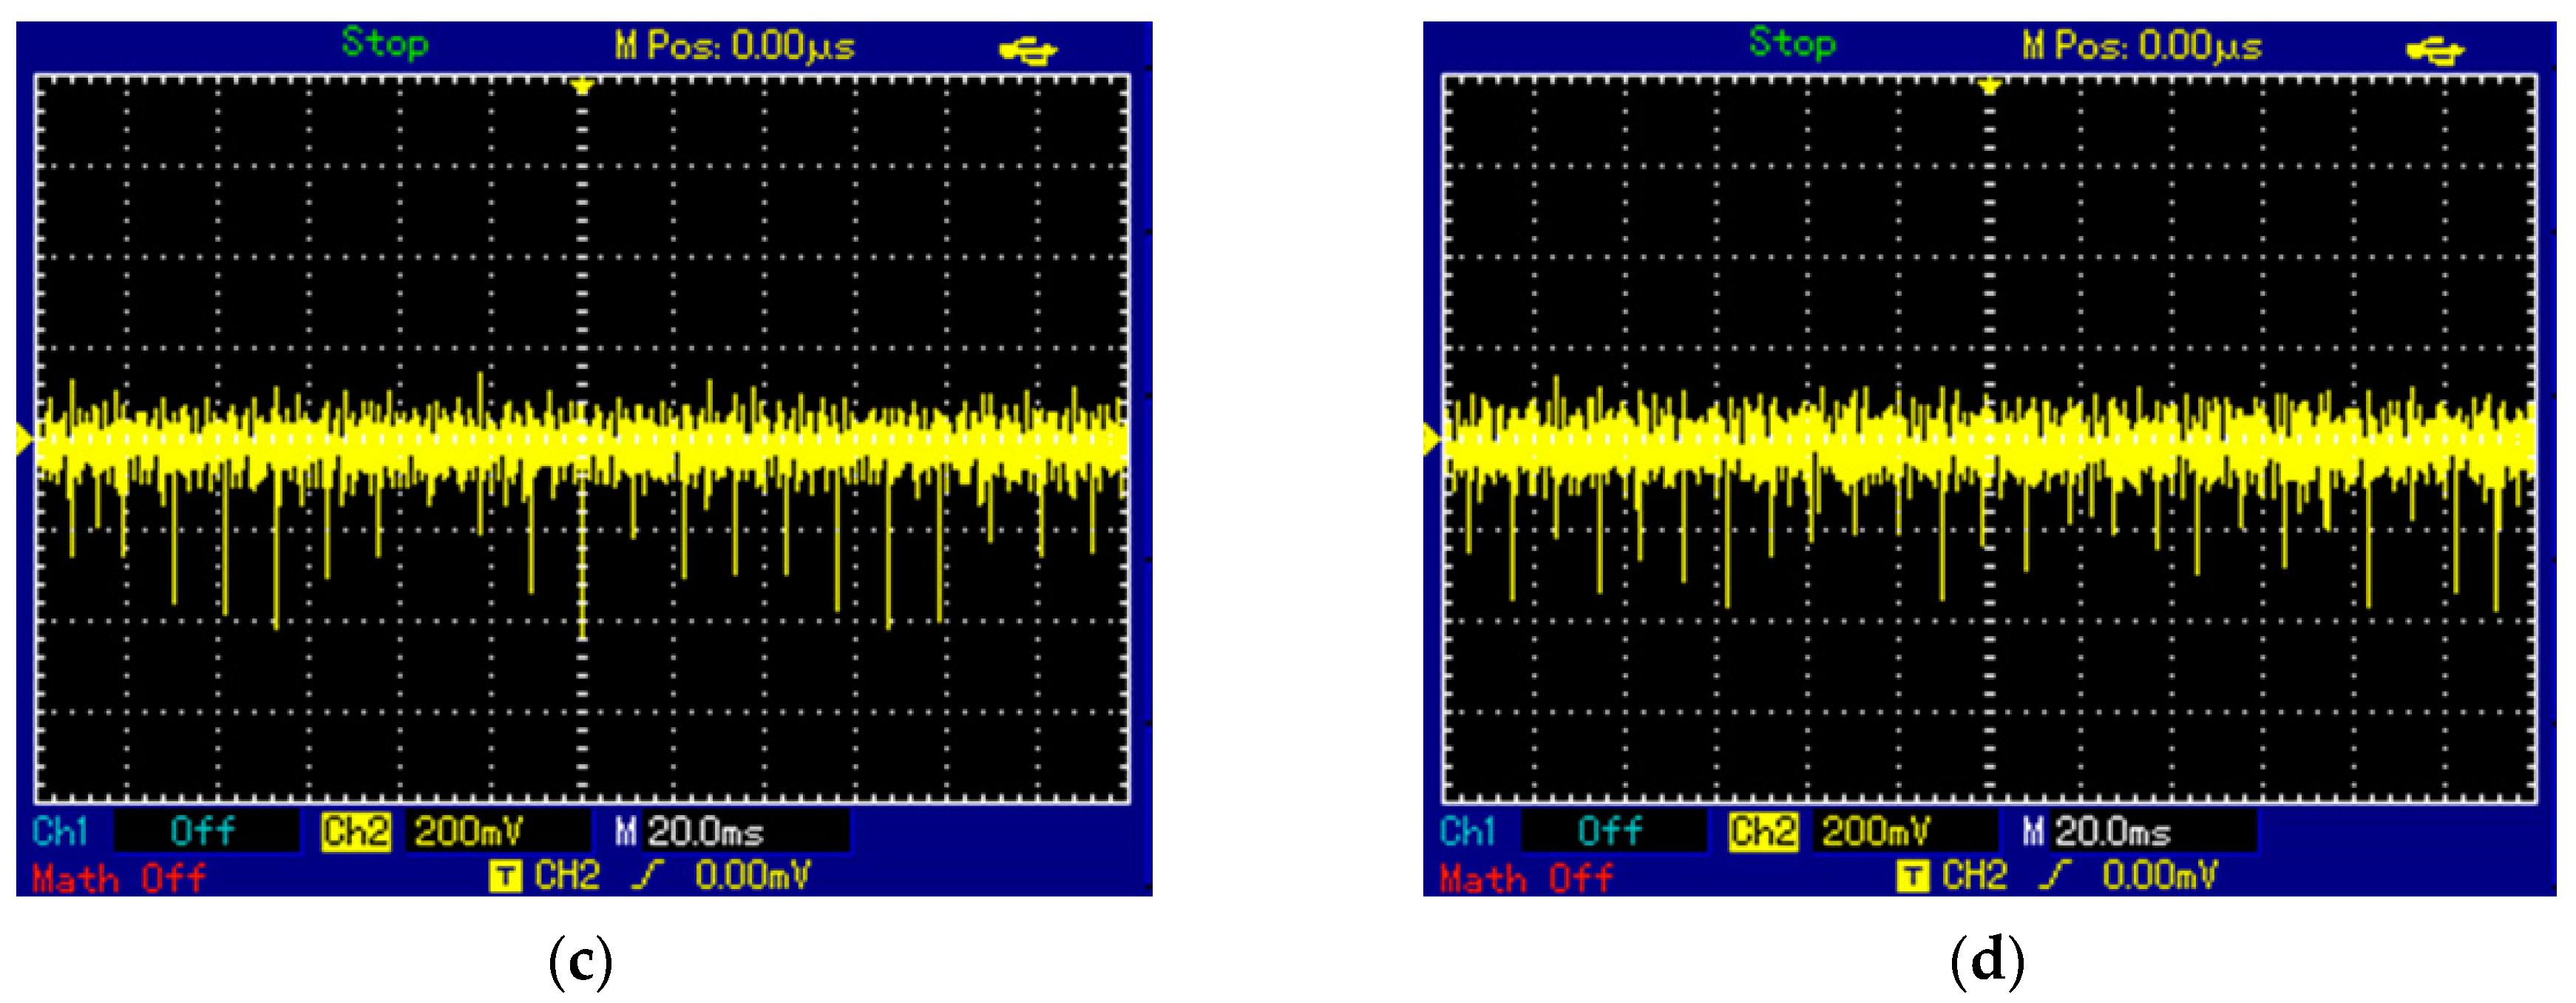
Experiments with raw milk using the setup (
Figure 8 and
Figure 9) showed that the passage of large fat globules can be recorded by reading the optical signal from the fiber optic bundle of the receiver 8 (
Figure 10).
The response pulses should be counted at a threshold discrimination of non-informative noise. As can be seen from the oscillograms of recorded signals (
Figure 10), small-sized impulse emissions most likely correspond to optical extinction on small fat globules, and sharp peaks in the minus region are mainly associated with the presence of large fat globules. When milk moves along the milk pipe, these minus peaks change the frequency of their appearance.
Based on the recorded waveforms (similar to those in
Figure 10), we have plotted a graph (
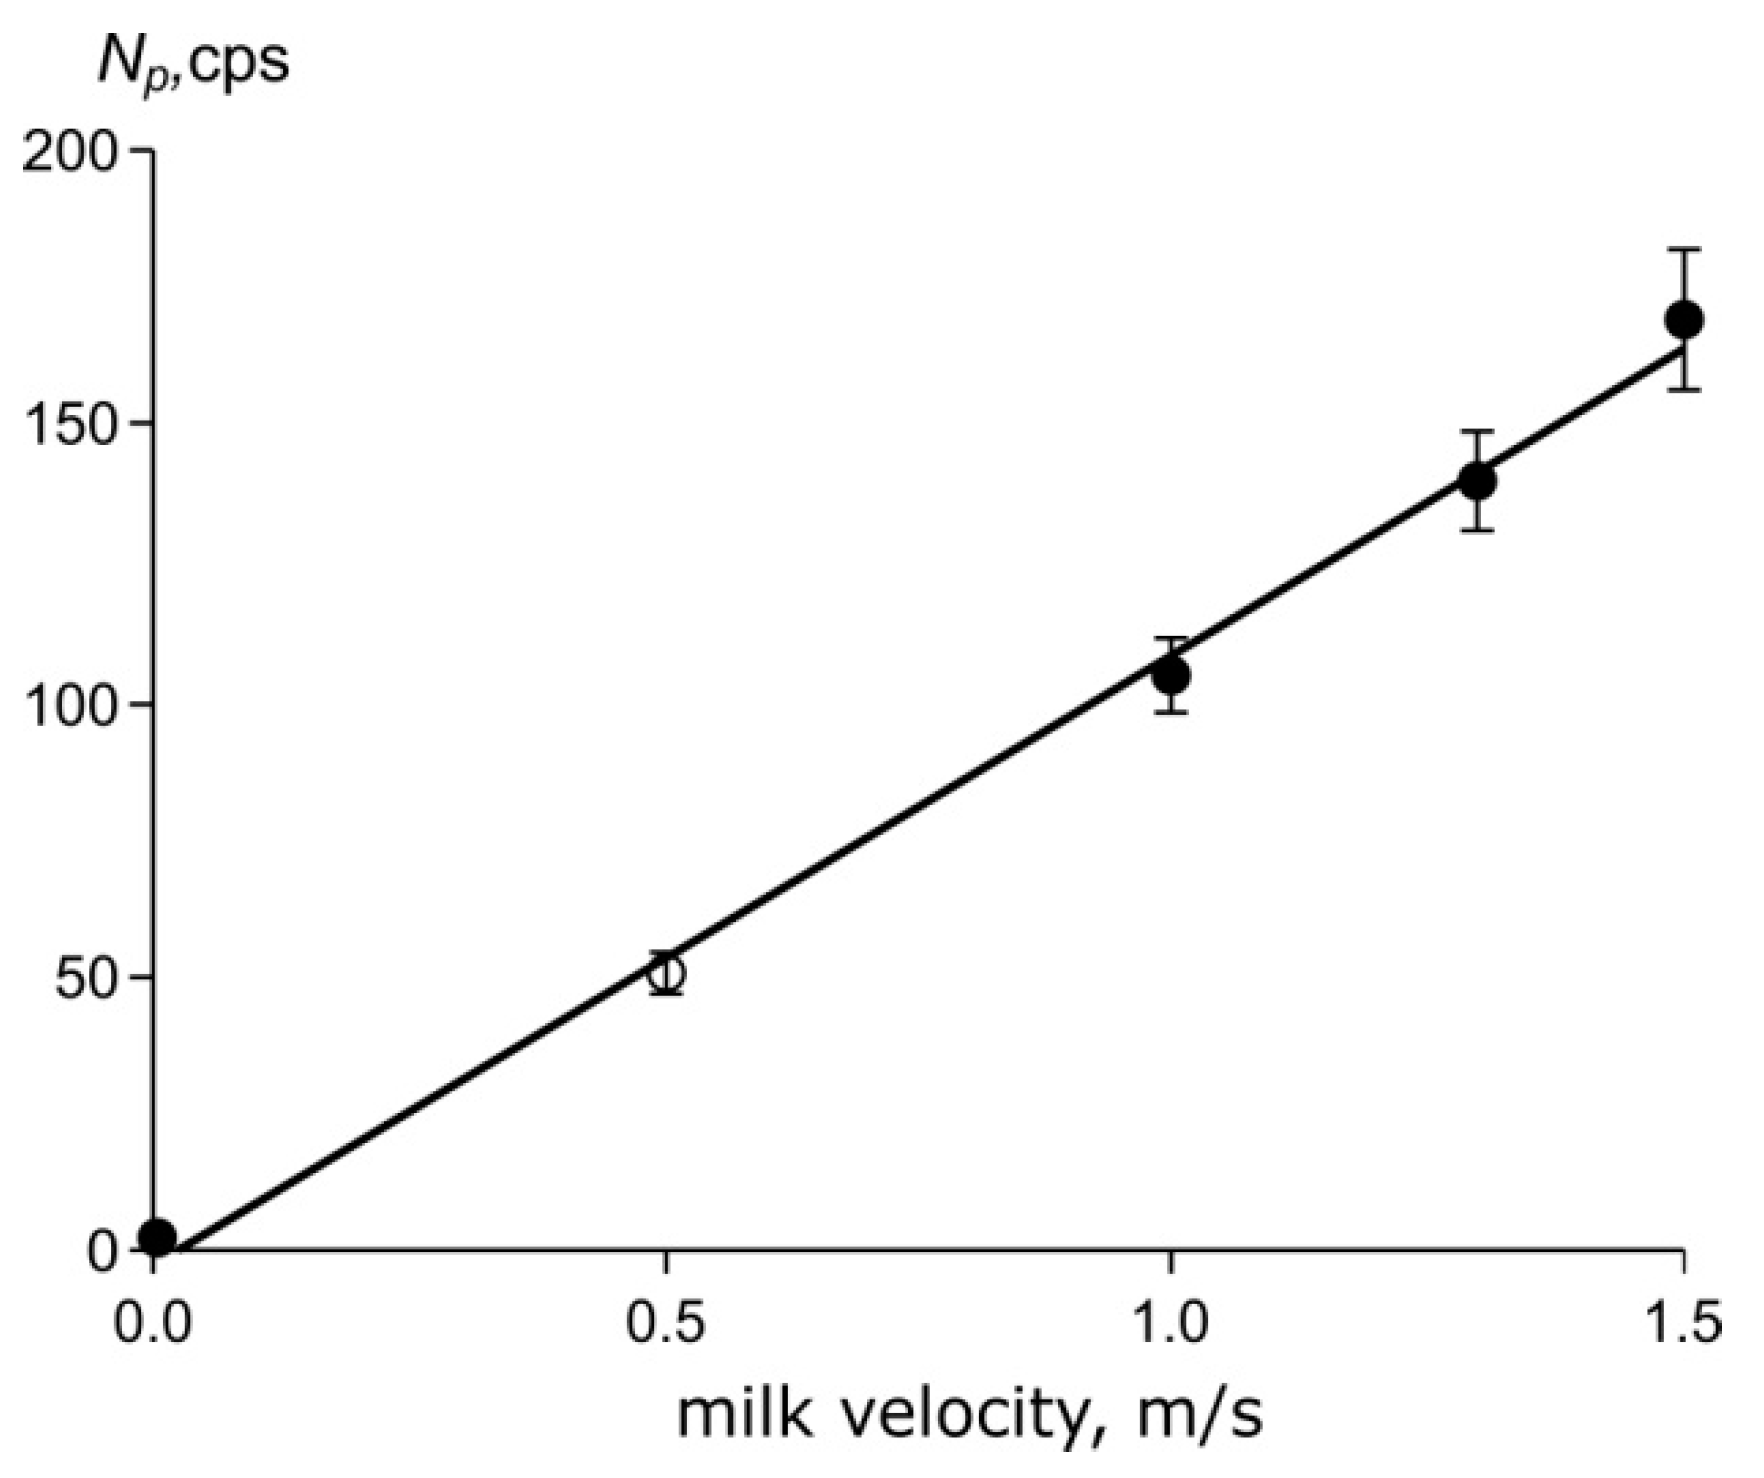
Figure 11) that illustrates a direct correlation between the flow velocity and the frequency of negative pulses
in discrete extinction pattern of the flowing milk. Experimental values of
were obtained by counting the number of pulses exceeding the threshold noise value, estimated from the oscillograms as the average height of uniform noise (−100 mV). Statistical averaging over a set of sequentially recorded signals was performed; mean values of
with standard deviations and a linear approximation are displayed in
Figure 11.
The dependence (
Figure 11) can be considered as an experimental test of the outlined milk flow model, since
(ordinate axis) was calculated as the average number of pulses per second over several waveform oscillograms measured for each of the given values of flow velocity (abscissa axis), which were set in the pumping system of the experimental setup using the relationship of speed and pressure according to Formula (12). The adjusted values of flow rate were checked by measuring the volume of the milk passed through the sensor during the test using a graduated cylinder.
The approximate linearity of the obtained dependence (
Figure 11) indicates the adequacy of the applied model of laminar flow for air-milk mixture. Thus, the measurements of response counting rate can in principle be used to determine both milk flow rate and fat content.

 ,
, 