Article

Hardness Analysis of Foods in a Diet Based on the Mediterranean Diet and Adapted to Chilean Gastronomy

by
Franco Marinelli
1,
Camila Venegas
1,
Fanny Pirce
2,
Jennifer del Carmen Silva Celedón
2,
Pablo Navarro
1,3,
Marcela Jarpa-Parra
4 and
Ramón Fuentes
1,5,*
1
Research Centre in Dental Sciences (CICO-UFRO), Dental School, Facultad de Odontología, Universidad de La Frontera, Temuco 4780000, Chile
2
Agroindustry Institute, Universidad de La Frontera, Temuco 4780000, Chile
3
Facultad de Ciencias de la Salud, Universidad Autónoma de Chile, Santiago 7500000, Chile
4
Agro-Food Research Center and Vegetable Protein Laboratory, Universidad Adventista de Chile, Chillán 3780000, Chile
5
Department of Integral Adults Dentistry, Dental School, Facultad de Odontología, Universidad de La Frontera, Temuco 4780000, Chile
*
Author to whom correspondence should be addressed.
Foods 2024, 13(19), 3061; https://doi.org/10.3390/foods13193061
Submission received: 26 August 2024 / Revised: 19 September 2024 / Accepted: 24 September 2024 / Published: 26 September 2024

Abstract

:
The human diet is a factor for disease prevention and the extension of life expectancy. Loss of teeth can adversely affect chewing capacity, which can lead patients to modify their diet and subsequently result in a poor dietary intake. This work is conducted within the framework of an ongoing research project in the Dentistry School of Universidad de la Frontera aimed at designing a diet for patients with complete removable dental prostheses (CRDP). This study aimed to evaluate the hardness of foods in a diet designed for patients using CRDP, using texture profile analysis (TPA). TPA was used to measure the hardness of 43 foods, categorized into seven groups, dairy, animal protein, fruits, vegetables, cereals and grains, high-lipid foods, and vegetable protein, to understand their impact on masticatory performance in CRDP wearers. TPA consists of two compression cycles where the food sample is compressed until it reaches a pre-established deformation. The first force peak achieved in the first cycle is used as a measure of sample hardness. Significant differences in hardness were identified within each food group, indicating a wide spectrum of textural properties that could influence chewing behavior. These findings suggest that assessing food hardness can help tailor dietary recommendations to improve masticatory efficiency in patients with dental prostheses.

1. Introduction

Diet is an important factor for disease prevention and the extension of life expectancy [1]. The loss of teeth is a critical condition that adversely affects chewing capacity, which can lead patients to modify their diet composition and result in poor dietary intake [2]. This can lead to malnutrition, as certain foods are avoided, such as fruits and vegetables [3]. Gil-Montoya et al. [4] conducted a study with 2000 dentate subjects and 860 edentulous subjects. They found a 10% increase in the risk of malnutrition among edentulous patients. Saarela et al. [5] found that edentulous subjects without dentures present a higher prevalence of malnutrition, 32.1%, according to the Mini Nutritional Assessment, whereas edentulous patients with some removable dentures present 26.1%, and dentulous patients with or without removable dentures present 16.6%. Malnutrition is not only a lack of nutrients, but also an unbalanced nutrient intake. Edentulism (or toothlessness) is related not only to a nutrient deficit [6,7,8,9], but has also has been found to be related to obesity [10,11]. Furthermore, a lower consumption of fruits and vegetables is highly related to a low oral health quality of life (OHQoL) [12,13], which becomes a vicious cycle, where a low OHQoL leads to a lower consumption of fruits and vegetables that further decreases OHQoL.
Partial and complete dentures are the recommended treatment to recover chewing function [14,15]. The use of dentures has a positive impact on maintenance of food forms and nutrient intake, enabling denture wearers to chew [16,17,18,19]. Some studies have reported the effects of chewing on logical tests related to arousal [20], attention [21], reaction time [22], and memory [23]. These studies have shown an improvement in the variable under study when subjects were asked to chew gum for a certain period and then repeat the test. Additionally, there is a broad consensus that associates the loss of masticatory function with cognitive decline, due not only to the lack of stimuli but also to malnutrition resulting from this condition [24,25]. Combined with this, diet design and eating recommendations are a complement that benefit the nutrient condition of patients [26] and even have an impact on cognitive function [27]. Based on the aforementioned, the design of a dietary guideline focused on denture wearers is of interest to improve the quality of life for these patients. Traditional Chilean cuisine shares many similarities with Mediterranean culinary traditions. Dishes like charquicán, porotos granados (stewed beans with corn), and cazuela de ave (chicken stew) use a flavor base of onions, oregano, cumin, paprika, and garlic—like the Spanish sofrito. Chilean seafood soups such as caldillo de congrio (conger eel stew) and mariscal also feature Mediterranean ingredients like tomatoes, peppers, and parsley. Common salads include tomatoes, onions, and herbs, dressed with oil, lemon, and salt. Pebre, a traditional Chilean condiment made with finely chopped onions, tomatoes, garlic, parsley, cilantro, and chili, is typically served with vinegar, salt, and oil. Wine consumption is also integral to Chilean food culture [28].
The Mediterranean diet (MedDiet) is a well-known dietary pattern based on a high intake of plant foods (fruit, vegetable, bread, cereals, potatoes, beans, nuts, and seeds) [29]. Several studies have evaluated the effects of the MedDiet in reducing the risk of obesity [30,31] cardiovascular disease [32], cancer [33], Parkinson’s disease [34], and Alzheimer’s disease [35]. In a recent study, Wu et al. [36] analyzed a group of 8290 people, 4159 participants with periodontitis and 4131 without periodontitis, and found a negative relationship between the presence of periodontitis, probing pocket depth (PPD), clinical attachment level (CAL), and adherence to the Mediterranean diet. Chile harbors are one of the five Mediterranean-type ecosystems globally, with its Mediterranean climate present in the central region. This climate is comparable to other Mediterranean ecosystems found between latitudes 30° and 45° north or south, with west-facing coastlines, such as those in the Mediterranean Basin, California, southern Australia, and South Africa. Moreover, agricultural production in central Chile includes products like those in Mediterranean countries, with olive oil and wine being notably prominent [37]. Therefore, considering that traditional Chilean cuisine features various dishes utilizing ingredients and preparation methods akin to those of the Mediterranean diet, it represents a feasible and culturally relevant alternative for promoting a healthy lifestyle. In order to design a diet focused on denture wearers, food hardness has influenced chewing behavior.
The influence of the hardness of foods on chewing behavior is an area widely studied in dentistry [38]. Park et al. [39] analyzed the number of chewing cycles and the duration of chewing in relation to the hardness of a set of rice products in a group of adult subjects (26.28 ± 2.78) years and another group of elderly (79.53 ± 3.48). They found that as hardness increased, the duration and number of chewing cycles also increased in the young group. Laird et al. [40] found similar results using cooked sweet potato, chicken, celery, and raw sweet potato. Tonni et al. [38] conclude that hard foods increase all physiological masticatory parameters and suggest that a hard diet can improve mastication efficiency. Food texture influences in bolus particle size and saliva flow. Saliva incorporation to the bolus contributes to digestion, due to the presence of enzymes in saliva, and moisture and lubrication making, swallowing easier [41].
Traditionally, texture profile analysis (TPA) is used in food industry to assess food texture. TPA consists of two compression cycles where the food sample is compressed until it reaches a pre-established deformation. The two cycles simulate the chewing action. Rheological properties such as hardness, cohesiveness, and chewiness are described by TPA. The first force peak achieved in the first cycle is used as a measure of sample hardness. TPA helps in characterization of foods and its influence in individuals with compromised oral function [39,42].
In this context, a diet with high nutritional value that also requires the patient to exercise chewing could have clinical implications. The present study aims to evaluate the hardness of foods, by means of TPA [43], in a diet adapted to Chilean gastronomy, based on the Mediterranean diet. These results will be used as reference for a future dietary guideline that considers nutritional value and chewing exercise.

2. Materials and Methods

2.1. Groups of Foods Based on Mediterranean Diet
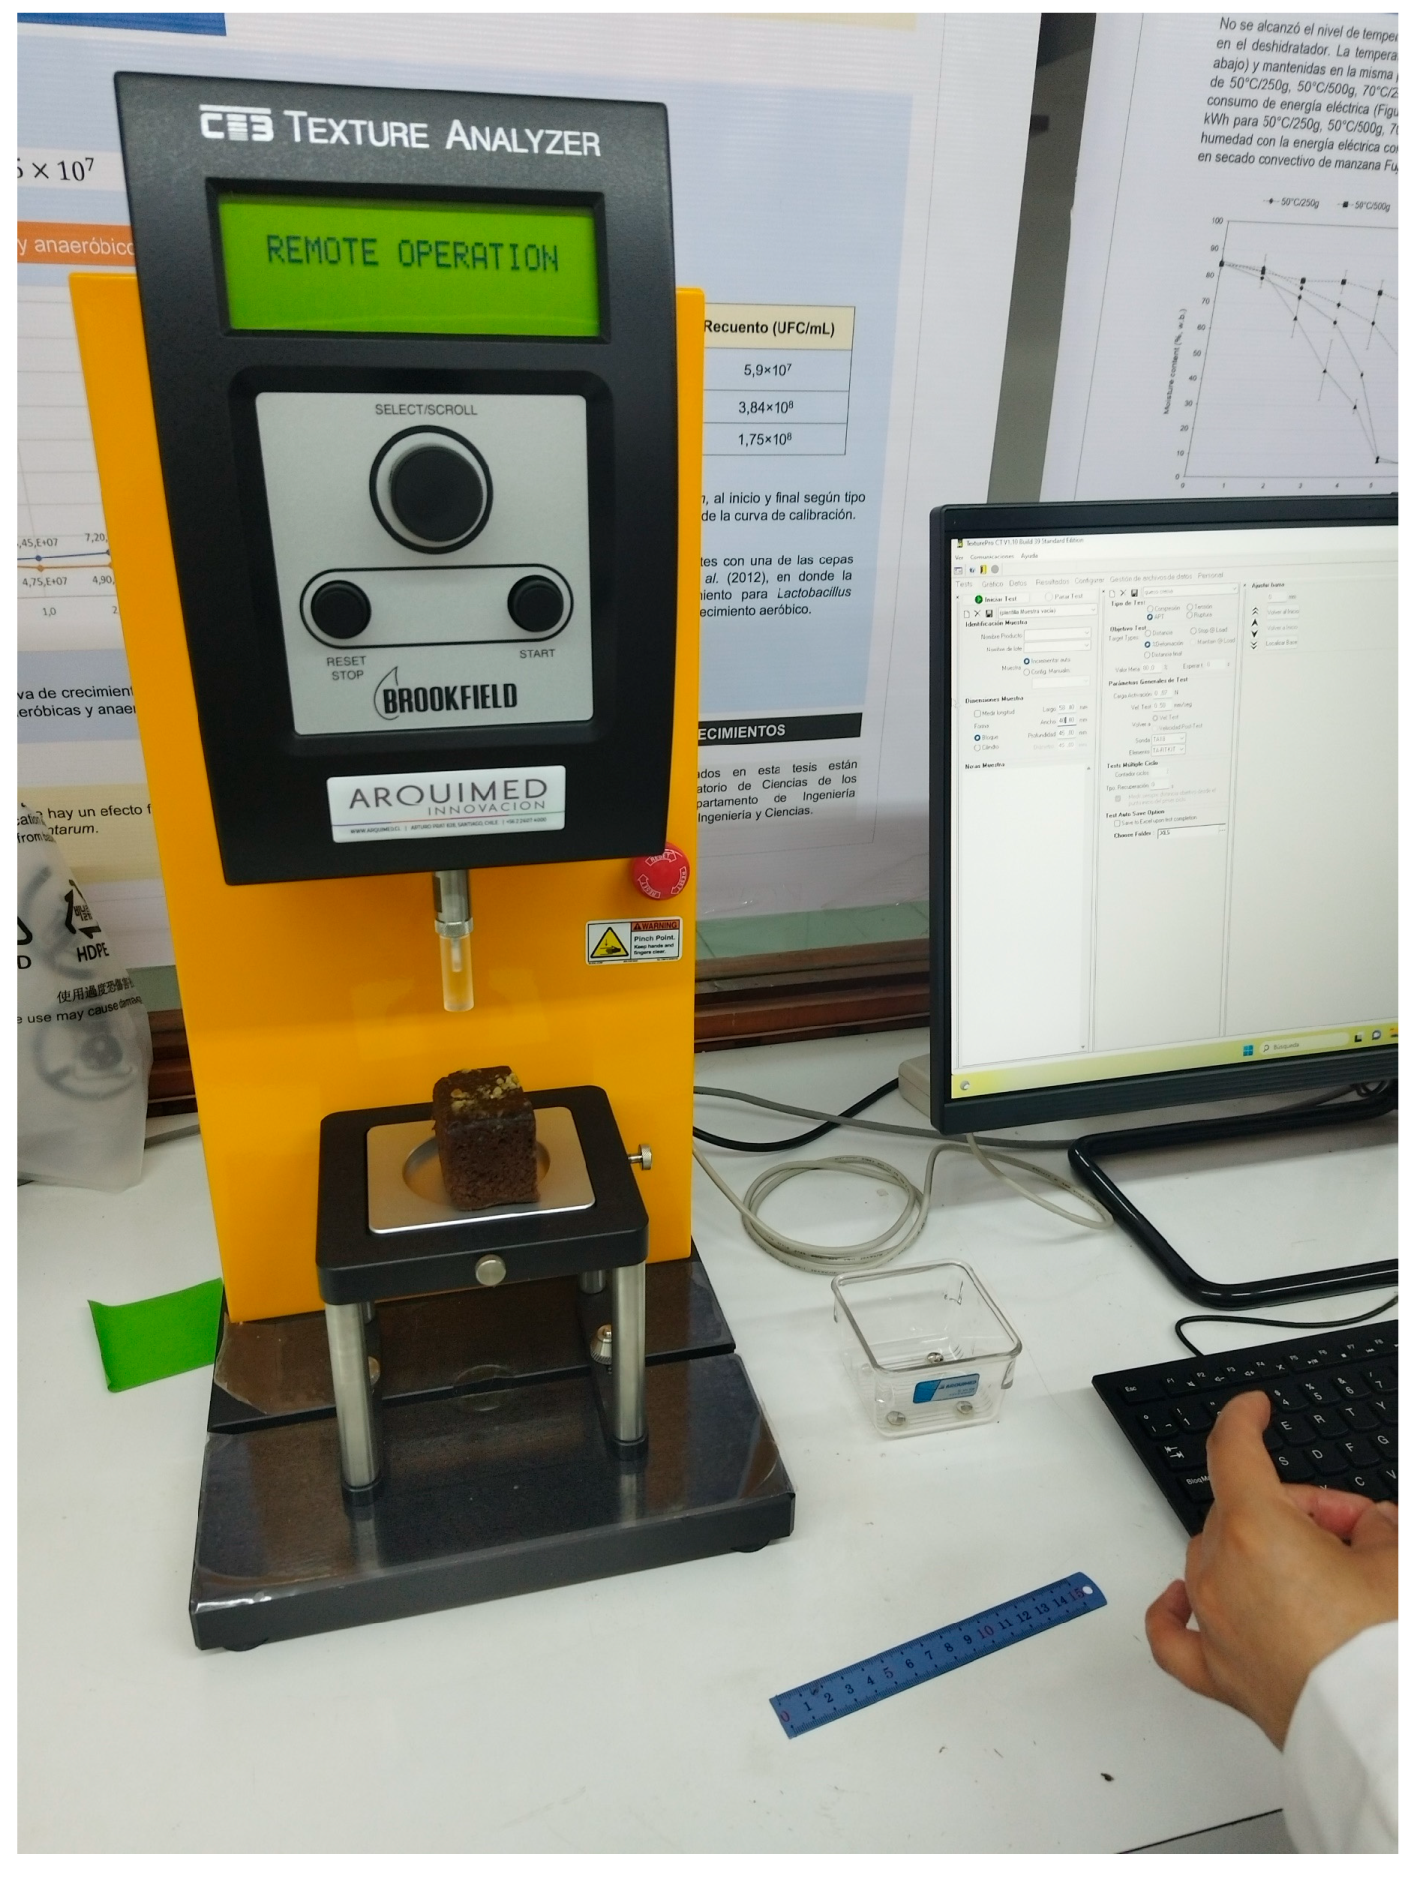
The MedDiet is largely described in the literature, emphasizing a high consumption of extra virgin olive oil, vegetables, fruits, cereals, nuts and legumes, a moderate consumption of fish and other meats, dairy products and red wine, and a low consumption of eggs and sweets [44].
Seven groups of foods are defined: dairy products, animal protein, vegetable protein, fruits, vegetables, cereals and grains and foods high in lipids or others. These are compounded by common products found in the markets of Chile. Table 1 shows the foods belonging to each group. These are traditional products in the Mediterranean diet [44]. Chanco cheese is a typical Chilean cheese. Jack mackerel is a fish cheaper than others present in Chilean cuisine, such as salmon. Husked wheatberries (mote con huesillo) [45] is a traditional Chilean dish. PACAM cream is a cream soup that is part of the Complementary Feeding Program for the Elderly (Programa de Alimentación Complementaria del Adulto Mayor, PACAM). The cooking procedures are based on local customs, taking into account not to overboil the food, as this reduces its nutritional value [46,47].

2.2. TPA Analysis

TPA analysis is a well-established method that provides data concerning the texture of the food tested. To make comparisons between foods that belong to the same group, each group was tested with particular conditions considering the texture of food. The analysis was performed using a CT3 Texture Analyzer (AMETEK Brookfield, Middleboro, MA, USA) and hardness was obtained (Figure 1). All foods were tested under the same conditions, subjected to two compression cycles, until 50% deformation was obtained. A speed of 0.5 mm/s, pre- and post-test speed of 2 mm/s, and 5 s rest after the first cycle were used during the test.

2.2.1. TPA on Dairy Products

In this group, there are four types of cheese and yogurt. The products used were buttery cheese (Soprole, San Bernardo, Chile), chanco cheese (Quiyalles, Santiago de Chile, Chile), ricotta (Quiyalles, Santiago de Chile, Chile), soft unsalted cheese (Santa Ana de Huingán, Los Angeles, Chile), and light lactose-free yogurt (Colun, La Uniòn, Chile). These products were stored at 4 °C. Testing conditions are provided in Table 2.
Cheese-group test conditions were defined according to manufacturer recommendations and Rukiye et al. as the reference [48]. For ricotta and yogurt, manufacturer recommendations and guidance in Ismail et al. were used as the reference [49].

2.2.2. TPA on Animal Protein

In this group, there are four types of meat and eggs. The products used were white eggs, canned jack mackerel (Trachurus murphyi), chicken thighs, turkey breast, and beef (sirloin tip). Testing and cooking conditions are provided in Table 3.
Meat samples were cut into 4 × 4 × 2 cm pieces. The egg sample was cut to achieve a 2 cm height in the thickest part. Aguirre et al. [50] was used as the reference.

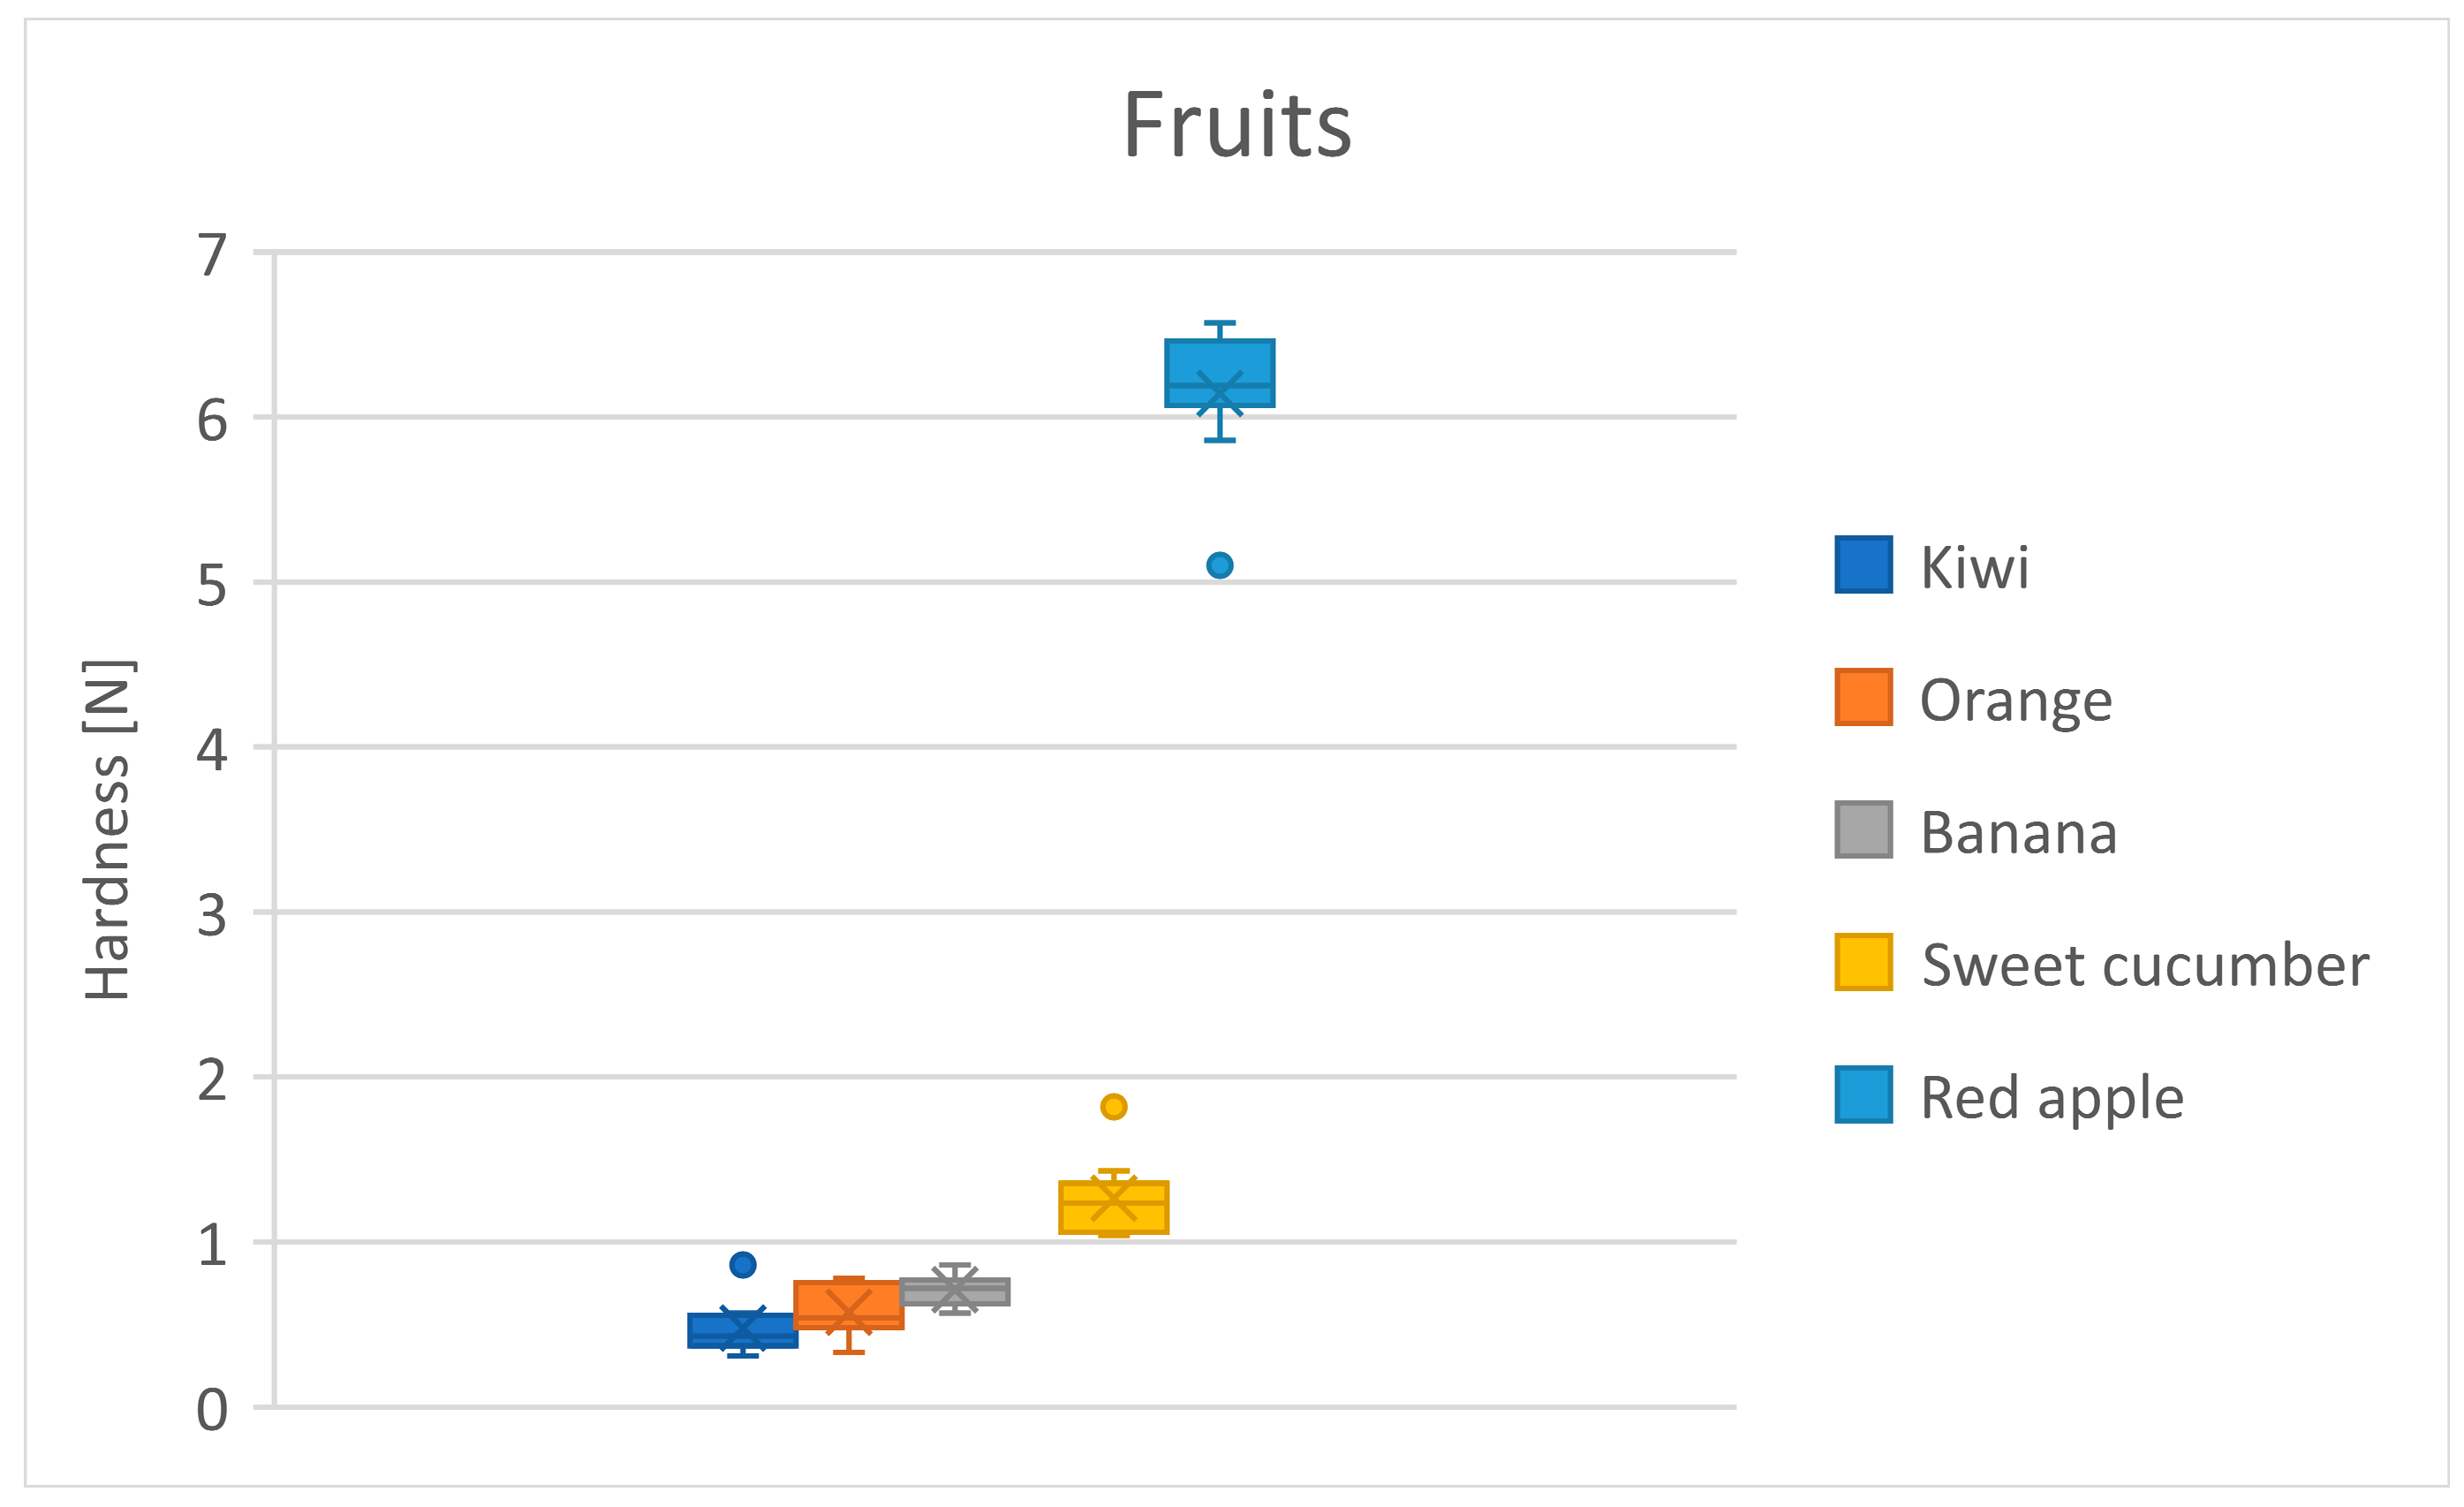
2.2.3. TPA on Fruits

There are five fruits in this group: kiwi (Actinidia deliciosa), orange (Citrus aurantium), banana (Musa paradisiaca L.), sweet cucumber (Solanum muricatum), and red apple (Malus domestica Borkh). Testing conditions are provided in Table 4.
Each product was cut to achieve a sample 2 cm in height. Banana and sweet cucumber were cut in the center of the fruit [51]. For fruit testing, a Magnes Tylor probe was used according to the manufacturer’s recommendation.

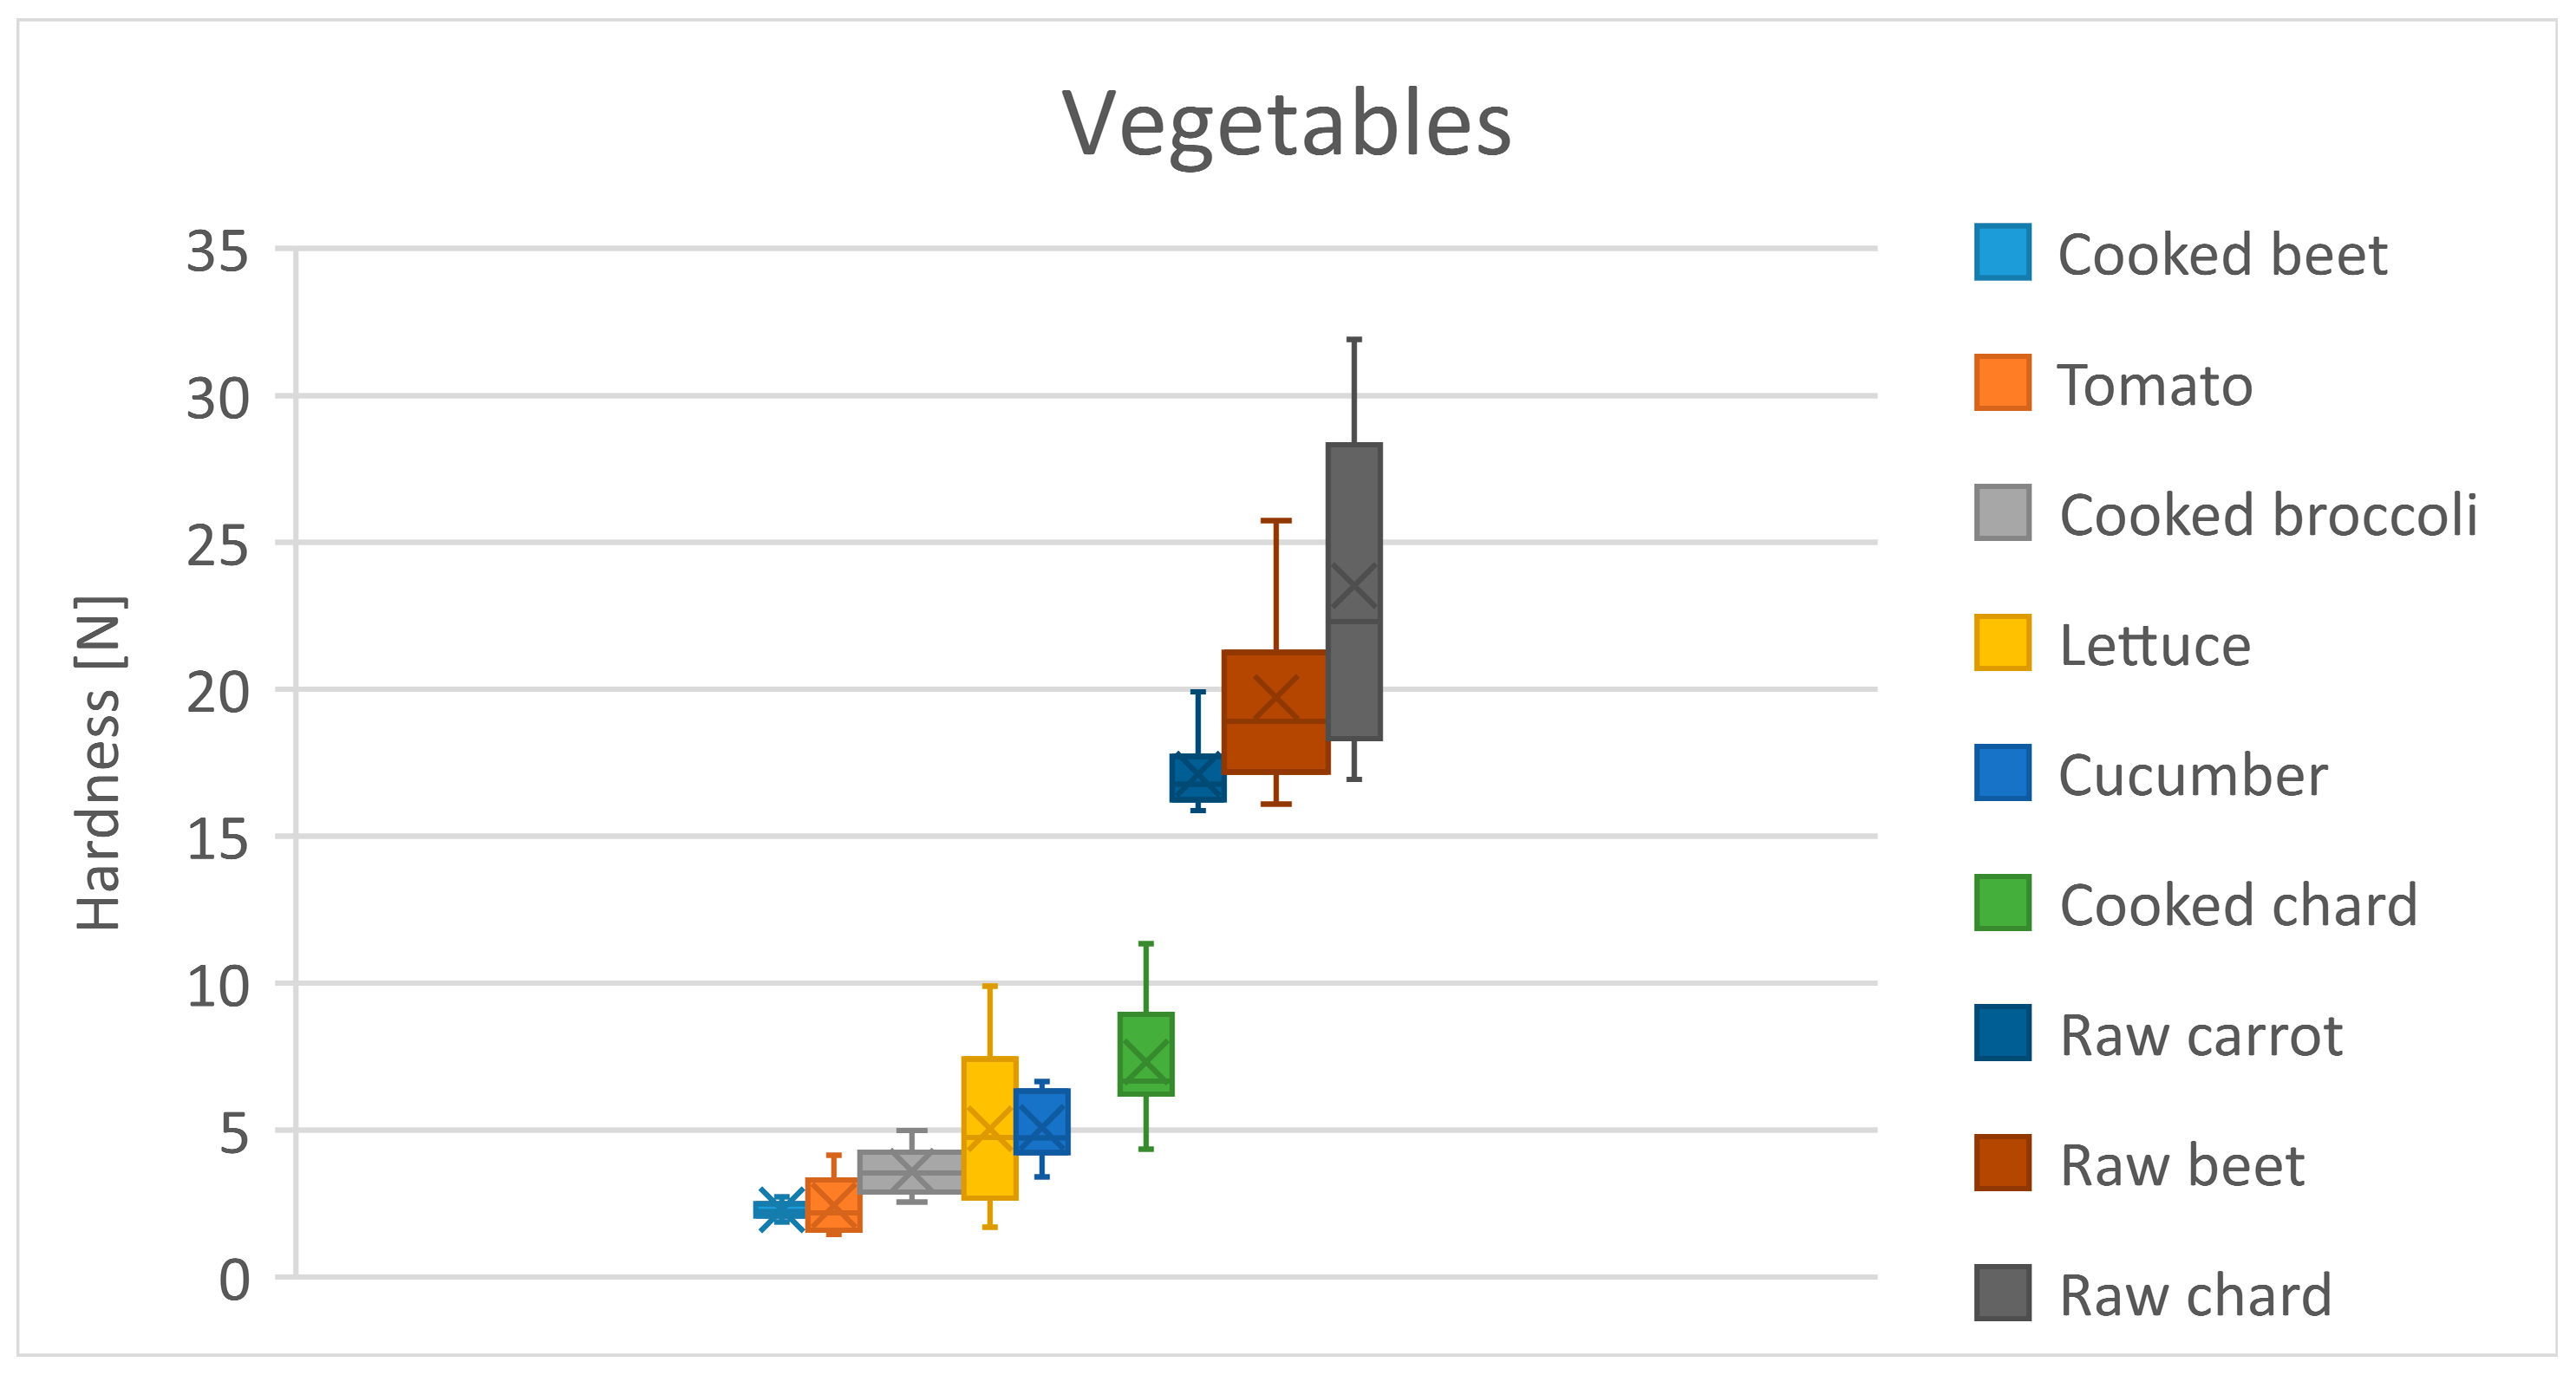
2.2.4. TPA on Vegetables

There are 9 different products in the vegetables group: cooked beet (Beta vulgaris), tomato (Solanum lycopersicum), cooked broccoli (Brassica oleracea var. italica), lettuce (Lactuca sativa L.), cucumber (Cucumis sativus L.), cooked chard, (Beta vulgaris var. cicla), and raw carrot (Daucus carota). Testing and cooking conditions are provided in Table 5.
Leaf vegetable samples were prepared based on the work of Liu et al. [52]. Cucumber and carrots were cut in the middle of the food, as described in Nyorere et al. [53]. Beet was cut in 4 × 4 × 2 cm cubes. Tomato was cut 2 cm deep from the peel and with a height of 1 cm [54]. Probe selection was according to the manufacturer’s recommendation.

2.2.5. TPA on Cereals and Grains

There were 8 foods in this group: oatmeal and milk, fusilli noodles, whole-wheat sliced bread, whole-wheat sliced bread with seeds, cooked quinoa, whole-grain rice, (Miraflores, Carozzi S.A., Santiago, Chile), couscous (Carozzi, Empresa Carozzi S.A., Santiago, Chile), and fresh, cooked husked wheatberries. Testing and cooking conditions are provided in Table 6.
Four oatmeal teaspoons were mixed with 200 mL of milk for one hour. Fusilli noodles were boiled for 10 min.
The oatmeal was tested using a beaker filled with 40 mL, reaching a height of 4 cm, using TA4-1000 probe (38.1 mm Ø) for liquid foods as ricotta and yogurt.
The bread was cut into pieces 2 cm in height and tested with a 36 mm diameter cylindric probe [55]. Fusilli noodles, cooked quinoa, whole-grain rice, couscous, and husked wheatberries were tested in the same way but, owing their nature, were contained in an Ottawa cell (447 mL) until reaching a height of 2 cm.

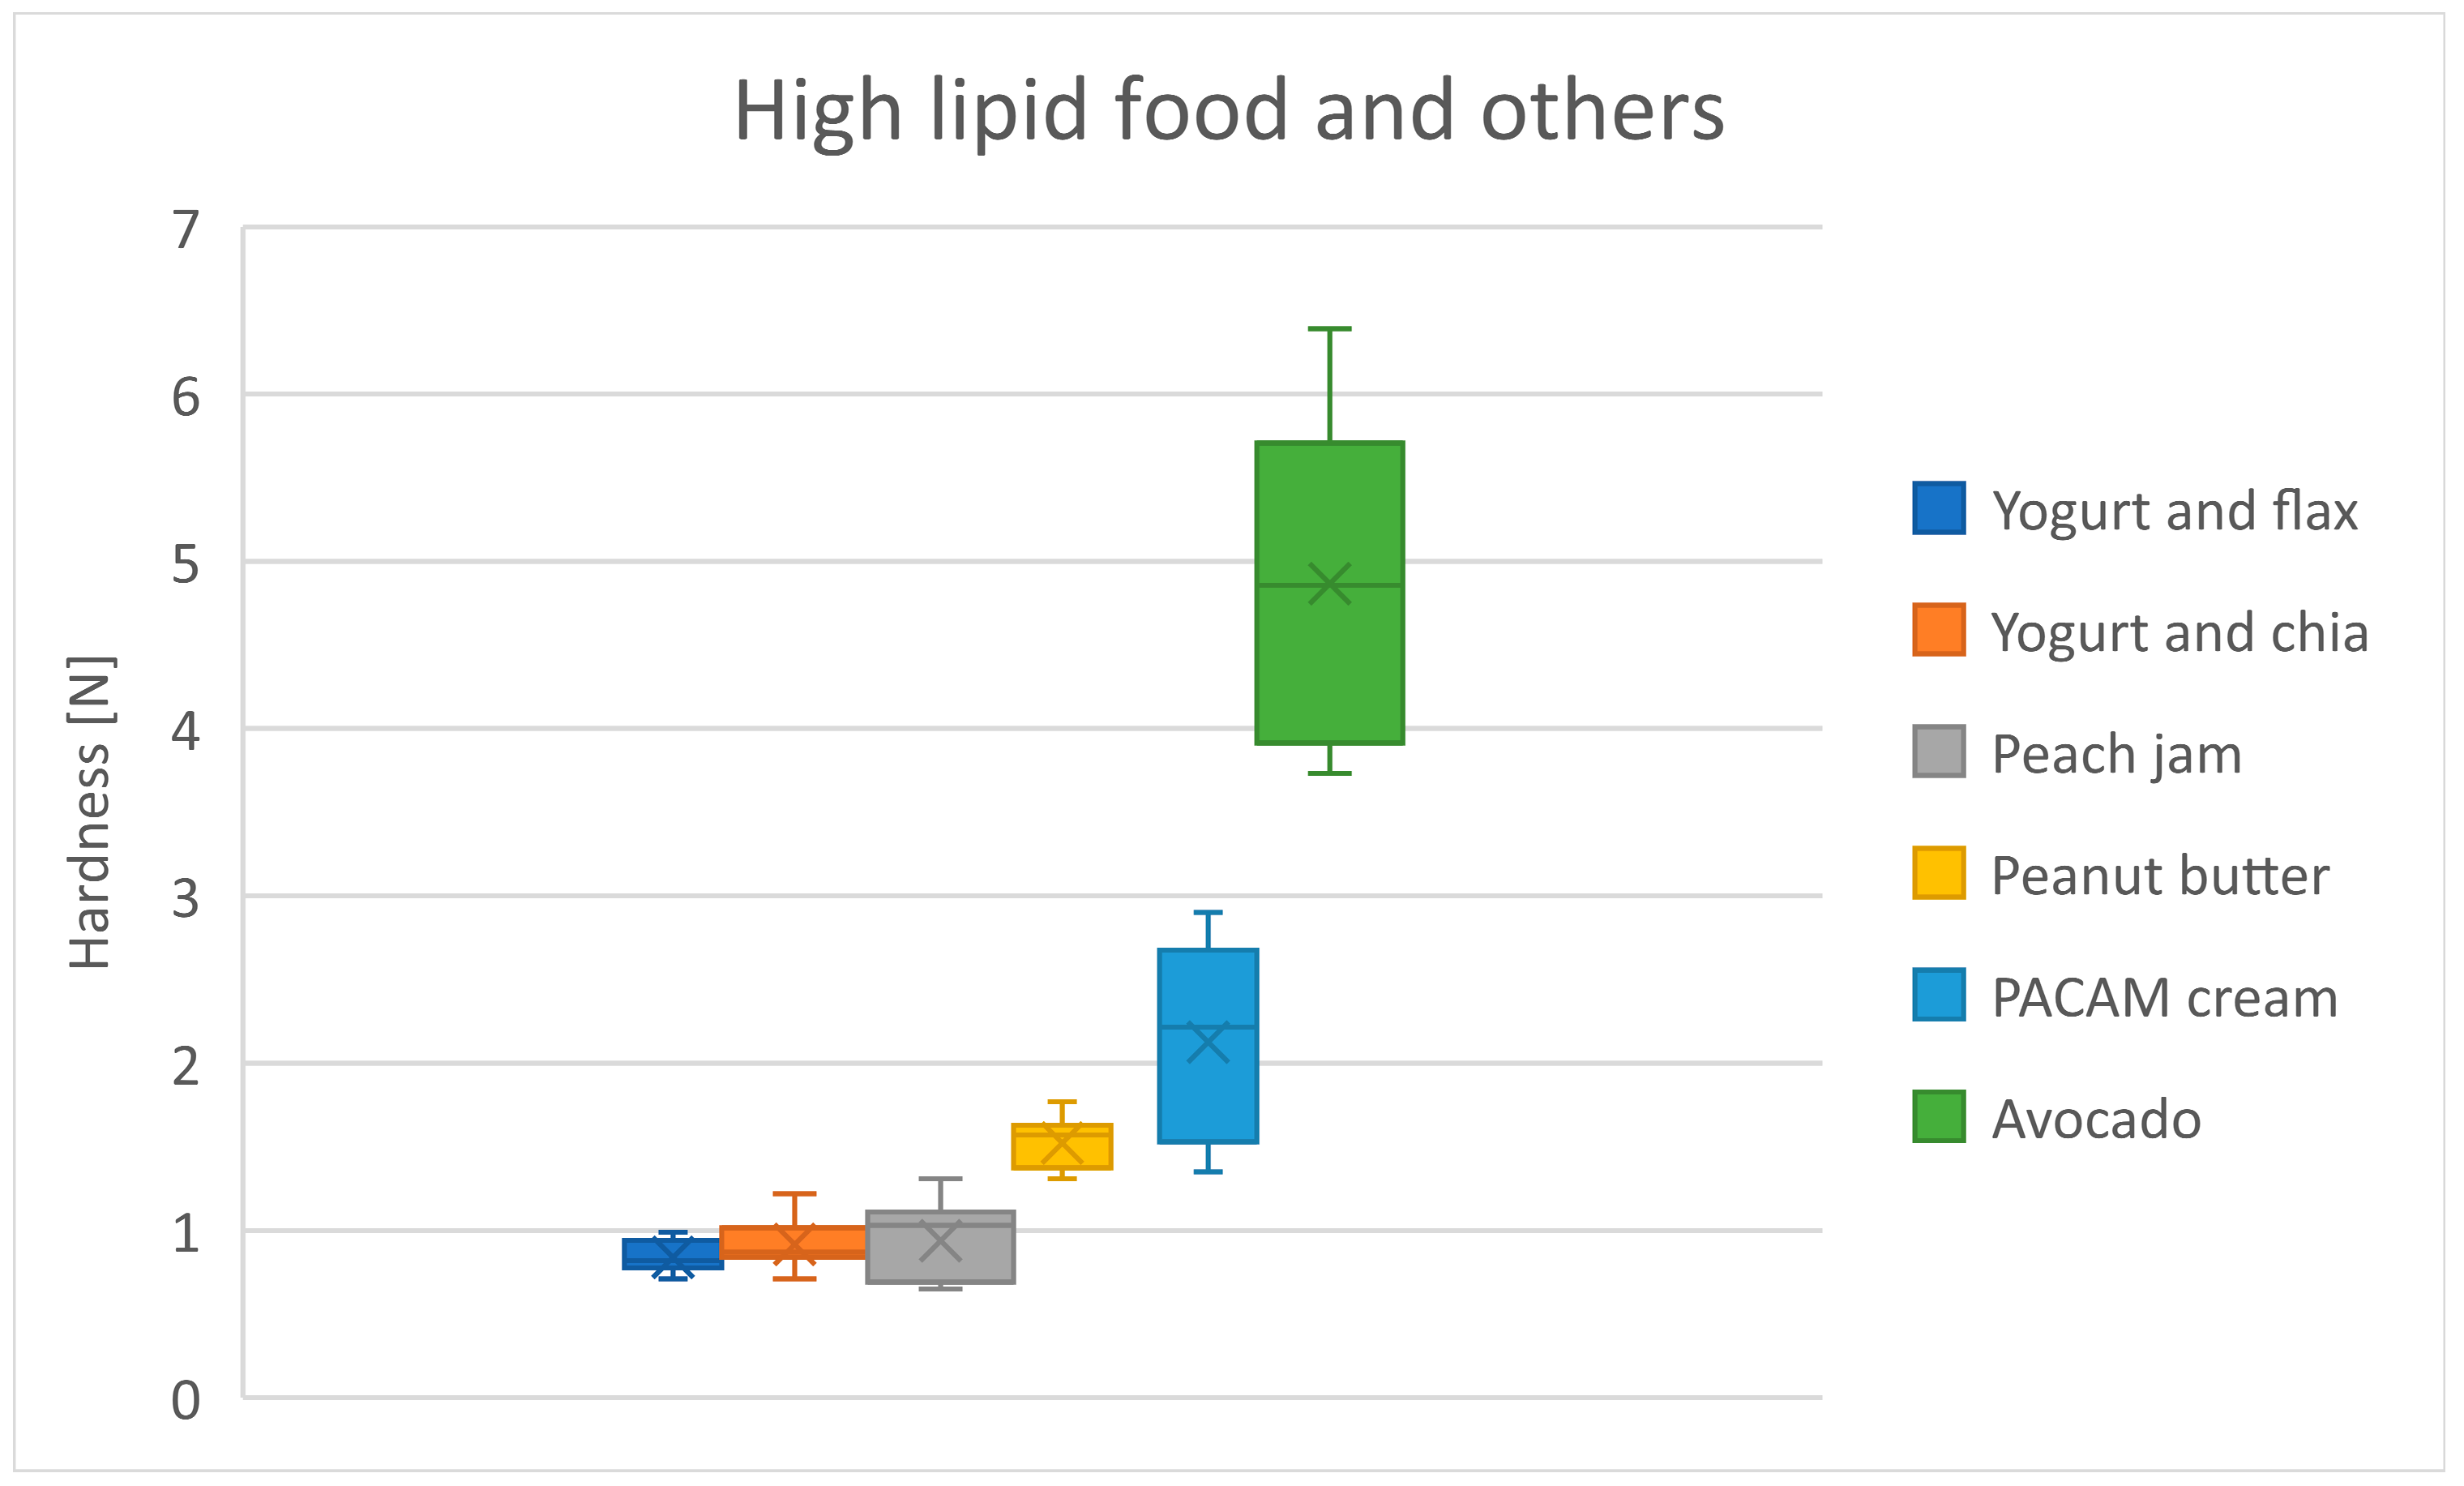
2.2.6. TPA on High Lipid Food and Others

This group consisted of 6 foods: yogurt and flax, yogurt and chia, peach jam (Vivo, Empresa Carozzi S.A., Santiago, Chile), peanut butter (Manì King, Córdoba, Argentina), PACAM (Programa de Alimentación Complementaria del Adulto Mayor) cream, and avocado. For yogurt preparations, 600 mL of strawberry light without lactose yogurt (Cloun, La Uniòn, Chile), 12 g of flax, and 15 g of chia were used. PACAM cream was prepared according to package instructions. Testing and cooking conditions are provided in Table 7.
Semisolid samples were tested according to Ismail et al. [49] and manufacturer recommendations.

2.2.7. TPA on Vegetal Protein

In the case of vegetal protein, this group comprised pulse foods: 4 mm and 5 mm diameter lentils (Lens culinaris), white beans (Phaseolus vulgaris), chickpeas (Cicer arietinum), and split peas (Pisum sativum). Testing and cooking conditions are provided in Table 8.
Legumes samples were tested according to Bragança et al. [56] and manufacturer recommendations.

2.3. Statistical Analysis

The present study is framed within the design of a balanced diet for patients. This is why the aim is to classify foods from different food groups. The statistical analyses conducted are aligned with this objective. The Shapiro–Wilk normality test was performed for each group. ANOVA and Tukey analyses were carried out to establish the presence of a significant difference within the groups and between each food when the samples showed a normal distribution. For non-normal samples, Kruskal–Wallis and Dwass–Steel–Critchlow–Fligner (DSCF) pairwise comparisons were used to analyze presence of a difference. Significant differences were judged at a level of p < 0.05. Jamovi 2.3.28 version was used. Comparisons between groups were not performed.

3. Results

All groups present a wide range of hardness. Kiwi, red apple, oatmeal and milk, and raw beet presented non-normal behavior (p > 0.05). All groups present significant differences (p < 0.05) according to ANOVA and Kruskal–Wallis (Table 9).

3.1. Dairy Group

Table 10 shows the mean hardness differences in the dairy group. Dairy products present a slowly growing trend (Figure 2), from ricotta to buttery cheese, to chanco cheese, where the hardness increases significantly. Yogurt and soft unsalted cheese are the softest foods, as expected since they are semi-solid (Table 10).

3.2. Animal Protein

Table 11 shows the mean hardness differences in the animal protein group. A similar trend is observed until reaching beef, where the hardness increases significantly (Figure 3). Poultry meat, turkey breast, and chicken thigh have similar values. Eggs and jack mackerel cluster together at the lower hardness (Table 11).

3.3. Fruits

Table 12 shows the mean hardness differences in the fruit group. Orange and kiwi are grouped as the least hard foods, which can be explained by the water content in these foods (Table 12). There is a trend of increasing hardness in the foods, with apple standing out in hardness compared to the others (Figure 4).

3.4. Vegetables

Table 13 shows the mean hardness differences in the vegetables group. In the vegetable group, raw vegetables exhibit greater hardness, not only compared to cooked ones, but also differ from the other vegetables by having a higher hardness (Table 13). Raw beetroot has hardness that is ten times greater than cooked beetroot. An increasing trend is observed in both the raw and cooked vegetable (Figure 5).

3.5. Cereals and Grains

Table 14 shows the mean hardness differences in the cereals and grains group. In this group, husked wheat berries are the hardest food, despite being the one that was cooked for the longest time (Figure 6). Couscous, cooked quinoa, and rice are grouped together and do not present significant differences despite the differences in cooking time. Oatmeal and milk is the softest food, which is consistent with the fact that it is the only semi-solid food in the group (Table 14).

3.6. High Lipid Foods and Others

Table 15 shows the mean hardness differences in high lipid foods and others group. There is consistent hardness up to the peach jam, followed by a steady increase in hardness from peanut butter to avocado (Figure 7). Avocado is the hardest food, which is expected since it is the only solid food in the group. The hardness of the PACAM cream can be explained by the proportions used in its preparation (Table 14).

3.7. Vegetal Protein

Table 16 shows the mean hardness differences in the vegetal protein group. A constant rise in hardness is observed (Figure 8). Despite that lentil was cooked for 20 min and the other foods were cooked for 30 min, lentils are the softest food (Table 16).

4. Discussion

4.1. Food Hardness Ranking

The results from the dairy group can be explained by the protein content of the different cheese (Table 10). Młynek et al. [57] and Joshi et al. [58] found a positive correlation between the protein content and the hardness of the cheese. Chanco cheese, buttery cheese, and soft unsalted cheese present 24%, 22.5%, and 12% of the protein content, respectively. The results for animal protein (Table 11) are influenced by various factors. Masticability in meats is influenced by several key factors, including collagen content, meat texture, and preparation methods. Intramuscular collagen, particularly its cross-links, significantly affects meat tenderness; older cattle tend to have higher collagen levels, which correlates with increased toughness [59]. The initial texture of meat directly impacts masticatory variables, with tougher meats requiring more chewing and resulting in harder bolus characteristics [60]. In the fruit group, the results can be explained by the moisture content of each fruit. An inverse correlation has been observed between the moisture content and the fruit hardness measured by TPA [61,62]. According to the U.S. Department of Agriculture, moisture content in kiwi, orange, banana, and apple is 84%, 87%, 76%, and 85% respectively. In the cereals and grains group, cooked quinoa foods, integral rice, and couscous were among the hardest foods of its group (Table 14). This may be explained by their granulated form, which tends to compact under pressure. Quinoa exhibits superior compressive strength, attributed to its unique seed structure and higher protein content, which contributes to its resilience under stress and their starch composition and gelatinization behavior during cooking. For instance, quinoa exhibits a unique protein and fiber profile that contributes to its firmness and chewiness compared to rice and couscous, which are primarily starch-based and may become softer upon cooking [63]. For the vegetal protein group (Table 16), split pea was the hardest food and 4 mm lentil the softest. The results in this group may be explained by the compaction level of grains under the probe. The mechanical properties of cooked lentils and peas are influenced by several key factors, including cooking time, temperature, and the inherent composition of the legumes. Research indicates that prolonged cooking can lead to a decrease in firmness due to the breakdown of cell walls and starch gelatinization, which affects texture and overall mechanical strength [64]. The moisture content at the start of cooking is another critical factor, as it can alter the cooking dynamics and the resultant texture [65]. Different species exhibit varying mechanical properties post-cooking, influenced by their unique biochemical compositions [66].

4.2. TPA Analysis and Comparison of Results

Comparisons with results from other studies can be difficult, if not impossible, since TPA tests are not a standardized procedure. Furthermore, TPA test results depend on the conditions under which the test was developed. This is a well-known limitation of the TPA analysis [42,67,68,69]. Some researchers have addressed this problem by using the elastic modulus instead of the hardness value derived from TPA analysis [70,71,72]. Nevertheless, there are studies that have conducted texture analysis on various foods, making it possible to analyze the ranking of hardness obtained in other similar investigations.
In their study, Wee et al. [71] subjected 59 foods to TPA analysis. Some of these foods are like those analyzed here, making it possible to compare the relative hardness levels between them. The test conditions were 1 mm/s test speed, 30% strain, and a flat, circular compression plate of 75 mm diameter. Cooking conditions were not specified.
For animal protein, they found the following order in hardness level, from the highest to the lowest: chicken breast, beef, canned salmon, and boiled egg. In our study, the hardness order is beef, chicken breast, jack mackerel, and eggs. The difference in beef and turkey breast can be explained by differences in the cooking conditions. Nelum et al. [60] found that hardness in beef increases with cooking time and temperature. For cereals and grains, Wee found the following order: white rice, udon noodles, white sliced bread, and spaghetti noodles. In this study, the order was integral rice, integral sliced bread, and fusilli noodles. Finally, in vegetable group, Wee found the following order in hardness: raw carrot, tomato, and boiled broccoli. Our study found the following hardness order: raw carrot, boiled broccoli, and tomato. The differences observed in broccoli may be explained by different cooking conditions. This study has a higher speed and lower deformation than those in our study. A higher deformation speed is associated with a lower hardness record while a minor final deformation reports a minor hardness value [67]. No other study was found where several foods were tested by TPA analysis.
Comparisons between research are difficult since the results provided by TPA analysis are extensive variables, which means that the results depend on the mass, or more specifically, the thickness and the area of the sample [42]. Also, the deformation rate and degree of compression modify the results [68]. This may explain why so little research has been conducted on several foods instead of a specific food. On the other hand, not all foods can be treated in the same way and manipulated to obtain a homogeneous sample. Some foods can be cut into a specific form, like beets, potatoes, apples, some types of cheese, bread, etc. Others can be cut, but with an irregular surface, like eggs, meat, orange, and kiwi. Legumes and semi-solids like yogurt are cases where the sample must be contained to be tested.
Standardization of the TPA analysis requires not only fixing the speed and deformation level, but also the sample preparation. This should consider not only a standardized shape, but also which foods allow for such standardization. While cooking conditions influence the texture of the foods, they can be both standardized and adapted to local cuisine or the objectives of the study. An interdisciplinary analysis between materials science and food engineering can guide this process [42].

4.3. Dental Status and Food Selection

Characterization of food can help us understand certain behaviors of people with dental prostheses when selecting foods. In their study, Mercenes et al. [73] compared the perceived difficulty experienced by a group of dentulous patients and those with dentures. They found that patients with prosthesis have greater difficulty chewing foods. Apple was the food that presented the most difficulty for chewing, whereas orange showed no difference between groups. This is consistent with our results, as the apple was the hardest fruit found, while the orange was among the softest fruits. Regarding vegetables, they evaluated tomato, lettuce, and carrot. Carrot and lettuce presented similar difficulties, around 20%, for prosthesis users, while 40% of prosthesis users reported difficulty chewing carrot. This is related to the results of this study, where lettuce and tomato did not show significant differences in hardness, but raw carrot was among the hardest vegetables. Similar findings are reported by Watson et al. [74]. In this context, designing a diet focused on denture wearers is of interest to improve their nutritional condition [75].
These considerations have been taken into account in the present research, and each group was tested under specific conditions according to the relevant bibliography. Since there is no standard for groups or types of foods, adaptations were made to homogenize the test conditions. Additionally, no comparisons between groups were made because of this.

5. Conclusions

The results allowed for distinguishing different grades of hardness. Significant differences were found within each group and between foods. TPA analysis is the typical procedure to analyze food hardness, but several limitations are present in this method, which are well known among researchers. The use of TPA analysis for a diverse group of foods is a rarely explored field reported within the literature and needs to be standardized considering the nature of different foods. The design of standardized protocols could be future research that would fill the gap presented in the use of this test. Using these results together with food hardness as a control variable, it is possible to evaluate chewing in patients.

Author Contributions

Conceptualization, F.P. and J.d.C.S.C.; methodology, F.M.; software, F.M.; validation, M.J.-P., C.V. and F.P.; formal analysis, P.N.; investigation, F.M.; resources, C.V.; data curation, F.M.; writing—original draft preparation, F.M.; writing—review and editing, R.F.; visualization, F.M.; supervision, R.F.; project administration, C.V.; funding acquisition, R.F. All authors have read and agreed to the published version of the manuscript.

Funding

This research was funded by ANID, under the project Fondecyt Regular No. 1230616.

Institutional Review Board Statement

The study was conducted in accordance with the Declaration of Helsinki, and approved by the Institutional Review Board of COMITÉ ÉTICO CIENTÍFICO de la Universidad de la Frontera (Scientific Ethical Committee of Universidad de la Frontera), Ethics Committee Approval number 068/23, 5 May 2023.

Informed Consent Statement

Not applicable.

Data Availability Statement

The data presented in this study are available on request from the corresponding author. The data are not publicly available due to no public database is available.

Acknowledgments

The authors of this work thank ANID for funding this work through the Project Fondecyt Regular No. 1230616.

Conflicts of Interest

The authors declare no conflicts of interest.

References

  1. Diet, Nutrition, and the Prevention of Chronic Diseases: Report of a WHO-FAO Expert Consultation; Joint WHO-FAO Expert Consultation on Diet, Nutrition, and the Prevention of Chronic Diseases, 2002, Geneva, Switzerland; Weltgesundheitsorganisation, FAO, Ed.; WHO Technical Report Series; World Health Organization: Geneva, Switzerland, 2003; ISBN 978-92-4-120916-8.
  2. Iwasaki, M.; Yoshihara, A.; Ogawa, H.; Sato, M.; Muramatsu, K.; Watanabe, R.; Ansai, T.; Miyazaki, H. Longitudinal Association of Dentition Status with Dietary Intake in Japanese Adults Aged 75 to 80 Years. J. Oral Rehabil. 2016, 43, 737–744. [Google Scholar] [CrossRef]
  3. Tsakos, G.; Herrick, K.; Sheiham, A.; Watt, R.G. Edentulism and Fruit and Vegetable Intake in Low-Income Adults. J. Dent. Res. 2010, 89, 462–467. [Google Scholar] [CrossRef] [PubMed]
  4. Gil-Montoya, J.A.; Subirá, C.; Ramón, J.M.; González-Moles, M.A. Oral Health-Related Quality of Life and Nutritional Status. J. Public Health Dent. 2008, 68, 88–93. [Google Scholar] [CrossRef]
  5. Saarela, R.K.T.; Lindroos, E.; Soini, H.; Hiltunen, K.; Muurinen, S.; Suominen, M.H.; Pitkälä, K.H. Dentition, Nutritional Status and Adequacy of Dietary Intake among Older Residents in Assisted Living Facilities. Gerodontology 2016, 33, 225–232. [Google Scholar] [CrossRef] [PubMed]
  6. Nowjack-Raymer, R.E.; Sheiham, A. Association of Edentulism and Diet and Nutrition in US Adults. J. Dent. Res. 2003, 82, 123–126. [Google Scholar] [CrossRef] [PubMed]
  7. Passia, N.; Chaar, M.S.; Krummel, A.; Nagy, A.; Freitag-Wolf, S.; Ali, S.; Kern, M. Influence of the Number of Implants in the Edentulous Mandible on Chewing Efficacy and Oral Health-related Quality of Life—A Within-subject Design Study. Clin. Oral Implant. Res. 2022, 33, 1030–1037. [Google Scholar] [CrossRef]
  8. Mojon, P. Relationship between Oral Health and Nutrition in Very Old People. Age Ageing 1999, 28, 463–468. [Google Scholar] [CrossRef]
  9. Oliveira, T.R.C.D.; Frigerio, M.L.M.A. Association between Nutrition and the Prosthetic Condition in Edentulous Elderly. Gerodontology 2004, 21, 205–208. [Google Scholar] [CrossRef]
  10. Chari, M. The Relationships among Consumption of Fruits, Tooth Loss and Obesity. Community Dent. Health 2018, 35, 148–152. [Google Scholar] [CrossRef]
  11. Nascimento, G.G.; Leite, F.R.M.; Conceição, D.A.; Ferrúa, C.P.; Singh, A.; Demarco, F.F. Is There a Relationship between Obesity and Tooth Loss and Edentulism? A Systematic Review and Meta-analysis. Obes. Rev. 2016, 17, 587–598. [Google Scholar] [CrossRef]
  12. Nanri, H.; Yamada, Y.; Itoi, A.; Yamagata, E.; Watanabe, Y.; Yoshida, T.; Miyake, M.; Date, H.; Ishikawa-Takata, K.; Yoshida, M.; et al. Frequency of Fruit and Vegetable Consumption and the Oral Health-Related Quality of Life among Japanese Elderly: A Cross-Sectional Study from the Kyoto-Kameoka Study. Nutrients 2017, 9, 1362. [Google Scholar] [CrossRef] [PubMed]
  13. Brennan, D.; Singh, K.; Liu, P.; Spencer, A. Fruit and Vegetable Consumption among Older Adults by Tooth Loss and Socio-economic Status. Aust. Dent. J. 2010, 55, 143–149. [Google Scholar] [CrossRef]
  14. Kumari, S.; Khushboo, B.; Arvind, A.; Singh, S.; Ahsan, A.; Singh, C. Assessment of Role of Complete Dentures in Improving the Chewing Efficiency of Edentulous Patients. J. Pharm. Bioall. Sci. 2022, 14, 792. [Google Scholar] [CrossRef] [PubMed]
  15. Bessadet, M.; Nicolas, E.; Sochat, M.; Hennequin, M.; Veyrune, J.-L. Impact of Removable Partial Denture Prosthesis on Chewing Efficiency. J. Appl. Oral Sci. 2013, 21, 392–396. [Google Scholar] [CrossRef] [PubMed]
  16. Taira, K.; Watanabe, Y.; Okada, K.; Kondo, M.; Takeda, M.; Ito, K.; Nakajima, J.; Iwasaki, M.; Itoda, M.; Inohara, K.; et al. Association between Denture Use and Food Form in Older Adults Requiring Long-Term Care: A Multicenter Cross-Sectional Study. J. Prosthodont. Res. 2022, 67, 366–375. [Google Scholar] [CrossRef]
  17. Su, Y.; Yuki, M.; Hirayama, K.; Sato, M.; Han, T. Denture Wearing and Malnutrition Risk Among Community-Dwelling Older Adults. Nutrients 2020, 12, 151. [Google Scholar] [CrossRef]
  18. Budiman, L.; Masulili, C.; Ariani, N. Can Denture Wearing Increase the Nutritional Status in Pre-Elderly and Elderly Patients? Pesqui. Bras. Odontopediatria Clín. Integr. 2020, 20, e5679. [Google Scholar] [CrossRef]
  19. Prakash, N.; Kalavathy, N.; Sridevi, J.; Premnath, K. Nutritional Status Assessment in Complete Denture Wearers. Gerodontology 2012, 29, 224–230. [Google Scholar] [CrossRef] [PubMed]
  20. Natsui, S.; Sato, M.; Yokoyama, T.; Inaba, H.; Kuboyama, N.; Shibuya, K. Effects of Chewing Frequency on Cerebral Blood Flow and Cognitive Function. J. Behav. Brain Sci. 2020, 10, 287–295. [Google Scholar] [CrossRef]
  21. Allen, A.P.; Smith, A.P. Effects of Chewing Gum and Time-on-Task on Alertness and Attention. Nutr. Neurosci. 2012, 15, 176–185. [Google Scholar] [CrossRef]
  22. Smith, A. Effects of Chewing Gum on Cognitive Function, Mood and Physiology in Stressed and Non-Stressed Volunteers. Nutr. Neurosci. 2010, 13, 7–16. [Google Scholar] [CrossRef] [PubMed]
  23. Hirano, Y.; Obata, T.; Kashikura, K.; Nonaka, H.; Tachibana, A.; Ikehira, H.; Onozuka, M. Effects of Chewing in Working Memory Processing. Neurosci. Lett. 2008, 436, 189–192. [Google Scholar] [CrossRef] [PubMed]
  24. Tada, A.; Miura, H. Association between Mastication and Cognitive Status: A Systematic Review. Arch. Gerontol. Geriatr. 2017, 70, 44–53. [Google Scholar] [CrossRef] [PubMed]
  25. Lahoud, T.; Yu, A.Y.; King, S. Masticatory Dysfunction in Older Adults: A Scoping Review. J. Oral Rehabil. 2023, 50, 724–737. [Google Scholar] [CrossRef] [PubMed]
  26. Rakyoo, K.; Vichayanrat, T.; Anunmana, C.; Kriengsinyos, W.; Gaewkhiew, P. Effect of Dentures and Dietary Advice on Protein Intake in Older Thai Adults with Missing Posterior Occluding Teeth. Gerodontology 2023, 40, 382–389. [Google Scholar] [CrossRef]
  27. Komagamine, Y.; Suzuki, H.; Iwaki, M.; Minakuchi, S.; Kanazawa, M. Effect of New Complete Dentures and Simple Dietary Advice on Cognitive Screening Test among Edentulous Older Adults: A Randomized Controlled Trial. J. Clin. Med. 2023, 12, 4709. [Google Scholar] [CrossRef]
  28. Echeverría, G.; Dussaillant, C.; McGee, E.; Urquiaga, I.; Velasco, N.; Rigotti, A. Applying the Mediterranean Diet for Chronic Disease Prevention and Treatment beyond the Mediterranean Basin. In Mediterranean Identities—Environment, Society, Culture; Fuert-Bjelis, B., Ed.; IntechOpenLimited: London, UK, 2017; pp. 401–414. [Google Scholar]
  29. Sikalidis, A.K.; Kelleher, A.H.; Kristo, A.S. Mediterranean Diet. Encyclopedia 2021, 1, 371–387. [Google Scholar] [CrossRef]
  30. Romaguera, D.; Norat, T.; Vergnaud, A.-C.; Mouw, T.; May, A.M.; Agudo, A.; Buckland, G.; Slimani, N.; Rinaldi, S.; Couto, E.; et al. Mediterranean Dietary Patterns and Prospective Weight Change in Participants of the EPIC-PANACEA Project. Am. J. Clin. Nutr. 2010, 92, 912–921. [Google Scholar] [CrossRef]
  31. Steffen, L.M.; Van Horn, L.; Daviglus, M.L.; Zhou, X.; Reis, J.P.; Loria, C.M.; Jacobs, D.R.; Duffey, K.J. A Modified Mediterranean Diet Score Is Associated with a Lower Risk of Incident Metabolic Syndrome over 25 Years among Young Adults: The CARDIA (Coronary Artery Risk Development in Young Adults) Study. Br. J. Nutr. 2014, 112, 1654–1661. [Google Scholar] [CrossRef]
  32. Martínez-González, M.A.; Gea, A.; Ruiz-Canela, M. The Mediterranean Diet and Cardiovascular Health: A Critical Review. Circ. Res. 2019, 124, 779–798. [Google Scholar] [CrossRef]
  33. Sofi, F.; Cesari, F.; Abbate, R.; Gensini, G.F.; Casini, A. Adherence to Mediterranean Diet and Health Status: Meta-Analysis. BMJ 2008, 337, a1344. [Google Scholar] [CrossRef]
  34. Maraki, M.I.; Yannakoulia, M.; Stamelou, M.; Stefanis, L.; Xiromerisiou, G.; Kosmidis, M.H.; Dardiotis, E.; Hadjigeorgiou, G.M.; Sakka, P.; Anastasiou, C.A.; et al. Mediterranean Diet Adherence Is Related to Reduced Probability of Prodromal Parkinson’s Disease. Mov. Disord. 2019, 34, 48–57. [Google Scholar] [CrossRef]
  35. García-Casares, N.; Gallego Fuentes, P.; Barbancho, M.Á.; López-Gigosos, R.; García-Rodríguez, A.; Gutiérrez-Bedmar, M. Alzheimer’s Disease, Mild Cognitive Impairment and Mediterranean Diet. A Systematic Review and Dose-Response Meta-Analysis. J. Clin. Med. 2021, 10, 4642. [Google Scholar] [CrossRef]
  36. Wu, Y.; He, B.; Chen, Q.; Yu, R.; Wu, Y.; Yang, H.; Yu, Y.; Yan, F.; Li, Y.; Chen, F. Association between Mediterranean Diet and Periodontitis among US Adults: The Mediating Roles of Obesity Indicators. J. Periodontal. Res. 2023, 59, 32–41. [Google Scholar] [CrossRef]
  37. Urquiaga, I.; Echeverría, G.; Dussaillant, C.; Rigotti, A. Origen, Componentes y Posibles Mecanismos de Acción de La Dieta Mediterránea. Rev. Méd. Chile 2017, 145, 85–95. [Google Scholar] [CrossRef]
  38. Tonni, I.; Ricciardi, G.; Piancino, M.G.; Stretti, C.; Costantinides, F.; Paganelli, C. The Influence of Food Hardness on the Physiological Parameters of Mastication: A Systematic Review. Arch. Oral Biol. 2020, 120, 104903. [Google Scholar] [CrossRef]
  39. Park, H.S.; Kim, D.; Lee, S.Y.; Park, K. The Effect of Aging on Mastication and Swallowing Parameters According to the Hardness Change of Solid Food. J. Texture Stud. 2017, 48, 362–369. [Google Scholar] [CrossRef]
  40. Laird, M.F. Variation in Human Gape Cycle Kinematics and Occlusal Topography. Am. J Phys Anthr. 2017, 164, 574–585. [Google Scholar] [CrossRef] [PubMed]
  41. Pematilleke, N.; Kaur, M.; Adhikari, B.; Torley, P. Influence of Meat Texture on Oral Processing and Bolus Formation. J. Food Eng. 2020, 283, 110038. [Google Scholar] [CrossRef]
  42. Peleg, M. The Instrumental Texture Profile Analysis Revisited. J. Texture Stud. 2019, 50, 362–368. [Google Scholar] [CrossRef]
  43. Trịnh, K.T.; Glasgow, S. On the Texture Profile Analysis Test. In Proceedings of the Chemeca 2012, Wellington, New Zealand, 23–26 September 2012. [Google Scholar]
  44. Davis, C.; Bryan, J.; Hodgson, J.; Murphy, K. Definition of the Mediterranean Diet; A Literature Review. Nutrients 2015, 7, 9139–9153. [Google Scholar] [CrossRef] [PubMed]
  45. Riquelme, N.; Robert, P.; Arancibia, C. Understanding Older People Perceptions about Desserts Using Word Association and Sorting Task Methodologies. Food Qual. Prefer. 2022, 96, 104423. [Google Scholar] [CrossRef]
  46. Ando, S.; Sakuma, M.; Morimoto, Y.; Arai, H. The Effect of Various Boiling Conditions on Reduction of Phosphorus and Protein in Meat. J. Ren. Nutr. 2015, 25, 504–509. [Google Scholar] [CrossRef]
  47. Arias-Rico, J.; Macías-León, F.J.; Alanís-García, E.; Cruz-Cansino, N.D.S.; Jaramillo-Morales, O.A.; Barrera-Gálvez, R.; Ramírez-Moreno, E. Study of Edible Plants: Effects of Boiling on Nutritional, Antioxidant, and Physicochemical Properties. Foods 2020, 9, 599. [Google Scholar] [CrossRef] [PubMed]
  48. Sasmazer, R.C.; Korukluoglu, M.; Ginoyan, R.V.; Platova, G.I. White Cheese Texture Profile at Different Storage Temperatures. IOP Conf. Ser. Earth Environ. Sci. 2022, 1052, 012061. [Google Scholar] [CrossRef]
  49. Ismail, H.A.; El-Sawah, T.H.; Ayyash, M.; Adhikari, B.; Elkot, W.F. Functionalization of Ricotta Cheese with Powder of Spirulina platensis: Physicochemical, Sensory, and Microbiological Properties. Int. J. Food Prop. 2023, 26, 1968–1983. [Google Scholar] [CrossRef]
  50. Aguirre, M.E.; Owens, C.M.; Miller, R.K.; Alvarado, C.Z. Descriptive Sensory and Instrumental Texture Profile Analysis of Woody Breast in Marinated Chicken. Poult. Sci. 2018, 97, 1456–1461. [Google Scholar] [CrossRef]
  51. Segundo, C.; Román, L.; Gómez, M.; Martínez, M.M. Mechanically Fractionated Flour Isolated from Green Bananas (M. cavendishii Var. Nanica) as a Tool to Increase the Dietary Fiber and Phytochemical Bioactivity of Layer and Sponge Cakes. Food Chem. 2017, 219, 240–248. [Google Scholar] [CrossRef]
  52. Liu, H.; Zhao, H.; Ye, L.; Fan, D.; Wang, Z. Effects of the Combination of Phytic Acid and Vacuum Packaging on Storage Quality of Fresh-Cut Lettuce. Food Sci. Technol. Res. 2022, 28, 45–52. [Google Scholar] [CrossRef]
  53. Nyorere, O. Instrumental Texture Profile Analysis (TPA) of Cucumber Fruit as Influenced by Its Part and Maturity Stage. Am. J. Eng. Technol. Manag. 2018, 3, 54. [Google Scholar] [CrossRef]
  54. Gebregziabher, A.A.; Supriyadi, S.; Indarti, S.; Setyowati, L. Texture Profile and Pectinase Activity in Tomato Fruit (Solanum lycopersicum, Servo F1) at Different Maturity Stages and Storage Temperatures. Plant Trop. 2021, 9, 20–34. [Google Scholar] [CrossRef]
  55. Sert, D.; Mercan, E.; Tongur, A.; Kara, Ü. Production of Bread from Doughs Composed of High-Pressure Homogenisation Treated Flour Slurries: Effects on Physicochemical, Crumb Grain and Textural Characteristics. Food Meas. 2021, 15, 3052–3059. [Google Scholar] [CrossRef]
  56. Bragança, G.; Ávila, B.; Rockenbach, R.; Santos, M.; Alves, G.; Santos, M.D.L.; Bortolini, V.; Monks, J.; Peres, W.; Elias, M. Effects of Different Hydration Treatments on Technological, Physical, Nutritional, and Bioactive Parameters of Lentils. Rev. Chil. Nutr. 2020, 47, 658–668. [Google Scholar] [CrossRef]
  57. Department of Cattle, Sheep Breeding and Milk Evaluation, Siedlce University of Natural Sciences and Humanities, Siedlce, Poland; Department of Cattle Breeding, UTP University of Science and Technology, Bydgoszcz, Poland; Młynek, K.; Oler, A.; Zielińska, K.; Tkaczuk, J.; Zawadzka, W. The Effect of Selected Components of Milk and Ripening Time on the Development of the Hardness and Melting Properties of Cheese. Acta Sci. Pol. Technol. Aliment. 2018, 17, 133–140. [Google Scholar] [CrossRef]
  58. Joshi, N.S.; Jhala, R.P.; Muthukumarappan, K.; Acharya, M.R.; Mistry, V.V. Textural and Rheological Properties of Processed Cheese. Int. J. Food Prop. 2004, 7, 519–530. [Google Scholar] [CrossRef]
  59. Bruce, H.L.; Roy, B.C. Production Factors Affecting the Contribution of Collagen to Beef Toughness. J. Anim. Sci. 2019, 97, 2270–2278. [Google Scholar] [CrossRef]
  60. Pematilleke, N.; Kaur, M.; Adhikari, B.; Torley, P.J. Relationship between Masticatory Variables and Bolus Characteristics of Meat with Different Textures. J. Texture Stud. 2021, 52, 552–560. [Google Scholar] [CrossRef]
  61. Singh, V.; Guizani, N.; Al-Alawi, A.; Claereboudt, M.; Rahman, M.S. Instrumental Texture Profile Analysis (TPA) of Date Fruits as a Function of Its Physico-Chemical Properties. Ind. Crops Prod. 2013, 50, 866–873. [Google Scholar] [CrossRef]
  62. Rahman, M.S.; Al-Farsi, S.A. Instrumental Texture Profile Analysis (TPA) of Date Flesh as a Function of Moisture Content. J. Food Eng. 2005, 66, 505–511. [Google Scholar] [CrossRef]
  63. Abu El-Maaty, E.A. Some Factors Affecting the Mechanical Coating of Quinoa Seeds. J. Soil Sci. Agric. Eng. 2021, 12, 591–596. [Google Scholar] [CrossRef]
  64. Singh, R.; Guerrero, M.; Nickerson, M.T.; Koksel, F. Effects of Extrusion Screw Speed, Feed Moisture Content, and Barrel Temperature on the Physical, Techno-functional, and Microstructural Quality of Texturized Lentil Protein. J. Food Sci. 2024, 89, 2040–2053. [Google Scholar] [CrossRef]
  65. Bargale, P.C.; Irudayaraj, J.; Marquis, B. Some Mechanical Properties and Stress Relaxation Characteristics of Lentils. Agric. Food Sci. 1994, 36, 247–253. [Google Scholar]
  66. Sahu, U.; Prasad, K.; Sahoo, P.; Sahu, B.B. Studies on Engineering Properties of Raw and Roasted Pulses. Int. J. Process. Post Harvest. Technol. 2014, 5, 184–188. [Google Scholar] [CrossRef]
  67. Rosenthal, A.J. Texture profile analysis—How important are the parameters? Parameters in texture profile analysis. J. Texture Stud. 2010, 41, 672–684. [Google Scholar] [CrossRef]
  68. Alvarez, M.; Canet, W.; López, M. Influence of Deformation Rate and Degree of Compression on Textural Parameters of Potato and Apple Tissues in Texture Profile Analysis. Eur. Food Res. Technol. 2002, 215, 13–20. [Google Scholar] [CrossRef]
  69. Nishinari, K.; Fang, Y.; Rosenthal, A. Human Oral Processing and Texture Profile Analysis Parameters: Bridging the Gap between the Sensory Evaluation and the Instrumental Measurements. J. Texture Stud. 2019, 50, 369–380. [Google Scholar] [CrossRef]
  70. Kohyama, K.; Mioche, L.; Martin, J. Chewing patterns of various texture foods studied by electromyography in young and elderly populations. J. Texture Stud. 2002, 33, 269–283. [Google Scholar] [CrossRef]
  71. Wee, M.S.M.; Goh, A.T.; Stieger, M.; Forde, C.G. Correlation of Instrumental Texture Properties from Textural Profile Analysis (TPA) with Eating Behaviours and Macronutrient Composition for a Wide Range of Solid Foods. Food Funct. 2018, 9, 5301–5312. [Google Scholar] [CrossRef]
  72. Di Monaco, R.; Cavella, S.; Masi, P. Predicting sensory cohesiveness, hardness and springiness of solid foods from instrumental measurements. J. Texture Stud. 2008, 39, 129–149. [Google Scholar] [CrossRef]
  73. Marcenes, W.; Steele, J.G.; Sheiham, A.; Walls, A.W.G. The Relationship between Dental Status, Food Selection, Nutrient Intake, Nutritional Status, and Body Mass Index in Older People. Cad. Saúde Pública 2003, 19, 809–815. [Google Scholar] [CrossRef]
  74. Watson, S.; McGowan, L.; McCrum, L.-A.; Cardwell, C.R.; McGuinness, B.; Moore, C.; Woodside, J.V.; McKenna, G. The Impact of Dental Status on Perceived Ability to Eat Certain Foods and Nutrient Intakes in Older Adults: Cross-Sectional Analysis of the UK National Diet and Nutrition Survey 2008–2014. Int. J. Behav. Nutr. Phys. Act. 2019, 16, 43. [Google Scholar] [CrossRef] [PubMed]
  75. Al-Sultani, H.F.F.; Breckons, M.; Field, J.; Thomason, J.M.; Moynihan, P. Development of Patient-centric Eating Advice for Complete Denture Wearers. Gerodontology 2023, 40, 56–73. [Google Scholar] [CrossRef] [PubMed]
Figure 1. CT3 Texture Analyzer.
Foods 13 03061 g001
Figure 2. Distribution of hardness for the dairy products. Dots represent outliers. Crosses represent average.
Foods 13 03061 g002
Figure 3. Distribution of hardness for the animal protein products. Dots represent outliers. Crosses represent average.
Foods 13 03061 g003
Figure 4. Distribution of hardness for the fruit products. Dots represent outliers. Crosses represent average.
Foods 13 03061 g004
Figure 5. Distribution of hardness for the vegetables products. Dots represent outliers. Crosses represent average.
Foods 13 03061 g005
Figure 6. Distribution of hardness for cereals and grains products. Dots represent outliers. Crosses represent average.
Foods 13 03061 g006
Figure 7. Distribution of hardness for high lipid food and other products. Dots represent outliers. Crosses represent average.
Foods 13 03061 g007
Figure 8. Distribution of hardness for vegetal protein products. Dots represent outliers. Crosses represent average.
Foods 13 03061 g008
Table 1. Detailed food groups based on the Mediterranean diet.
DairyAnimal ProteinFruitsVegetablesCereals and GrainsHigh Lipid Food and OthersVegetal Protein
RicottaEggsKiwiCooked beetOatmeal and milkYogurt and flaxLentil 4 mm
YogurtJack MackerelOrangeTomatoFusilli noodlesYogurt and chiaLentil 5 mm
Soft unsalted cheeseChicken thighBananaCooked broccoliWhole-wheat sliced breadPeach jamBeans
Buttery cheeseTurkey breastSweet cucumberLettuceWhole-wheat bread with seedsPeanut butterChickpeas
CucumberCooked quinoaPACAM cream
Chanco cheeseBeefRed appleCooked chardWhole-grain riceAvocadoSplit peas
Raw carrotCouscous
Raw beetsHusked wheatberries
Raw chard
Table 2. Test conditions for the dairy products.
FoodsCooking ProcessCooking Time (min)Size SampleProbe
Buttery cheeseRaw-4 × 4 × 2 cmTA-10 (12.7 mm Ø)
Laminate cheese
Soft unsalted cheese
Chanco cheese
RicottaRaw-Beaker filled with 40 mL, reaching a height of 4 cmTA4-1000 probe (38.1 mm Ø)
Yogurt
Table 3. Testing and cooking conditions for the animal protein products.
FoodsCooking ProcessCooking Time (min)Sample SizeProbe
Canned jack mackerelRaw-4 × 4 × 2 cm height TA-10 (12.7 mm Ø)
White eggsBoiled10
Chicken thighsBoiled30
BeefBoiled50
Turkey breastBaked 180 °C80
Table 4. Test conditions for the fruits.
FoodsCooking ProcessCooking Time (min)Size SampleProbe
Kiwi--4 × 4 × 2 cmMagnes Tylor (3 mm Ø)
Orange2 cm
Banana2 cm
Sweet cucumber2 cm
Red apple4 × 4 × 2 cm
Table 5. Testing and cooking condition for the vegetable products.
FoodsCooking ProcessCooking Time (min)Sample SizeProbe
Raw chardRaw-5 × 5 × 1 cmTA44 (4 mm Ø)
Cooked chardBoiled3
LettuceRaw-
Cooked broccoliBoiled52 cm heightMagnes Tylor (3 mm Ø)
TomatoRaw-
CucumberRaw-
Raw carrotRaw-
Raw beetsRaw-
Cooked beetBoiled25
Table 6. Testing and cooking conditions for cereals and grains.
FoodsCooking ProcessCooking Time (min)Sample SizeProbe
Oatmeal and milk4 teaspoons with 200 mL of milk60 restingBeaker filled with 40 mL, reaching a height of 4 cmTA4-1000 probe (38.1 mm Ø)
Fusilli noodlesBoiled10Ottawa cell (447 mL) filled until reaching a height of 2 cm36 mm Ø
Whole-wheat sliced breadRaw-
Whole-wheat sliced bread with seedsRaw-
Cooked quinoaBoiled5
Whole-grain riceBoiled10
CouscousBoiled5
Husked wheatberriesBoiled30
Table 7. Testing and cooking conditions for the high lipid food and others.
FoodsCooking ProcessCooking Time (min)Sample SizeProbe
Yogurt and flax12 g of flax mixed with 600 mL of yogurt-Beaker filled with 40 mL, reaching a height of 4 cmTA4-1000 probe (38.1 mm Ø)
Yogurt and chia15 g of chi mixed with 600 mL of yogurt
Peach jamRaw
Peanut butterRaw
PACAM creamPackage instructions
AvocadoRaw2 cm heightTA-10 (12.7 mm Ø)
Table 8. Testing and cooking conditions for the vegetal protein products.
FoodsCooking ProcessCooking Time (min)Sample SizeProbe
4 mm LentilBoiled20Ottawa cell (447 mL) filled until reaching a height of 2 cmTA4-1000 probe (38.1 mm Ø)
5 mm Lentil
White beans30
Chickpeas
Split Peas
Table 9. Mean and standard deviation for each food.
GroupFoodMean [N]±SD [N]
DairyRicotta0.60.2
Yogurt0.70.1
Soft unsalted cheese2.70.4
Buttery cheese6.31.2
Chanco cheese27.34.0
Animal ProteinEggs4.41.7
Jack mackerel8.23.7
Chicken thigh17.55.1
Turkey breast19.45.7
Beef47.09.3
FruitsKiwi *0.50.2
Orange0.60.2
Banana0.70.1
Sweet cucumber1.30.2
Red apple *6.10.4
VegetablesCooked beet2.30.3
Tomato2.41.0
Cooked broccoli3.60.8
Lettuce5.02.8
Cucumber5.11.1
Cooked chard7.32.1
Raw carrot17.11.2
Raw beets *19.73.3
Raw chard23.55.6
Cereals and GrainsOatmeal and milk *0.30.1
Fusilli noodles2.20.6
Integral sliced bread5.91.1
Integral sliced bread with seeds7.72.2
Cooked quinoa10.02.2
Integral rice10.42.8
Couscous11.22.7
Husked wheat berries22.26.7
High lipid food and othersYogurt and flax0.80.1
Yogurt and chia0.90.1
Peach jam0.90.2
Peanut butter1.50.2
PACAM cream2.10.6
Avocado4.90.9
Vegetal proteinLentil 4 mm14.93.3
Lentil 5 mm23.06.2
Beans48.114.3
Chickpea76.314.4
Split peas88.124.5
* Indicates non-normality results for the Shapiro–Wilk test (p > 0.05).
Table 10. Mean hardness differences for the dairy products. Results are expressed in newtons.
DairyYogurtSoft Unsalted CheeseButtery CheeseChanco Cheese
Ricotta0.12.15.7 ***26.7 ***
Yogurt-2.05.6 ***26.6 ***
Soft unsalted cheese--3.6 ***24.6 ***
Buttery cheese---21.0 ***
*** p < 0.001.
Table 11. Mean hardness differences for the animal protein. Results are expressed in newtons.
Animal ProteinJack MackerelChicken ThighTurkey BreastBeef
Eggs3.813.1 ***15.1 ***42.6 ***
Jack mackerel-9.3 **11.2 ***38.8 ***
Chicken thigh--1.929.5 ***
Turkey breast---27.5 ***
** p < 0.01, *** p < 0.001.
Table 12. Mean hardness differences of the fruits. Results are expressed in newtons.
FruitsOrangeBananaSweet CucumberRed Apple
Kiwi0.10.2 *0.8 ***5.7 ***
Orange-0.10.7 ***5.6 ***
Banana--0.6 ***5.4 ***
Sweet cucumber---4.9 ***
* p < 0.05, *** p < 0.001.
Table 13. Mean hardness differences for the vegetables. Results are expressed in newtons.
VegetablesTomatoCooked BroccoliLettuceCucumberCooked ChardRaw CarrotRaw BeetRaw Chard
Cooked beet0.21.32.82.85.0 **14.8 ***17.4 *21.3 ***
Tomato-1.22.62.74.9 **14.7 ***17.3 *21.1 ***
Cooked broccoli--1.51.53.72 *13.5 ***16.1 *20.0 ***
Lettuce---0.052.312.1 ***14.7 *18.5 ***
Cucumber----2.212.0 ***14.6 *18.5 ***
Cooked chard-----9.8 ***12.4 *16.2 ***
Raw carrot------2.66.4 ***
Raw beet-------3.8
*p < 0.05, **p < 0.01, ***p < 0.001.
Table 14. Mean hardness differences for the cereals and grains. Results are expressed in newtons.
Cereals and GrainsFusilli NoodlesIntegral Sliced BreadIntegral Sliced Bread with SeedsCooked QuinoaIntegral RiceCouscousHusked Wheat Berries
Oatmeal and milk1.9 **5.6 **7.4 **9.7 **10.1 **11.0 **21.9 **
Fusilli noodles-3.75.5 **7.8 ***8.2 ***9.0 ***20.0 ***
Integral sliced bread--1.84.14.5 *5.3 **16.3 ***
Integral sliced bread with seeds---2.32.73.514.4 ***
Cooked quinoa----0.41.212.2 ***
Integral rice-----0.811.8 ***
Couscous------11.0 ***
* p < 0.05, ** p < 0.01, *** p < 0.001.
Table 15. Mean hardness differences for high lipid food and others. Results are expressed in newtons.
High Lipid Foods and OthersYogurt and ChiaPeach JamPeanut ButterPACAM CreamAvocado
Yogurt and flax0.10.10.7 *1.3 ***4.0 ***
Yogurt and chia-0.00.61.2 ***4.0 ***
Peach jam--0.61.2 ***4.0 ***
Peanut butter---0.63.3 ***
PACAM cream----2.7 ***
* p < 0.05, *** p < 0.001.
Table 16. Mean hardness differences for the vegetal protein. Results are expressed in newtons.
Vegetal ProteinLentil 5 mmBeansChickpeaSplit Peas
Lentil 4 mm8.133.1 ***61.3 ***73.2 ***
Lentil 5 mm-25.0 **53.2 ***65.1 ***
Beans--28.2 ***40.0 ***
Chickpea---12.0
** p < 0.01, *** p < 0.001.
Disclaimer/Publisher’s Note: The statements, opinions and data contained in all publications are solely those of the individual author(s) and contributor(s) and not of MDPI and/or the editor(s). MDPI and/or the editor(s) disclaim responsibility for any injury to people or property resulting from any ideas, methods, instructions or products referred to in the content.

