1. Introduction
Pectic substances are a family of at least eight polysaccharide types, present in the cell wall of all (if not most) higher plants, with complex macromolecular structures that would be made of no less than 17 monosaccharide types [
1]. Pectins are generally viewed as gelling polysaccharides, from miscellaneous plant byproducts, which are mainly composed of α-
d-galactopyranosyluronic acid (α-
d-Gal
pA) residues, partially methyl-esterified at
C-6 position, and some neutral sugars, three of which (α-
l-rhamnopyranose (α-
l-Rha
p), α-
l-arabinofuranose, and β-
d-galactopyranose) are typical monosaccharide residues. Various structural studies, with highly purified enzyme preparations, revealed that the glycosyl residues were not randomly distributed in the pectin macromolecules, but they were rather concentrated in different regions, which gave birth to two main building block copolymers, namely homogalacturonan (HG) and rhamnogalacturonan-I (RG-I). HG is an unbranched 1,4-α-
d-Gal
pA polymer which is partially methyl-esterified at
C-6 position and sometimes acetyl-esterified at
O-2 and/or
O-3 positions. RG-I is a [→4)-α-
d-Gal
pA-(1→2)-α-
l-Rha
p-(1→]
n polymer partly branched with diverse neutral sugar side chains. Common side chains of RG-I are 1,5-α-
l-arabinan, 1,4-β-
d-galactan, and arabinogalactan-I. They may, however, be ramified with more complex polysaccharide moieties, such as arabinogalactan-II and the rather scarce galactoarabinan [
2].
To date, commercial pectins are only produced from citrus (lime, lemon, orange, and grapefruit) peels and apple pomace, two raw materials from the juice industry available in large quantities in western countries [
3,
4]. Their selection for this purpose is accounted for by the fact that dry citrus peel (15%–30%) and apple pomace (10%–15%) are pectin-rich sources. Moreover, acid-extracted citrus and apple pectins are usually characterized by high viscosity-average molecular weights (
Mv: 100–300 kDa), and high GalA (≥65%) and methoxy (8%–12%) contents. These features enable one to prepare good sugar-acid-mediated high methoxy pectin (HMP) gels in the presence of high sugar (especially sucrose) content (55%–65% wt). To manufacture low calorie gelling products, pectins with low methoxy content (<7%), which form Ca
2+-induced gels whether sugar is added or not, are required. This compels the producers of commercial pectins to add to their pectin production processes a step of deesterification of the initially extracted HMP from citrus and apple byproducts. Commercial LMP, with degrees of methoxylation (DM) ≤ 50, are usually produced from HMP (DM > 50) using one of the following methods: chemical (base or acid) treatment at cold temperature (LMP with randomly distributed deesterified GalA units), ammonia treatment (amidated LMP with randomly distributed deesterified GalA units), fungal pectin methylesterase treatment (LMP with non-blockwise distribution of deesterified GalA units), and/or plant pectin methylesterase treatment (LMP with blockwise distribution of deesterified GalA units). This further operation brings about additional cost of production of LMP, especially when enzymatic procedures using highly purified pectin methylesterases are needed for this purpose. Thus, the import of commercial pectins, and particularly LMP, in emerging and developing countries, such as Côte d’Ivoire and neighboring regions (in Africa), to satisfy their demands represents an expensive enterprise with low added values to domestically manufactured pectin-containing gelling products and confections. Therefore, ready-to-eat jams, marmalades, preserves, and various other pectin-containing confections from the western food industry are by far widely preferred to home-made ones by local food firms. As a consequence, most of the few domestic gelling food plants went bankrupt, thereby increasing the jobless mass. To partially solve this serious problem, “new pectin sources” from diverse agrowastes are being searched for.
Cashew plant (
A. occidentale, Anacardiaceae) is mainly cultivated for its fruit nut, commonly known as “cashew nut”, which almond is used as foodstuffs and cosmetic and pharmaceutical ingredients. From an annual production of 6000 tons in 1990 to 300,000–350,000 tons over the 2008/2012 period [
5,
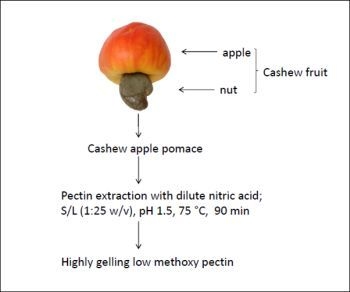
6], Côte d’Ivoire has made a quantum leap, by becoming the second top producer of cashew nuts in the world, closely behind India, which has produced about 400,000 tons. Thus, cashew nut has become the second most important source of incomes, after cotton, for the Ivorian peasant farmers living in the savannah areas. The fruit is composed of two parts: the juicy peduncle (or cashew apple) and the cashew nut. Once the valuable nut has been separated from the apple, the latter, which accounts for 60%–90% of the fruit fresh weight, is usually not consumed, because of its astringent taste [
7], caused by the presence of anacardic acid. The unutilized apple is generally left in plantations to rot, thus posing a serious problem of plant disease inoculum. Therefore, it is necessary to find a way of adding value to it in order to increase returns to farmers and circumvent the ecological problem it causes. We here reported on the purification of “non-chemically and enzymatically-tailored” LMP with high gelling capabilities from cashew apple pomace.
2. Experimental Section
2.1. Alcohol Insoluble Material Preparation
Fresh cashew apple fruits were donated by factory-made producers and sellers of cashew nuts (CAJOUCI, Korhogo, Côte d’Ivoire). Fruits were minced in a Kenwood mincer and immediately soaked in 3 volumes of boiling 80% (v/v) ethanol for 25 min and cooled to room temperature. Alcohol-insoluble material (AIM) was continuously washed with 70% (v/v) ethanol to remove free sugars, pigments, and other impurities as much as possible. The residue was then dried by solvent exchange (95% ethanol and acetone), placed in a fume hood for 5 h for the evaporation of residual acetone and oven-dried for 15–16 h. Dried AIM was ground in a hammer mill (Model 912, Winona Attrition Mill Co., Winona, MN, USA) to pass through a 12 mm-sized sieve and was kept under moisture-free conditions until use.
2.2. Pectin Production
Pectins were extracted from AIM by water acidified with 1 N HNO
3 to three different extractant strengths (pH 1.0, 1.5, and 2.0), while the other extraction parameters, namely, solid to liquid extractant ratio, temperature, and time, were invariably kept to 1:25 (w/v), 75 °C, and 90 min, respectively. Two successive extractions were performed before discarding any remaining insoluble cell wall residue. At the end of each extraction, the slurry was clarified and the pectin extract was rapidly brought to pH 4 for stability. The first and second extracts were pooled and treated with 0.5 M imidazole buffer (pH 7) and extensively dialyzed against distilled water in 12,000 molecular weight cut-off tubing to readily and completely remove Ca
2+-imidazole complexes [
8]. The retentate was then concentrated to the desired solution quantity and precipitated in 3 volumes of 95% ethanol at 5 °C for 2 h. Pectin precipitates were washed two-times with 70% ethanol, followed by 95% ethanol and acetone, and kept for a while under a fume extractor (for residual acetone evaporation), and finally oven-dried at 40–45 °C for 15–16 h and weighed. The extraction of pectins was carried out in three independent runs for each selected pH value. Dried pectin flakes were finely ground to pass through 60-mesh (# 0.25 mm) size sifters and the
A. occidentale pectin (AOP) flours obtained were canned in plastic containers and stored at room temperature under airless and moisture-free conditions pending analysis.
A standardized commercial citrus low methoxy pectin (CCLMP), Genupectin LM12CG (DM = 34%) (Hercules, Copenhagen, Denmark), and its purified (sucrose-free) form (PLM12CG) in our laboratory [
9] were used for comparison purposes.
2.3. Characterization of Pectins
The pectin samples were first treated with a mixture of 1% (v/v) HCl/60% (v/v) ethanol (three times), and insolubles were exhaustively washed with 60% (v/v) ethanol to totally remove free sugars. This treatment indeed aimed at simultaneously removing free sugars and salts and converting all the carboxyl groups of pectin macromolecules to the free acid (-COOH) form, prior to correctly titrating them by 1 N NaOH solution. Pectins were analyzed for their glycosyl residue composition, esterification degree, molecular weight, and gel-forming capability.
2.3.1. Proximate Analyses
The protein content of the pectin extracts was colorimetrically determined at 750 nm by a Folin-phenol reagent assay [
10] using bovin serum albumin standard. Calcium element was analyzed as previously reported [
9], by flame atomic absorption spectrometry at 422.7 nm using an Aanalyst 300 spectrophotometer (Perkin-Elmer Corp., Norwalk, CT, USA).
2.3.2. Analyses of the Glycosyl Residue Composition
To quantify the monosaccharide constituents of the different samples, AIM was hydrolyzed with 1 mol·L
−1 H
2SO
4 (100 °C, 3 h) after pretreatment with 12 mol·L
−1 H
2SO
4 (23 °C, 1 h) and purified pectins were directly hydrolyzed with 1 mol·L
−1 H
2SO
4 (100 °C, 3 h) as previously reported [
11].
The GalA content of AIM and purified pectins was colorimetrically quantified at 525 nm by a modified sulfamate-meta-hydroxydiphenyl assay using monoGalA standard [
12].
The neutral sugars, which were liberated from the purified pectins, especially Gal, Ara, and Rha [
13] were spectrophotometrically quantified at 340 nm using Megazyme assay kits (Megazyme International Ireland Ldt., Bray, Co. Wicklow, Ireland). The neutral sugars assays were based on the quantitative oxidation of Gal/Ara and Rha to corresponding lactonic derivatives (
d-galactono-(1,4)-lactone for α-
l-Ara and β-
d-Gal and
l-rhamno-(1,4)-lactone for α-
l-Rha) in the presence of corresponding dehydrogenases (β-Gal dehydrogenase plus Gal mutarotase for α-
l-Ara and β-
d-Gal, and
l-Rha dehydrogenase for α-
l-Rha) and the coenzyme NAD
+, which is stoichiometrically reduced to NADH with absorbance maximum at 340 nm.
d-Gal was quantitatively differentiated from
l-Ara by reading absorbances at different reaction times, namely after 6 min- and 12 min-reaction at room temperature, respectively.
l-Rha was quantitatively determined after 1 h-reaction at room temperature.
The relative proportion of RG-I to HG block copolymers was roughly estimated by calculating the molar ratio of Rha to GalA and the degree of branching (DBr) of the pectins rhamnosyl residues, with neutral sugars side chains, was estimated by Equation (1) [
9]:
It is indicative, in pectin polymer, of the minimum number of Rha residues branched with Ara and Gal residues, irrespective of the length of Ara and/or Gal residues-containing side chains. Thus, the greater the molar quantity of (Ara + Gal) than Rha, the lower the value of DBr is and the higher the level of branching of the (RG-I domain of) pectin polymer.
The overall esterification degree of pectic samples was potentiometrically determined as previously described [
14]. The acetylesterification degree (DAc) was colorimetrically measured at 510 nm by the hydroxamic acid assay using glucose (Glc) pentaacetate standard [
15] and the DM was calculated by difference. All the measurements were performed in triplicates.
2.3.3. Analysis of the Macromolecular Characteristics of Pectins
The intrinsic viscosities of the samples were determined as described previously [
9]. Briefly, the viscosities (
η) of the samples prepared at different solution concentrations were first estimated by means of capillary viscometric experiments using an Ubbelohde capillary viscometer (capillary No.: I; id: 0.63 mm; Schott-Geräte GmbH, Mainz, Germany) with a constant
K of 0.01, immersed in a water bath thermostated at 25 °C. The solutions of the samples were prepared at seven different concentrations (
C) (0.01, 0.03, 0.05, 0.08, 0.10, 0.15, and 0.20 g/100 mL) in aqueous solvent containing 90 mM sodium chloride, 10 mM sodium fluoride, and 1 mM Na
2EDTA at pH 6.5. The sample solutions and solvent were filtered using 0.45 µm membrane filters (Millipore Corp., Bedford, MA, USA) before measurements. The solutions (15 mL) were pipetted into the capillary viscometer. Flow times were recorded with a stopwatch with a precision of ±0.1 s. The densities of the sample solutions were measured by a 25 mL-Gay-Lussac pycnometer (Boeco, Boeckel & Co. (GmbH & Co.), Hambourg, Germany). The viscosities of the sample solution (
η) and solvent (
ηs) were calculated from the measured flow times and densities of solutions, followed by calculations of the specific viscosities (
ηsp) using Equation (2):
The intrinsic viscosities ([
η]) of the samples were finally estimated by plotting the reduced viscosities (
ηsp/
C)
versus concentration (
C) and extrapolating to zero polysaccharide concentration (Equation (3)):
For each sample analyzed, experiments were carried out five times and the average values were taken for plotting.
The molecular weight of the pectins was analyzed by gel-filtration chromatography on a high resolution Superdex-200 HR 10/30 column (Amersham Biosciences Corp., NJ, USA). The same solvent specified above (90 mM sodium chloride + 10 mM sodium fluoride + 1 mM Na
2EDTA at pH 6.5) was used as eluent and the polysaccharide concentrations in the eluate were monitored using a differential refractometer or refractive index detector (Waters Corp., Milford, MA, USA). A molecular weight kit of pullulan standards (
Mw ~ 6.0, 10.0, 21.7, 48.8, 113.0, 210.0, 393.0, and 805.0 kDa;
Mw /
Mn ~ 1.0–1.2; American Polymer Standards Corp., Mentor, OH, USA) and purified homogenous HG standards (
Mw ~ 60 and 100 kDa,
Mw /
Mn ~ 1.0–1.2) [
16], with known intrinsic viscosity ([
η]) and
Mw values, were used for calibration. To better estimate the
Mv of the pectins, the so-called universal calibration technique was used by plotting log ([
η] ×
Mw)
versus the elution volume of standards. Analyses were done in triplicates.
2.4. Gelling Properties
The gelling capability of pectins was evaluated according to the “adapted SAG-method” of Food Chemical Codex (FCC) to LMP as fully described previously [
9]. The final composition of gels was 1.0% pectin material for AOP (and PLM12CG and 1.4% for LM12CG in order to have similar GalA contents) and 30% sucrose at pH 3.0 and 23.8–31.6 mg Ca
2+/g pectin. The calcium effect was excluded by using the stoichiometric ratio of binding (
R = 2 [Ca
2+]/[-COO
−]), which described the relationship between the molar concentrations of Ca
2+ ions and ionisable carboxyl groups of polygalacturonate on the basis of the pectin de-methylesterification degree (100 − DM) [
14]. Pectin dispersions (1.0%–1.4%), containing calcium ions which concentration was varied according to the
R value and 30% sucrose were prepared as follows:
Briefly, mixtures of weighed amounts of pectin powder and a half amount of sucrose were dissolved in 100 mM sodium chloride solution, under gentle stirring, at room temperature for 15–16 h. The pH of the solutions obtained was fined-tuned to 3.0 using few drops of 0.25 M citric acid or sodium citrate buffer if necessary. The mixtures were then heated to boiling point (85 ± 2 °C) under stirring and an appropriate amount of a pre-heated calcium chloride dihydrate solution, prepared in 100 mM sodium chloride, was slowly added under vigorous stirring until the desired calcium content was reached. To prevent pre-gelation, when adding the calcium ion solution to mixtures containing sucrose, the other half amount of sucrose was dissolved in the amount of CaCl2·2H2O solution to be added. The pH of the mixtures was controlled and kept constant during gelation. The prepared gels were molded and allowed to cool to room temperature, and were finally rested for 24 h at 4 °C before measuring the strength (or firmness) with the help of a Ridgelimeter (Bulmer Food Co., UK). A thin layer of low viscosity paraffin oil was used to cover the exposed surface of the gels in order to minimize weight loss by water evaporation. Experiments were carried out three times for each pectin sample analyzed.
2.5. Statistical Analysis
All the data were statistically appraised by a single-factor analysis of variance (ANOVA), followed by the Bonferroni’s posthoc test for multiple comparisons, whenever applicable, using a GraphPad Prism V.3 software (GraphPad software Inc., San Diego, CA, USA). Means of different treatments were considered to be significantly different at p value < 0.05.

