3.1. Synthesis and Properties of the Electrode Material
A new porous AC material was synthesized by using MF as the precursor and silica nanoparticles as the hard template. We also attempt to apply the same method but using a natural polymeric material precursor, such as corn starch, as an alternative carbon source. The advantage of starch over MF is that we could skip the polymerization process. However, in practice this is a time-consuming process and difficult to apply for the production in large scale with the apparatus available in our lab. The jelly-like SiO
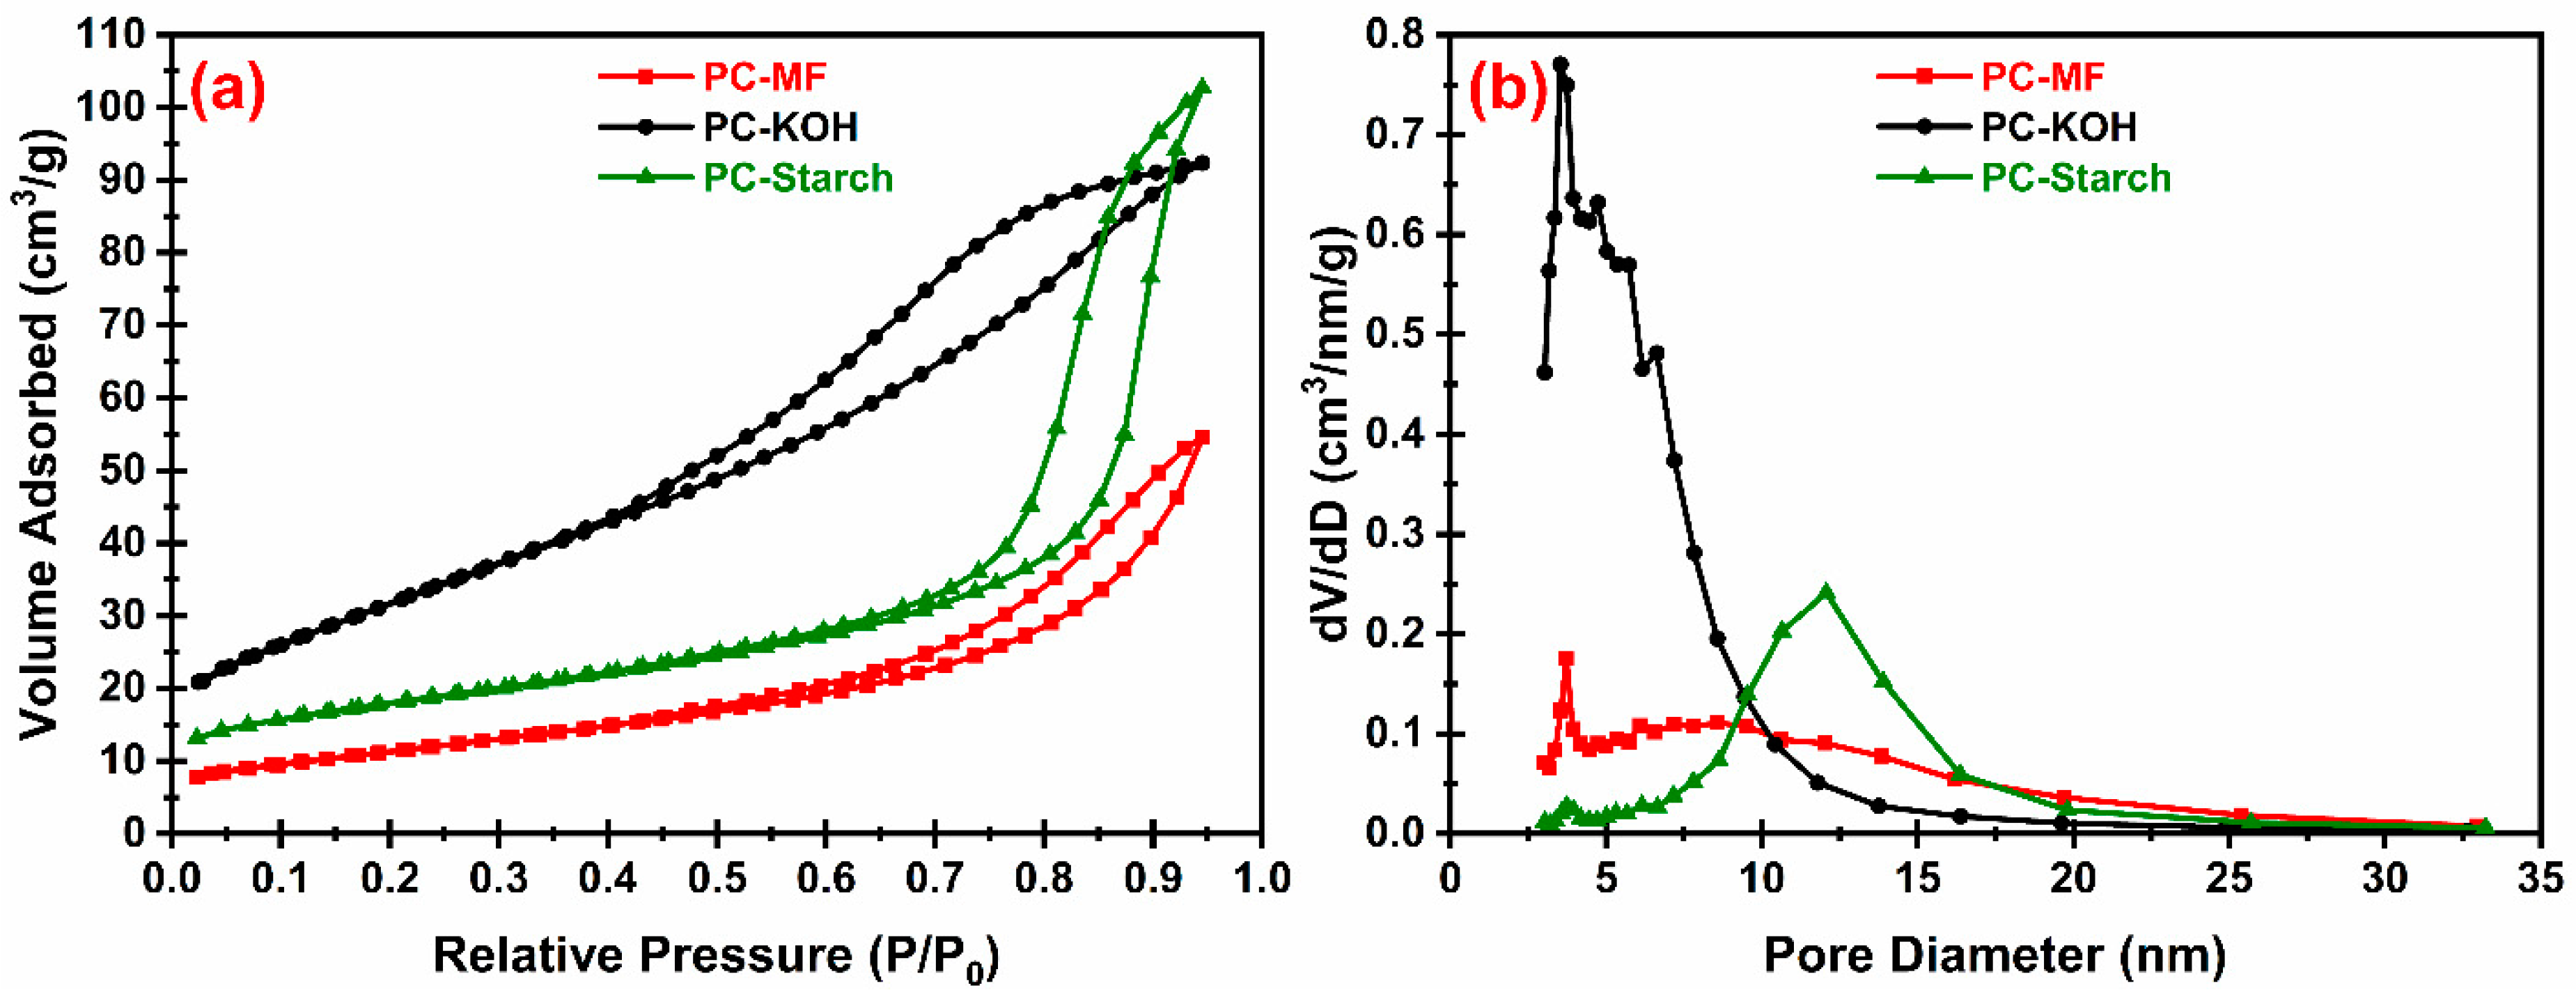
2@starch became a stone-like hard material, which is very difficult to blend with KOH. After calcination and HF etching, the porous AC material derived from MF (PC-MF) and starch (PC-Starch) were characterized by BET. The results are depicted in
Figure 1 and
Table 3. As shown in
Table 3, both porous carbon materials displayed high SSA and excellent pore volume. The carbonization process resulted in high yield for PC-Starch (about two times higher than that of PC-MF). However, PC-MF displayed much higher SSA, while the average pore size of PC-starch is much larger (12.07 nm vs. 3.72 nm), and the size distribution is also narrower.
To further increase SSA, KOH activation was applied to the PC-MF material. The KOH/carbon ratio during activation significantly influences the properties of the carbon material. Lu et al. compared the different activation results by using KOH:carbon ratios of 1:2, 1:4 and 1:5. They showed that much superior SSA and mesoporous pore volume can be obtained when the ratio equals 1:4 [
40]. In the recent past, AC materials with high SSA have been prepared by KOH activation using a variety of carbon precursors, viz., pollen [
41], wood powder [
42] and other biomasses [
43]. The KOH activation process has been reported to give the highest SSA among all reported methods, viz., surface treatment with steam, CO or CO
2, and chemical activation with ZnCl
2, Na
2CO
3 and phosphoric acid. Although the KOH activation has been widely used, the activation mechanism is not well understood. The reaction includes multiple steps and is very complicated. In general, potassium ions are reduced to metallic potassium and carbon is partially oxidized to CO or CO
2, which create pores and voids in the carbon matrix, leading to significant increase in SSA [
44]. Most of these studies used a KOH:carbon ratio of 1:4. It is important to note that ~80% of the mass of carbon is lost during the KOH activation process. On the positive side, it is an excellent method for obtaining very high SSA materials (3293 m
2 g
−1). Remarkably, the pore volume was also increased by ~106%.
The SEM images display the morphology changes of the porous carbon material before and after the KOH activation process (
Figure 2). Clearly, both of them are highly porous materials. However, visually PC-MF is an amorphous structure containing many pores with diameter >50 nm (
Figure 2a,d), but after the KOH activation these pores have collapsed—only diameters <20 nm can be seen in
Figure 3d. We believe that the multilayer structure of KOH activated PC-MF is possibly due to the formation of graphitic carbon (
Figure 2c).
3.2. Electrolyte Formulations
In EDLC devices, an electrolyte not only influences the maximum OPV but also the specific capacitance of the cell. It is very important that the electrolyte be closely matched with the properties of the AC (viz., surface area, pore volume and pore diameter). High surface area allows more absorptions of ions, while pore volume facilitates electrolyte penetration in the AC (solvent reservoir). If the AC possesses more micropores (pore diameter <2 nm), the sizes of cation and anion species and the ion-solvent interaction become relevant [
28]. BF
4− has been the best choice to increase the specific capacitance because of its small size, which permits more anions to accumulate per unit surface area [
28]. Additionally, small ions can penetrate to small pores on the electrode surface [
45]. Most importantly, ILs containing BF
4− usually display higher electrochemical stability and ionic conductivity than other widely used anions, such as TFSI
− and PF
6− [
23,
28]. However, because of their higher lattice energy, typically the solubility of BF
4−-based ILs in organic solvents is comparatively lower, and for the same reason the ionic conductivity of LiBF
4 solution is poor (
Table 1). Mousavi et al. also observed poor wettability of EMIM-BF
4 with the mesoporous carbon model electrodes [
28], leading to poor overall EDLC performance.
Although inorganic cations, such as Li
+ and Na
+, have dimensions that are much smaller than organic cations like TEA
+ or EMIM
+, the kinetics of their adsorption/desorption process is sluggish because of a strong solvation effect. Theoretical simulation and experimental characterization studies have indicated that solvation ion clusters, such as Li
+(EC)
2 or Li
+(EC)
3 complexes are the main cationic species in solutions made of polar organic solvents [
46]. By contrast, in the “soft” organic cations, the charge is effectively distributed/shielded and the interaction with the solvent molecules is much weaker. As shown in
Table 1, TEA-BF
4 in organic solution displayed much higher conductivity than Li
+/Na
+ salt-based formulations. However, the advantage of Li
+/Na
+ is that they have no redox stability concerns.
As mentioned earlier, organic solvents for EDLCs must possess high electrochemical stability. A good solvent system should also offer (a) low viscosity, which typically leads to high ionic conductivity; (b) high donor number, which indicates the ability of a solvent to solvate cations; and (c) high permittivity, which increases the dissociation of the solute cations/anions. Based on this understanding, we prepared several electrolyte formulations listed in
Table 4.
As shown in
Table 2, EC possesses high permittivity and donor number, which means EC can readily dissolve high lattice energy salts and improve ionic conductivity by creating better cation/anion dissociation. Furthermore, previous reports have demonstrated its electrochemical stability window (ESW) of at least ~3.2 V when combined with other carbonate solvents [
34,
47,
48]. However, EC has a melting point slightly higher than room temperature, and comparatively high viscosity; which calls for a “thinner” co-solvent. We decided to use DME instead of most popular low viscosity carbonates (PC/DMC) because of its high donor number, low viscosity, low m.p. and excellent ESW—which could compensate the drawbacks of EC.
The ionic conductivity results met our expectations very well. The properties of solutions #2, #3 and #4 proved that a small proportion of EC could enhance the solubility of EMIM-BF4; while a higher proportion of EC leads to slightly better conductivity. During the preparation of solutions #5, #6 and #7 we noticed that EC facilitates the solubility of TEA-BF4. The electrolyte #11 (which contains 20% EC) showed much higher conductivity than #12 (pure DME), but when the ratio of EC was increased to 50%, the conductivity of #13 dropped, possibly because of the enhancement of solution viscosity. Accordingly, we selected formulations #1, #7, #8, #10, #11 and #12 as the electrolytes for our EDLC experiments.
3.3. Electrochemical Performance
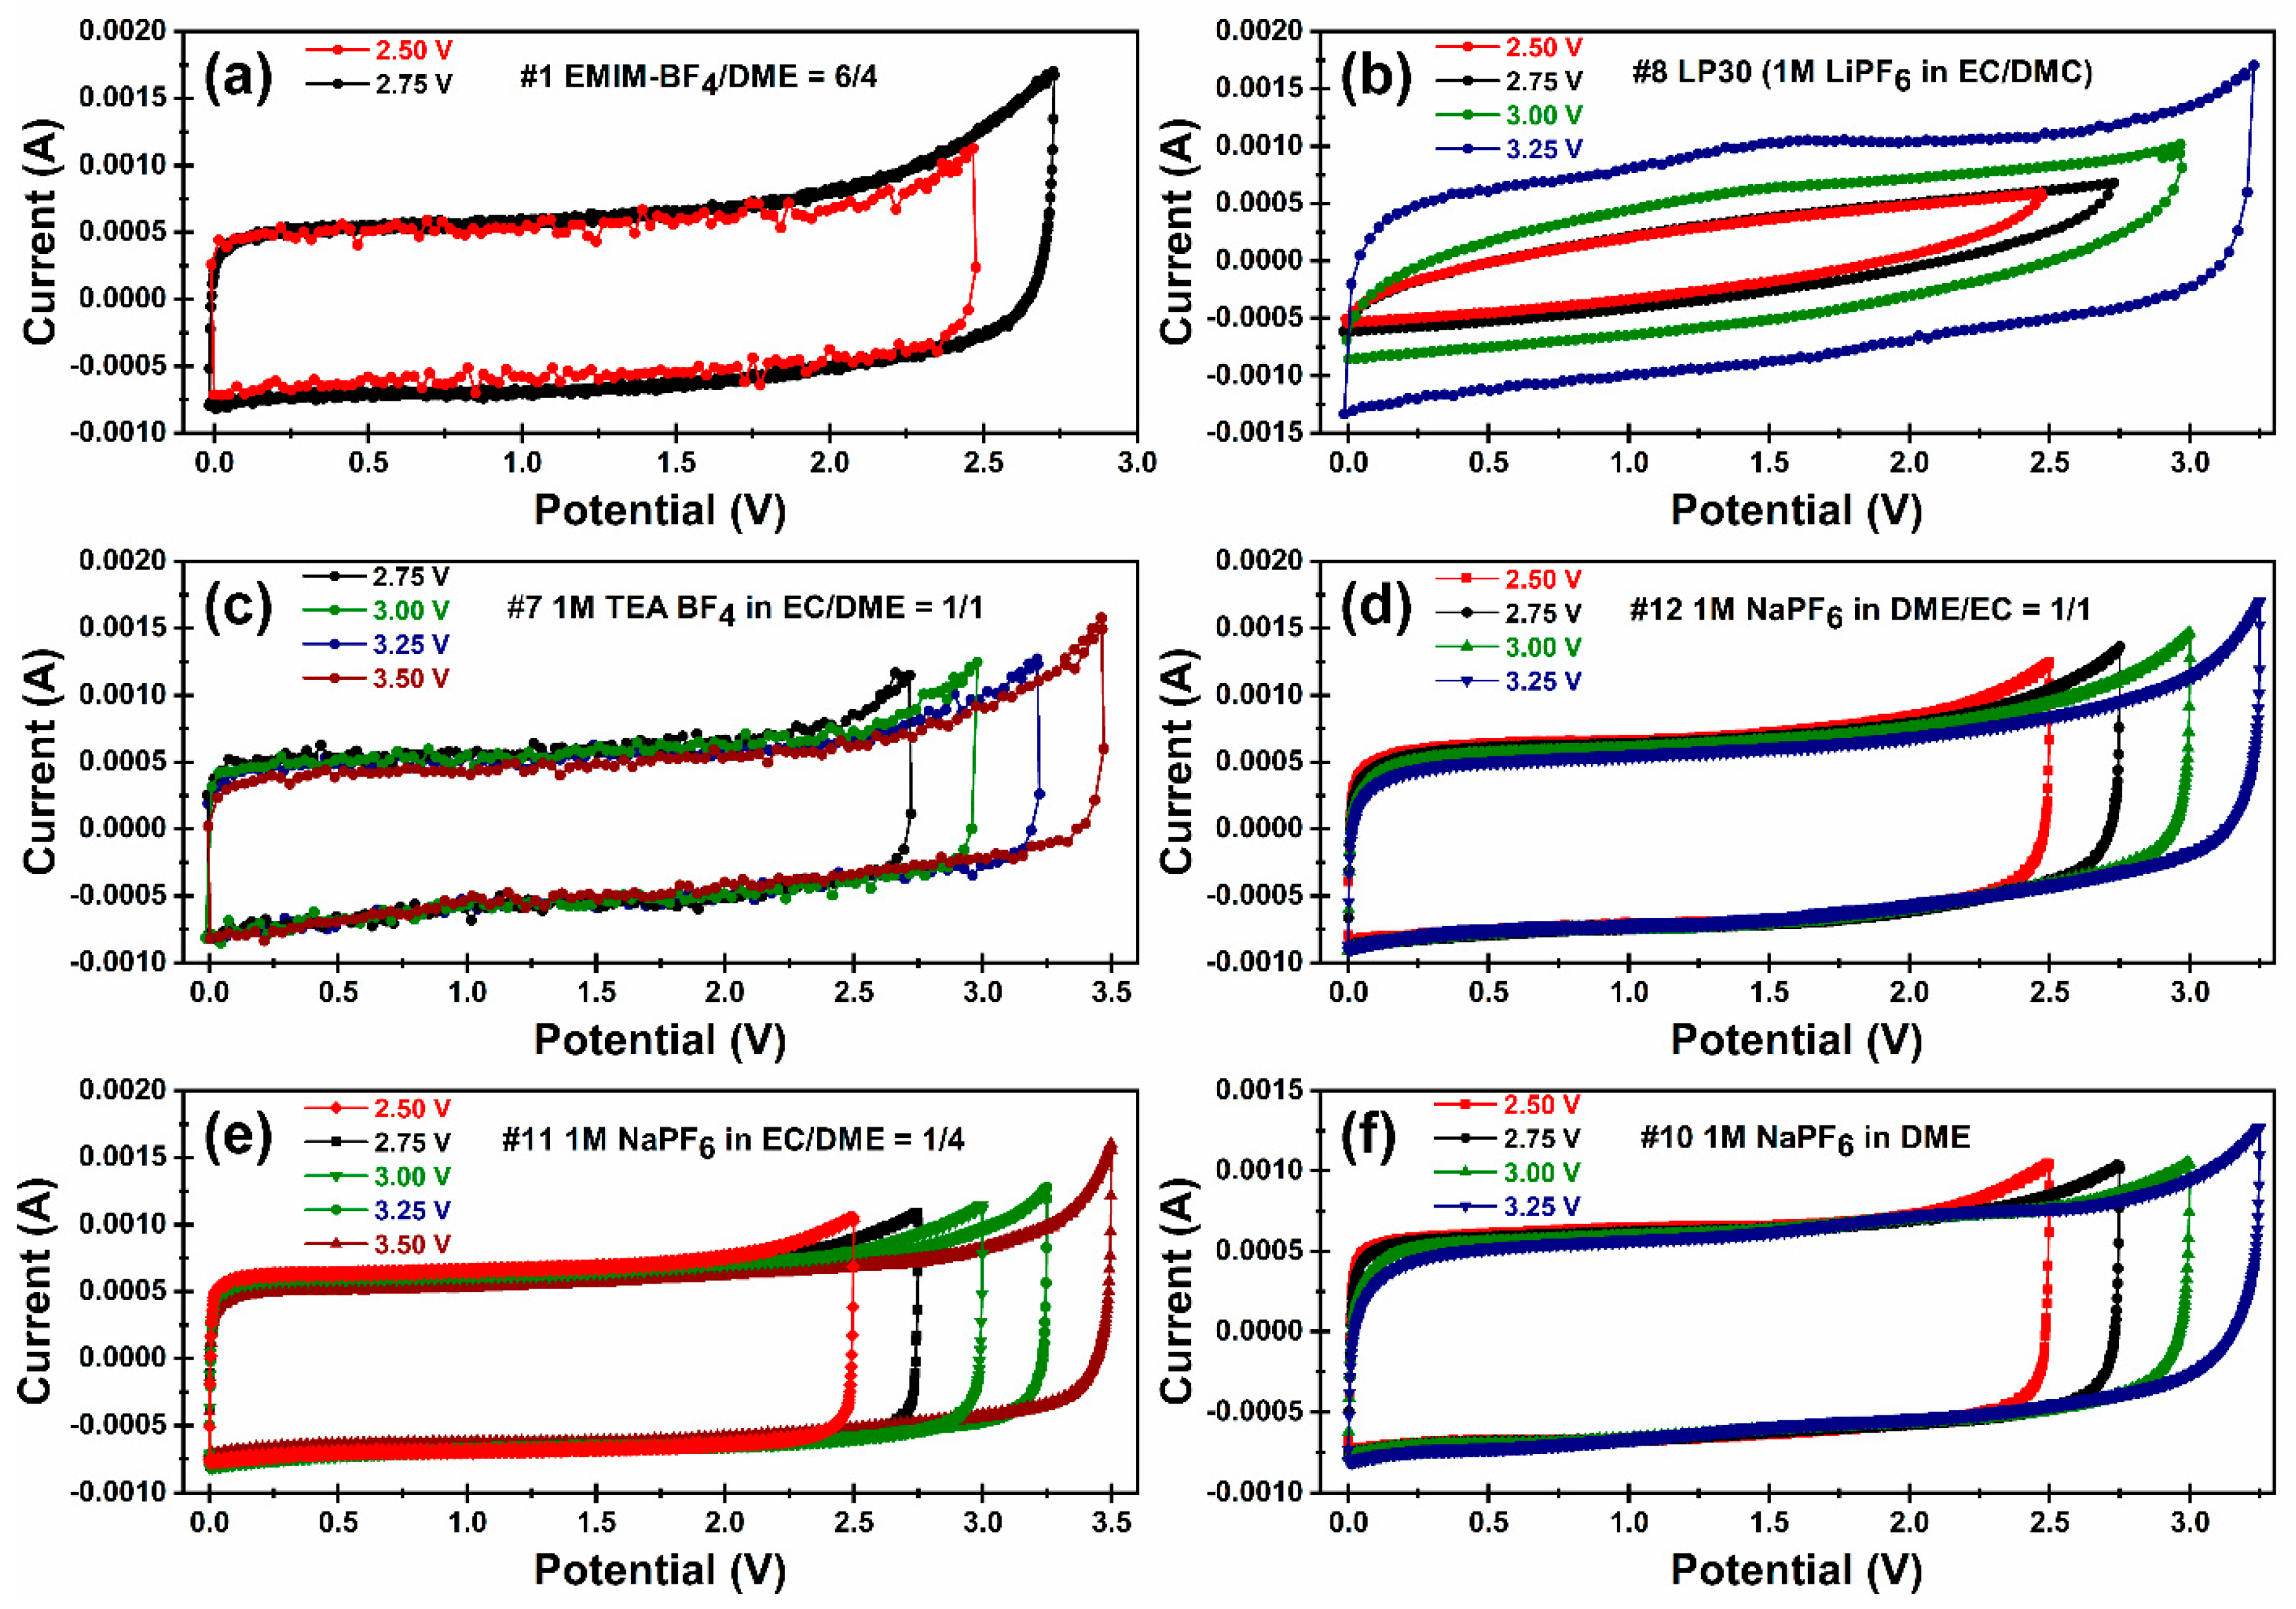
Cyclic voltammetry measurements. The maximum OPV of an EDLC coin cell is best determined by the CV experiment. We started scanning from 0–2.5 V, and then gradually increased the upper limit of OPV, until unwanted redox peaks appeared at the high potential (the “sharp peak”). This is typically due to the oxidation reaction on the anode with concurrent reduction of the electrolyte, and/or the reduction reaction on the cathode with simultaneous oxidation in the electrolyte. This CV study allows us to determine the approximate range of the maximum OPV. The results can be summarized as follows: the maximum OPV was between 2.50–2.75 V for EMIM-BF
4/DME = 6/4 (#1); 3.0–3.25 V for 1M LiPF
6 in EC/DMC = 1/1 (#8); 3.25–3.50 V for TEA-BF
4 in EC/DME (#7); 3.0–3.25 V for 1M NaPF
6 in DME (#10); 3.0–3.25 V for 1M NaPF
6 in DME/EC = 4/1 (#11) and 2.75–3.0 V for 1M NaPF
6 in DME/EC = 1/1 (#12). When scanned at voltage lower than that of maximum OPV, the CV curves were rectangular shape, showing behavior of EDLC system was nearly ideal capacitive. At cell potentials exceeding the maximum OPV, an exponential increase in current density occurs. This may be due to the adsorption of Li
+ and partial charge transfer at negatively charged carbon electrode. The oxidation of surface functionalities at the positively charged carbon electrode cannot be ruled out [
49]. The abnormal bump in
Figure 3b may response to the reduction of trace H
2O present in the electrolyte.
As can be seen from
Figure 3a, the ESW of #1 is much narrower compared to the other formulations. This might be due to poor electrochemical stability of EMIM
+, which possesses an acidic hydrogen atom at 2-position. The electrolyte #7 displayed the best ESW (i.e., high electrochemical stability of both the cation and anion) among all formulations we studied. Several research groups have reported similar electrochemical stability of electrolytes containing BF
4− rather than PF
6− [
50].
By comparing the CV curves for samples #10, #11 and #12 (
Figure 3d–f), we could see the “sharp peaks” appearing at lower voltages when more EC was added. This indicates that a higher ratio of EC lowers the electrochemical stability of the electrolytes. Previous research studies [
23,
28,
50] also observed this behavior and proposed that the H-transfer reaction between fluorinated anions (PF
6−, BF
4− and FSI
−) and carbonate solvents is responsible for marked decrease the oxidative stability.
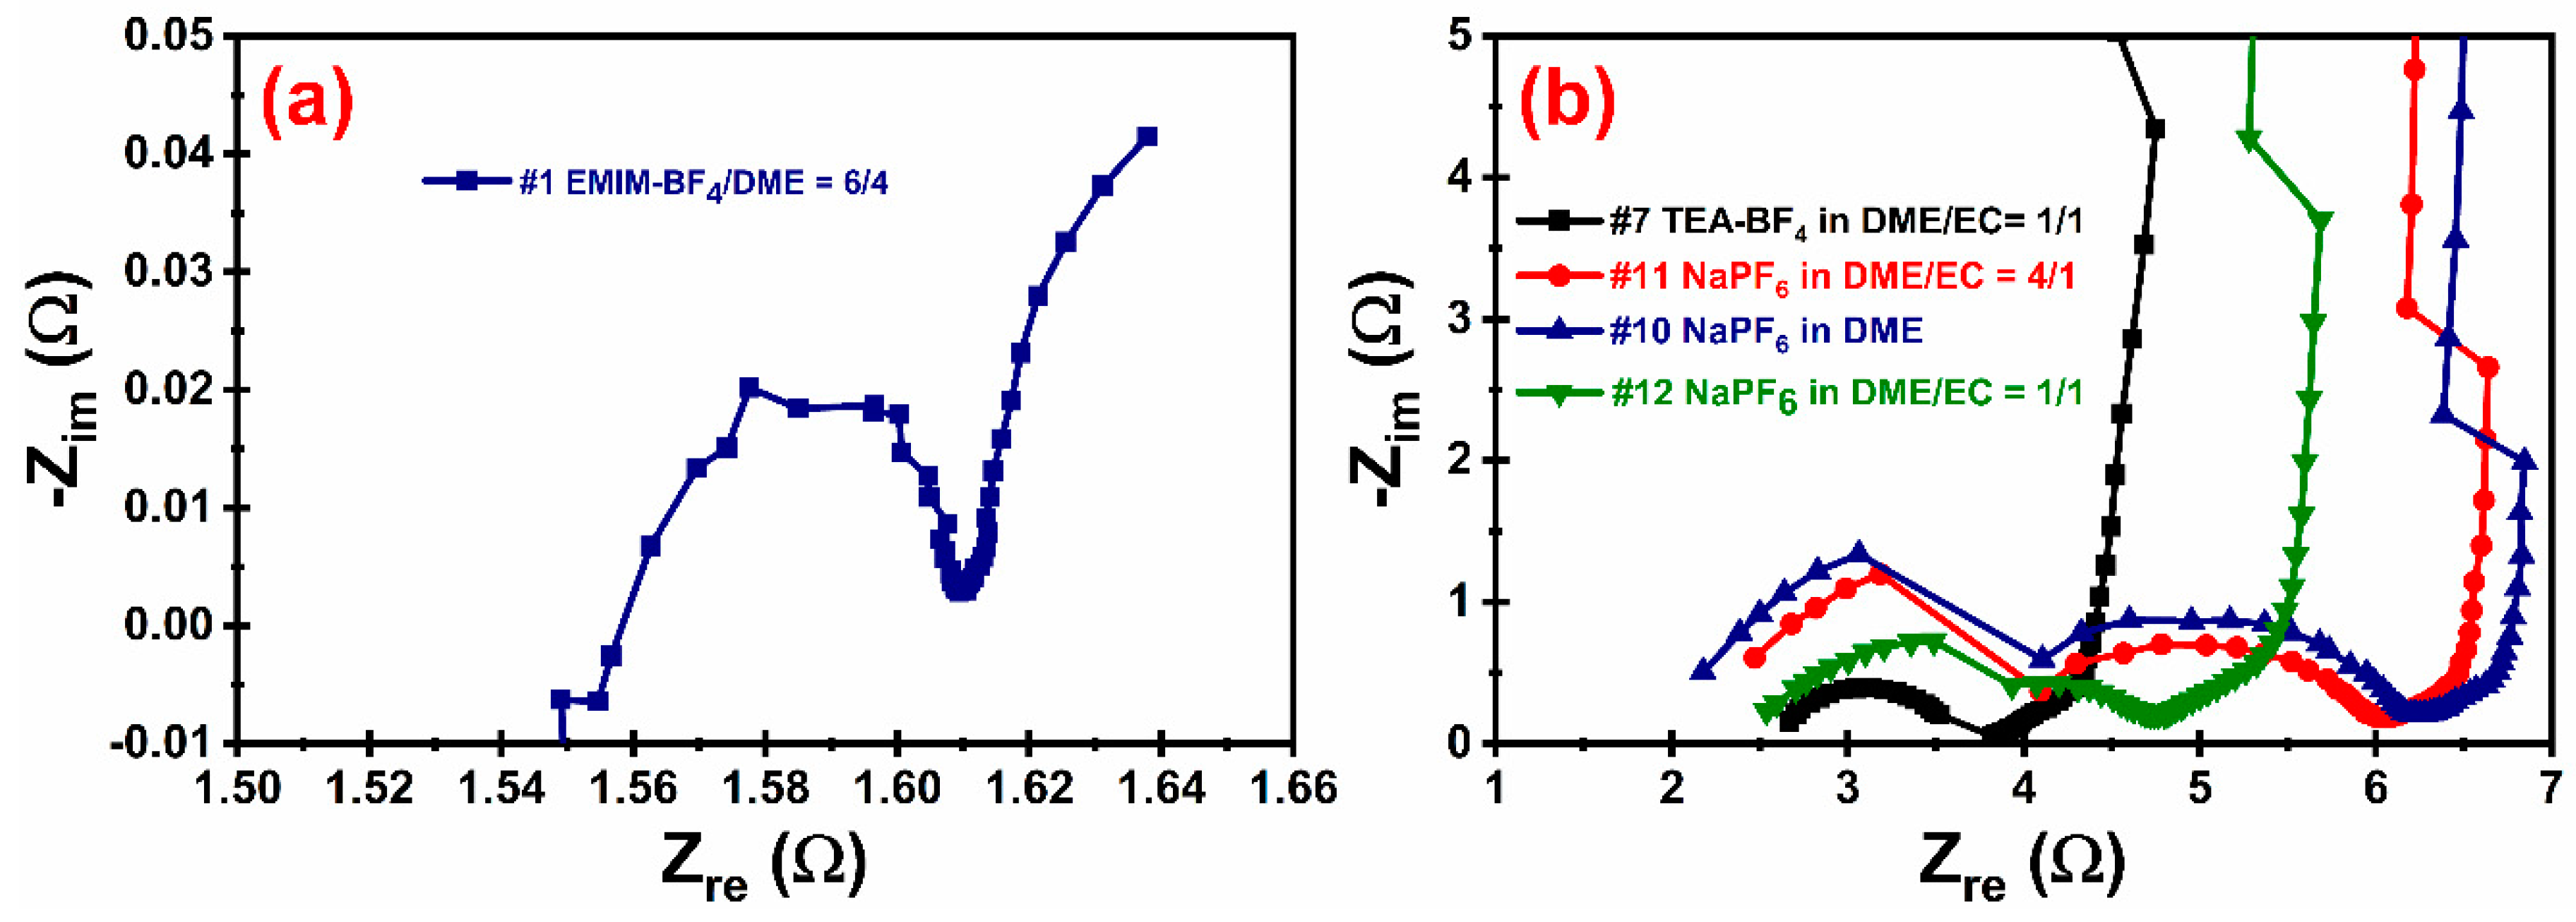
Electrochemical impedance spectroscopy (EIS). The inner resistance of the EDLC cells can be determined from the EIS and the Nyquist plots (
Figure 4). Several confusing and often contradictory explanations to the Nyquist plots of EDLC have been proposed in the literature. We agree with the explanation provided by Mei et al. [
51]. The starting point of a Nyquist plot curve represents the bulk electrolyte resistance
RA; the semicircle at high frequency region represents the so-called charge-transfer resistance
RB (so that the internal resistance equals
RA +
RB); and the vertical line at low frequencies was attributed to the capacitive behavior of the EDLC. According to this theory, the cell with electrolyte #1 displayed the lowest internal resistance (~1.6 Ω) and an extremely small semicircle (
Figure 4a). The cells with electrolytes #7, #10, #11 and #12 have slightly larger internal resistance than #1, and the size of their semicircles are all at the same level (
Figure 4b). When comparing electrolytes #10, #11 and #12, we can see the addition of EC decreased the bulk electrolyte resistance (
RA), which is consistent with our ionic conductivity measurement. However, the diameter of the semicircles (
RB) are much larger, as a result, the internal resistance is even higher, which is possibly caused by the stronger solvation effect, because EC has more polarity than DME. The EIS curve of the electrolyte #7 (1 M TEA-BF
4 in EC/DME = 1/1) shows a much smaller semicircle than the electrolyte #12 (1 M NaPF
6 in EC/DME = 1/1). This can be explained by the better charge-transfer kinetics, possibly caused by the smaller size of BF
4− than PF
6− and lesser solvation effect of TEA
+ than Na
+, so that the transport of ions between electrolyte and the pores on the electrode surface becomes faster. Only one semicircle curve was obtained for the electrolyte #7, while multiple semicircles were observed for electrolytes #10, #11 and #12. This is indicative of different charge-transfer processes of the solvated ions. Other groups have also noticed similar high charge-transfer resistance behavior, indicating a hindrance in transferring charge at the interface [
52,
53,
54]. This may be due to a combination of many factors, viz. (i) poor contact between the active material and current collector, (ii) high ionic resistance of the electrolyte and high intrinsic resistance of the active material and (iii) high resistance of the movement of ions at the electrode/electrolyte interface.
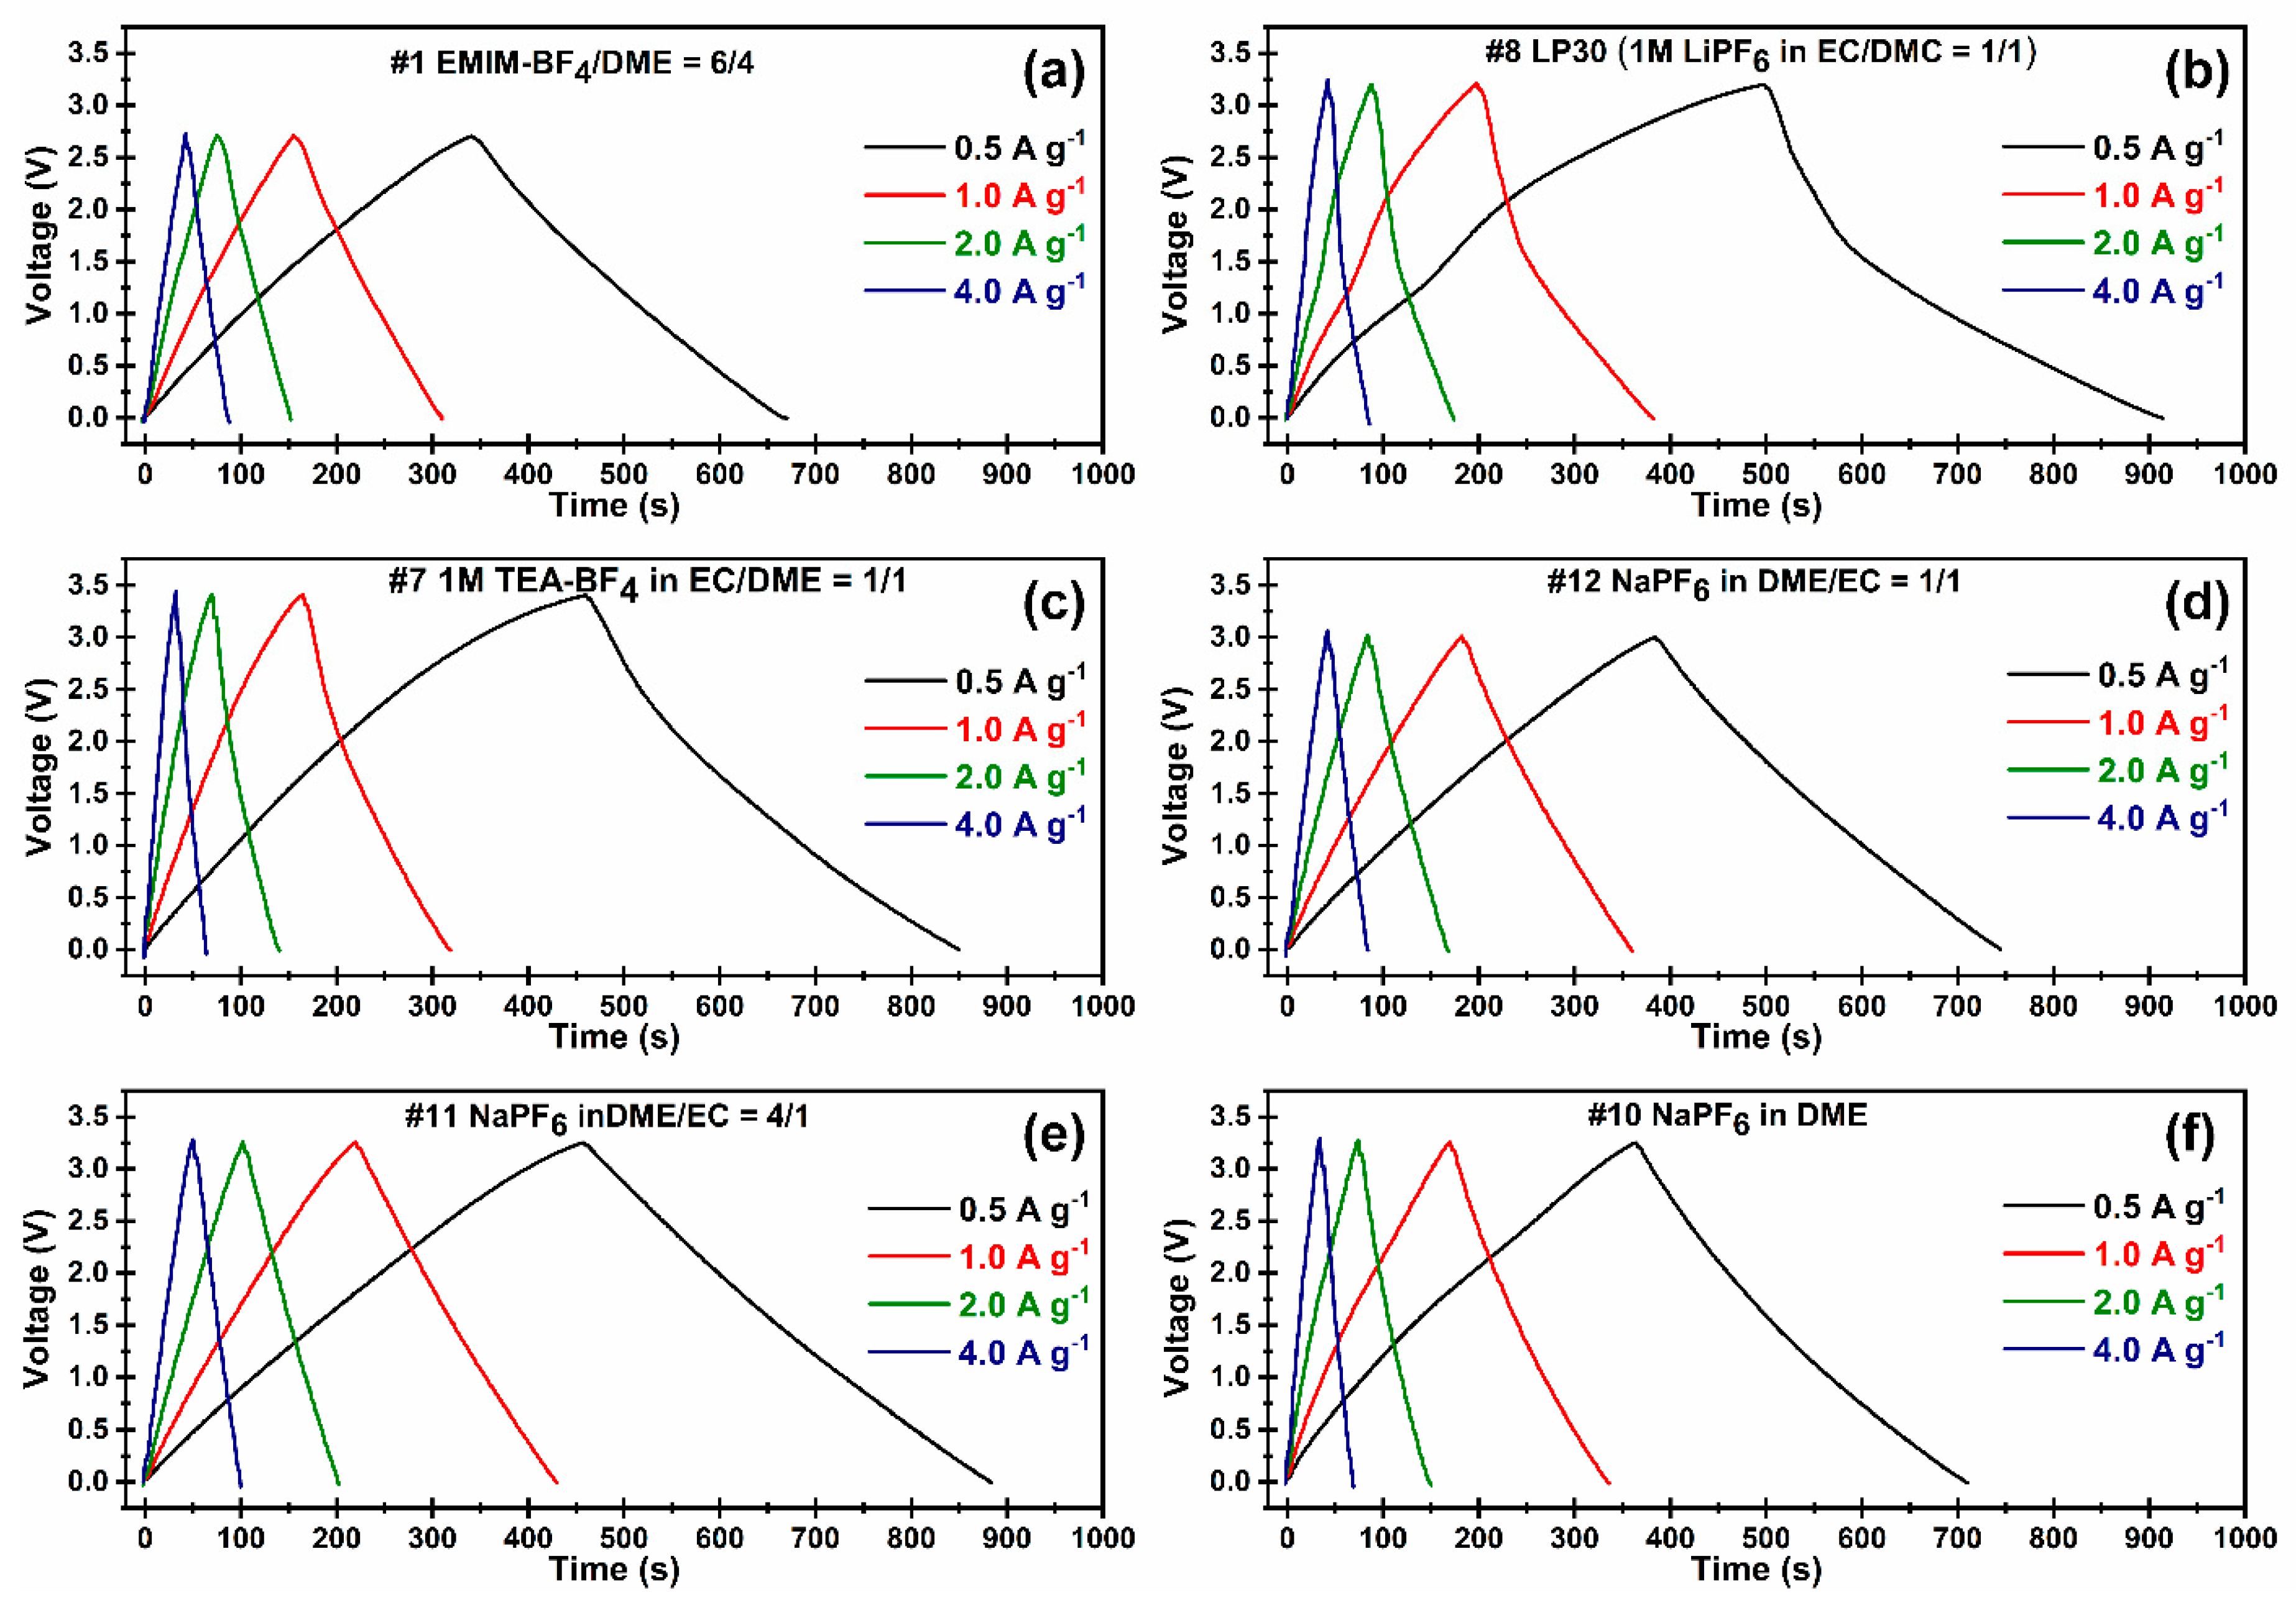
Cycling performance of EDLC cells. The cycling performance of the EDLC cells was determined using an MTI battery analyzer (BST8-WA). Several coin cells were prepared with six different electrolyte formulations. Their charging-discharging cycles were recorded at different current densities: 0.5, 1.0, 2.0 and 4.0 A g
−1.
Figure 5 depicts the initial charging/discharging curves for all electrolytes. Specific capacitance and energy density values were calculated based on the initial (50
th) cycle discharging time and OPV. The results are summarized in
Table 5. The Coulombic efficiency (
Cd/Cc) of the EDLC cells was determined from the ratio of discharging/charging time of the displayed cycle at 1 A g
−1. It is noteworthy that although the electrolyte #1 has the lowest internal resistance and possesses a very good
C value, this system displayed the lowest
E among all six formulations due to the low OPV. For the electrolyte #8, the cell displayed the higher
C and
E than that of electrolytes #1 and #7, despite a high OPV of the electrolyte #7. This may be due to the larger
C caused by the small size of Li
+ compared to the organic cations, which allows more ion stacking at the electrode-electrolyte interface. However, the huge internal resistance leads to the low coulombic efficiency of the cell, which means a considerable loss of electrical energy. Under a constant current, the integral of voltage with respect to time equals the electrical energy. As shown in
Figure 5b, the low energy storage efficiency of cell containing the electrolyte #8 is illustrated by the great difference between the area under the charging curve and that under the discharging curve, which is much more severe than cells based on the other electrolytes.
In contrast, the cell with the electrolyte #7 can sustain the highest OPV, although C is the lowest among all six formulations, because of the larger size and sphere-like shape of TEA+. The planar-shape of EMIM cation may lead to higher C (electrolyte #1). This cell also suffered a comparatively low energy storage efficiency. To conclude, the electrolytes #10, #11 and #12 are found to be the best electrolytes in this study, especially, the electrolyte #11, which attained the highest C and E, while recording a Coulombic efficiency >95%.
Long-term cycling performance. Two electrolyte formulations with the best comprehensive performance (#11, 1 M NaPF
6 in EC/DME = 1/4 v/v and #10, 1 M NaPF
6 in DME) were selected for the long-term cycling test. These EDLC cells were cycled at a current density of 1.0 A g
−1 and OPV 0~3.25 V for 4000 cycles, and their specific discharge capacitance were recorded (
Figure 6).
It is a common observation that supercapacitor cells made of active carbon and organic electrolytes experience performance fading in the first 1500 cycles. This is a result of both decrease in capacitance and increase in equivalent series resistance (ESR) [
55,
56,
57,
58,
59]. The capacitance fading is believed to be driven by two mechanisms. The first one is associated with the exponential function of square root of time of ageing, while the second one is described by the Gaussian function. The first ageing mechanism (presumably related to the degradation of electrolytes) is observed for most samples, while the second mechanism is significant only under harsh testing conditions, such as elevated temperature and/or increased operating voltage. The degradation rate due to the cycling ageing test is much higher than the degradation rate due to the calendar ageing test with equivalent voltage and temperature [
60,
61,
62]. We presume that the second ageing mechanism is related to the electrode active area degradation caused probably by the decrease of potential barrier on the electrode/electrolyte interface.
As expected, both cells experienced fast capacitance decay in the first 1500 cycles, but after that the decay rate became very minimal. For the next 2500 cycles, the specific capacitance retention of both EDLC cells were 93.6% and 85.4%, respectively (
Table 6). For the cell with 1M NaPF
6 in EC/DME = 1/4 v/v electrolyte, after 4000 cycles, its specific capacitance and energy density were calculated at 71.4 F g
−1 and 26.2 Wh kg
−1, respectively. These results are superior to most reported organic solvent-based EDLCs [
63,
64,
65]. Similar phenomena have been reported in the EDLC research of Väli et al. using NaPF
6 in EC/DMC/PC/EA = 1/1/1/0.5 (volume ratio) as the electrolyte [
37]. Since the specific discharging capacitance was still very high and kept stable after long-term cycling, we believe the fast capacitance fading during the first 1500 cycles was not caused by the blocking of the micro pores or the passivation of the electrode surfaces. We believe a part of the reasons may be due to the high contribution of pseudocapacitance created by the N and O functionalities on the electrode surface, which has been widely researched in symmetric supercapacitors based on KOH-activated N-doped carbon electrodes and aqueous electrolytes [
65,
66]. This type of N-dope carbon electrode material could be prepared by calcination of MF or other nitrogen-containing precursors [
63,
64,
67]. The maximum OPV of aqueous-electrolyte supercapacitors are usually ~1.0 V (strong-acid/base) or ~1.8 V (neutral). However, in our experiments under higher OPV these N and O functionalities may experience slow oxidation/reduction, leading to the decay of pseudocapacitance.

 ,
, 


