Article

Ketoprofen Photodegradation Kinetics Promoted by TiO2

by
Rosanna Paparo
,
Alessia Viscovo
,
Marco Trifuoggi
,
Martino Di Serio
and
Vincenzo Russo
*
Department of Chemical Sciences, University of Naples Federico II, 80126 Naples, Italy
*
Author to whom correspondence should be addressed.
ChemEngineering 2024, 8(5), 90; https://doi.org/10.3390/chemengineering8050090
Submission received: 14 June 2024 / Revised: 31 August 2024 / Accepted: 3 September 2024 / Published: 5 September 2024

Abstract

:
Ketoprofen is a non-biodegradable drug and is not removed by conventional treatments. The need to remove pharmaceutical compounds from water and wastewater has aroused considerable interest in advanced oxidation processes (AOP), whose effectiveness depends on the generation of reactive free radicals capable of oxidizing and decomposing numerous compounds. Heterogeneous photocatalysis is an efficient method if an active semiconductor is used. In this work, the photodegradation reaction of ketoprofen promoted by TiO2 was studied, analyzing the kinetics obtained by changing variables such as temperature, initial concentration, and quantity of photocatalyst. It was determined that the mechanism is of the Langmuir–Hinshelwood type and that the system is operating in the kinetic regime, while tests at different temperatures have shown that the adsorption of ketoprofen and byproducts are both exothermic. Experimental data were interpreted with reliable models that allow to retrieve quantitatively the kinetic and thermodynamic parameters.

1. Introduction

The continuous increase in the worldwide population has greatly led to an increased consumption of pharmaceuticals, so they are present in urban (domestic and storm water) WWTPs, hospital wastewater as well as industrial wastewater [1]. Pharmaceutically active compounds (PhACs) are used in significant quantities throughout the world and represent a class of emerging contaminants (ECs) in wastewaters. The presence of these compounds in the aqueous matrices is well known; in fact, they have been detected in the effluents of wastewater treatment plants, in groundwater, in surface waters, and even in drinking waters [2]. Nowadays, the diffusion of pharmaceutical compounds (ubiquitous, persistent, and biologically active substances) into the environment is creating serious concern because their discharge into surface water bodies has no legal requirements.
Due to the low concentrations in wastewater (ng/L—μg/L), emerging pollutants cannot be removed using conventional techniques [3], but in the future they may have toxic effects on aquatic fauna and flora, long-term effects, or consequences due to the interaction with other species. Usually, also after secondary treatment, where biological degradation is used, the PhACS compounds are resistant; consequently, the tertiary treatment step of WWTPs, where physical/chemical methods are required, is used. Ketoprofen is an emerging contaminant that needs to be controlled and limited. Thus, development of techniques to remove ketoprofen is of paramount importance. Currently, different processes to degrade and remove PhACS have been studied to limit the pollution of the aquatic environments by bio-recalcitrant organic compounds, such as filtration, biological processes, flocculation, coagulation, sedimentation, membrane processes, adsorption, advanced oxidation processes, and combined methods [4]. Heterogeneous photocatalysis can be used to eliminate organic and inorganic compounds from wastewater in the presence of semiconductor oxides [5,6,7]. In this study, Advanced Oxidation Processes (AOPs) and photochemical processes based on the use of high-energy UV radiation and the generation of the OH radicals using the heterogeneous photocatalysis of titanium dioxide (TiO2) to improve the performance of the degradation process are investigated.
Ketoprofen, (2-(3-benzoylphenyl)-propanoic acid, KET), is a member of the arylpropionic acid class of non-steroidal anti-inflammatory drugs (NSAIDs) used to treat pain, inflammation, and stiffness belonging to the analgesic and anti-pyretic classes [8], both in human and veterinary medicine. The main properties are reported in Table 1. The high use and popularity of ketoprofen is related to its rapid absorption and simple metabolism; in fact, the annual consumption of ketoprofen and diclofenac in Taiwan was approximately 7.9 tons in 2006 [9] and 22 tons of ketoprofen were consumed in France in 2004 [10]. The highest detected total concentrations of ketoprofen in a municipal wastewater treatment plant in East Texas, USA, were 0.815–0.885 μg/L [11]. Furthermore, ketoprofen was highly detected in sewage at concentrations of 1.1–2.3 mg/L [12], ketoprofen (10 mg/L) [13] Costa Rican surface water, 0.94 [14].
Titanium dioxide is one of the best-known photocatalysts, thanks to its high stability, low cost, efficient photoactivity, and electron-hole recombination rate. When the light irradiates the solid surface with an absorption energy equal to or higher than the band-gap (3.2 eV) [16], there is a promotion of an electron from the valence band (VB) to the conduction band (CB), creating an electron–hole pair.
In this way, redox reactions are promoted on the photocatalyst surface, generating radicals such as hydroxyl species (OH˙), peroxyl (O2−) and hydroperoxide (HO2) that are oxidative agents capable of degrading the organic compounds and mineralizing the pollutants to carbon dioxide and water [17].
Several materials containing TiO2 were used (e.g., CuO/TiO2@GCN [18], Bi2S3/TiO2–Montmorillonite [19], CuO/TiO2@GCN cellulose acetate [20], MoO3/AgO TiO2 [21] as nanocomposites, and MWCNT/N-TiO2/UiO-66-NH2 [22], S-TiO2 [23], TiO2:ACN [24], Pt–TiO2–Nb2O5 as heterojunctions [25]) to photodegrade KET as reported in Table 2.
In the literature, few studies based on the use of TiO2 (without further modifications and preparation) to degrade KET are reported. In particular, comparing our study with another commercial, TiO2 [26], using similar experimental conditions, i.e., ρB = 0.50 g/L, UV-A irradiation source (366 nm) and CKET = 10–12 mg/L the system reaches a KET degradation of 22.75%, while in our system it reaches 44% in the same reaction time of 120 min. Furthermore, the power of the UV lamp used in the reference [27] has a double power value (8 W) than our (4 W), showing energetic and economic effectiveness. So, with our system, a double KET photodegradation percentage was obtained, giving a deep and complete kinetic, thermodynamic, and mechanism description. At the same time, many works in which modified TiO2 was used are presented (see Table 2). One disadvantage of these types of materials could be industrial-scale production, which requires high quantities. In addition, an economic and environmentally sustainable balance should be made between the production time and cost of the reagents.
Titanium dioxide (TiO2-P25) is a common catalyst used in the photodegradation process to remove several kinds of organic pollutants, such as dyes (Reactive Black 5, Rhodamine B, Reactive Orange [28,29,30], pesticides [31], and drugs (Ibuprofen, Naproxen, Tamoxifen, and Gemfibrozil [5,32]).
Even if this catalyst is a commercial material, the literature does not present a deep kinetic and thermodynamic study about KET heterogeneous photodegradation. Then, the aim of this work is the investigation of the catalytic photodegradation of ketoprofen in aqueous solutions, using as catalyst titanium dioxide (TiO2) alone to investigate in detail its behavior toward KET degradation using both UV and visible light sources. Photodegradation experiments have been conducted by exploring a wide range of operating conditions: change in the initial KET concentration, amount of catalyst, temperature, and irradiation source to obtain information about the mechanism of photodegradation and the kinetic and thermodynamic parameters of the reaction. Thus, a reaction mechanism was proposed, and the collected data were interpreted with a reliable kinetic model that allowed to calculate the kinetic and thermodynamic parameters.

2. Materials and Methods

2.1. Materials

Ketoprofen (>98.0%) was purchased from TCI (Tokyo Chemical Industry, Tokyo, Japan). The white powder was weighted and used to prepare a standard solution in distillated water. The photocatalyst used is titanium dioxide Aeroxide TiO2 P-25® (formerly known as Degussa P-25®, Evonik Industries, Essen, Germany). The main properties of the catalyst are reported in Table 3.

2.2. Experimental Apparatus and Procedure

An appropriate experimental set-up was realized to perform the photocatalytic tests. A 1.5 L jacketed glass vessel closed with a three-neck lid (see Figure 1) was used to perform photodegradation experiments.
One neck lid was used for sampling the solution in time though a syringe and to check the temperature through a dedicated thermocouple; in fact, the temperature of the reaction was ensured using an ultra-thermostat while the agitation of the dispersion was allowed by magnetic stirring. The second neck was used to add air in the system through an electronic gas flowmeter regulator (supplied by Bronkhorst) connected to a sintered filter of 50 mesh, submerged in the liquid-solid dispersion. The air flow rate in the system was set at 50 mL/min. This method allowed the system to reach a high gas–liquid surface area, minimizing gas–liquid mass transfer limitations [34]. Two lamps were inserted in the third neck of the reactor and used as light sources to irradiate the solution: one for the UV-A range Toshiba FL4BLB (potential difference 220 V, power of 4W, emission wavelength of 365 nm, and dimensions of 15 cm × 1.5 cm) and a lamp for the visible range Sylvania T5 (power of 4W and a color temperature of 6500 K, potential difference 220 V, and dimensions 14 cm × 1.5 cm).
For each solution prepared, the weighted ketoprofen was transferred to a glass flask with a capacity of 1 L, made up to the mark with distilled water, and blanketed with silver paper to protect it from light sources as it is a light-sensitive compound. The solution was placed overnight on a magnetic stirrer at 750 rpm, which, with the help of a magnetic clamp, allowed the solid ketoprofen to solubilize. Kinetics tests were performed by taking samples of solution every 30 min for the first 2 h of reaction and then every hour for the remaining 3 h of reaction, for a total of 5 h. The lighting of the lamp was considered the start of the reaction, and a first sample, without a light source and catalyst presence, was considered the blank. All the collected samples were centrifuged (Rotofix 32 A; Andreas Hettich GmbH, Tuttlingen, Germany) at 35 rpm × 60 min to allow a first solid separation from the liquid phase, and subsequently a microfiltration was made using a millipore filter. The UV-Vis spectrophotometer (V-550: Jasco) was used to analyze the liquid phase in order to determine ketoprofen concentration in time. The maximum absorbance value was recorded obtaining the UV-Vis spectra (Figure S1) at the wavelength λ = 260 nm [34], so the calibration curve (Figure S2) was obtained by analyzing solutions at different concentrations (2.5, 7.5, 13, 20, and 25 mg/L). Every sample was analyzed three times.
To find the best conditions for the process of photodegradation of ketoprofen, at first its stability to both Vis and UV light radiation effects was determined, as was whether the catalyst used could act as an adsorbent for the test compound. Subsequently, tests with and without a photocatalyst were carried out in the presence of light radiation (see Table 4).

2.3. Catalyst Characterization

Fourier transform infrared (FTIR) spectra were obtained using FT-IR 4700LE (JASCO, Tokyo, Japan) in ATR (attenuated total reflectance); the spectrum was obtained at a resolution of 2 cm−1 over the range of 500–4000 cm−1. Potassium anhydrous bromide (KBr) was used as reference material. FT-IR spectra of the pristine catalyst were obtained mixing both TiO2 and KBr (m/m, 1:2000) and pressed to obtain a pellet. To identify the interaction between KET and catalyst, the pellet of TiO2 was covered with a drop of saturated KET solution and dried in an oven at 60 °C for one hour before the analysis.
The solid was characterized by investigating both its morphology and structure by transmission electron microscopy (TEM) and scanning electron microscopy (SEM) analysis. TEM characterization was obtained using a FEI TECNAI G2 200 kV S-TWIN microscope (electron source with LaB6 emitter) equipped with a high-resolution camera (Eagle4K), while to provide information on surface topography, chemical composition, and electrical behavior, a field emission scanning electron microscope (FE-SEM, FEI Nova NanoSEM450) was used. To perform TEM analysis, about 0.01 g of titanium dioxide (TiO2) was added in a test tube containing 2 mL of ethanol and placed in an ultrasound bath for 2 h, then the sample was transferred onto TEM grids and analyzed by TEM. SEM analysis was performed by attaching the samples to the sample holder via carbon tape and coating with a thin layer of Au-Pd using a vacuum sputter coater. SEM micrographs were acquired using an incident electron beam (3 and 5 kV) and by collecting secondary electrons (SE) with an ETD detector.

2.4. Mass Balances and Numerical Methods

The collected kinetic data were interpreted using a pseudo-homogeneous ideal batch reactor model. The volume of the liquid phase was considered constant, and the system isothermal. The catalyst bulk density was also assumed to be constant, as the liquid sampling did not affect significantly the liquid volume (less than 10% of variation). The eventual intraparticle diffusion limitations were neglected, as the catalyst particles are in nanoparticle form with an average diameter of 21 nm. The Weisz–Prater criterion was satisfied for every experiment [35]. Moreover, two different reactions were considered: (i) photodegradation promoted by the heterogeneous catalyst; (ii) spontaneous photolysis. The following general mass balance equation was adopted to interpret the kinetic data, Equation (1).
d C i d t = ν i r ρ B + ν i r p
where Ci is the concentration of component i, r the reaction rate promoted by the heterogeneous catalyst, rp the photolysis reaction, νi the stoichiometric coefficient of component i, ρB the catalyst bulk density.
The dependence of kinetic (kj) and adsorption constants (Ki) was taken into consideration using the Arrhenius and van’t Hoff equations reported below.
k j = k r e f , j e x p E a R 1 T 1 T r e f
K i = K r e f , i e x p Δ H R 1 T 1 T r e f
where Tref = 303.15 K.
The mass balance was implemented and solved using MATLAB R2024a, adopting the ode23s algorithm to solve the ordinary differential equation system and the patternsearch algorithm to run the parameter estimation analysis.

3. Results and Discussion

3.1. Results of the Kinetic Investigation

3.1.1. Light Source and Catalyst Effect on the Photodegradation Process

Catalyst-free tests were carried out to investigate possible photodegradation of ketoprofen due only to the presence of UV radiation or Vis radiation alone. Then, an adsorption test was performed in the presence of only the catalyst (ρB = 0.5 g/L). Preliminary tests were carried out using a ketoprofen solution with an initial concentration of 12.6 mg/L. The adsorption of KET onto TiO2 (9%) and the effect of the Vis source only (5%) are negligible, while the UV source used can photodegrade ketoprofen efficiently (25%) (Figure 2).
Furthermore, to determine the catalyst effect coupled with the two light sources, the same tests were performed using 0.5 g of TiO2 in 1L of liquid solution. As visible from Figure 2, the percentage of ketoprofen removal increases from 5% to 23%, while if the solid is added in the presence of UV light, there is a visible improvement in the process, in fact, ketoprofen removal has increased from 21% to 78%. So, the use of the catalyst and UV source was the best combination for the photodegradation of KET and was used for the study.
The pH of the aqueous solution decreases, increasing the KET concentration (see Table 4).
Generally, the influence of the acidity on heterogeneous photocatalysis affects both the state of protonation of the substrate (KET) and the charge of the particles of the photocatalyst (TiO2) (i.e., ionization state of the surface), eventually the size of aggregates, and the energy among CB and VB and, therefore, EG [27].

3.1.2. Photodegradation Using UV Light and TiO2

The most powerful light source, UV, was used to perform the kinetic test, changing the catalyst amount (0, 0.2, 0.3, and 0.5 g) into the ketoprofen solution (12.6 mg/L). As reported in Figure 3a, ketoprofen concentration decreases as the amount of the TiO2 catalyst increases in the solution.
The results show that the rate at which ketoprofen is degraded increases by operating with greater amounts of catalyst, reaching a concentration of 2.82 mg/L operating with 0.5 g/L (Figure 3b). It is important to note that even with lower quantities, 0.2 g/L, however, the ketoprofen concentration is reduced to 6.31 mg/L, less than half the starting concentration. Moreover, the effect of the photolysis is not minor; thus, this aspect was considered in the modeling of the kinetic data.

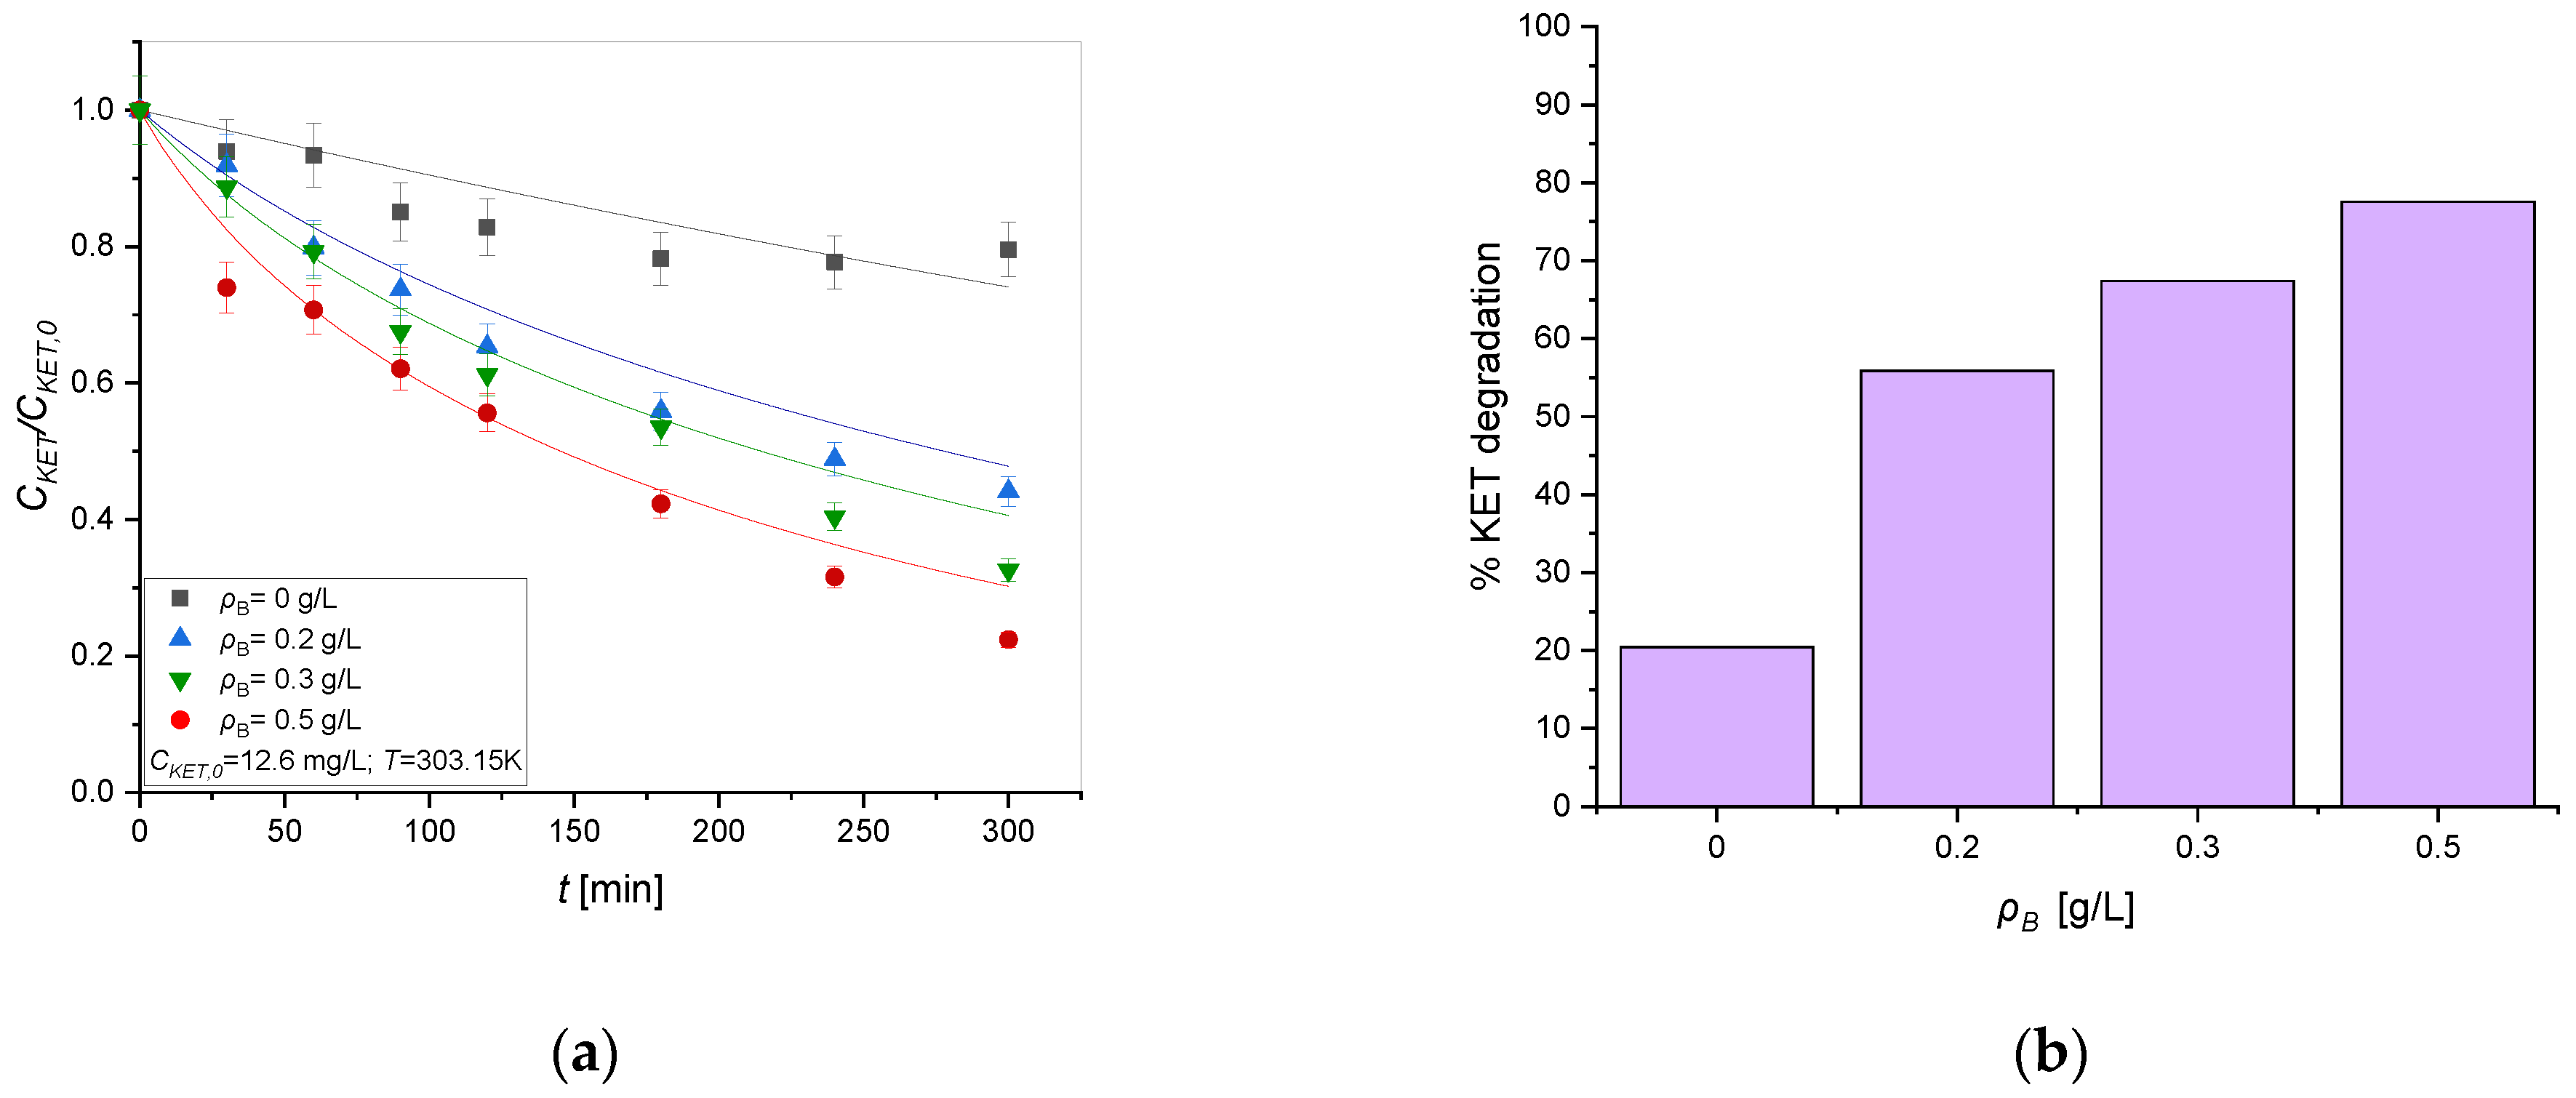
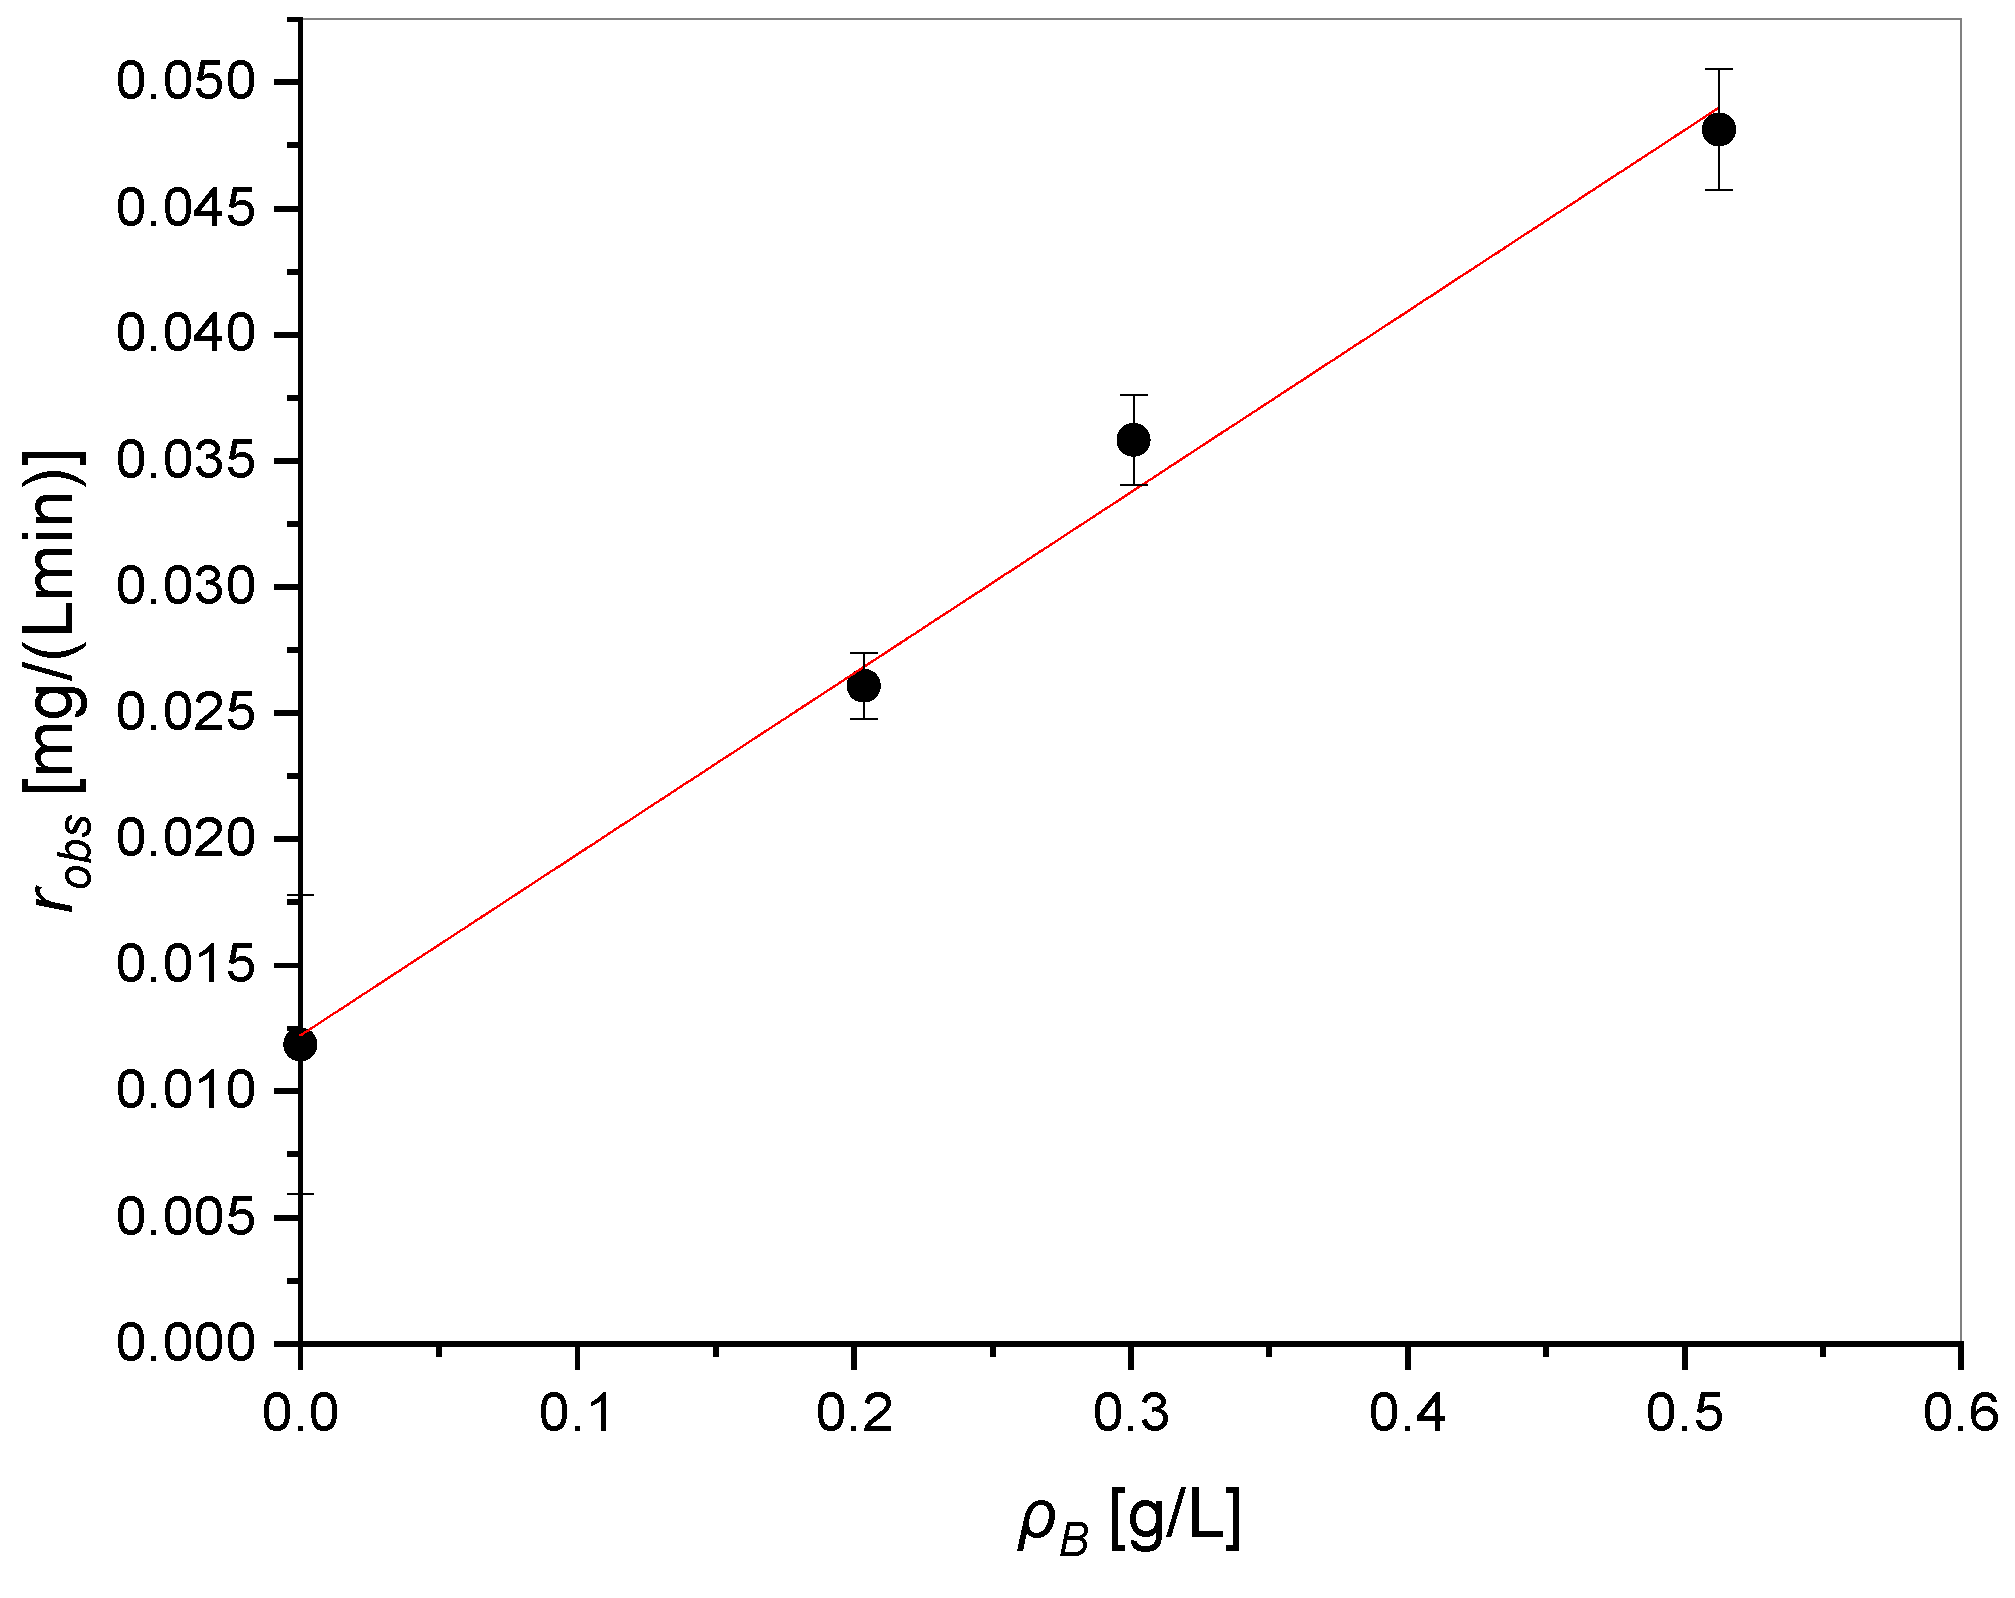
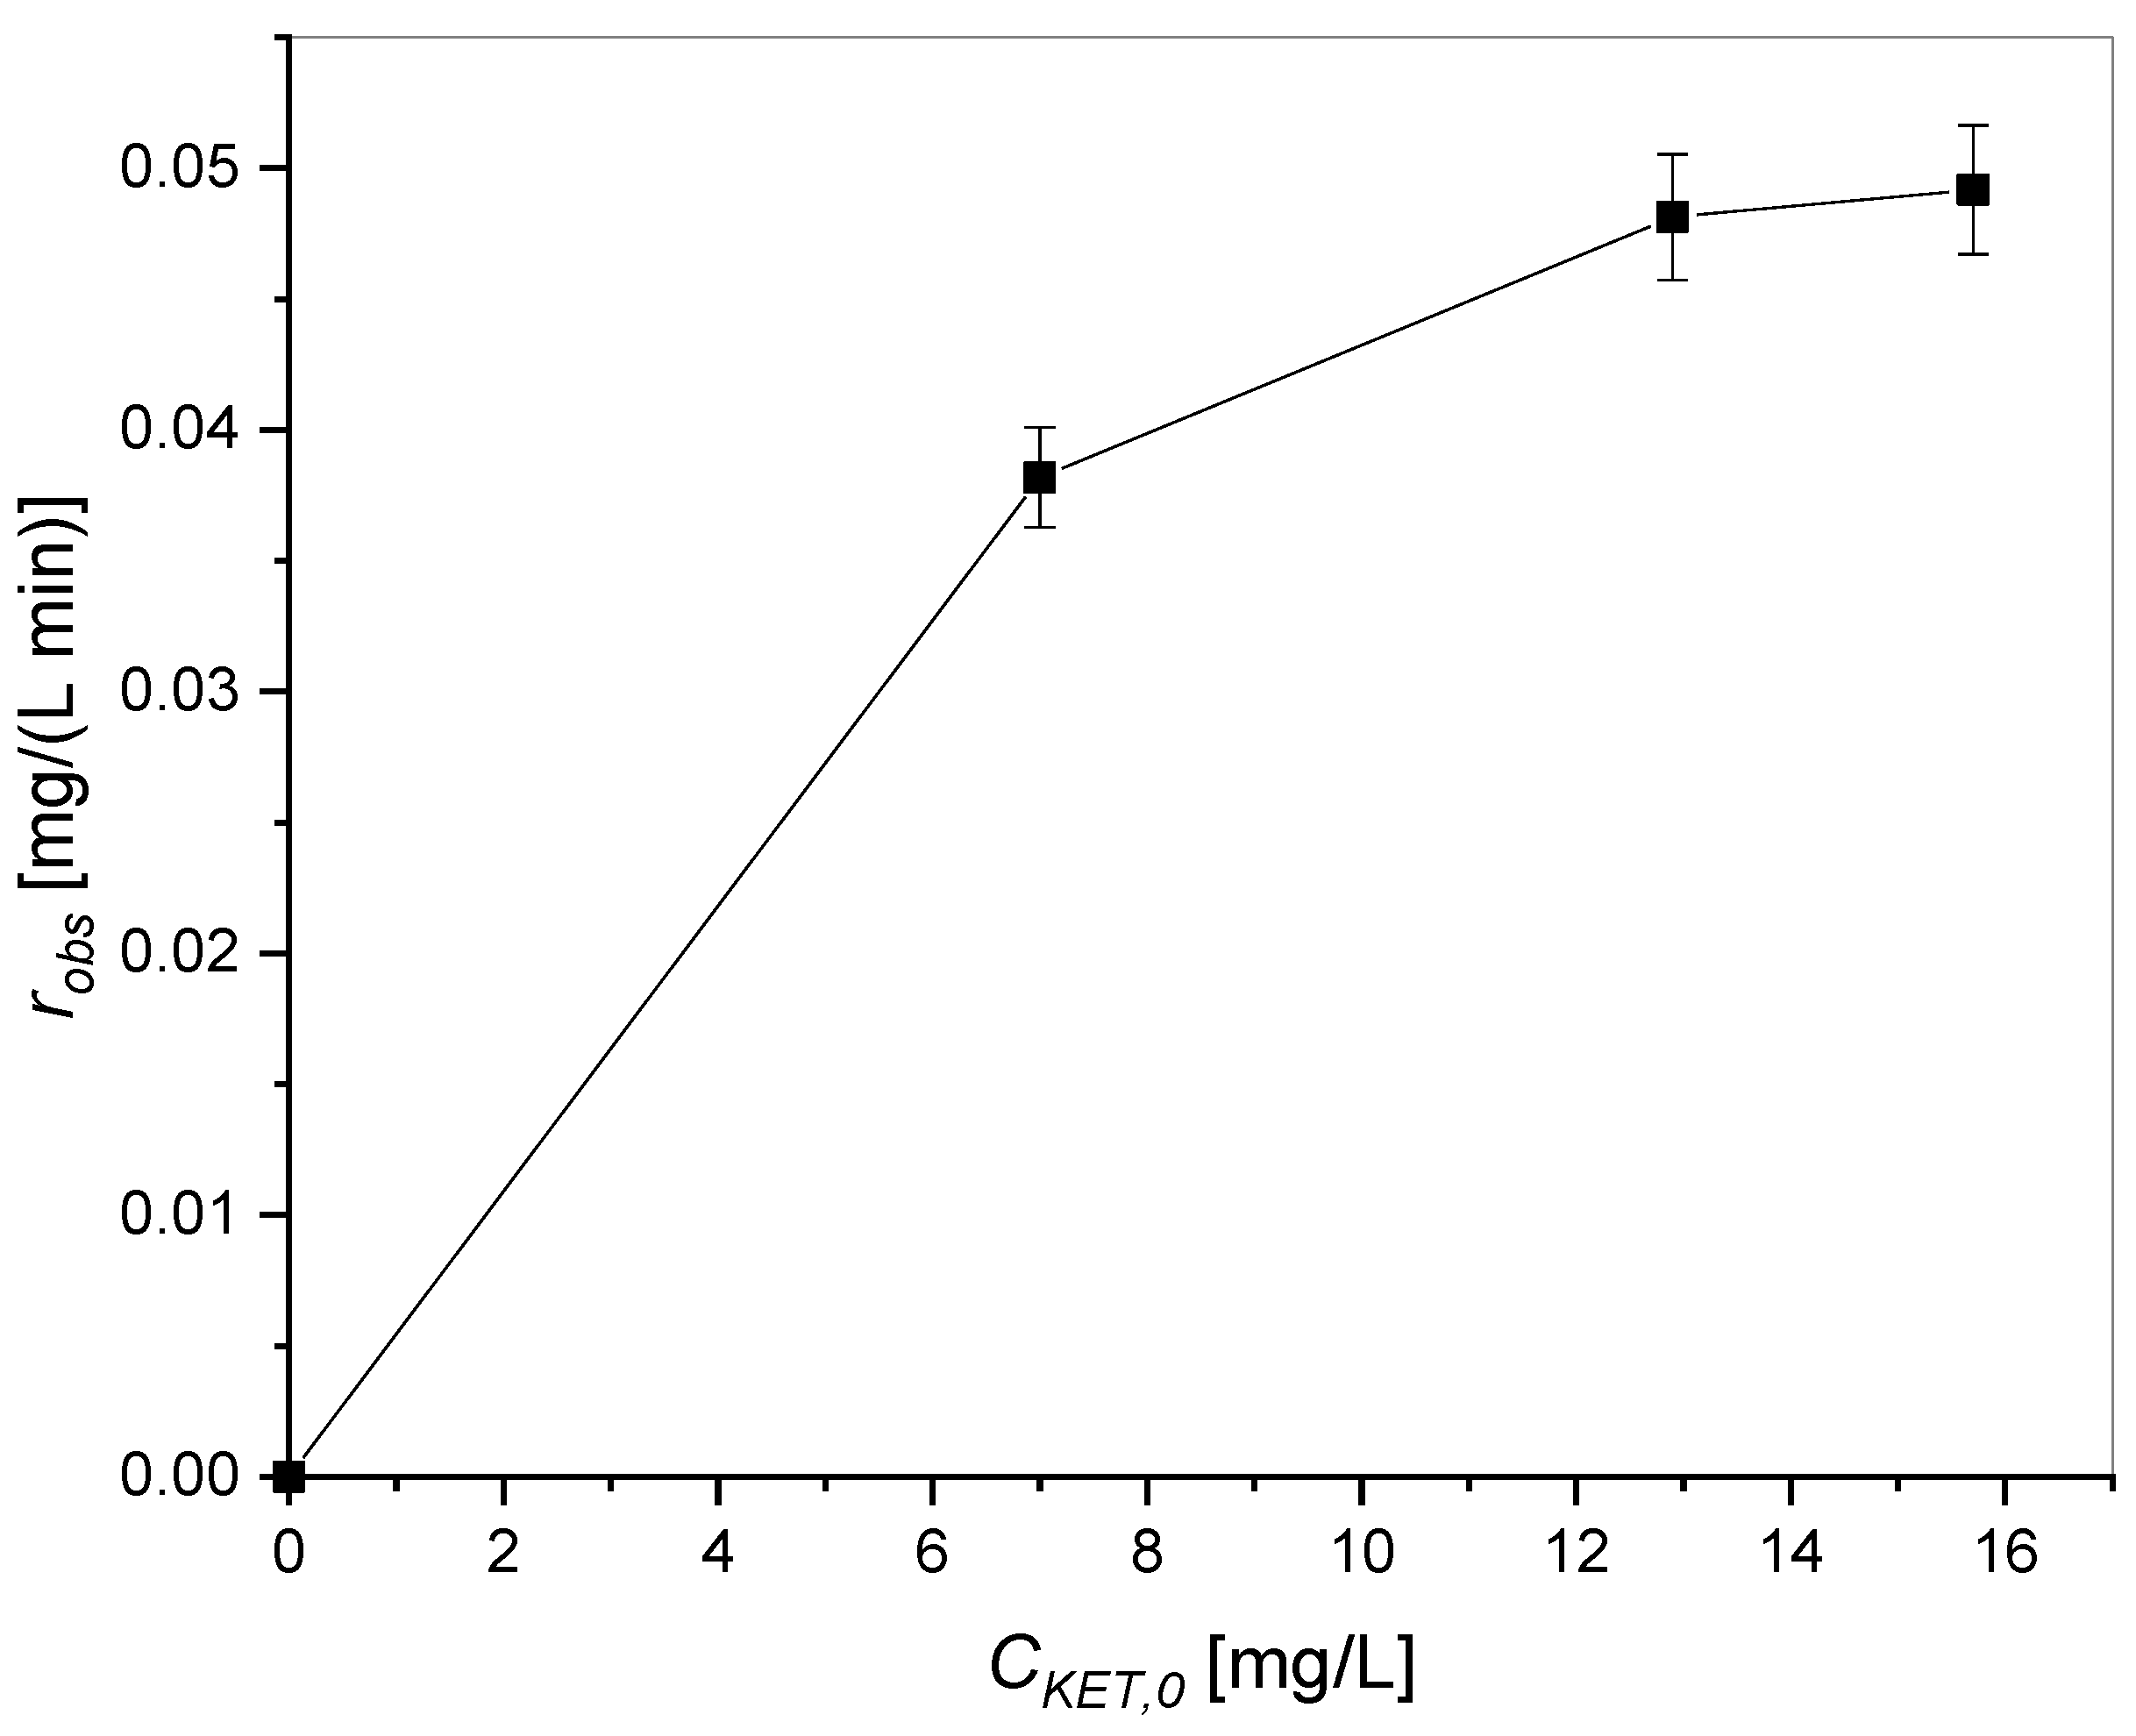
3.1.3. Effect of Initial Concentration of Ketoprofen Using TiO2 and UV Radiation

Kinetic tests were carried out using UV radiation, fixing the quantity of catalyst to study the variation in the initial concentration of ketoprofen. As can be seen from Figure 4, the degradation kinetics of ketoprofen are faster using an intermediate concentration of 12.6 mg/L. This fact could be explained by a possible influence of ketoprofen adsorption at higher concentrations.

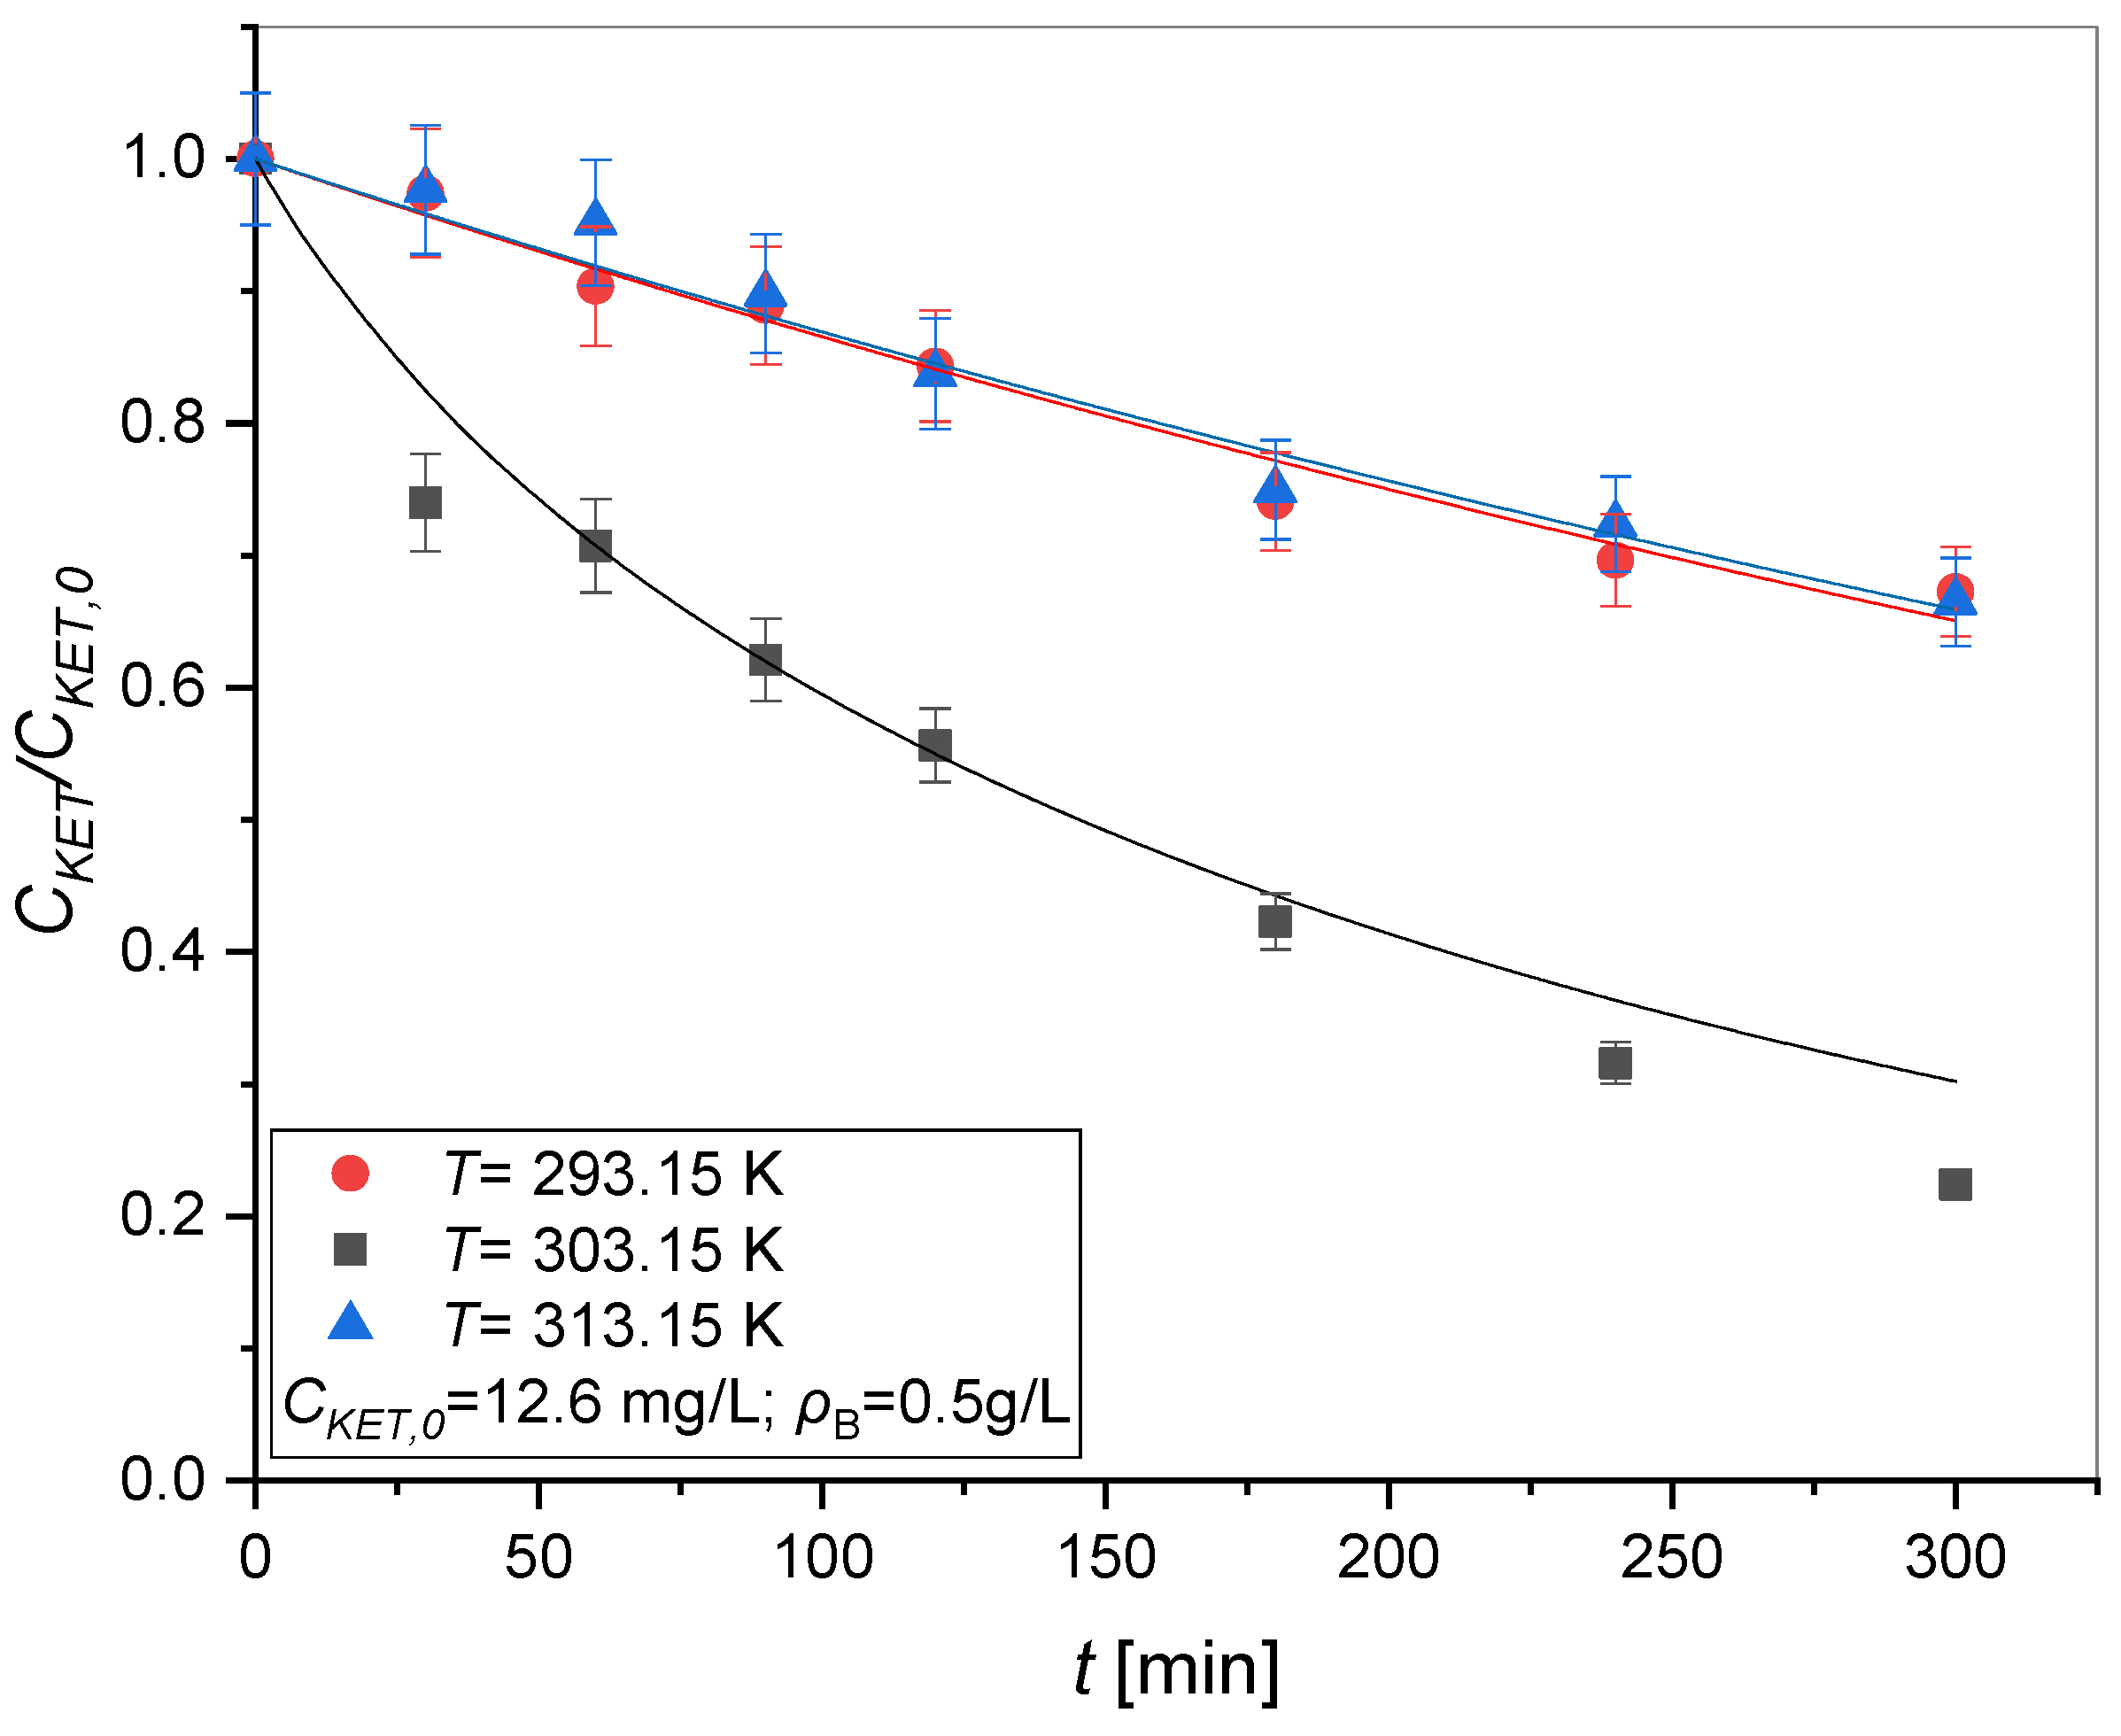
3.1.4. Effect of Temperature Using TiO2 and UV Radiation

Figure 5 shows the results obtained from these experimental tests of photodegradation tests using TiO2 as a catalyst and at different temperatures (T = 293.15, 303.15 and 313.15 K). The results obtained from the tests carried out using different temperatures show that the speed with which ketoprofen is degraded varies non-linearly based on the temperature at which the reaction is carried out. In particular, the degradation rate of ketoprofen is greater when the temperature is set to 303.15 K.
The observation of this trend suggests that exothermic processes occur simultaneously as the reaction proceeds. One probable explanation could be the occurrence of exothermic adsorption of ketoprofen and related byproducts. This assumption will be further deepened in the modeling section of this paper.

3.2. Kinetic Modeling Results

Preliminary Evaluations

The collected data were interpreted with simple linearizations to retrieve quantitative information needed to suppose a reliable reaction mechanism. For this reason, the observed reaction rate (robs) was measured for each test on the experimental data, using the formula robs = −ΔCKET/Δt, carefully evaluating it in the linear region of the kinetic curves.
Firstly, the observed rate was plotted vs. the catalyst bulk density to verify the related response (Figure 6). The photolysis experiment was also included in the evaluation.
It should be noted that the reaction rate increases linearly with the catalyst load, indicating a system operating in the kinetic regime. Thus, a pseudo-homogeneous batch model can be surely adopted to interpret the kinetic data.
Furthermore, it is useful to represent the observed reaction rate of the tests carried out at different concentrations of ketoprofen with a UV lamp in correspondence with the initial concentration of ketoprofen (Figure 7).
As shown in Figure 7, the trend is not linear but approaches to either a maximum or a plateau value, which means that the ketoprofen adsorption phenomena are important. In order to understand the mechanism involved, two different mechanisms are hypothesized: Eley–Rideal and Langmuir–Hinshelwood [27,36]. In the Langmuir–Hinshelwood mechanism both ketoprofen and oxygen must adsorb on the active sites of the catalyst to react, while in the Eley–Rideal mechanism only ketoprofen (KET).
The kinetic laws for the two mechanisms are obtained below:
Langmuir–Hinshelwoodmechanism
K E T +     K E T , K K E T = θ K E T C K E T θ
O 2 +     O 2 , K O 2 = θ O 2 C O 2 θ
K E T + O 2 P +  
P     P +   K P = θ P C P θ
By defining the rate determining step as the chemical reaction we obtain:
r L H = k θ K E T θ O 2 = k K K E T C K E T θ K O 2 C O 2 θ = k K K E T C K E T θ 2
Working at constant oxygen concentration (water saturation) it is possible to group the constant terms in the apparent kinetic constant k′.
The balance on the sites allows us to obtain the fraction of free sites (θ).
θ + θ K E T + θ P + θ O 2 = 1
θ + K K E T C K E T θ + K P C P θ + K O 2 C O 2 θ = 1
θ = 1 ( 1 + K K E T C K E T + K P C P + K O 2 C O 2 )
Substituting (11) into (8) we obtain:
r L H = k K K E T C K E T ( 1 + K K E T C K E T + K P C P + K O 2 C O 2 ) 2
Grouping the constant terms, we obtain that:
r L H = k C K E T ( α + K K E T C K E T + K P C P ) 2
By studying the kinetic law at the limits, we obtain that:
r L H = k C K E T ,   K K E T C K E T + K P C P α
r L H = k C K E T K K E T 2 C K E T 2 = k I V C K E T ,   K K E T C K E T α + K P C P
Note that, reporting rL-H vs. CKET, the function must first increase with CKET, then decrease, passing through a maximum, fact that could explain the experimental trend reported in Figure 7.
Eley–Rideal mechanism
The adsorption steps are certainly identical to the LH approach. The only difference is the reactive step, Equation (16), where oxygen is assumed to react from the bulk phase, while KET after adsorption.
K E T + O 2   P
Thus, it is possible to obtain:
r E R = k θ K E T C O 2 = k K K E T C K E T θ C O 2 = k K K E T C K E T θ
Working at constant oxygen concentration (water saturation), also in this case the apparent kinetic constant k’ was introduced.
Substituting (11) into (17), we obtain:
r E R = k K K E T C K E T 1 + K K E T C K E T + K P C P + K O 2 C O 2
Grouping the constant terms, we obtain that:
r E R = k C K E T β + K K E T C K E T + K P C P
By studying the kinetic law at the limits, we obtain that:
r E R = k C K E T , K K E T C K E T + K P C P β
r E R = k I V , K K E T C K E T β + K P C P
In this case, by plotting rE-R vs. CKET, the function should first increase with the ketoprofen concentration, approaching a plateau value at high concentration.
As it was experimentally determined that the observed reaction rate approaches either to a maximum or to a plateau value when varying the ketoprofen initial concentration (see Figure 7), thus, in the present conditions it is not possible to discriminate between the Langmuir–Hinshelwood and the Eley–Rideal mechanisms. Both models will be tested to describe the adsorption mechanism.
To further demonstrate the marked effect of adsorption on the chemical reaction, the Arrhenius diagram constructed using the data collected at different temperatures is shown in Figure 8.
From the analysis of the data collected, it is noted that the Arrhenius diagram passes through a maximum at a temperature of 303.15 K, justifiable by a value of a negative heat of adsorption; therefore, it is exothermic. Having defined the kinetic law written according to either the Langmuir–Hinshelwood or the Eley–Rideal mechanisms, it is possible to demonstrate that the apparent activation energy is a sum between activation energy and adsorption heat. From which, it is possible to explain the dependencies of the kinetic and adsorption constant with the temperature, using the Arrhenius and van’t Hoff equations.
k K K E T = k 0 e E a R T K K E T 0 e H R T = k 0 K K E T 0 e E a + H R T = k 0 K K E T 0 e E a , a p p R T

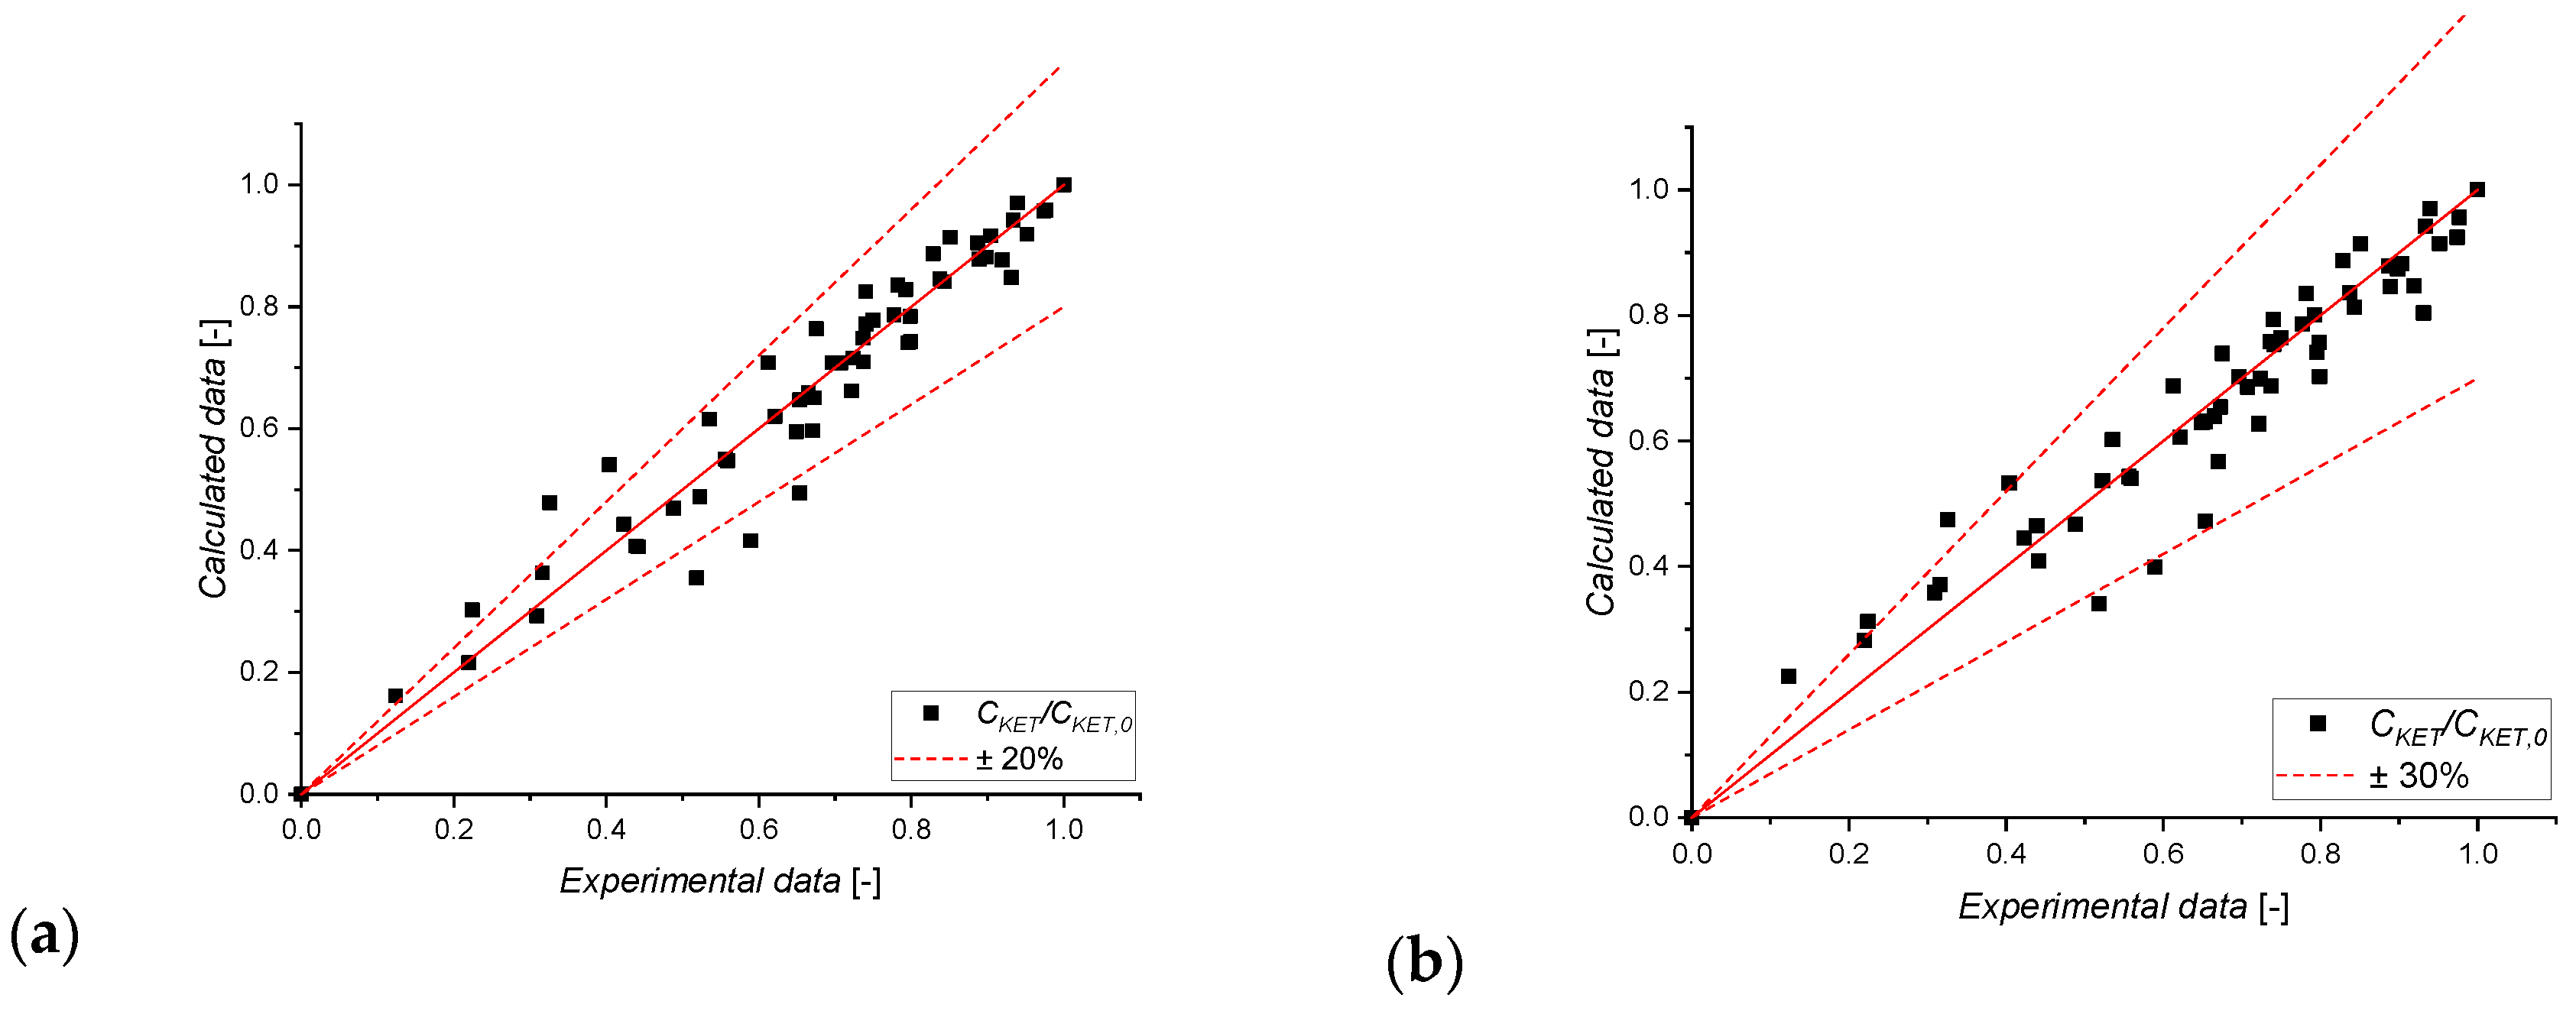
3.3. Kinetic Data Modeling

The developed model was applied to interpret the collected experimental data testing both Eley–Rideal (E-R) and Langmuir–Hinshelwood (L-H) mechanisms. In particular, the following two rate expressions were adopted:
r = r L H = k K K E T C K E T ( 1 + K K E T C K E T + K P C P + K O 2 C O 2 ) 2
r = r E R = k K K E T C K E T 1 + K K E T C K E T + K P C P + K O 2 C O 2
Concerning the photolysis step, a first order rate expression was considered.
r p = k p C K E T
Finally, a single adsorption enthalpy was assumed for both ketoprofen and by-products, being molecular very similar.
The results of the parameter estimation analysis are reported in Table 5.
As revealed, by imposing the L-H mechanism, more reliable statistical parameters were found, as the confidence interval is always lower than 15% compared to the parameter itself. High errors are calculated using the E-R mechanism. Even comparing the R2 values, the L-H mechanism allowed to achieve a more statistically relevant fil (0.99 vs. 0.78 for, respectively, L-H and E-R mechanisms). Finally, the overall fit can be observed in the parity plots shown in Figure 9. Comparing the experimental results and model predictions, all the points fall within a confidence interval of ±20% only when imposing the L-H mechanism. Thus, it is possible to conclude that the Langmuir–Hinshelwood mechanism, suits better in describing the photodegradation kinetics of ketoprofen promoted by TiO2.
In this case, both reactants and products show relatively high adsorption constants, indicating the high affinity of the catalyst towards the investigated molecules. Adsorption was found to be rather exothermic (−410 kJ/mol), as already expected when testing the photodegradation at different temperatures (Figure 8).

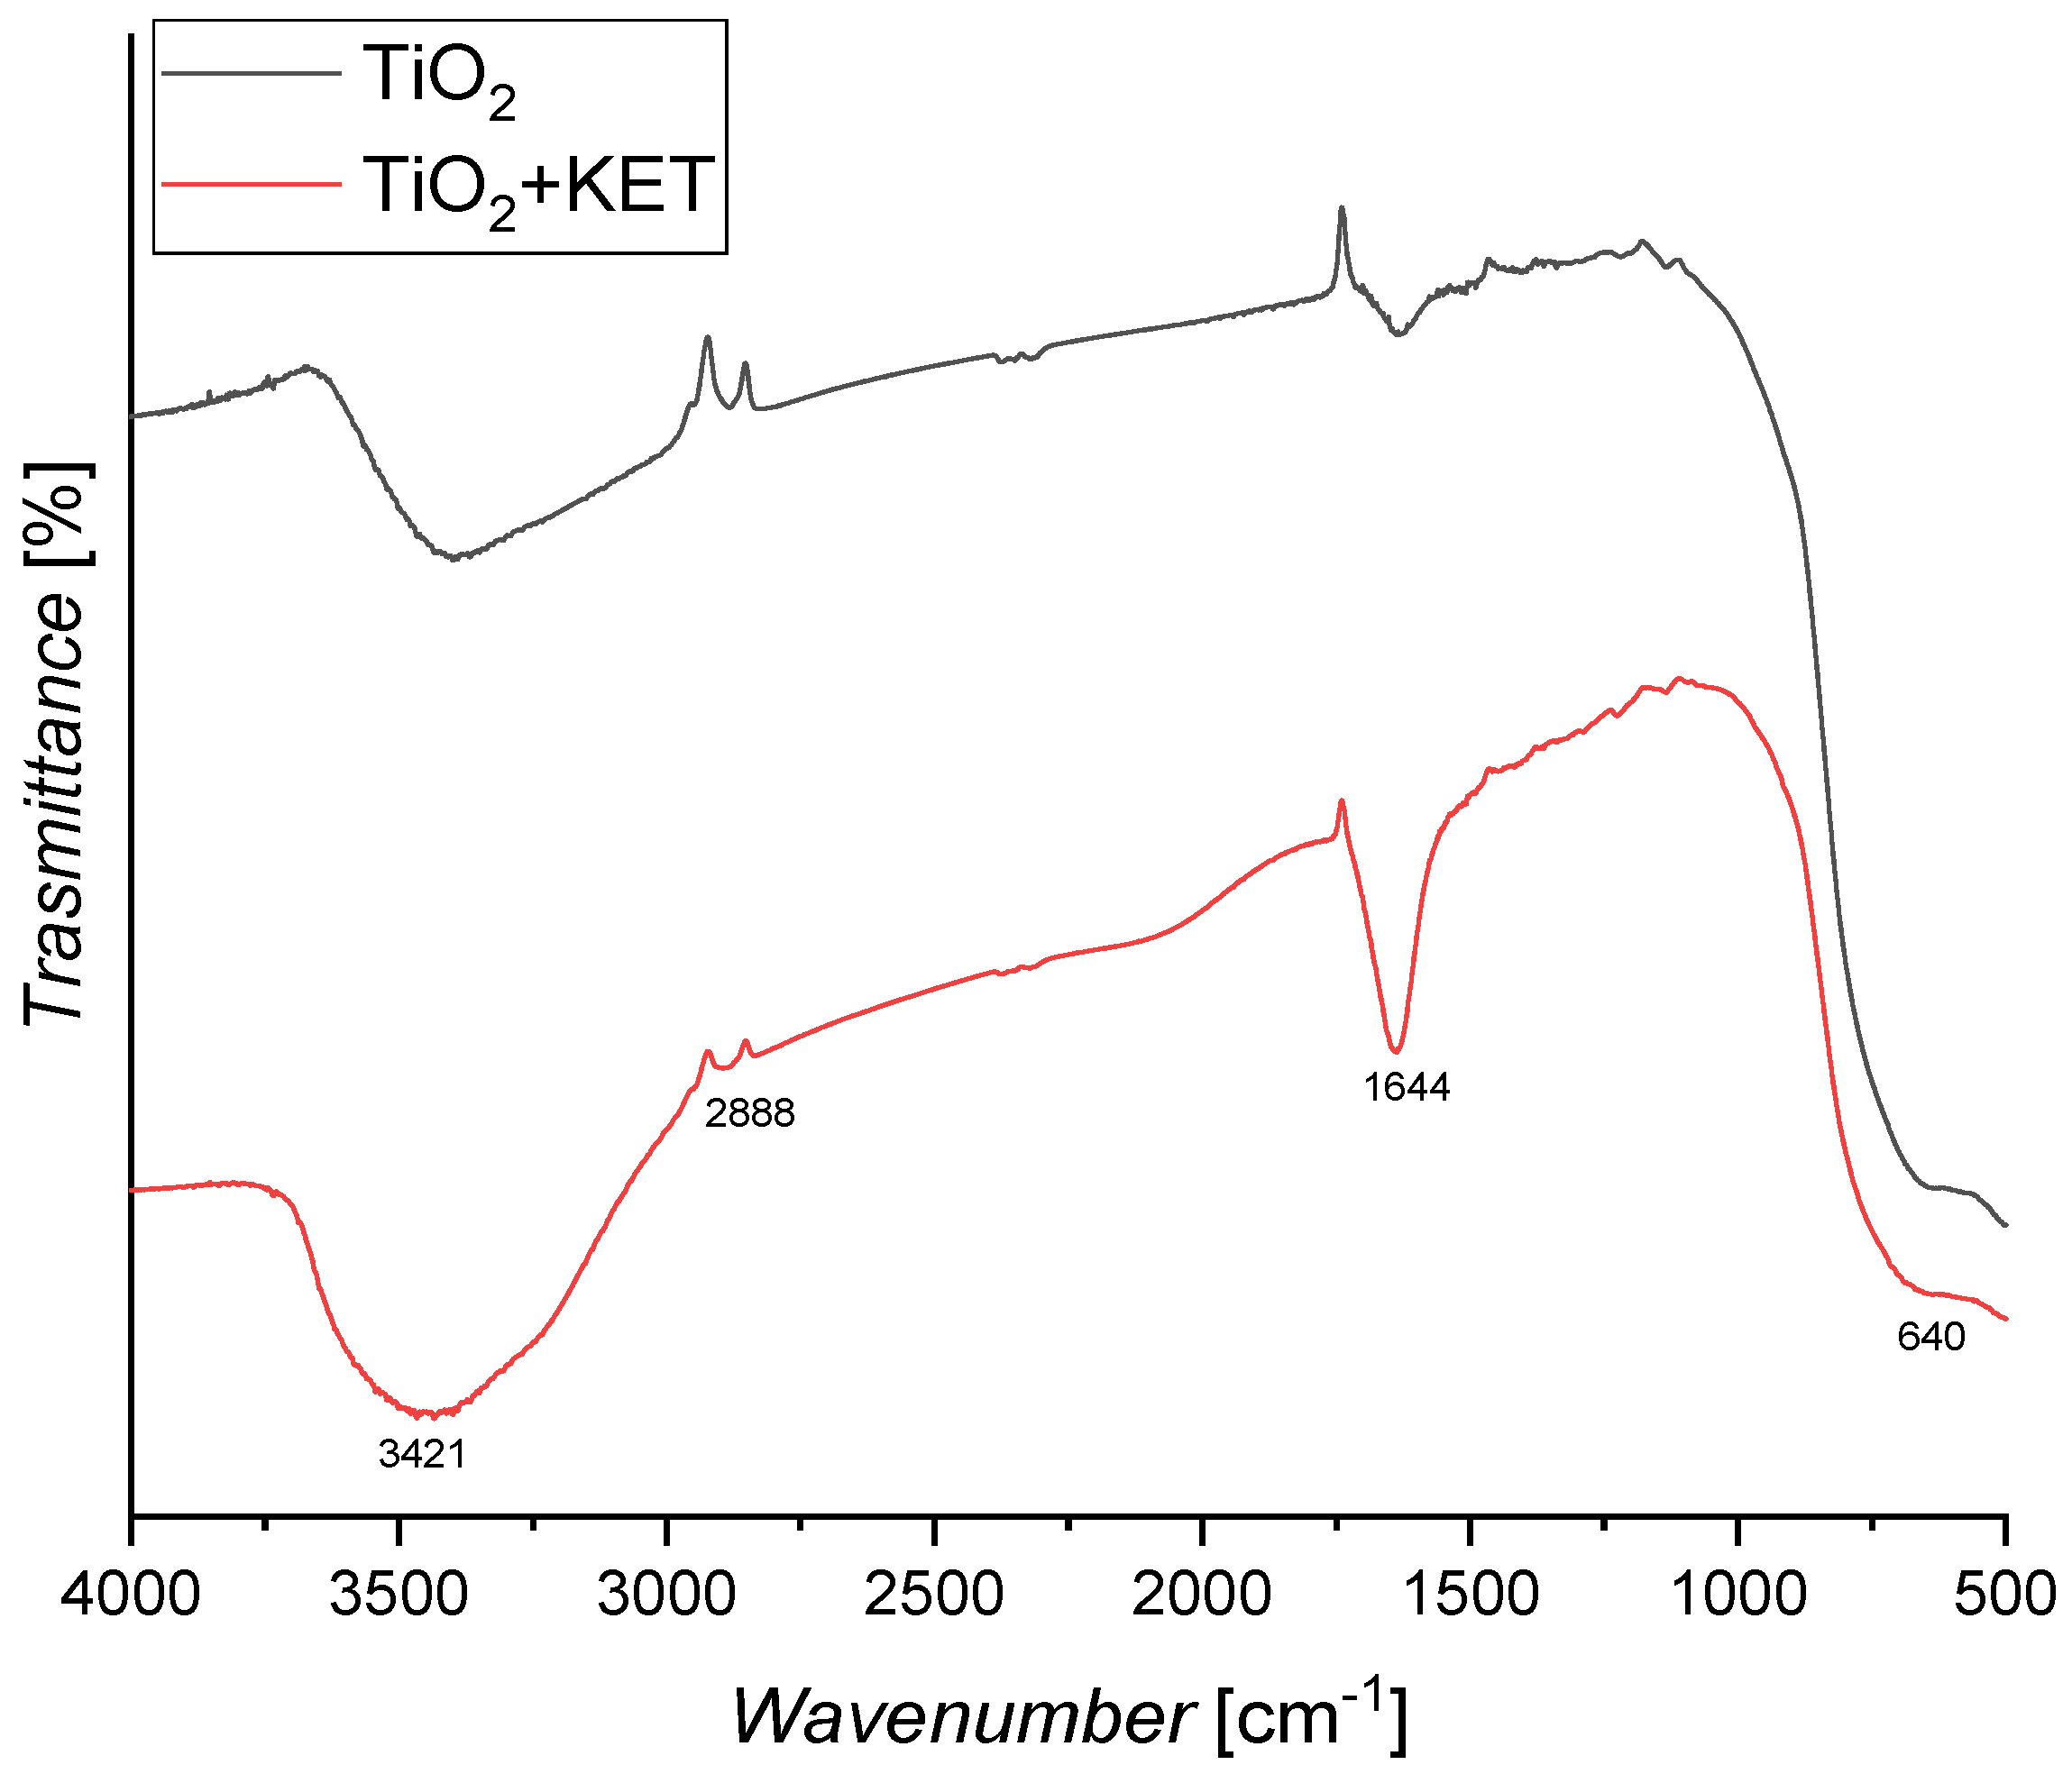
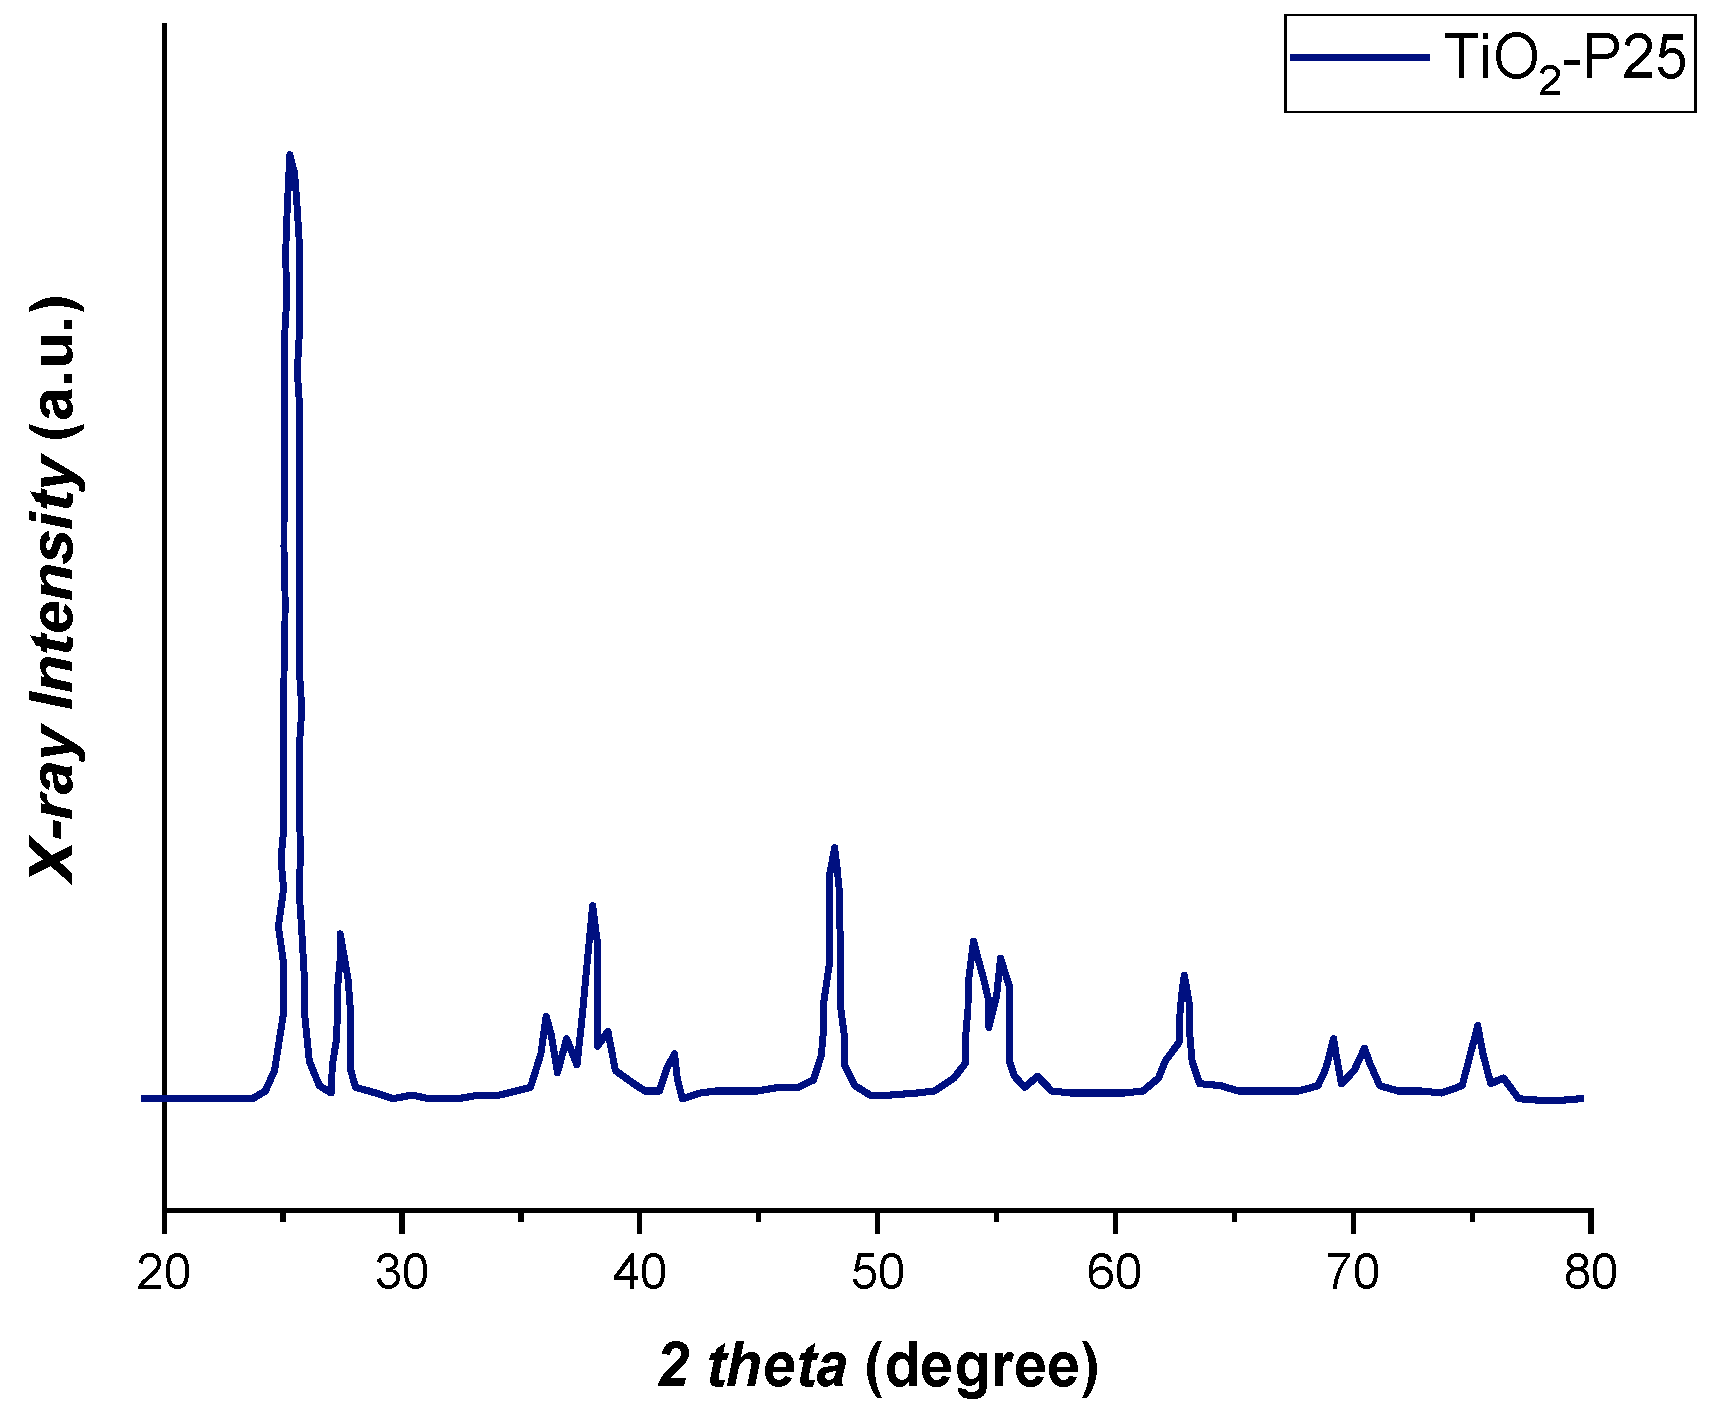
3.4. Results of Catalyst Characterization

FT-IR analysis was performed to understand the functional groups involved in the interaction. In particular, two different spectra: one of the pristine catalyst sample and another of the same sample after contact with a saturated ketoprofen solution (see Figure 10) were obtained.
The spectra show a broad band at 3421 cm−1 due to O-H stretching vibration of surface hydroxyl groups and O-H bending at 1644 cm− 1, which corresponds to the physically absorbed water. Ti–O–Ti stretching is attributed to the 640 cm−1.
No significant change in the FT-IR spectrum is observed when saturating the catalyst with ketoprofen, thus, the interactions could be established between the hydroxyl of the surface and ketoprofen hydroxyls.
SEM micrographs (Figure 11a,b) show that the catalyst TiO2 material consisted of regular aggregates of particles of the order of tens of nm in size. While TEM micrograph (Figure 11c,d) of TiO2 precursor nanoparticles (Aeroxide TiO2 P-25®) were 1–2 nm of regular and spherical shape.
Finally, in Figure 12 X-ray diffraction pattern of the catalyst (TiO2-P25) was reported, as visible, a mixed phase of tetragonal rutile and tetragonal anatase was observed, according to standard diffraction data (JCPDS card No., 00-001-1292) [37].

4. Conclusions

In this paper, the photodegradation kinetics of ketoprofen have been studied using commercial titanium dioxide Aeroxide TiO2 P-25®® catalyst, analyzed under three conditions: in the presence of a UV lamp, in the presence of a VIS lamp, and without any lamp (adsorption). Ketoprofen has been shown to be stable in photodegradation tests in the presence of visible light, while there is a marked photodegradation effect in the presence of UV radiation, giving a KET degradation of 21%. Increasing the sorbent bulk density, an increase in the KET photodegradation was obtained; in fact, with =0.5 g/L, a KET removal of 80% was noted. Furthermore, the degradation rate of ketoprofen is greater when the temperature is set to 303.15 K, representing an exothermic process.
Experimental tests were carried out to understand the photodegradation mechanism varying the initial concentration of ketoprofen in solution. From the data analysis, it was possible to discriminate a mechanism of the Langmuir–Hinshelwood type, where ketoprofen and oxygen were adsorbed on the active sites of the TiO2 catalyst. The model was applied to describe all the collected data, testing both Langmuir–Hinshelwood and Eley–Rideal mechanisms, finding that the first is the most adequate in describing the collected data. The key kinetic and thermodynamic parameters were determined with good reliability.

Supplementary Materials

The following supporting information can be downloaded at: https://www.mdpi.com/article/10.3390/chemengineering8050090/s1, Figure S1: UV-Vis spectrum of Ketoprofen; Figure S2: Calibration curve of Ketoprofen.

Author Contributions

Conceptualization, V.R.; methodology, R.P. and A.V.; software, R.P.; validation, V.R.; formal analysis, V.R., M.T. and M.D.S.; investigation, R.P. and A.V.; resources, M.T. and M.D.S.; data curation, R.P.; writing—original draft preparation, R.P. and V.R.; writing—review and editing, all authors equally; visualization, V.R.; supervision, V.R and R.P.; project administration, V.R., M.D.S. and M.T.; funding acquisition, M.D.S. and M.T. All authors have read and agreed to the published version of the manuscript.

Funding

This research received no external funding.

Data Availability Statement

No data were used.

Conflicts of Interest

The authors declare no conflicts of interest.

List of Symbols

Ciconcentration of component i [mg/L]
Ci,0initial concentration of component i [mg/L]
Eaactivation energy [kJ/mol]
Kiadsorption constant for component i [L/mg]
Ki,refadsorption constant for component i at the reference temperature [L/mg]
k0pre-exponential factor [mg/(L min)]
k′photodegradation kinetic constant [mg/(L min)]
k′refphotodegradation kinetic constant at the reference temperature [mg/(L min)]
k″, k‴, kIVApparent kinetic constants, units depend on reaction
kjkinetic constant for reaction j, units depend on reaction
kj,refkinetic constant for reaction j at the reference temperature, units depend on reaction
kobsobserved kinetic constant [min−1]
kpkinetic constant of photolysis reaction [min−1]
kp,refphotolysis adsorption constant at reference temperature [min−1]
mCATmass of the catalyst [g]
Qflow rate [mL/min]
Rideal gas constant [kJ/(K mol)]
robsobserved reaction rate [mg/(L min)]
rphotodegradation reaction rate [mg/(g min)]
rpphotolysis reaction rate [mg/(L min)]
Ttemperature [K]
ttime [min]
Trefreference temperature, 303.15 [K]
vImpeller stirring rate [rpm]
VLliquid volume [L]
Greek symbols
α, βlumped parameters
ΔHadsorption enthalpy change [kJ/mol]
θifraction of the active sites occupied by the chemical compound i [-]
ρBcatalyst bulk density [g/L]
vistechiometric coefficient of component i [-]
Abbreviations
AOPAdvanced oxidation process
ECsEmerging contaminants
E-REley–Rideal
KETKetoprofen
L-HLangmuir–Hinshelwood
PGeneric photodegradation by-product
PhACsPharmaceutically active compounds
WWTPsWastewater treatment plants

References

  1. Papageorgiou, M.; Zioris, I.; Danis, T.; Bikiaris, D.; Lambropoulou, D. Comprehensive Investigation of a Wide Range of Pharmaceuticals and Personal Care Products in Urban and Hospital Wastewaters in Greece. Sci. Total Environ. 2019, 694, 133565. [Google Scholar] [CrossRef] [PubMed]
  2. Ferrer, I.; Thurman, E.M. Chapter 4—Analysis of Pharmaceuticals in Drinking Water, Groundwater, Surface Water, and Wastewater. In Comprehensive Analytical Chemistry; Petrovic, M., Barcelo, D., Pérez, S., Eds.; Elsevier: Amsterdam, The Netherlands, 2013; Volume 62, pp. 91–128. [Google Scholar] [CrossRef]
  3. Eniola, J.O.; Kumar, R.; Barakat, M.A.; Rashid, J. A Review on Conventional and Advanced Hybrid Technologies for Pharmaceutical Wastewater Treatment. J. Clean. Prod. 2022, 356, 131826. [Google Scholar] [CrossRef]
  4. Madi-Azegagh, K.; Yahiaoui, I.; Boudrahem, F.; Aissani-Benissad, F.; Vial, C.; Audonnet, F.; Favier, L. Applied of Central Composite Design for the Optimization of Removal Yield of the Ketoprofen (KTP) Using Electrocoagulation Process. Sep. Sci. Technol. 2019, 54, 3115–3127. [Google Scholar] [CrossRef]
  5. Yurdakal, S.; Loddo, V.; Augugliaro, V.; Berber, H.; Palmisano, G.; Palmisano, L. Photodegradation of Pharmaceutical Drugs in Aqueous TiO2 Suspensions: Mechanism and Kinetics. Catal. Today 2007, 129, 9–15. [Google Scholar] [CrossRef]
  6. Hunge, Y.M.; Yadav, A.A.; Kang, S.-W.; Mohite, B.M. Role of Nanotechnology in Photocatalysis Application. Recent Pat. Nanotechnol. 2023, 17, 5–7. [Google Scholar] [CrossRef] [PubMed]
  7. Yadav, A.A.; Hunge, Y.M.; Mathe, V.L.; Kulkarni, S.B. Photocatalytic Degradation of Salicylic Acid Using BaTiO3 Photocatalyst under Ultraviolet Light Illumination. J. Mater. Sci. Mater. Electron. 2018, 29, 15069–15073. [Google Scholar] [CrossRef]
  8. Yu, Y.; Yang, Q.; Wang, Z.; Ding, Q.; Li, M.; Fang, Y.; He, Q.; Zhu, Y.Z. The Anti-Inflammation and Anti-Nociception Effect of Ketoprofen in Rats Could Be Strengthened through Co-Delivery of a H2S Donor, S-Propargyl-Cysteine. J. Inflamm. Res. 2021, 14, 5863–5875. [Google Scholar] [CrossRef]
  9. Wang, J.; Zhao, S.; Zhang, M.; He, B. Targeted Eco-Pharmacovigilance for Ketoprofen in the Environment: Need, Strategy and Challenge. Chemosphere 2018, 194, 450–462. [Google Scholar] [CrossRef]
  10. Feng, L.; van Hullebusch, E.D.; Rodrigo, M.A.; Esposito, G.; Oturan, M.A. Removal of Residual Anti-Inflammatory and Analgesic Pharmaceuticals from Aqueous Systems by Electrochemical Advanced Oxidation Processes. A review. Chem. Eng. J. 2013, 228, 944–964. [Google Scholar] [CrossRef]
  11. Onchoke, K.K.; Lopez, G.; Broom, A.M. Detection of Carbamazepine, Diclofenac, and Ketoprofen via a SPE-HPLC-PDA Method in a Municipal Wastewater Treatment Plant in East Texas, USA. Anal. Chem. Lett. 2023, 13, 127–140. [Google Scholar] [CrossRef]
  12. Jelic, A.; Gros, M.; Ginebreda, A.; Cespedes-Sánchez, R.; Ventura, F.; Petrovic, M.; Barcelo, D. Occurrence, Partition and Removal of Pharmaceuticals in Sewage Water and Sludge during Wastewater Treatment. Water Res. 2011, 45, 1165–1176. [Google Scholar] [CrossRef] [PubMed]
  13. Spongberg, A.L.; Witter, J.D.; Acuña, J.; Vargas, J.; Murillo, M.; Umaña, G.; Gómez, E.; Perez, G. Reconnaissance of Selected PPCP Compounds in Costa Rican Surface. Water Res. 2011, 45, 6709–6717. [Google Scholar] [CrossRef]
  14. Bendz, D.; Paxéus, N.A.; Ginn, T.R.; Loge, F.J. Occurrence and Fate of Pharmaceutically Active Compounds in the Environment, a Case Study: Höje River in Sweden. J. Hazard. Mater. 2005, 122, 195–204. [Google Scholar] [CrossRef] [PubMed]
  15. Mantas, A.; Labbe, V.; Loryan, I.; Mihranyan, A. Amorphisation of Free Acid Ibuprofen and Other Profens in Mixtures with Nanocellulose: Dry Powder Formulation Strategy for Enhanced Solubility. Pharmaceutics 2019, 11, 68. [Google Scholar] [CrossRef]
  16. Albornoz Marin, S.L.; de Oliveira, S.C.; Peralta-Zamora, P. Photocatalytic Degradation of Phenol by Core–Shell Cu@TiO2 Nanostructures under Visible Radiation. J. Photochem. Photobiol. Chem. 2022, 433, 114129. [Google Scholar] [CrossRef]
  17. Hao, X.; Li, H.; Zhang, Z.; Fan, C.; Liu, S.; Sun, Y. Modeling and Experimentation of a Novel Labyrinth Bubble Photoreactor for Degradation of Organic Pollutant. Chem. Eng. Res. Des. 2009, 87, 1604–1611. [Google Scholar] [CrossRef]
  18. Mofokeng, L.E.; Hlekelele, L.; Tetana, Z.N.; Moma, J.; Chauke, V.P. CuO-doped TiO2 Supported on Graphitic Carbon Nitride for the Photodegradation of Ketoprofen in Drinking and Groundwater: Process Optimization and Energy Consumption Evaluation. ChemistrySelect 2022, 7, e202101847. [Google Scholar] [CrossRef]
  19. Djouadi, L.; Khalaf, H.; Boukhatem, H.; Boutoumi, H.; Kezzime, A.; Santaballa, J.A.; Canle, M. Degradation of Aqueous Ketoprofen by Heterogeneous Photocatalysis Using Bi2S3/TiO2–Montmorillonite Nanocomposites under Simulated Solar Irradiation. Appl. Clay Sci. 2018, 166, 27–37. [Google Scholar] [CrossRef]
  20. Mofokeng, L.E.; Hlekelele, L.; Moma, J.; Tetana, Z.N.; Chauke, V.P. Energy-Efficient CuO/TiO2@GCN Cellulose Acetate-Based Membrane for Concurrent Filtration and Photodegradation of Ketoprofen in Drinking and Groundwater. Appl. Sci. 2022, 12, 1649. [Google Scholar] [CrossRef]
  21. Suárez-Escobar, A.; Rodríguez-González, V.; Gallardo-Vega, C.; Sarria, E.; Clavijo, L. Ketoprofen Degradation by Surface Reactive Species on TiO2, AgxOy/MoxOy/Catalysts. Mater. Lett. 2021, 294, 129687. [Google Scholar] [CrossRef]
  22. Sun, J.; Feng, S.; Feng, S. Hydrothermally Synthesis of MWCNT/N-TiO2/UiO-66-NH2 Ternary Composite with Enhanced Photocatalytic Performance for Ketoprofen. Inorg. Chem. Commun. 2020, 111, 107669. [Google Scholar] [CrossRef]
  23. Piątkowska, A.; Szymański, K.; Mozia, S. Effect of Sulfur on the Solar Light Photoactivity of TiO2-Based Photocatalysts. Chem. Eng. Res. Des. 2023, 195, 721–731. [Google Scholar] [CrossRef]
  24. Piątkowska, A.; Moszyński, D.; Mozia, S. Enhanced Solar Light Photocatalytic Activity of TiO2 Modified with Ammonium Carbamate for the Removal of Ketoprofen from Water. J. Water Process Eng. 2023, 56, 104534. [Google Scholar] [CrossRef]
  25. Sacco, O.; Murcia, J.J.; Lara, A.E.; Hernández-Laverde, M.; Rojas, H.; Navío, J.A.; Hidalgo, M.C.; Vaiano, V. Pt–TiO2–Nb2O5 Heterojunction as Effective Photocatalyst for the Degradation of Diclofenac and Ketoprofen. Mater. Sci. Semicond. Process. 2020, 107, 104839. [Google Scholar] [CrossRef]
  26. Yetti, R.D.; Safni; Rivai, H. Photo Degradation of Ketoprofen Using Titanium Dioxide as Catalyst. IJRDO—J. Biol. Sci. 2017, 3, 30–45. [Google Scholar]
  27. Martínez, C.; Vilariño, S.; Fernández, M.I.; Faria, J.L.M.C.; Santaballa, J.A. Mechanism of Degradation of Ketoprofen by Heterogeneous Photocatalysis in Aqueous Solution. Appl. Catal. B Environ. 2013, 142–143, 633–646. [Google Scholar] [CrossRef]
  28. Qin, X.; Jing, L.; Tian, G.; Qu, Y.; Feng, Y. Enhanced Photocatalytic Activity for Degrading Rhodamine B Solution of Commercial Degussa P25 TiO2 and Its Mechanisms. J. Hazard. Mater. 2009, 172, 1168–1174. [Google Scholar] [CrossRef]
  29. Vijayabalan, A.; Selvam, K.; Velmurugan, R.; Swaminathan, M. Photocatalytic Activity of Surface Fluorinated TiO2-P25 in the Degradation of Reactive Orange 4. J. Hazard. Mater. 2009, 172, 914–921. [Google Scholar] [CrossRef] [PubMed]
  30. Zielińska, B.; Grzechulska, J.; Grzmil, B.; Morawski, A.W. Photocatalytic Degradation of Reactive Black 5: A Comparison between TiO2-Tytanpol A11 and TiO2-Degussa P25 Photocatalysts. Appl. Catal. B Environ. 2001, 35, L1–L7. [Google Scholar] [CrossRef]
  31. Kanan, S.; Moyet, M.A.; Arthur, R.B.; Patterson, H.H. Recent Advances on TiO2-Based Photocatalysts toward the Degradation of Pesticides and Major Organic Pollutants from Water Bodies. Catal. Rev. 2020, 62, 1–65. [Google Scholar] [CrossRef]
  32. Romeiro, A.; Azenha, M.E.; Canle, M.; Rodrigues, V.H.N.; Da Silva, J.P.; Burrows, H.D. Titanium Dioxide Nanoparticle Photocatalysed Degradation of Ibuprofen and Naproxen in Water: Competing Hydroxyl Radical Attack and Oxidative Decarboxylation by Semiconductor Holes. ChemistrySelect 2018, 3, 10915–10924. [Google Scholar] [CrossRef]
  33. Melcher, J.; Feroz, S.; Bahnemann, D. Comparing Photocatalytic Activities of Commercially Available Iron-Doped and Iron-Undoped Aeroxide TiO2 P25 Powders. J. Mater. Sci. 2017, 52, 6341–6348. [Google Scholar] [CrossRef]
  34. Szabó, R.K.; Megyeri, C.; Illés, E.; Gajda-Schrantz, K.; Mazellier, P.; Dombi, A. Phototransformation of Ibuprofen and Ketoprofen in Aqueous Solutions. Chemosphere 2011, 84, 1658–1663. [Google Scholar] [CrossRef] [PubMed]
  35. Fogler, H.S. Elements of Chemical Reaction Engineering; Prentice Hall PTR: Hoboken, NJ, USA, 2006; ISBN 978-0-13-047394-3. [Google Scholar]
  36. Akpotu, S.O.; Oseghe, E.O.; Ayanda, O.S.; Skelton, A.A.; Msagati, T.A.M.; Ofomaja, A.E. Photocatalysis and Biodegradation of Pharmaceuticals in Wastewater: Effect of Abiotic and Biotic Factors. Clean Technol. Environ. Policy 2019, 21, 1701–1721. [Google Scholar] [CrossRef]
  37. Nabil, S.; Hammad, A.S.; El-Bery, H.M.; Shalaby, E.A.; El-Shazly, A.H. The CO2 Photoconversion over Reduced Graphene Oxide Based on Ag/TiO2 Photocatalyst in an Advanced Meso-Scale Continuous-Flow Photochemical Reactor. Environ. Sci. Pollut. Res. 2021, 28, 36157–36173. [Google Scholar] [CrossRef] [PubMed]
Figure 1. Reaction system sketch. 1 UV or Vis lamp, 2 batch reactor, 3 stirring plates, 4 ultra-thermostat, 5 digital flowmeter regulator.
Chemengineering 08 00090 g001
Figure 2. Ketoprofen degradation effect of adsorption, UV, and Vis light. T = 303.15 K, v = 750 rpm, CKET,0 = 12.6 mg/L, Q = 50 mL/min, ρB = 0.5 g/L, t = 300 min.
Chemengineering 08 00090 g002
Figure 3. (a) CKET/CKET,0 ratio to compare the tests with different amounts of catalyst in time. T = 303.15 K C, v = 750 rpm, CKET,0 = 12.6 mg/L, Q = 50 mL/min, UV radiation. Symbols represent the experimental data, lines the model predictions adopting the Langmuir–Hinshelwood mechanism. (b) Percentage of KET degradation obtained increasing the amount of catalyst in the solution.
Chemengineering 08 00090 g003
Figure 4. Photodegradation kinetics of ketoprofen changing the initial concentration: T = 303.15 K, v = 750 rpm, Q = 50 mL/min, ρB = 0.5 g/L. Symbols represent the experimental data, lines the model predictions adopting the Langmuir–Hinshelwood mechanism.
Chemengineering 08 00090 g004
Figure 5. Kinetic tests at different temperature: T = 293.15, 303.15, and 313.15 K, v = 750 rpm, CKET,0 = 12.6 mg/L, Q = 50 mL/min, ρB = 0.5 g/L. Symbols represent the experimental data, lines the model predictions adopting the Langmuir–Hinshelwood mechanism.
Chemengineering 08 00090 g005
Figure 6. Observed reaction rate as a function of the catalyst bulk density.
Chemengineering 08 00090 g006
Figure 7. Observed reaction rate as a function of the initial concentration of ketoprofen.
Chemengineering 08 00090 g007
Figure 8. Experimental Arrhenius plot.
Chemengineering 08 00090 g008
Figure 9. Parity plot of CKET/CKET,0, including all the collected data of the kinetic experiments for (a) L-H, and (b) the E-R model.
Chemengineering 08 00090 g009
Figure 10. FT−IR analysis of TiO2 P-25 catalyst and saturated TiO2 P-25 catalyst.
Chemengineering 08 00090 g010
Figure 11. TEM (a,b) and SEM (c,d) micrographs of TiO2 P-25 catalyst.
Chemengineering 08 00090 g011
Figure 12. X-ray diffraction patterns of the catalyst TiO2-P25.
Chemengineering 08 00090 g012
Table 1. Physicochemical properties of ketoprofen [15].
CompoundIUPAC NameMolecular FormulaMolecular WeightSolubility in WaterpKaStructure
KET2-(3-benzoylphenyl)-propanoic acidC13H18O2206.28 g/mol51 mg/L
(at 22 °C)
4.75Chemengineering 08 00090 i001
Table 2. Present research on the photocatalytic activity of commercial and synthesized TiO2-P25®® towards the photodegradation of KET.
CatalystExperimental
Conditions
Light Source and Photodegradation DegreeSystemReference
TiO2-P25 CKET = 7.0–15.7 mg/L
Vsol = 1 L
ρB = 0.20–0.50 g/L
t = 300 min
UV-A = 78%
Visible light = 21%
Batch reactor[present work]
TiO2t = 120 min
Vsol = 10 mL
CKET = 10 mg/L
ρB = 0.50 g/L
UV-A = 22.75%
UV-C = 61.12%
Petri dish[26]
0.9-S-TiO2CKET = 10 mg/L
ρB = 1 g/L
t = 5 and 24 h
Solar light = 23–29% (5 h) and 65–73% (24 h)Batch reactor[23]
TiO2:ACM (wt.%) =
9:1–5:5
CKET = 10 mg/L
ρB = 1 g/L
t = 5 and 24 h
Solar light = 29–72% (24 h)
Visible light = 6–10% (24 h)
UV radiation = 100% (5 h)
Batch reactor[24]
1%CuOx/TiO2
TiO2@GCN(1:9)
CKET = 10 mg/L
t = 120 min
mcat = 75 mg
Visible light = 94.7%Solar
simulator
[18]
Bi2S3/TiO2(%): (25/75)- Mt CKET = 15 mg/L
ρB = 0.50 g/L
t = 120 min
Vsol = 200 mL
UV–Vis irradiation (<366 nm) = 100%Batch reactor[19]
1%CuO/TiO2@GCN
(9:1)
Catalyst/wt% = 0.50
CKET = 10 mg/L
t = 300 min
Visible light = 83.7%Membrane reactor[20]
MoO3/AgO TiO2CKET = 200 mg/L
t = 180 min
Catalyst/wt% = 0.50%
UV light = 63–67%350 mL quartz reactor[21]
MWCNT/N-TiO2/UiO-66-NH2 (3:7)CKET = 50 mg/L
t = 120 min
Vsol = 100 mL
ρB = 0.25 g/L
Visible light = 96%Batch reactor[22]
Pt–TiO2–Nb2O5Vsol = 100 mL
ρB = 0.5 g/L
CKET = 12.5 mg/L
t = 60 min
UV light = 100%Batch reactor[25]
Table 3. Physicochemical properties of Aeroxide TiO2 P-25® [33].
PropertyValue
Composition80% anatase, 20% rutile
Density (g/cm3)3.8
BET surface area (m2g−1)55
Mean particle size (nm)21
pH in aqueous particle 3–4
PorosityNon-porous
Table 4. Experimental conditions used for ketoprofen photodegradation kinetics.
TestQ [mL/min]VL
[L]
ρB
[g/L]
CKET,0 [mg/L]pHv
[rpm]
T
[K]
Light Source
1501-12.64.6750303.15VIS
2501-12.64.6750303.15UV
35010.5112.64.6750303.15-
45010.5112.64.6750303.15UV
55010.5212.64.6750303.15VIS
65010.3012.64.6750303.15UV
75010.2012.64.6750303.15UV
85010.5215.74.3750303.15UV
95010.527.07.0750303.15UV
105010.5012.64.6750293.15UV
115010.5112.64.6750313.15UV
Table 5. Results of the parameter estimation analysis for the two tested models. Tref = 303.15 K.
Modelkp,ref
[min−1]
k′ref
[mg/(L min)]
KKET,ref
[L/mg]
KP,ref
[L/mg]
KO2CO2
[-]
Ea
[kJ/mol]
ΔH
[kJ/mol]
L-H(1.0 ± 0.1)·10−3118.5 ± 0.311 ± 140.2 ± 0.2177 ± 2100 ± 5−410 ± 3
E-R(1.0 ± 0.1)·10−380 ± 1011 ± 8(2 ± 7)·104(3 ± 6)·104240 ± 100−500 ± 80
Disclaimer/Publisher’s Note: The statements, opinions and data contained in all publications are solely those of the individual author(s) and contributor(s) and not of MDPI and/or the editor(s). MDPI and/or the editor(s) disclaim responsibility for any injury to people or property resulting from any ideas, methods, instructions or products referred to in the content.

