Article

Flood Peaks and Geomorphic Processes in an Ephemeral Mediterranean Stream: Torrent de Sant Jordi (Pollença, Mallorca)

by
Miquel Grimalt-Gelabert
1 and
Joan Rosselló-Geli
2,*
1
Departament de Geografia, Universitat de les Illes Balears, 07122 Palma, Spain
2
Grup de Recerca Climaris, Universitat de les Illes Balears, 07122 Palma, Spain
*
Author to whom correspondence should be addressed.
Hydrology 2023, 10(7), 152; https://doi.org/10.3390/hydrology10070152
Submission received: 27 June 2023 / Revised: 15 July 2023 / Accepted: 18 July 2023 / Published: 20 July 2023

Abstract

:
The research presented herein studies three episodes of flooding that affected the ephemeral basin of the Sant Jordi stream in northwestern Mallorca. These events are considered common since they do not reach the proportions in terms of the flow rates of other cases that have occurred in Mallorca, but they are nevertheless important due to the impact they have on human activity and also due to the morphological changes caused in the basin itself. On the one hand, the development of the field work to characterize and calculate the peak flows is presented, and on the other hand, the geomorphic changes caused by the water and the materials carried away are explained. The results allow us to identify a type of Mediterranean flood, which happens on a regular basis, but which does not stand out for its flows or for its major socio-economic impacts but still has an effect on the natural and anthropic environment. This information can be valuable for local and regional authorities as well as for the public to avoid risk situations and prevent impacts on public and private property caused by future events.

1. Introduction

Floods are one of the main hazards affecting the world, causing large damage and loss of life. Worldwide, flood-related damage estimation reached USD 651 billion between 2000 and 2019 [1]. In 2022 alone, 387 disasters were identified, with 176 being floods causing over 30,000 fatalities and billions in economic losses [2]. While major floods are the main cause of fatalities and damage, there are also other types of events that are comparatively smaller but not less damaging [3,4]. Climate change trends increases the expected impact of flood episodes as the frequency and severity of their occurrence grows exponentially but unevenly, as the spatiotemporal variation of floods, regarding frequency and magnitude, may increase in some areas, while in other places it may decrease [5,6].
Flooding is the result of a combination of meteorological factors and the human occupation of land. Changes in land use and climatic conditions increase the exposure to floods, expected to grow by mid-century [7]. One of the main changes regarding land use has been the increase in urbanization, a global trend that enlarges human exposure to the flood risk while affecting hydrological processes [8,9].
Europe has been largely impacted by floods, as historical records show [10,11]. In the past decades, urbanization and land occupation in flood-prone areas has increased, thus increasing the risk zones and the impacts from flooding [12,13]. As a consequence of damaging floods at the start of the 21st century, the European Union implemented the 2007/60 flood directive, aimed to reduce the flood risk within the EU countries promoting the assessment and management of flood risk and increasing awareness through the mapping of all those areas where significant floods could take place [14]. Within Europe, the Mediterranean region is at significant risk from floods due to their frequency and effects [15]. While in large parts of Europe, floods are related to overflowing rivers, in the Mediterranean area, the most common events are the so-called flash floods [16]. Several studies have analyzed the occurrence of flash floods in the Mediterranean basin [17,18] and their impact [19,20,21].
Riverine floods are often well documented and studied, while flash floods are usually poorly observed hydrological extremes [22]. This is because flash floods usually affect small and medium size catchments that are not gauged. In addition, the response time of these events is very short, usually less than 24 h, which makes it difficult to forecast and study them [23,24]. Thus, it is often necessary to study the development of flash floods after the event, in terms of both hydro-meteorological factors and the related impacts [25,26,27,28], even if the development of computing and numerical methods allows the use of integrated forecasting of weather datasets and hydrological models with the aim of improving flood prediction and analysis [29,30].
The Spanish Mediterranean coast has suffered important flash floods in the past, as shown in [31,32,33], but they are still a risk for the population and its properties, as recent episodes have shown, causing great damage both in economic terms and human lives [34,35,36,37]. The lack of data, so common for this type of event, makes it necessary to analyze what happened a posteriori. In this regard, there is also an extensive set of research at both regional and local levels, studying both highly localized episodes and cases of wider geographical scope [38,39,40,41,42,43].
The aim of the research presented here is to show the methods used for the post-event analysis of flash flood episodes in an ungauged basin, both the field research developed and the flood peak calculations using equations, which have already been presented by other scientists in other parts of the world but not applied in Mallorca. In that sense, the contribution of this paper is related to the evaluation of such methods regarding its usefulness, thus allowing its future use to study flood events in ungauged torrential catchments. Moreover, the episodes herein presented can be qualified as common, but they are nonetheless a risk for the population that is affected, even if the flow peaks are low. The research analyzes as well the runoff impact within the catchment, focusing on the associated processes and highlighting the damage that small to medium flood peaks can cause in a flood-prone island such as Mallorca. This can be considered another contribution of the paper, stating the importance of low- or medium-level events that may go unnoticed at a larger spatial level but have impacts on a small level, usually local.

2. Materials and Methods

2.1. Research Area

The research area is one of the catchments of the northwestern basin of Mallorca. It is made up of a series of streams that flow into the bay of Pollença. These are ephemeral courses, characteristic of the Mediterranean basin, which drain in a southwesternnortheastern direction. Topographically, the basin is surrounded by a set of mountainous alignments between which are interspersed longitudinal valleys open to the sea. The terrain is basically calcareous and subject to intense karstification, which is reflected in the presence of numerous caves and chasms as well as areas that favor an active infiltration of surface water.
The main catchment of the basin is the torrent de Sant Jordi, which runs towards the sea close to the town of Pollença. With a surface of 42.3 km2, the main channel is the result of the combination of two smaller catchments, torrent de la vall de’n Marc and torrent de Ternelles and has a total length of 17,500 m (Figure 1). From a geomorphological point, it is one of the most complex and evolved basins on the island, with a bed embedded between the sediments brought by the water and a very active torrential dynamic that stands out for the removal of a large amount of stones and rocks, used in the area as building material. Another trend is the alternation of stretches of the course in which water flows regularly for days after heavy rainfall, and others in which it puddles and disappears as there is a sub-surface flow, giving the impression of a dry riverbed.
The area climate is Mediterranean, but it has a significant average annual rainfall, which exceeds 1000 mm in the headwater areas. Rainfall is concentrated in the cold season of the year, especially in autumn, while it is scarce in summer, especially in June and July. Torrential episodes are particularly frequent, so that between 1940 and 2010, up to 10 episodes have been recorded in which it rained more than 200 mm in 24 h in the basin’s rain gauges, a figure that rises to 13 if gauges located in the vicinity are taken into account. Some of these episodes have recorded accumulated rainfall of up to 484.5 mm, as was the case in the storm of 6–9 October 1958 [44].
One of the effects of those torrential rainfall events is the occurrence of flooding events in which ephemeral streambeds are overwhelmed by runoff, affecting nearby areas. Such floods can be differentiated according to their magnitude and frequency. On the one hand, there are those common events of low impact but higher frequency that cause minor damage such as the flooding of crop fields and built-up areas as well as negative effects on communications [45]. On the other hand, there are floods of greater magnitude but occurring less frequently, which cause major impacts such as the destruction of bridges and other infrastructure as well as widespread damage in urban and agricultural areas.

2.2. Methodology and Data

As stated before, the catchment is ungauged, which implies that obtaining reliable flood data is a scientific challenge because there are not records to validate the obtained results [46]. The post-event research method is the result of previous experience, starting after the large floods of 1989 in SE Mallorca [47]. This methodology has been used to calculate flood peaks discharges in 14 research projects funded by the Balearic Islands regional government and used for internal purposes related to flood management.
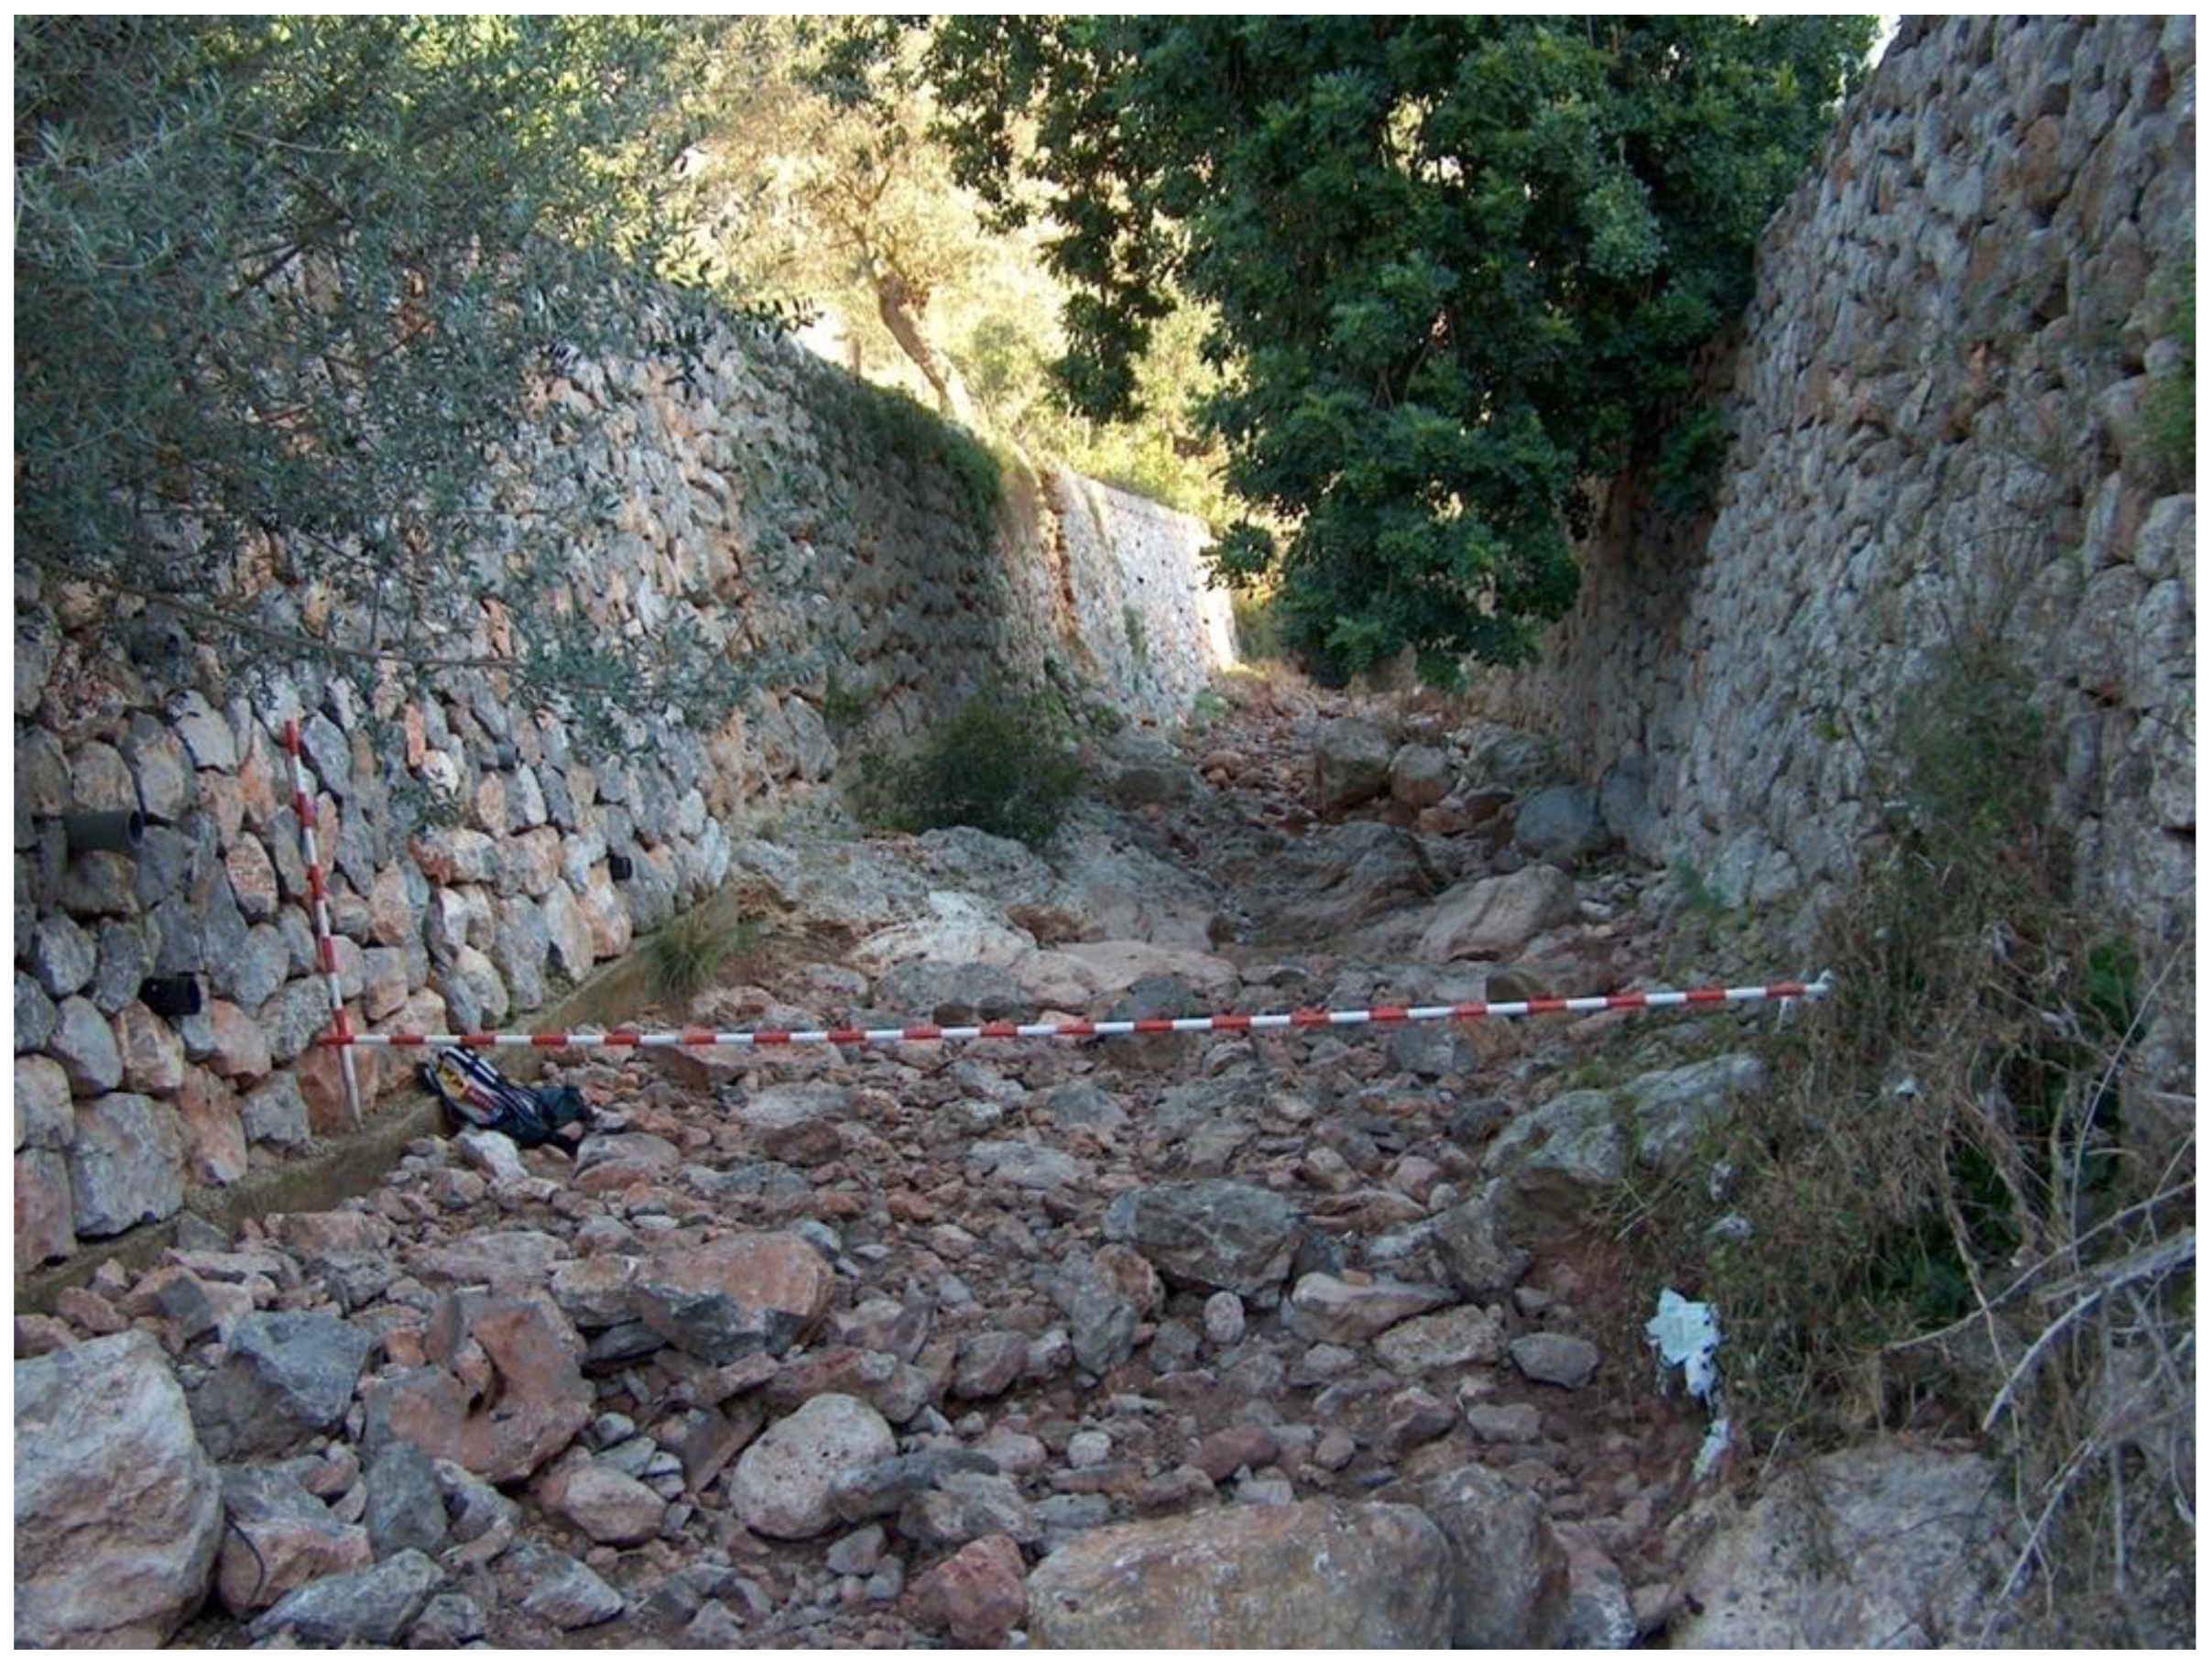
Similar flood peak calculations are presented in several international papers, thereby validating its use [48,49,50,51,52,53]. The survey process to gather data is structured according to specific steps. The first one consists of the construction of a complete model of the catchment in DTM format with a 2.5 m resolution, which makes it possible to identify the main channel and the different tributaries that make up the torrential river complex. A second step, just after the event, is the location of the measurement points along the stream channels. Once the flood ended, the research team started the field research with the aim of identifying entry points towards the streambeds where the measurements could be taken. This leads to a third step, the cross-channel measurements to gather data about channel slope, water width, and water depth using flood marks such as vegetal debris or marks in the banks. The cross-sections are subdivided in homogenous subsections to calculate the flow velocity (Figure 2). The measurement points were selected sequentially from the headwaters towards the mouth of the streams. All the points were located in straight stretches devoid of possible disturbing elements such as fords or bridges (Figure 3).
The data obtained during the field surveys allow obtaining the flood discharge of each event by using indirect methods. To do so, the field values (water depth and width) must be converted to flood peaks using hydraulic equations based on one-dimensional open channel calculations [27]. In that sense, the research herein presented used different equations to quantify the maximum discharge values recorded at every event.
On the one hand, there are the formulations from Riggs [54] and Williams [55], which determine the peak flow from the slope and mean cross-sections of the watercourse. Riggs’ equation is used when the flow runs within the boundaries of the main channel and is
Qr = 3.39At1.39S0.32,
where Qr is the maximum peak (m3/s), At is the cross-section (m2), and S is the section slope (m/m).
The following expression is the Williams equation that allows the calculation of flows when inundation plains are identified during the event:
Qw = 4.0At 1.21S0.28,
where Qw is the maximum peak (m3/s), At is the cross-section (m2), and S is the section slope (m/m).
On the other hand, the equation from Costa allows quantifying the average water velocity (critical velocity) from the diameter of the boulders carried away [56]. Finally, a modified Manning’s equation is used for channels with a slope larger than 0.002 m/m [57].
Vc = 0.18Dm0.49,
where VC is the critical velocity and Dm is the medium diameter of the measured boulders.
The formula used to calculate the modified Manning’s equation is as follows:
V = 3.17R0.83S0.12
where V is the velocity, R is the hydraulic radius (m), and S is the section slope (m/m).
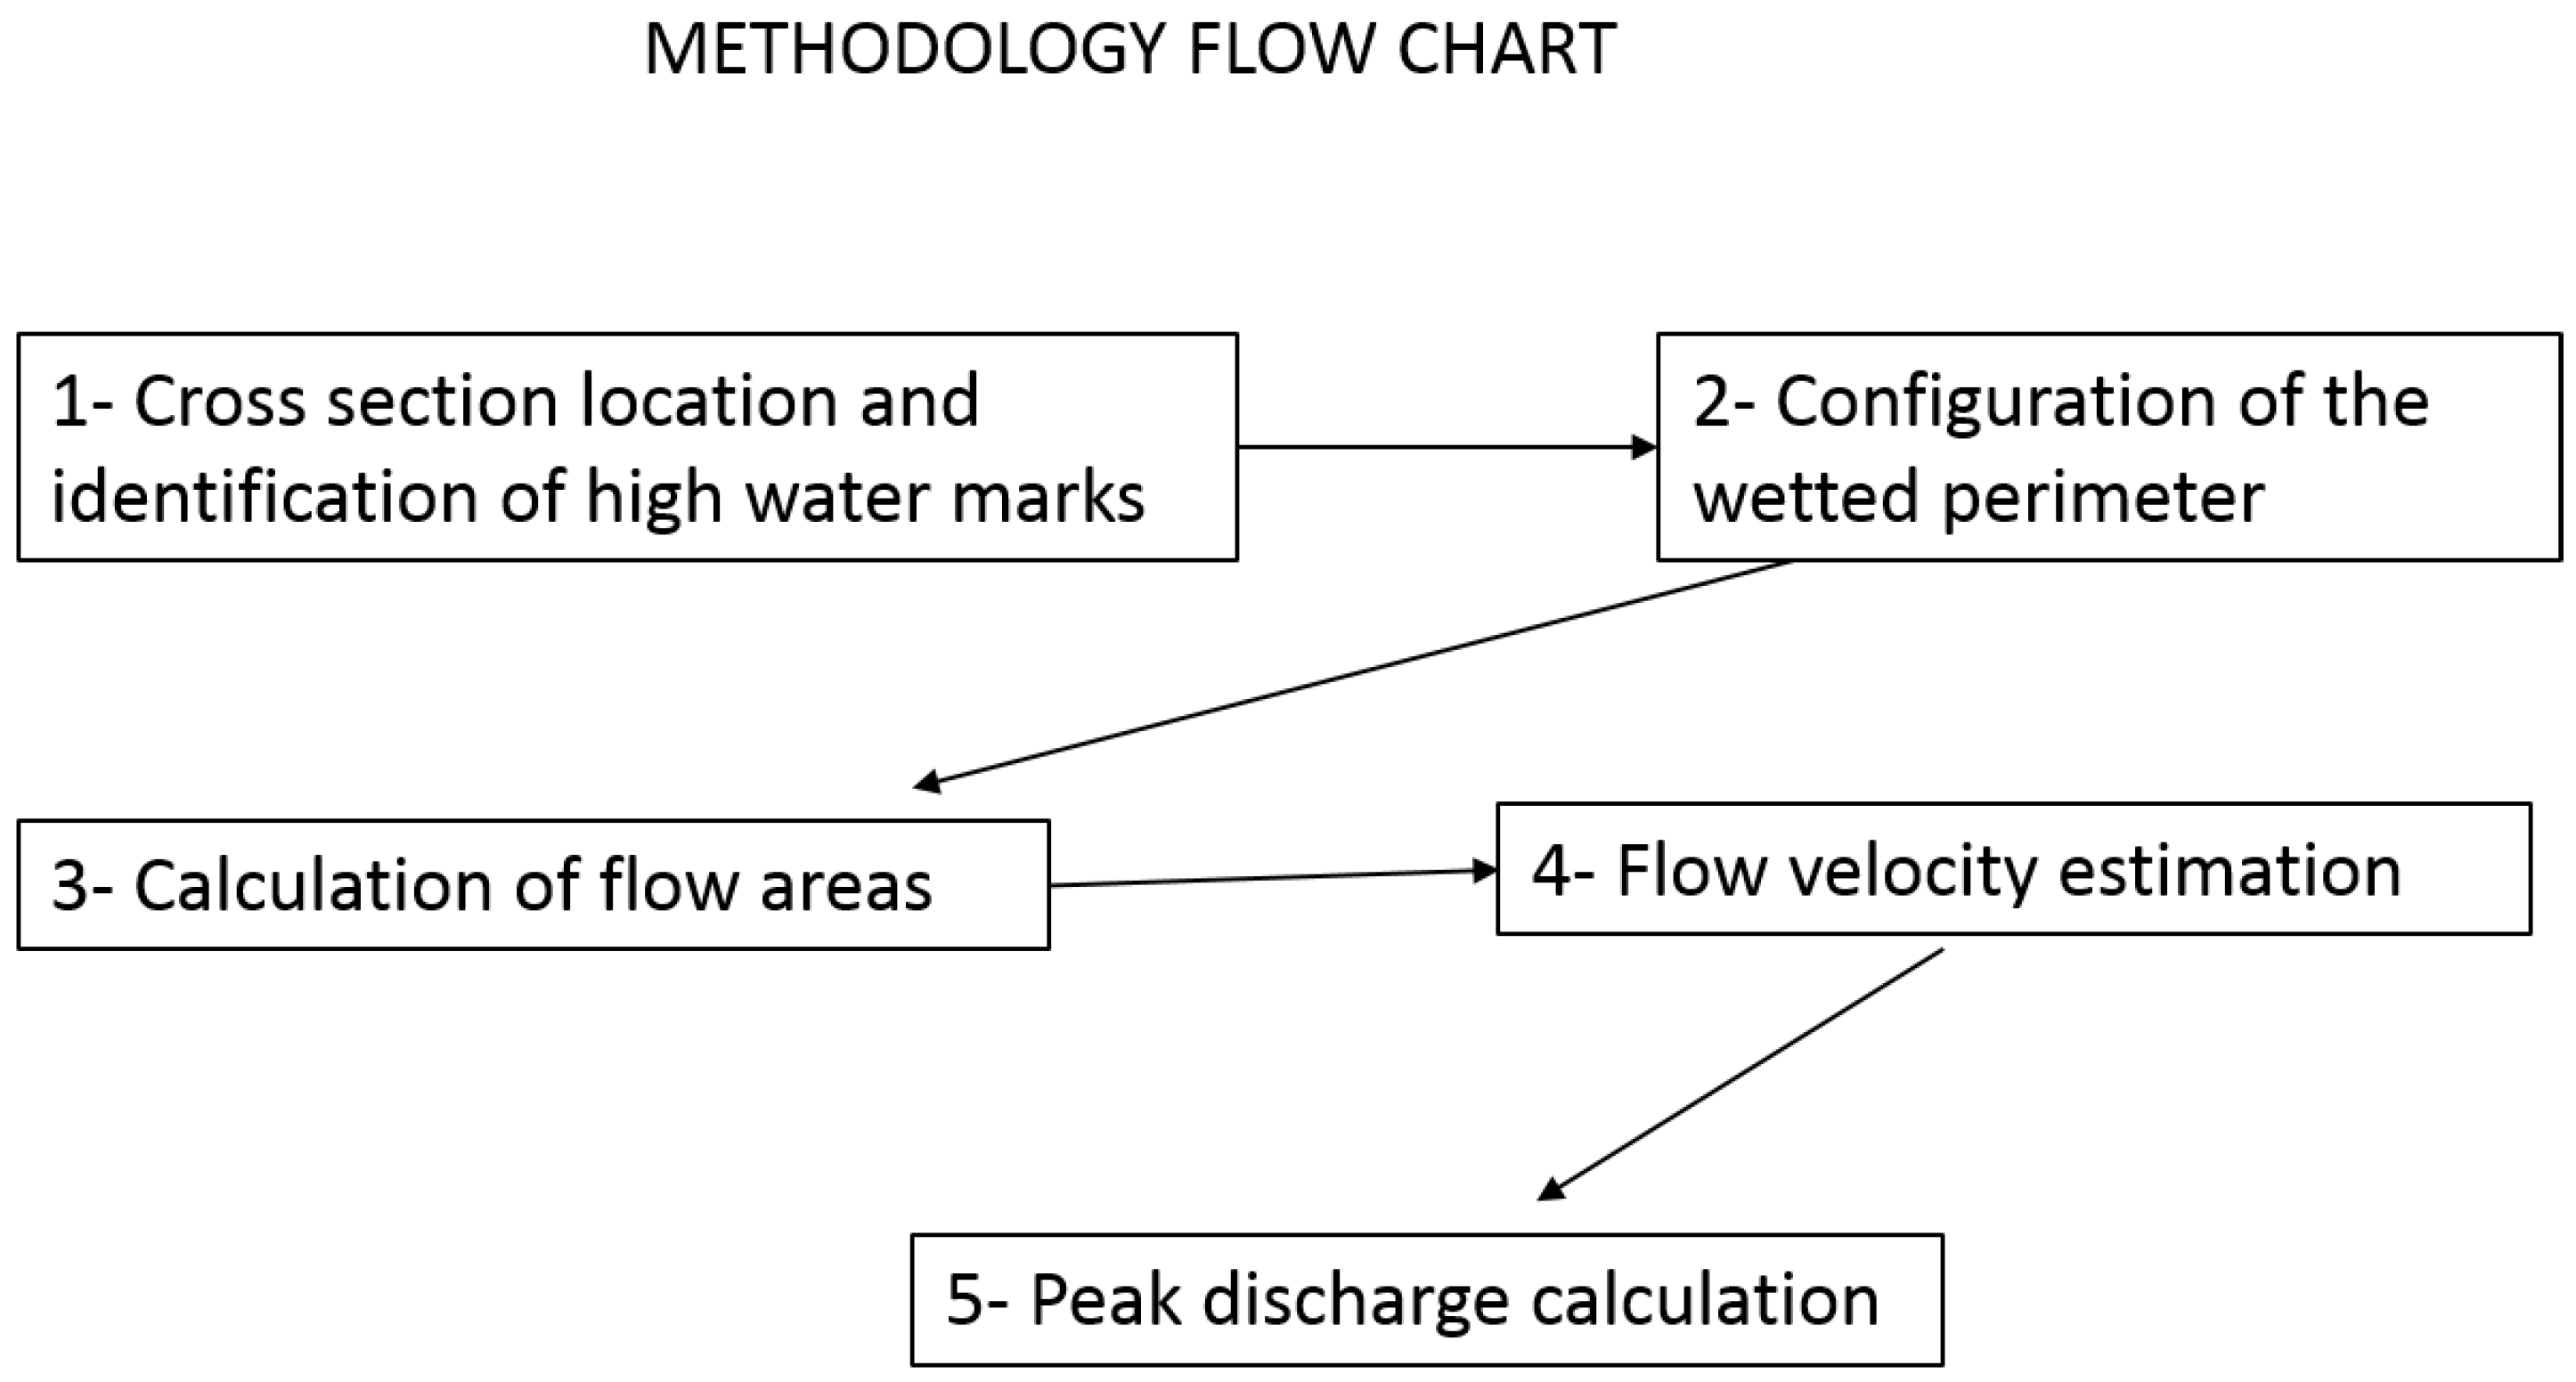
The final flood peak is the result of the application of the average of the flow rates obtained by the above-mentioned methods. Not all of them were used for each measured cross-section as the formulas are seen as a complementary way to calculate peaks, and not all the sections allowed its utilization. Figure 4 includes a flow chart summarizing the methodological steps of the research.

3. Results

3.1. Flood Peak Calculation for December 2004

The 2004 flood was the result of a complex rainfall event, which reached very significant totals in the headwaters of the basin during the six days of precipitation. A total of 326 mm highlight the amounts of rain, with 24 h records of 105 mm and 140 mm on consecutive days. The field survey started soon after the floodwaters receded and 10 measurement points were selected around the torrent de son Marc and downstream the torrent de Sant Jordi. The highest flow values are located in the headwaters sector, close to a confluence point where small tributaries join to form a larger channel, reaching as much as 158.36 m3/s. Such value was considered excessive and another measurement (6b) was taken, which reduced the peak to 81.27 m3/s (Table 1).
Downstream, there is process of lamination that causes the maximum flow after the town of Pollença to be only of 100.55 m3/s as the flood waters were running outside the stream banks, thus reducing the measured flow at cross-section 10 (Figure 5), which is in Table 1.

3.2. Flood Peak Calculation for November 2005

The rain that caused this episode fell mostly on the same day. The previous day, it rained lightly, but on 11 November, up to 200 mm were recorded in 24 h, with rainfall concentrated in the northwest of Mallorca and reaching values of over 100 mm throughout the upper part of the basin.
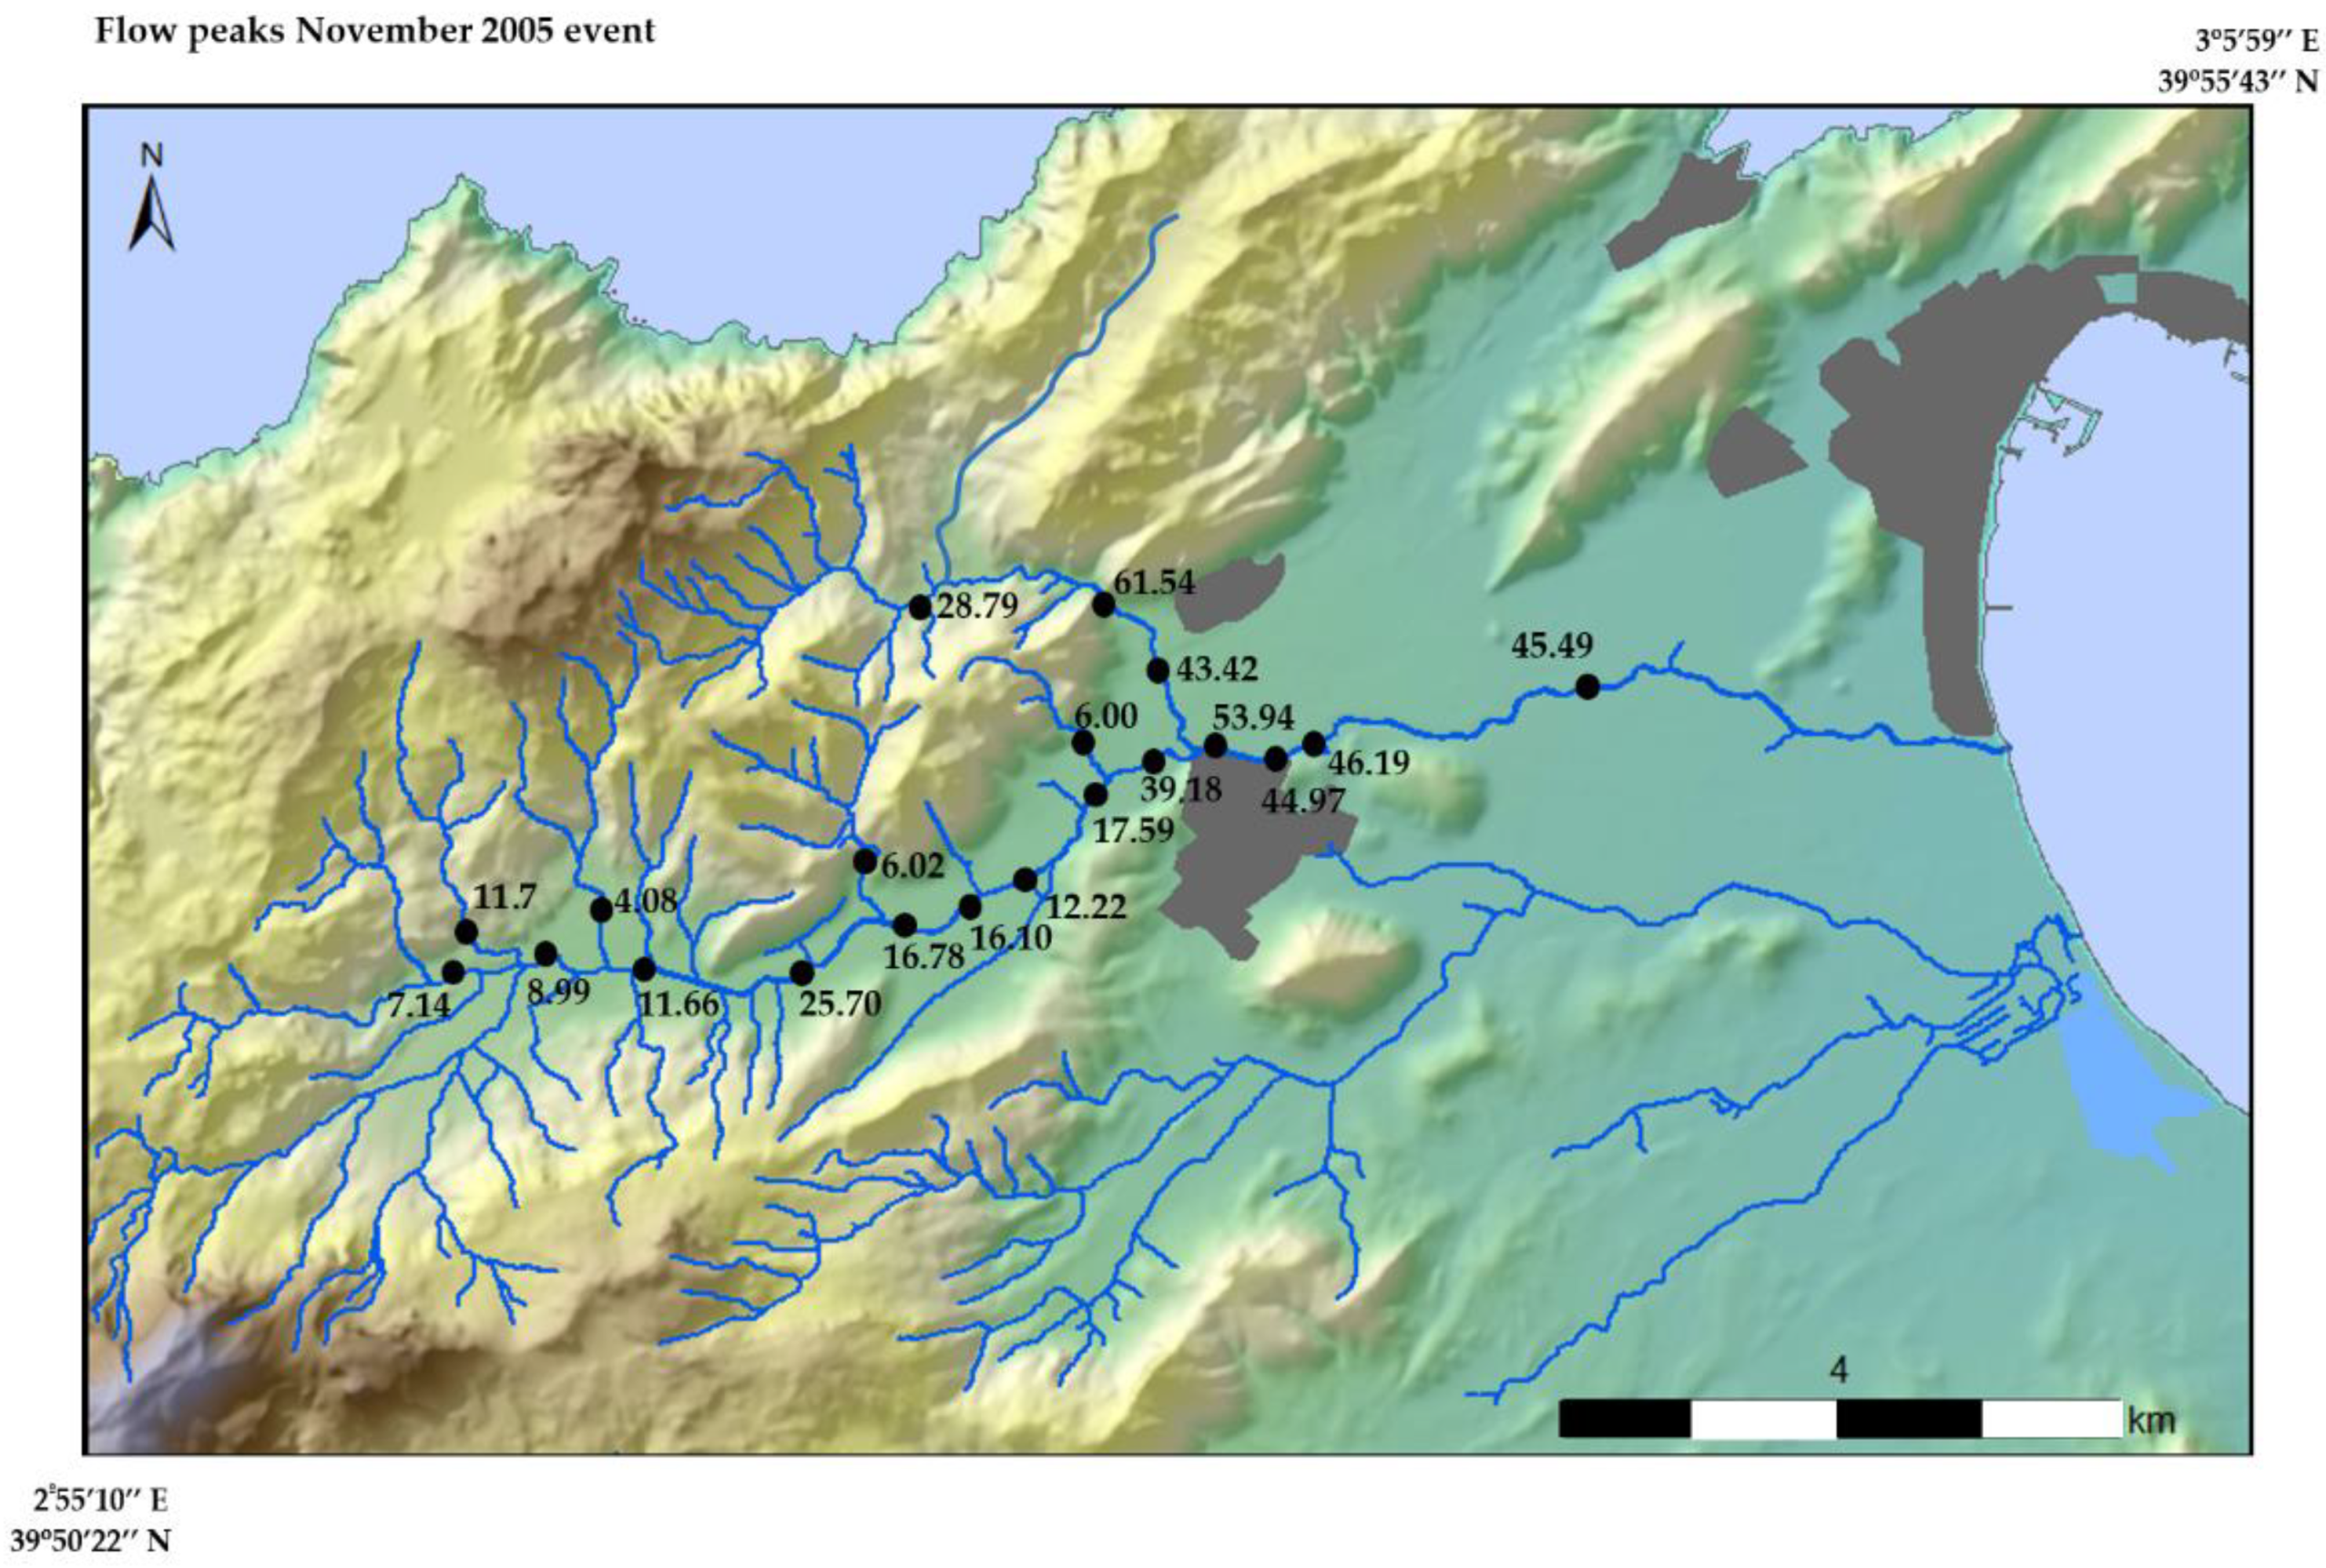
In this episode, twenty field measurements were made along the studied catchment (Table 2). The values at the headwaters were not very high (16 m3/s), but the peak flow increased in the central area, with the contributions of the torrent de Ternelles, where a peak of 61m3/s was recorded. According to some witnesses, the peaks of the two main tributaries of the basin did not converge at the same time and the flow in the lower part of the basin remained around 45 m3/s (Figure 6).

3.3. Flood Peak Calculation for April 2007

The first two weeks of April were characterized by a prolonged rainy spell that culminated on the 14th with an increase in values that, without being very significant, caused the overflowing of several basins in the Serra de Tramuntana mountain range in Mallorca [58]. Rainfall within the catchment varied from 120 mm to 177 mm, with the highest amounts recorded, as usual, in the catchment headwaters area.
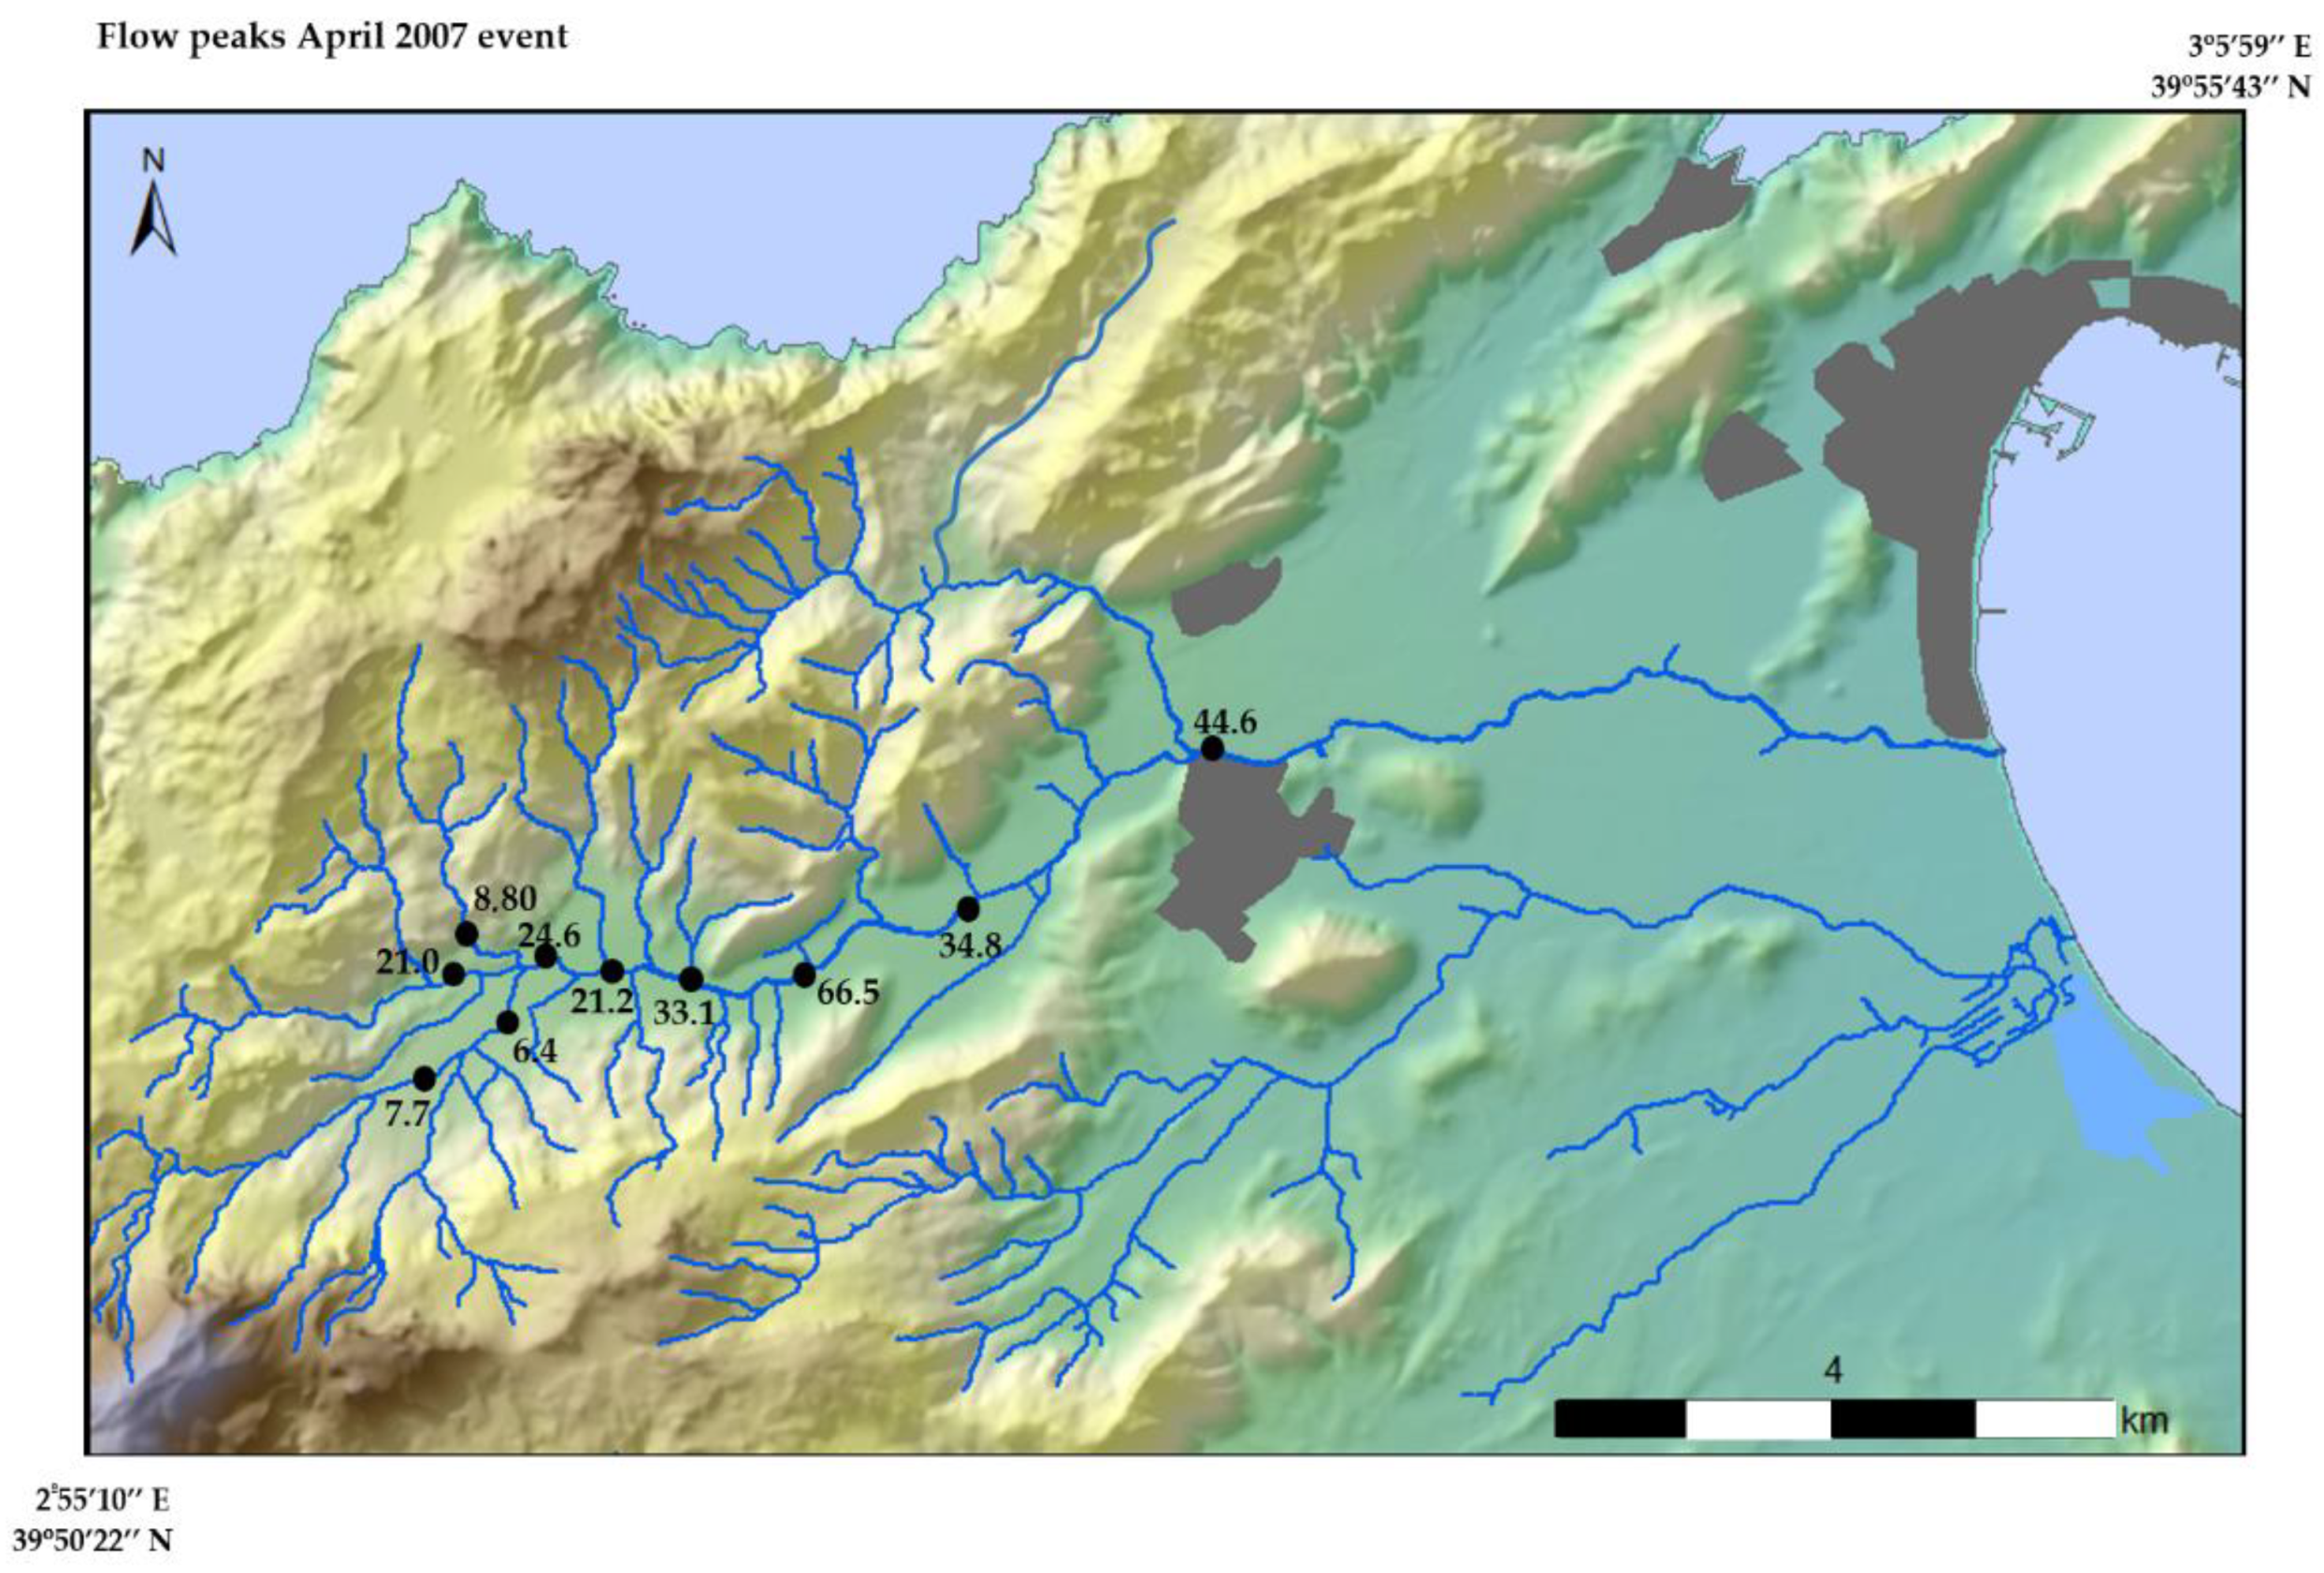
The field survey consisted of 11 measurements, with the starting flood peaks located on the headwater tributaries (Table 3). The torrent de san Marc generated the main peak, which gradually receives the flows of the other tributaries until it reaches a maximum flow near the urban area of Pollença, calculated as 44.60 m3/s (Figure 7). A higher peak upstream, measured to be 66.50 m3/s, is considered unreliable as event witnesses explain how a wall stopped the water flow before the cross-section. When the blockade was overwhelmed by runoff, there was an increase in the flow, thus leading to the high value recorded in cross-section 9, which is in Table 3.

3.4. Geomorphic Processes

The three field surveys developed after each event allowed to identify geomorphic processes along the catchment, processes that may occur only in a single episode or that were repeated during the period under study.
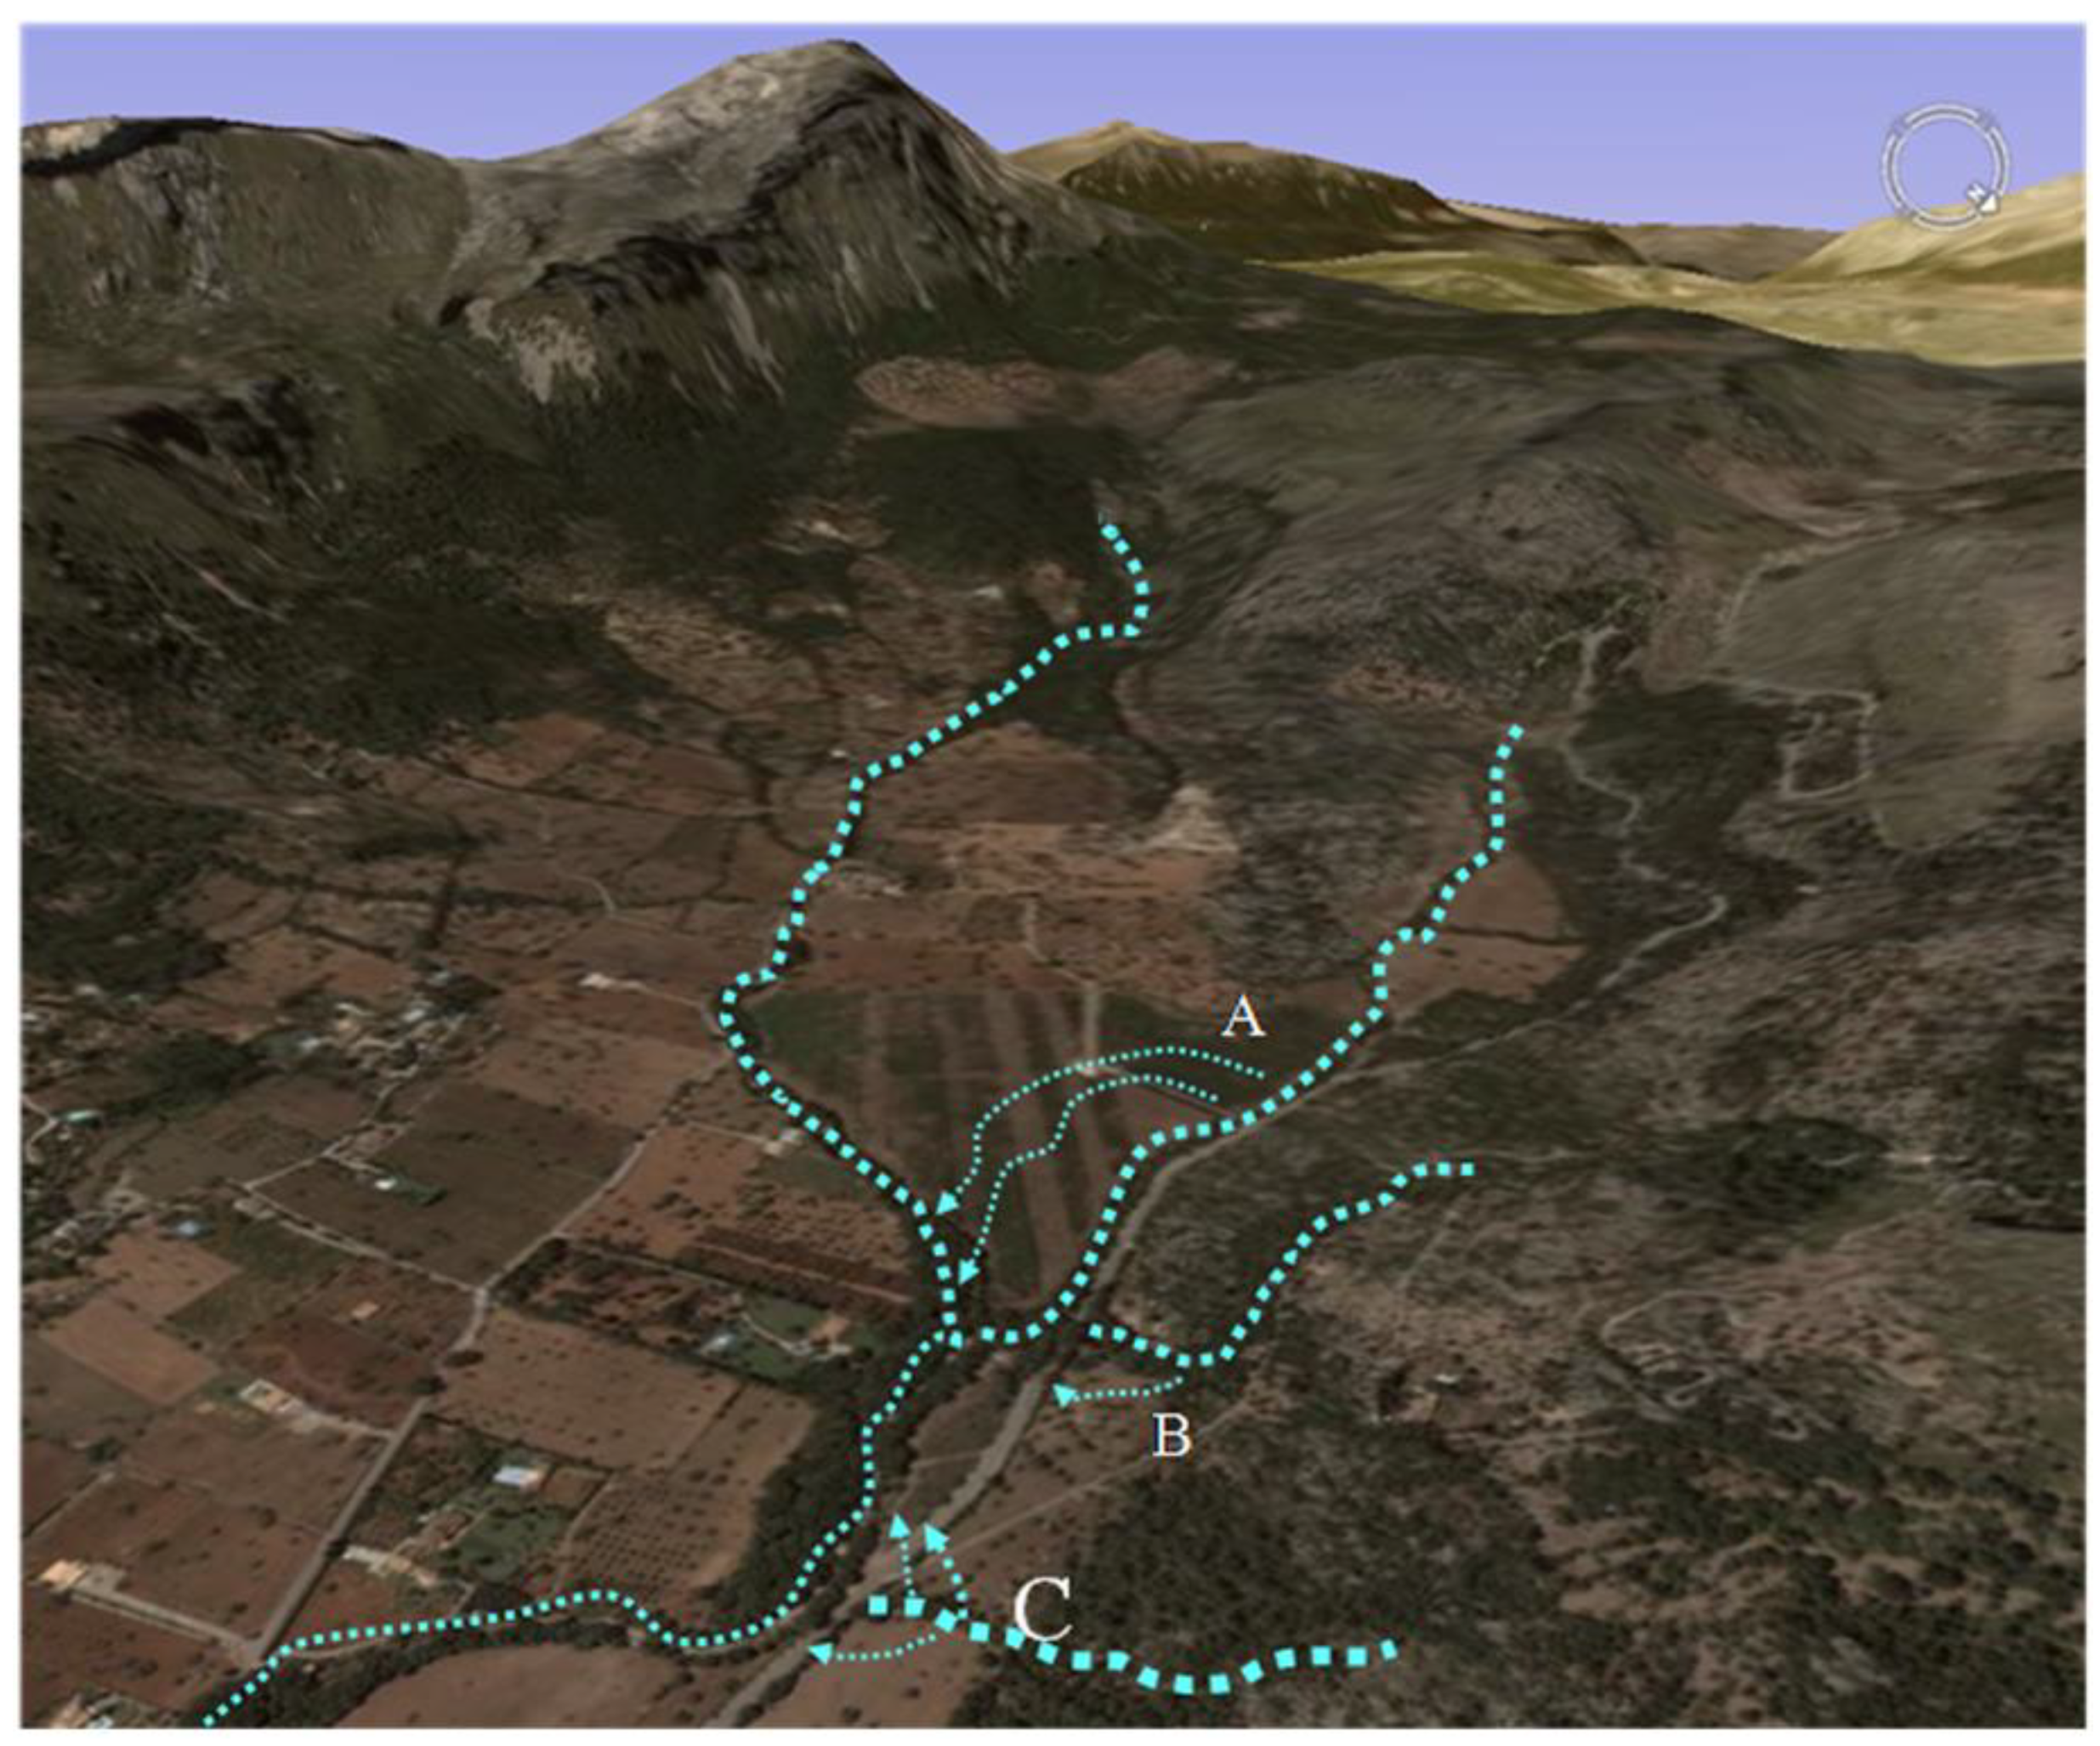
Firtsly, during the December 2004 event, there were tranfers of flow between the channels in the torrent de son Marc. It is a plain area with a small W-E slope following the drainage direction of the streams. Interconnections between the torrent de Mortitxet and torrent de Muntanya have been identified as the former overflows for a long stretch in a southerly direction. A layer of water thus appears between the fields of fruit trees and increases the flow of the torrent de Muntanya once this superficial runoff falls into its bed. Another effect is a sudden rise in the flood peak at the confluence with the torrent de la vall de’n Marc (Figure 8). The presence of fences and stone walls between the fruit orchards caused water damming and subsequent ruptures that increase the flow velocity, which erodes the land and allows the dragging of rocky materials and even trees.
A second consequence of the floods is the dragging of rocky material in the bed of the different watercourses, something that has happened in the three events. In 2004, the boulders carried away by the waterflow caused damages in bridges located along the torrents de Pedruixella, Puig Ferrer, son Grua, Can Guilló, and can Barrio, affecting pillars and arches. The bridge over the torrent de son Grua was almost completely obstructed by rocks and washed away (Figure 9), which caused overflows as the area through which the water flowed diminished, affecting the road network, which was cut off and eroded by floodwaters.
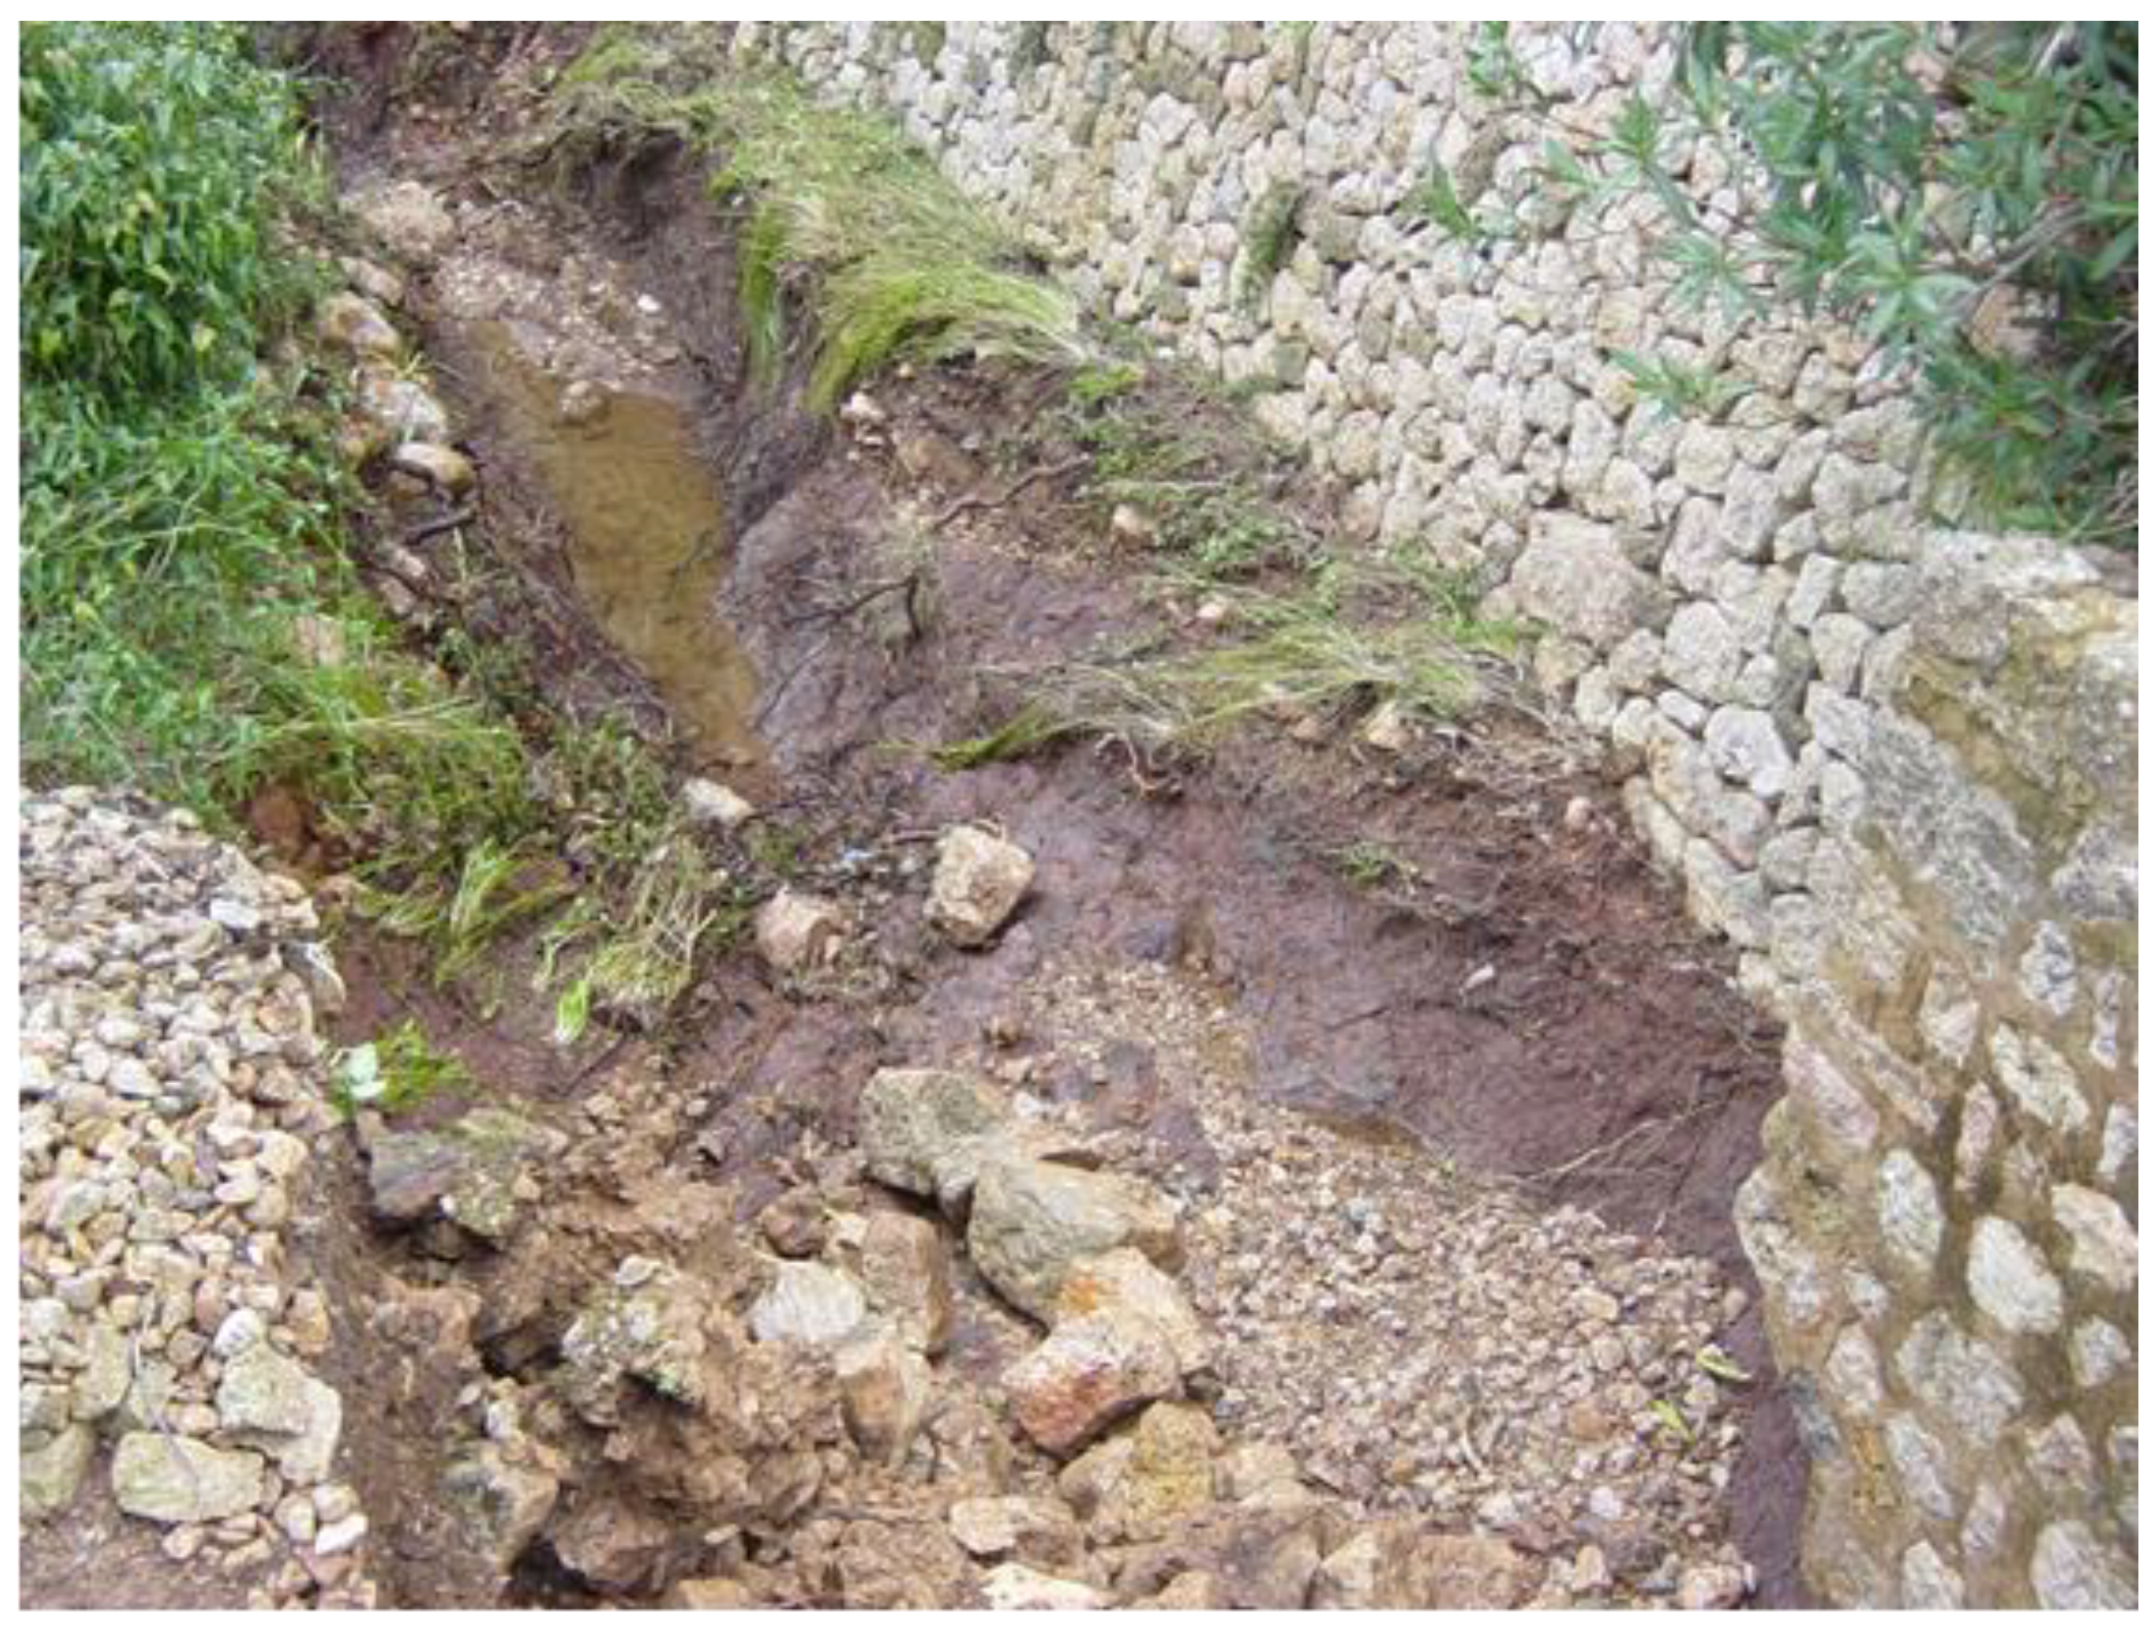
A third effect is the erosive process that affects the beds and the walls of the banks, walls usually built with the dry stone technique and which were destroyed by the impact of the materials dragged by the water. An example is identified in the torrent de son Sales during the 2005 event (Figure 10). Another effect of the erosion is the modification of the course of the main channel, as in the case of the torrent del Puig Ferrer, which flows into an artificial bed, built by man, and enclosed by stonewalls. In the 2004 episode, the water exceeded the right bank so that the torrent flowed into the torrent de la vall den Marc, forming small channels over an alluvial cone (Figure 8, B).

4. Discussion and Conclusions

The results shown in the previous section allow the comparison of the flow peaks obtained with those affecting previously the same catchment as well as with the records of torrential events on the island of Mallorca. In addition, it can be observed that peak flows of a not very high order of magnitude can cause damage to both the natural and humanized environment.
The peak values obtained by indirect methods for the three events range from 61.54 m3/s (2005) to 100.55 m3/s (2004). Such values show how even if rainfall amounts can easily reach 200 mm/24 h, the resulting peaks are not similar to previous peaks recorded in the same catchment before the 1990 flood, which reached a peak of 206.8 m3/s [59] with a preceding rainfall close to 200 mm/24 h as well. The differences between flow peak values may be due to factors like the variation of rainfall intensities during the 24 h period, and, on the other hand, of the spatial distribution of the peaks within the catchment. However, more data are needed to validate these hypotheses, which will have to be studied further when more reliable sources, especially rainfall, become available. In the torrent de sant Jordi events, a large number of peaks are located in the headwaters sections or in the middle sections of the tributaries so, by the time the flow reaches the lowest part of the catchment, overflows have already occurred, thus reducing the water flow. Moreover, in some of the streambeds, infiltration processes occur due to the limestone nature of the rock, a process that causes the loss of flow within the watercourse.
When comparing the Pollença catchment flood values with those recorded in Mallorca, the results are also very different. For instance, the 1989 floods in SW Mallorca reached peaks over 700 m3/s, with a highest value of 1054 m3/s in the area of Campos [60]. Again, these values have to be considered in the knowledge that rainfall intensities and its spatial distribution over catchments play an important role in the flood generation processes and such information is not available for the vast majority of Mallorca’s events [61,62].
In that sense, an emerging issue is the need of rainfall measurements with a temporal resolution of less than 24 h, as such data will improve the calculation of flood peak discharges in a largely ungauged region. In addition, another issue to be explored is the use of meteorological radar data to improve the knowledge of the rainfall’s spatial and temporal distribution.
Another interesting venue to discuss is the impact of the flood events over the natural and humanized environment. As stated before, the three events were not characterized by large flow peaks if compared with Mallorca’s other floods. Even though, the damage around the catchment was important and justified the qualification of catastrophic of the 2004 event as the floodwaters destroyed bridges, roads, and paths; caused heavy damage in the agricultural sector of the municipality; and affected man’s daily activities, hindering the transit of people and goods. Meanwhile, the impacts of the 2005 and 2007 events were of lesser importance, both economically and in terms of impacts over the catchment, being of particular note the damages caused by waters in 2005 as a result of the erosion of streambeds and banks as well as paths in the countryside. Such results confirm previous research developed in other countries regarding the damage related to small-scale floods, which affect small tributaries but can cause relevant damage, often neglected if studied from a larger spatial scale [63,64]. Regarding the damage, another venue to be further pursued is the economic cost of the floods, which can be derived from the claims towards insurance companies from the affected parties, a useful tool proven by previous research [65,66].
To conclude, this paper includes a method of indirect flood discharge estimation in ungauged catchments using data obtained in post-event surveys. Even if there is not a unique way to reconstruct floods, the presented methodology allows the calculation of peak flows based on the characteristics of the bed (slope, hydraulic radius and water depth) and of the rocky material carried by the water. Although there is a level of uncertainty with the measured data, the values obtained in an ungauged basin can be compared with those obtained with direct measurements when available and show how episodes with not very high flood peaks cause impacts both on the channels themselves and on the surrounding territory as well as affecting the anthropic environment.
The results improve data knowledge that can help to develop regional estimations of peak flows to be used for engineering purposes and for civil protection measures. Furthermore, such data can improve watershed management policies and risk mitigation actions by public administrations and private stakeholders.

Author Contributions

Conceptualization, J.R.-G. and M.G.-G.; methodology, J.R.-G. and M.G.-G.; validation, J.R.-G. and M.G.-G.; formal analysis, J.R.-G. and M.G.-G.; investigation, J.R.-G. and M.G.-G.; resources, J.R.-G. and M.G.-G.; data curation, M.G.-G.; writing—original draft preparation, J.R.-G.; writing—review and editing, J.R.-G. and M.G.-G.; visualization, M.G.-G. All authors have read and agreed to the published version of the manuscript.

Funding

This research received no external funding.

Data Availability Statement

All data generated and used during the study appear in the published article. Related information is available from the corresponding author by request.

Conflicts of Interest

The authors declare no conflict of interest.

References

  1. Devitt, L.; Neal, J.; Coxon, G.; Savage, J.; Wagener, T. Flood hazard potential reveals global floodplain settlement patters. Nat. Commun. 2023, 14, 2801. [Google Scholar] [CrossRef] [PubMed]
  2. CRED. Disasters in Numbers; CRED: Brussels, Belgium, 2023; Available online: https://cred.be/sites/default/files/2022_EMDAT_report.pdf (accessed on 20 June 2023).
  3. Modrick, T.M.; Georgakakos, K.P. The character and causes of flash flood occurrence changes in mountainous small basins of Southern California under projected climatic change. J. Hydrol. Reg. Stud. 2015, 3, 312–336. [Google Scholar] [CrossRef] [Green Version]
  4. Sarchani, S.; Tsanis, I. Analysis of a Flash Flood in a Small Basin in Crete. Water 2019, 11, 2253. [Google Scholar] [CrossRef] [Green Version]
  5. Brunner, M.I.; Swain, D.L.; Wood, R.R.; Willkofer, F.; Done, J.M.; Gilleland, E.; Ludwig, R. An extremeness threshold determines the regional response of floods to changes in rainfall extremes. Commun. Earth Environ. 2021, 2, 173. [Google Scholar] [CrossRef]
  6. Kreibich, H.; Van Loon, A.F.; Schröter, K.; Ward, P.J.; Mazzoleni, M.; Sairam, N.; Abeshu, G.W.; Agafonova, S.; AghaKouchak, A.; Aksoy, H.; et al. The challenge of unprecedented floods and droughts in risk management. Nature 2022, 608, 80–86. [Google Scholar] [CrossRef]
  7. Jongman, B.; Ward, P.J.; Aerts, J.C.J.H. Global exposure to river and coastal flooding: Long term trends and changes. Glob. Environ. Chang. 2012, 22, 823–835. [Google Scholar] [CrossRef]
  8. Rentschier, J.; Avner, P.; Marconcini, M.; Su, R.; Strano, E.; Hallegatte, S. Rapid Urban Growth in Flood Zones: Global Evidence since 1985. Policy Research Working Paper 2022. 10014. Available online: https://blogs.worldbank.org/developmenttalk/rapid-urban-growth-flood-zones-global-trends-exposure-1985 (accessed on 16 May 2023).
  9. Feloni, E.; Anayiotos, A.; Baltas, E. A Spatial Analysis Approach for Urban Flood Occurrence and Flood Impact Based on Geomorphological, Meteorological, and Hydrological Factors. Geographies 2022, 2, 516–527. [Google Scholar] [CrossRef]
  10. Brazdil, R.; Kundzewicz, Z.W.; Benito, G.; Demarée, G.; MacDonald, N.; Roald, L.A. Historical floods in Europe in the past millennium. In Changes in Flood Risk in Europe, 1st ed.; Kundzewicz, Z.W., Ed.; CRC Press: London, UK, 2012; Volume 1, pp. 121–166. [Google Scholar]
  11. Blöschl, G.; Kiss, A.; Viglione, A.; Barriendos, M.; Böhm, O.; Brázdil, R.; Coeur, D.; Demarée, G.; Llasat, M.C.; Macdonald, N.; et al. Current European flood-rich period exceptional compared with past 500 years. Nature 2020, 583, 560–566. [Google Scholar] [CrossRef]
  12. Kaspersen, P.S.; Ravn, N.H.; Arnbjerg-Nielsen, K.; Madsen, H.; Drews, M. Comparison of the impacts of urban development and climate change on exposing European cities to pluvial flooding. Hydrol. Earth Syst. Sci. 2017, 21, 4131–4147. [Google Scholar] [CrossRef] [Green Version]
  13. Dottori, F.; Mentaschi, L.; Bianchi, A.; Alfieri, L.; Feyen, L. Cost-effective adaptation strategies to rising river flood risk in Europe. Nat. Clim. Chang. 2023, 13, 196–202. [Google Scholar] [CrossRef]
  14. European Union. European Flood Directive 2007/60/EC. Available online: https://eur-lex.europa.eu/legal-content/EN/TXT/?uri=celex:32007L0060 (accessed on 15 June 2023).
  15. Llasat, M.C. Floods evolution in the Mediterranean region in a context of climate and environmental change. Cuad. Investig. Geogr. 2021, 47, 13–32. [Google Scholar] [CrossRef]
  16. Gaume, E.; Borga, M.; Llassat, M.C.; Maouche, S.; Lang, M.; Diakakis, M. Mediterranean extreme floods and flash floods. In The Mediterranean Region under Climate Change. A Scientific Update; IRD Éditions/AllEnvi: Montpellier, France, 2016; pp. 133–144. [Google Scholar]
  17. Gaume, E.; Bain, V.; Bernardara, P.; Newinger, O.; Barbuc, M.; Bateman, A.; Blaškovičová, L.; Blöschl, G.; Borga, M.; Dumitrescu, A.; et al. A compilation of data on European flash floods. J. Hydrol. 2009, 367, 70–78. [Google Scholar] [CrossRef] [Green Version]
  18. Tarolli, P.; Borga, M.; Morin, E.; Delrieu, G. Analysis of flash flood regimes in the North-Western and South-Eastern Mediterranean regions. Nat. Hazards Earth Syst. Sci. 2012, 12, 1255–1265. [Google Scholar] [CrossRef] [Green Version]
  19. Llasat, M.C.; Llasat-Botija, M.; Petrucci, O.; Pasqua, A.A.; Rosselló, J.; Vinet, F.; Boissier, L. Towards a database on societal impact of Mediterranean floods within the framework of the HYMEX project. Nat. Hazards Earth Syst. Sci. 2013, 13, 1337–1350. [Google Scholar] [CrossRef] [Green Version]
  20. Petrucci, O.; Papagiannaki, K.; Aceto, L.; Boissier, L.; Kotroni, V.; Grimalt, M.; Llasat, M.C.; Llasat-Botija, M.; Rosselló, J.; Pasqua, A.A.; et al. MEFF: The database of MEditerranean Flood Fatalities (1980 to 2015). J. Flood Risk Manag. 2019, 12, e12461. [Google Scholar] [CrossRef] [Green Version]
  21. Petrucci, O.; Aceto, L.; Bianchi, C.; Brazdil, R.; Diakakis, M.; Inbar, M.; Kahraman, A.; Kiliç, O.; Kreibich, H.; Kotroni, V.; et al. FFEM-DB. Database of flood fatalities from the Euro-Mediterranean region. Sci. Data 2021, 9, 166. [Google Scholar]
  22. Amponsah, W.; Ayral, P.-A.; Boudevillain, B.; Bouvier, C.; Braud, I.; Brunet, P.; Delrieu, G.; Didon-Lescot, J.-F.; Gaume, E.; Lebouc, L.; et al. Integrated high-resolution dataset of high-intensity European and Mediterranean flash floods. Earth Syst. Sci. Data 2018, 10, 1783–1794. [Google Scholar] [CrossRef] [Green Version]
  23. Ali, K.; Bajracharyar, R.M.; Raut, N. Advances and Challenges in Flash Flood Risk Assessment: A Review. J. Geogr. Nat. Disasters 2017, 7, 195. [Google Scholar] [CrossRef] [Green Version]
  24. Saharia, M.; Kirstetter, P.-E.; Vergara, H.; Gourley, J.J.; Hong, Y.; Giroud, M. Mapping Flash Flood Severity in the United States. J. Hydrometeorol. 2017, 18, 397–411. [Google Scholar] [CrossRef]
  25. Borga, M.; Gaume, E.; Creutin, J.D.; Marchi, L. Surveying flash floods: Gauging the ungauged extremes. Hydrol. Process. 2008, 22, 3883–3885. [Google Scholar] [CrossRef]
  26. Gaume, E.; Borga, M. Post-flood field investigations in upland catchments after major flash floods: Proposal of a methodology and illustrations. J. Flood Risk Manag. 2008, 1, 175–189. [Google Scholar] [CrossRef]
  27. Borga, M.; Comiti, F.; Ruin, I.; Marra, F. Forensic analysis of flash flood response. WIREs Water 2019, 6, e1338. [Google Scholar] [CrossRef]
  28. Alipour, A.; Ahmadalipour, A.; Moradkhani, H. Assessing flash flood hazard and damages in the southeast United States. J. Flood Risk Manag. 2020, 13, e12605. [Google Scholar] [CrossRef]
  29. Roux, H.; Amengual, A.; Romero, R.; Bladé, E.; Sanz-Ramos, M. Evaluation of two hydrometeorological emsemble strategies for flash-flood forecasting over a catchment of the Eastern Pyrenees. Nat. Hazards Earth Syst. Sci. 2020, 20, 425–450. [Google Scholar] [CrossRef] [Green Version]
  30. Giannaros, C.; Dafis, S.; Stefanidis, S.; Giannaros, T.M.; Koletsis, I.; Oikonomou, C. Hydrometeorological analysis of a flash flood event in an ungauged Mediterranean watershed under an operational forecasting and monitoring context. Meteorol. Appl. 2022, 29, e2079. [Google Scholar] [CrossRef]
  31. Barriendos, M.; Ruiz-Bellet, J.L.; Tuset, J.; Mazón, J.; Balasch, J.C.; Pino, D.; Ayala, J.L. The “Prediflood” database of historical floods in Catalonia (NE Iberian Peninsula) AD 1035–2013, and its potential applications in flood analysis. Hydrol. Earth Syst. Sci. 2014, 18, 4807–4823. [Google Scholar] [CrossRef] [Green Version]
  32. Barriendos, M.; Gil-Guirado, S.; Pino, D.; Tuset, J.; Pérez-Morales, A.P.; Alberola-Romà, A.; Costa, J.; Balasch, J.C.; Castelltort, X.; Mazón, J.; et al. Climatic and social factors behind the Spanish Mediterranean flood event chronologies from documentary sources (14th–20th centuries). Glob. Planet. Chang. 2019, 182, 102997. [Google Scholar] [CrossRef]
  33. Tuset, J.; Barriendos, M.; Barriendos, J. Historical Floods on the Spanish Mediterranean Basin: A Methodological Proposal for the Classification of Information at High Spatio–Temporal Resolution—AMICME Database (CE 1035–2022). Land 2022, 11, 2311. [Google Scholar] [CrossRef]
  34. Romero, A.; Castejón, G. Inundaciones en la región de Múrcia en los inicios del siglo XXI. Biblio 3W 2014, XIX, 1102. [Google Scholar]
  35. Cortès, M.; Llasat, M.C.; Gilabert, J.; Llasat-Botija, M.; Turco, M.; Marcos, R.; Vide, J.P.M.; Falcón, L. Towards a better understanding of the evolution of the flood risk in Mediterranean urban areas: The case of Barcelona. Nat. Hazards 2017, 93, 39–60. [Google Scholar] [CrossRef]
  36. Gil-Guirado, S.; Pérez-Morales, A.; Lopez-Martinez, F. SMC-Flood database: A high-resolution press database on flood cases for the Spanish Mediterranean coast (1960–2015). Nat. Hazards Earth Syst. Sci. 2019, 19, 1955–1971. [Google Scholar] [CrossRef] [Green Version]
  37. Grimalt-Gelabert, M.; Rosselló-Geli, J.; Bauzà-Llinàs, J. Flood related mortality in a touristic island: Mallorca (Balearic Islands) 1960–2018. J. Flood Risk Manag. 2020, 4, e12644. [Google Scholar] [CrossRef]
  38. Ibarra, E.M. A geographical approach to post-flood analysis: The extreme flood event of 12 October 2007 in Calpe (Spain). Appl. Geogr. 2012, 32, 490–500. [Google Scholar] [CrossRef]
  39. Camarasa-Belmonte, A.M. Flash floods in Mediterranean ephemeral streams in Valencia Region (Spain). J. Hydrol. 2016, 541, 99–115. [Google Scholar] [CrossRef]
  40. Pino, D.; Ruiz-Bellet, J.L.; Balasch, J.C.; Romero-León, L.; Tuset, J.; Barriendos, M.; Mazon, J.; Castelltort, X. Meteorological and hydrological analysis of major floods in NE Iberian Peninsula. J. Hydrol. 2016, 541, 63–89. [Google Scholar] [CrossRef] [Green Version]
  41. Martín-Vide, J.; Llasat, M. The 1962 flash flood in the Rubí stream (Barcelona, Spain). J. Hydrol. 2018, 566, 441–454. [Google Scholar] [CrossRef]
  42. Grimalt-Gelabert, M.; Bauzá-Llinás, J.; Genovart-Rapado, M.C. The flood of October 9, 2018 in the city centre of Sant Llorenç des Cardassar (Mallorca). Cuad. Investig. Geogr. 2021, 47, 265–286. [Google Scholar] [CrossRef]
  43. Balasch, J.C.; Calvet, J.; Tuset, J. Reconstrucción post-evento del flash-flood del 1 de septiembre de 2021 en Les Cases d’Alcanar (Tarragona). Ing. Agua 2023, 27, 29–44. [Google Scholar] [CrossRef]
  44. Grimalt-Gelabert, M.; Alomar-Garau, G.; Martin-Vide, J. Synoptic Causes of Torrential Rainfall in the Balearic Islands (1941–2010). Atmosphere 2021, 12, 1035. [Google Scholar] [CrossRef]
  45. Sales, P. La invenció del pont romà de Pollença. In XXII Jornada d’Antroponímia i Toponímia (Pollença 2009); Bassa, R., Latorre, F., Eds.; Universitat de les Illes Balears: Palma, Spain, 2010; pp. 15–26. [Google Scholar]
  46. Tegos, A.; Ziogas, A.; Bellos, V.; Tzimas, A. Forensic Hydrology: A Complete Reconstruction of an Extreme Flood Event in Data-Scarce Area. Hydrology 2022, 9, 93. [Google Scholar] [CrossRef]
  47. Rodríguez, A.; Grimalt-Gelabert, M. Caudales-punta de avenida y morfología de cuencas en Mallorca. In Actas 1a Reunión Nacional de Geomorfología; Gutiérrez, M., Peña, J.L., Lozano, M.V., Eds.; Instituto de Estudios Turolenses: Teruel, Spain, 1990; pp. 427–436. [Google Scholar]
  48. Gaume, E.; Livet, M.; Desbordes, M.; Villeneuve, J.-P. Flash flood on 11 and 12 November 1999. Hydrological analysis of the river Aude, France. J. Hydrol. 2004, 286, 135–154. [Google Scholar] [CrossRef]
  49. Blaškovičová, L.; Horvát, O.; Hlavčová, K.; Kohnová, S.; Szolgay, J. Methodology for post-event analysis of flash floods—Svacenický Creek case study. Contrib. Geophys. Geodesy 2011, 41, 235–250. [Google Scholar] [CrossRef] [Green Version]
  50. Segura-Beltrán, F.; Sanchis-Ibor, C.; Morales-Hernández, M.; González-Sanchis, M.; Bussi, G.; Ortíz, E. Using post-flood surveys and geomorphic mapping to evaluate hydrological and hydraulic models: The flash flood of the Girona River (Spain) in 2007. J. Hydrol. 2016, 541, 310–329. [Google Scholar] [CrossRef] [Green Version]
  51. Mitková, V.B.; Pekárová, P.; Halmová, D.; Miklánek, P. Reconstruction and post-event analysis of a flash flood in a small ungauged basin: A case study in Slovak territory. Nat. Hazards 2018, 92, 741–760. [Google Scholar] [CrossRef]
  52. Cislaghi, A.; Bischetti, G.B. Best practices in post-flood surveys: The study case of Pioverna torrent. J. Agric. Eng. 2022, 53, 1312. [Google Scholar] [CrossRef]
  53. Payrastre, O.; Nicolle, P.; Bonnifait, L.; Brigode, P.; Astagneau, P.; Baise, A.; Belleville, A.; Bouamara, N.; Bourgin, F.; Breil, P.; et al. Tempête Alex du 2 octobre 2020 dans les Alpes-Maritimes: Une contribution de la communauté scientifique à l’estimation des débits de pointe des crues. LHB 2022, 2082891. [Google Scholar] [CrossRef]
  54. Riggs, H.C. A simplified slope-area method for estimating flood discharges in channels. J. Res. U.S. Geol. Sur. 1976, 4, 285–291. [Google Scholar]
  55. Williams, G.P. Bank-full discharge of rivers. Water Resour. Res. 1978, 14, 1141–1154. [Google Scholar] [CrossRef]
  56. Costa, J.E. Paleohydraulic reconstruction of flash-flood peaks from boulder deposits in the Colorado Front Range. GSA Bull. 1983, 94, 986–1004. [Google Scholar] [CrossRef]
  57. Rico, M.; Benito, G. Estimación de caudales de crecida en pequeñas cuencas de montaña: Revisión metodológica y aplicación a la cuenca de Montardit (Pirineos Centrales, España). Cuatern. Geomorfol. 2002, 16, 125–138. [Google Scholar]
  58. Rosselló Geli, J. Precipitacions i Escorrentía a les Conques Torrencials de Mallorca. Ph.D. Thesis, Universitat de les Illes Balears, Palma, Spain, 2016. [Google Scholar]
  59. Grimalt, M.; Rodríguez, A. Anàlisi de les Inundacions de 1990 al Vessant de Pollença; Junta d’Aigües; Govern Balear: Palma de Mallorca, Spain, 1992. [Google Scholar]
  60. Grimalt, M.; Rodríguez, A. Cabals maxims al Llevant i Mitjorn de Mallorca durant les revingudes de 1989. Treb. Geogr. 1990, 42, 7–18. [Google Scholar]
  61. Bracken, L.J.; Cox, N.J.; Shannon, J. The relationship between rainfall inputs and flood generation in south-east Spain. Hydrol. Process. 2007, 22, 683–696. [Google Scholar] [CrossRef]
  62. Breinl, K.; Lun, D.; Müller-Thomy, H.; Blöschl, G. Understanding the relationship between rainfall and flood probabilities through combined intensity-duration-frequency analysis. J. Hydrol. 2021, 602, 126759. [Google Scholar] [CrossRef]
  63. Bernet, D.B.; Trefalt, S.; Martius, O.; Weingartner, R.; Mosimann, M.; Röthlisberger, V.; Zischg, A.P. Characterizing precipitation events leading to surface water flood damage over larger regions of complex terrain. Environ. Res. Lett. 2019, 14, 064010. [Google Scholar] [CrossRef]
  64. Koks, E.E.; van Ginkel, K.C.H.; van Marle, M.J.E.; Lemnitzer, A. Brief communication: Critical infrastructure impacts of the 2021 mid-July western European flood event. Nat. Hazards Earth Syst. Sci. 2022, 22, 3831–3838. [Google Scholar] [CrossRef]
  65. Cortès, M.; Turco, M.; Llasat-Botija, M.; Llasat, M.C. The relationship between precipitation and insurance data for floods in a Mediterranean region (northeast Spain). Nat. Hazards Earth Syst. Sci. 2018, 18, 857–868. [Google Scholar] [CrossRef] [Green Version]
  66. Papagiannaki, K.; Kotroni, V.; Lagouvardos, K.; Bezes, A.; Vafeiadis, V.; Messini, I.; Kroustallis, E.; Totos, I. Identification of Rainfall Thresholds Likely to Trigger Flood Damages across a Mediterranean Region, Based on Insurance Data and Rainfall Observations. Water 2022, 14, 994. [Google Scholar] [CrossRef]
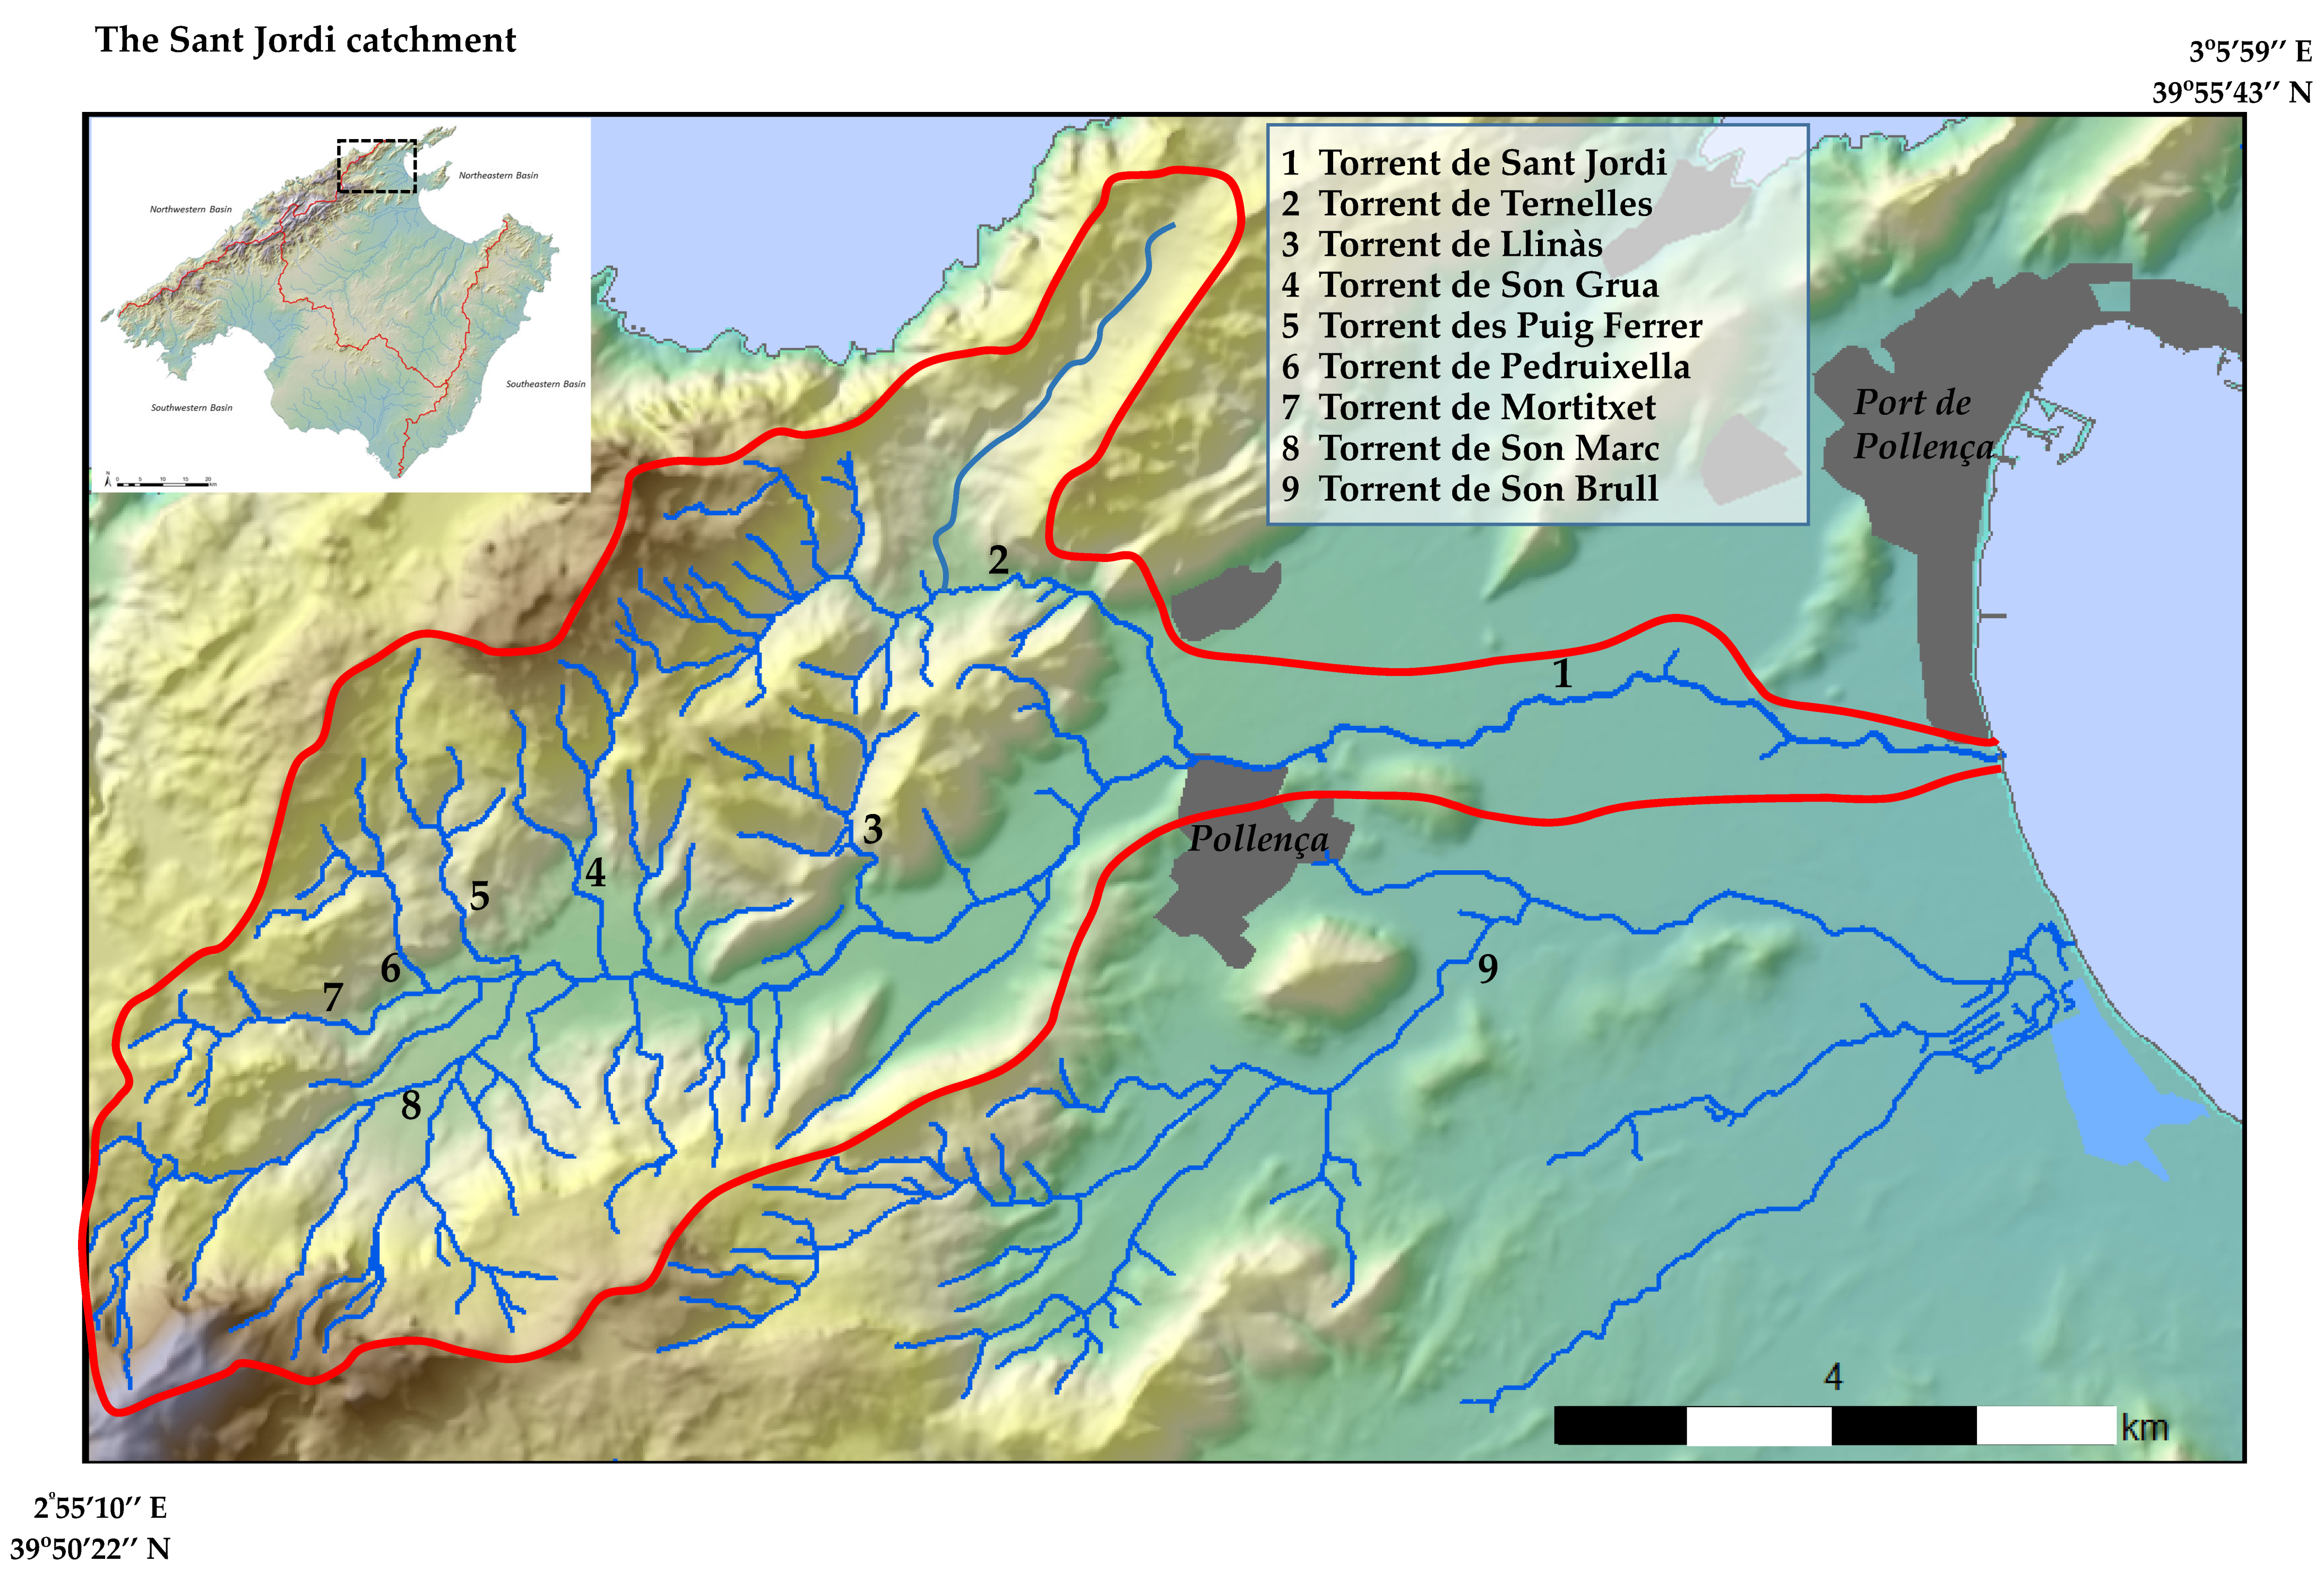
Figure 1. The Sant Jordi catchment boundaries and names of the main tributaries.
Hydrology 10 00152 g001
Figure 2. Cross-channel measurements.
Hydrology 10 00152 g002
Figure 3. Example of a measurement point.
Hydrology 10 00152 g003
Figure 4. Development of the research process.
Hydrology 10 00152 g004
Figure 5. Flow peaks measured on each cross-section for the December 2004 event.
Hydrology 10 00152 g005
Figure 6. Flow peaks measured on each cross-section for the November 2005 event.
Hydrology 10 00152 g006
Figure 7. Flow peaks measured on each cross-section for the April 2007 event.
Hydrology 10 00152 g007
Figure 8. Flow transfer from torrent de Mortitxet towards torrent de Muntanya (A), overflow of torrent des Puig Ferrerover an alluvial fan (B), and overflow of torrent de son Grua (C).
Hydrology 10 00152 g008
Figure 9. Son Grua bridge after the 2004 flood.
Hydrology 10 00152 g009
Figure 10. Banks destroyed along the torrent de son Sales streambed.
Hydrology 10 00152 g010
Table 1. Flood values at the measurement points for the 2004 event.
SurveyCross-Section (m2)Slope (m/m)Boulder Diameter (cm)Critical Velocity (m/s)Costa
(m3/s)
Riggs
(m3/s)
Williams (m3/s)Final Peak
(m3/s)
115.40.020182.2935.3043.37 39.34
211.30.048252.6930.4337.32 33.88
312.130.0193---30.77 30.77
427.40.020252.6973.7995.88 84.83
530.370.014---99.43 99.43
642.660.014---158.36 158.36
6b 26.40.014---81.27 81.27
727.280.008---71.60 71.60
822.960.009---58.52 58.52
929.660.011---89.08 89.08
10 39.240.013----100.55100.55
Table 2. Flood values at the measurement points for the 2005 event.
SurveyCross-Section (m2)Slope (m/m)Boulder Diameter (cm)Critical Velocity (m/s)Costa
(m3/s)
Riggs
(m3/s)
Williams (m3/s)Final Peak
(m3/s)
14.230.020---7.14 7.14
24.910.048---11.7 11.7
2b4.060.048---8.99 8.99
32.120.020101.713.642.73 3.18
42.150.040152.14.513.49 4.00
56.360.014121.8811.9511.37 11.66
5b5.070.014 8.30 8.30
614.960.014---36.91 36.91
6b11.530.014---25.70 25.70
73.120.047121.885.866.18 6.02
88.250.016---16.78 16.78
99.460.008---16.10 16.10
107.760.008---12.22 12.22
119.30.011---17.59 17.59
122.890.059---6.00 6.00
1310.110.031302.9429.7729.77 28.79
1413.480.021333.0941.5936.76 39.18
1517.460.020---54.64 54.64
1619.340.019222.5348.9258.97 53.94
16b16.640.019222.5342.0947.84 44.97
1719.590.012222.2349.5451.08 50.31
17b17.110.012222.2343.2842.33 42.81
1816.510.015---43.42 43.42
1922.370.012---61.54 61.54
19b18.20.012---46.20 46.20
2017.60.013---45.49 45.49
Table 3. Flood values at the measurement points for the 2007 event.
SurveyCross-Section (m2)Slope (m/m)Boulder Diameter (cm)Critical Velocity (m/s)Costa
(m3/s)
Riggs
(m3/s)
Williams (m3/s)Final Peak
(m3/s)
18.690.020232.5819.5722.46 21.02
23.990.048---8.78 8.78
34.810.014---7.67 7.67
42.420.020212.473.315.98 4.64
53.260.019202.414.957.87 6.41
69.80.020252.6922.9626.39 24.67
78.320.020292.8918.2824.09 21.19
813.010.014262.7430.6035.71 33.16
922.680.014 66.50 66.50
1016.220.008---34.76 34.76
1118.040.011---44.60 44.60
Disclaimer/Publisher’s Note: The statements, opinions and data contained in all publications are solely those of the individual author(s) and contributor(s) and not of MDPI and/or the editor(s). MDPI and/or the editor(s) disclaim responsibility for any injury to people or property resulting from any ideas, methods, instructions or products referred to in the content.