
Urban Flood Vulnerability Assessment in Freetown, Sierra Leone: AHP Approach

Abstract
:1. Introduction
2. Materials and Methods
2.1. Study Area
2.2. Criterion Selection
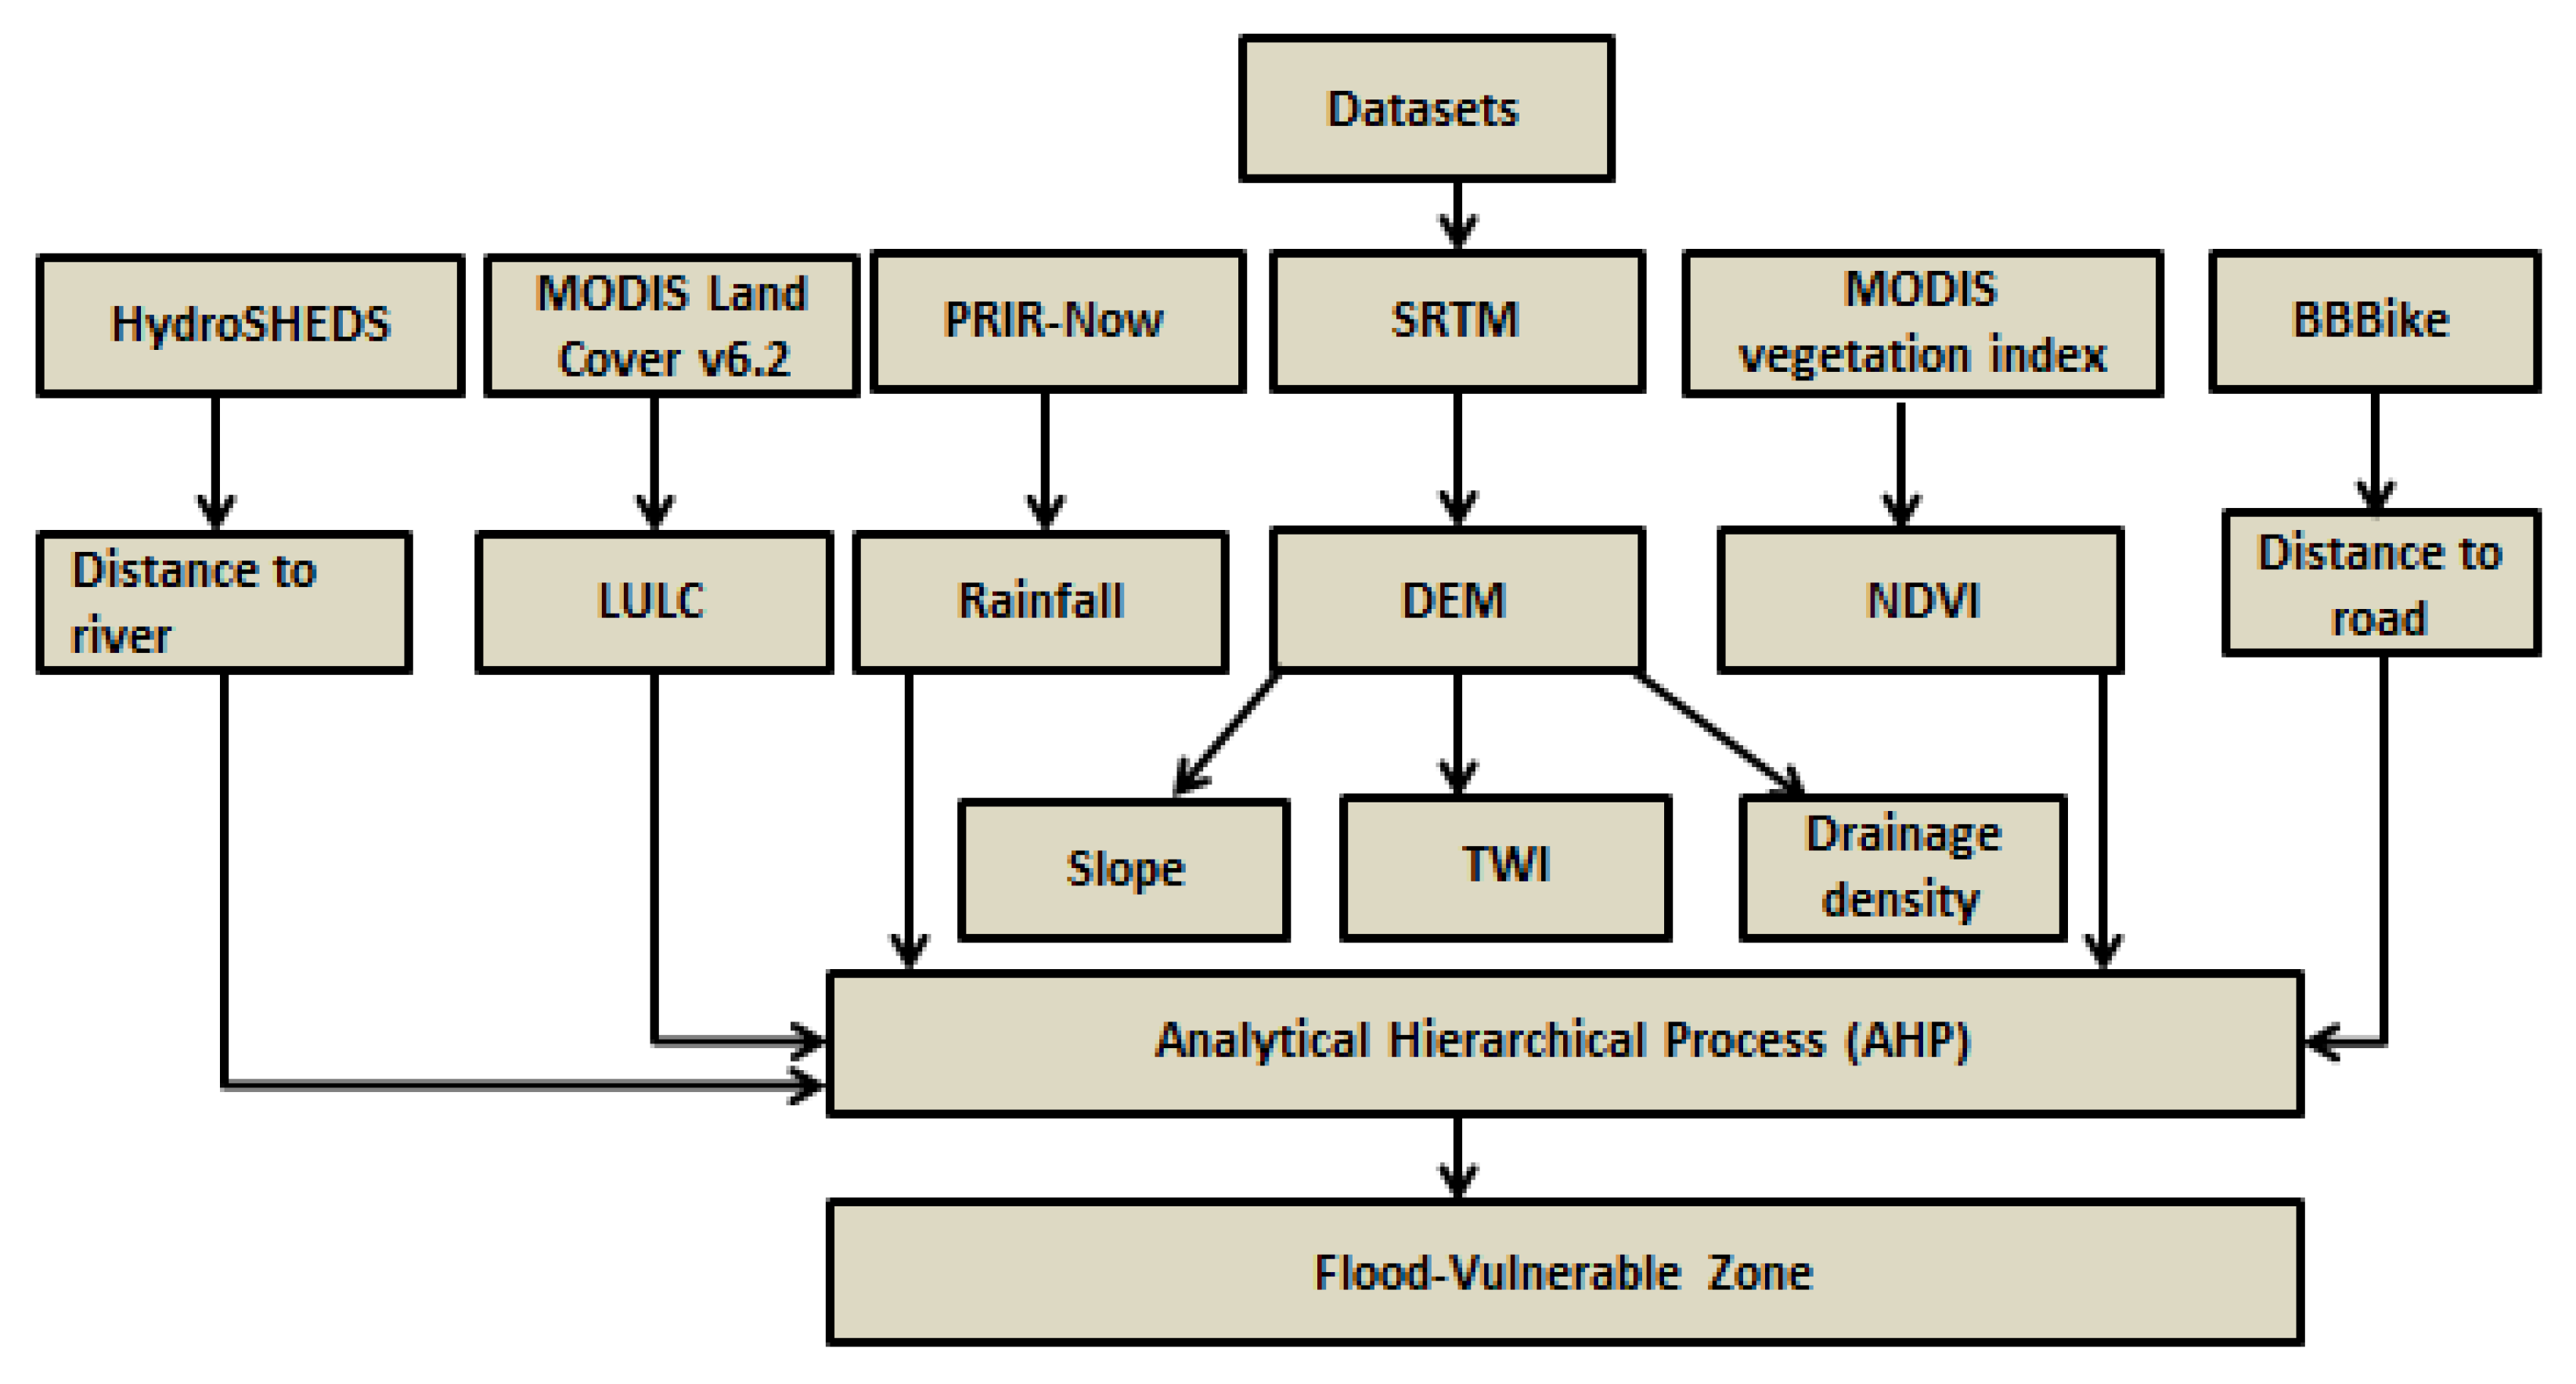
2.3. Data Collection
2.4. AHP Model Application
2.4.1. Weighting of Flood Vulnerability Indicators
2.4.2. Pairwise Comparison Matrix
2.4.3. Normalized Pairwise Comparison Matrix
- Multiply each value in the column by the criterion weight;
- Compute the weighted sum value by adding the values in the rows;
- Calculate the ratio of each weighted sum value to the respective criterion weight;
- Average the ratio of the weighted sum value to the criterion weight.
2.4.4. Consistency Ratio
3. Results
3.1. Flood Vulnerability Criteria
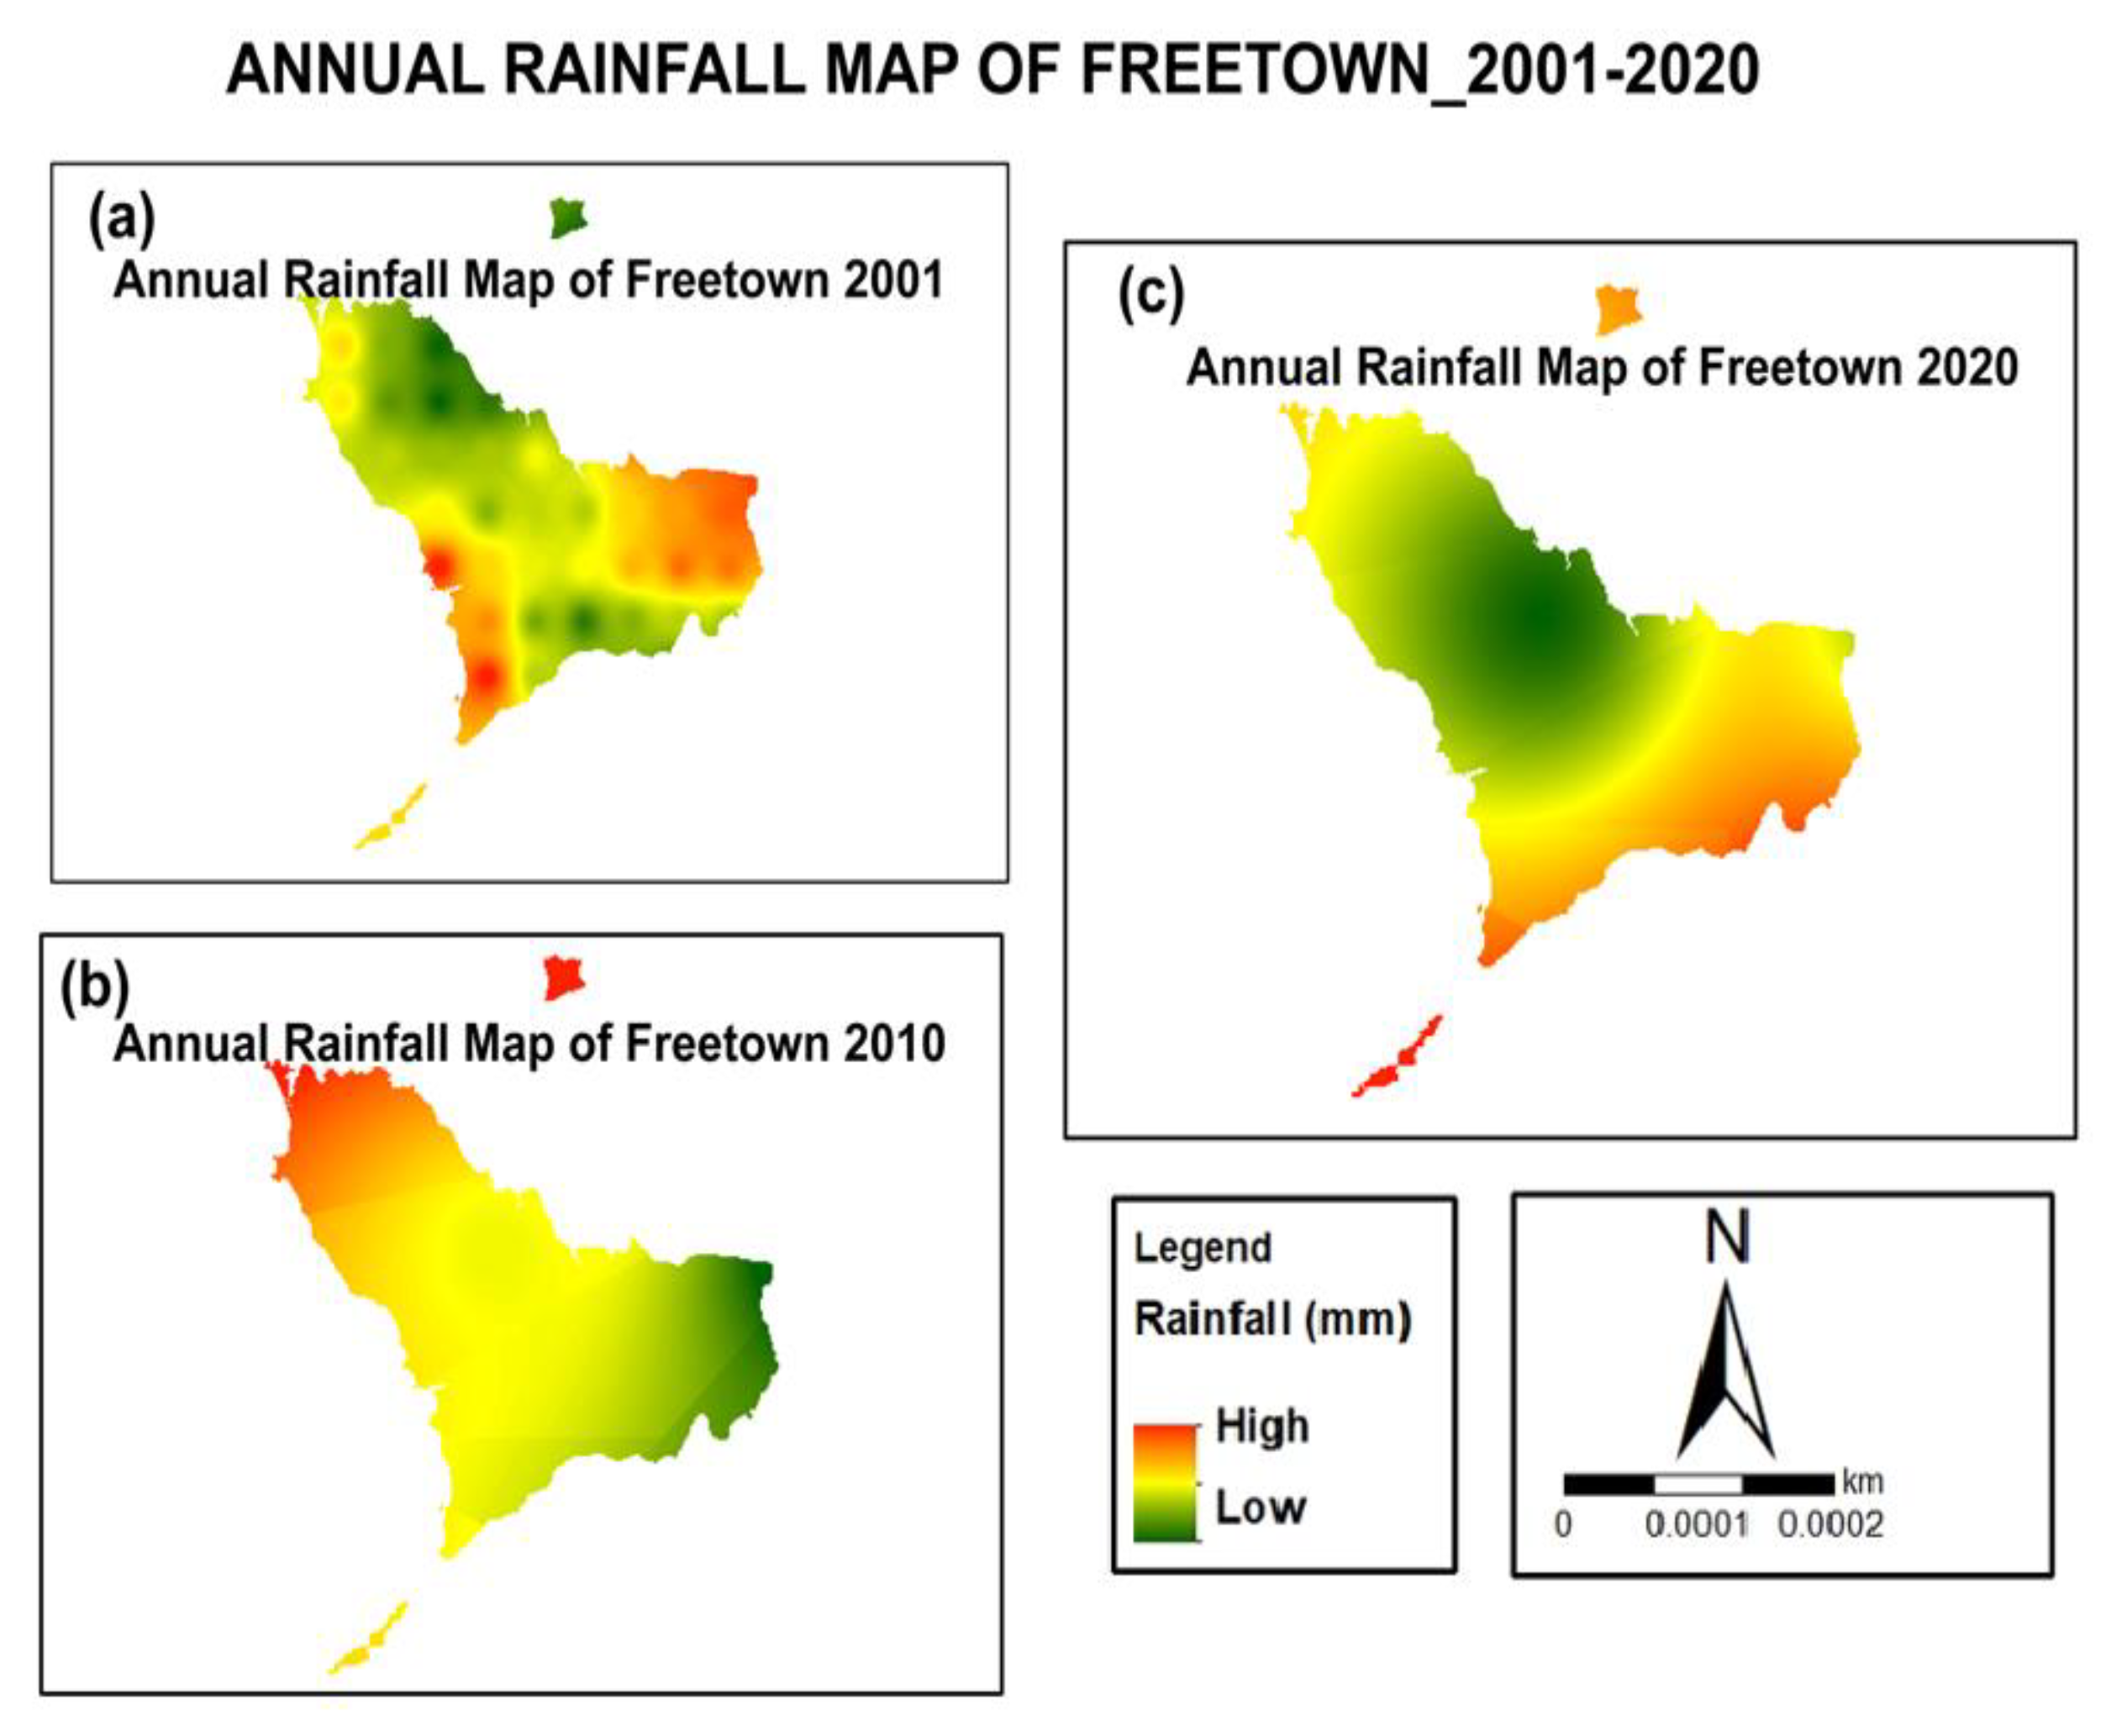
3.1.1. Rainfall
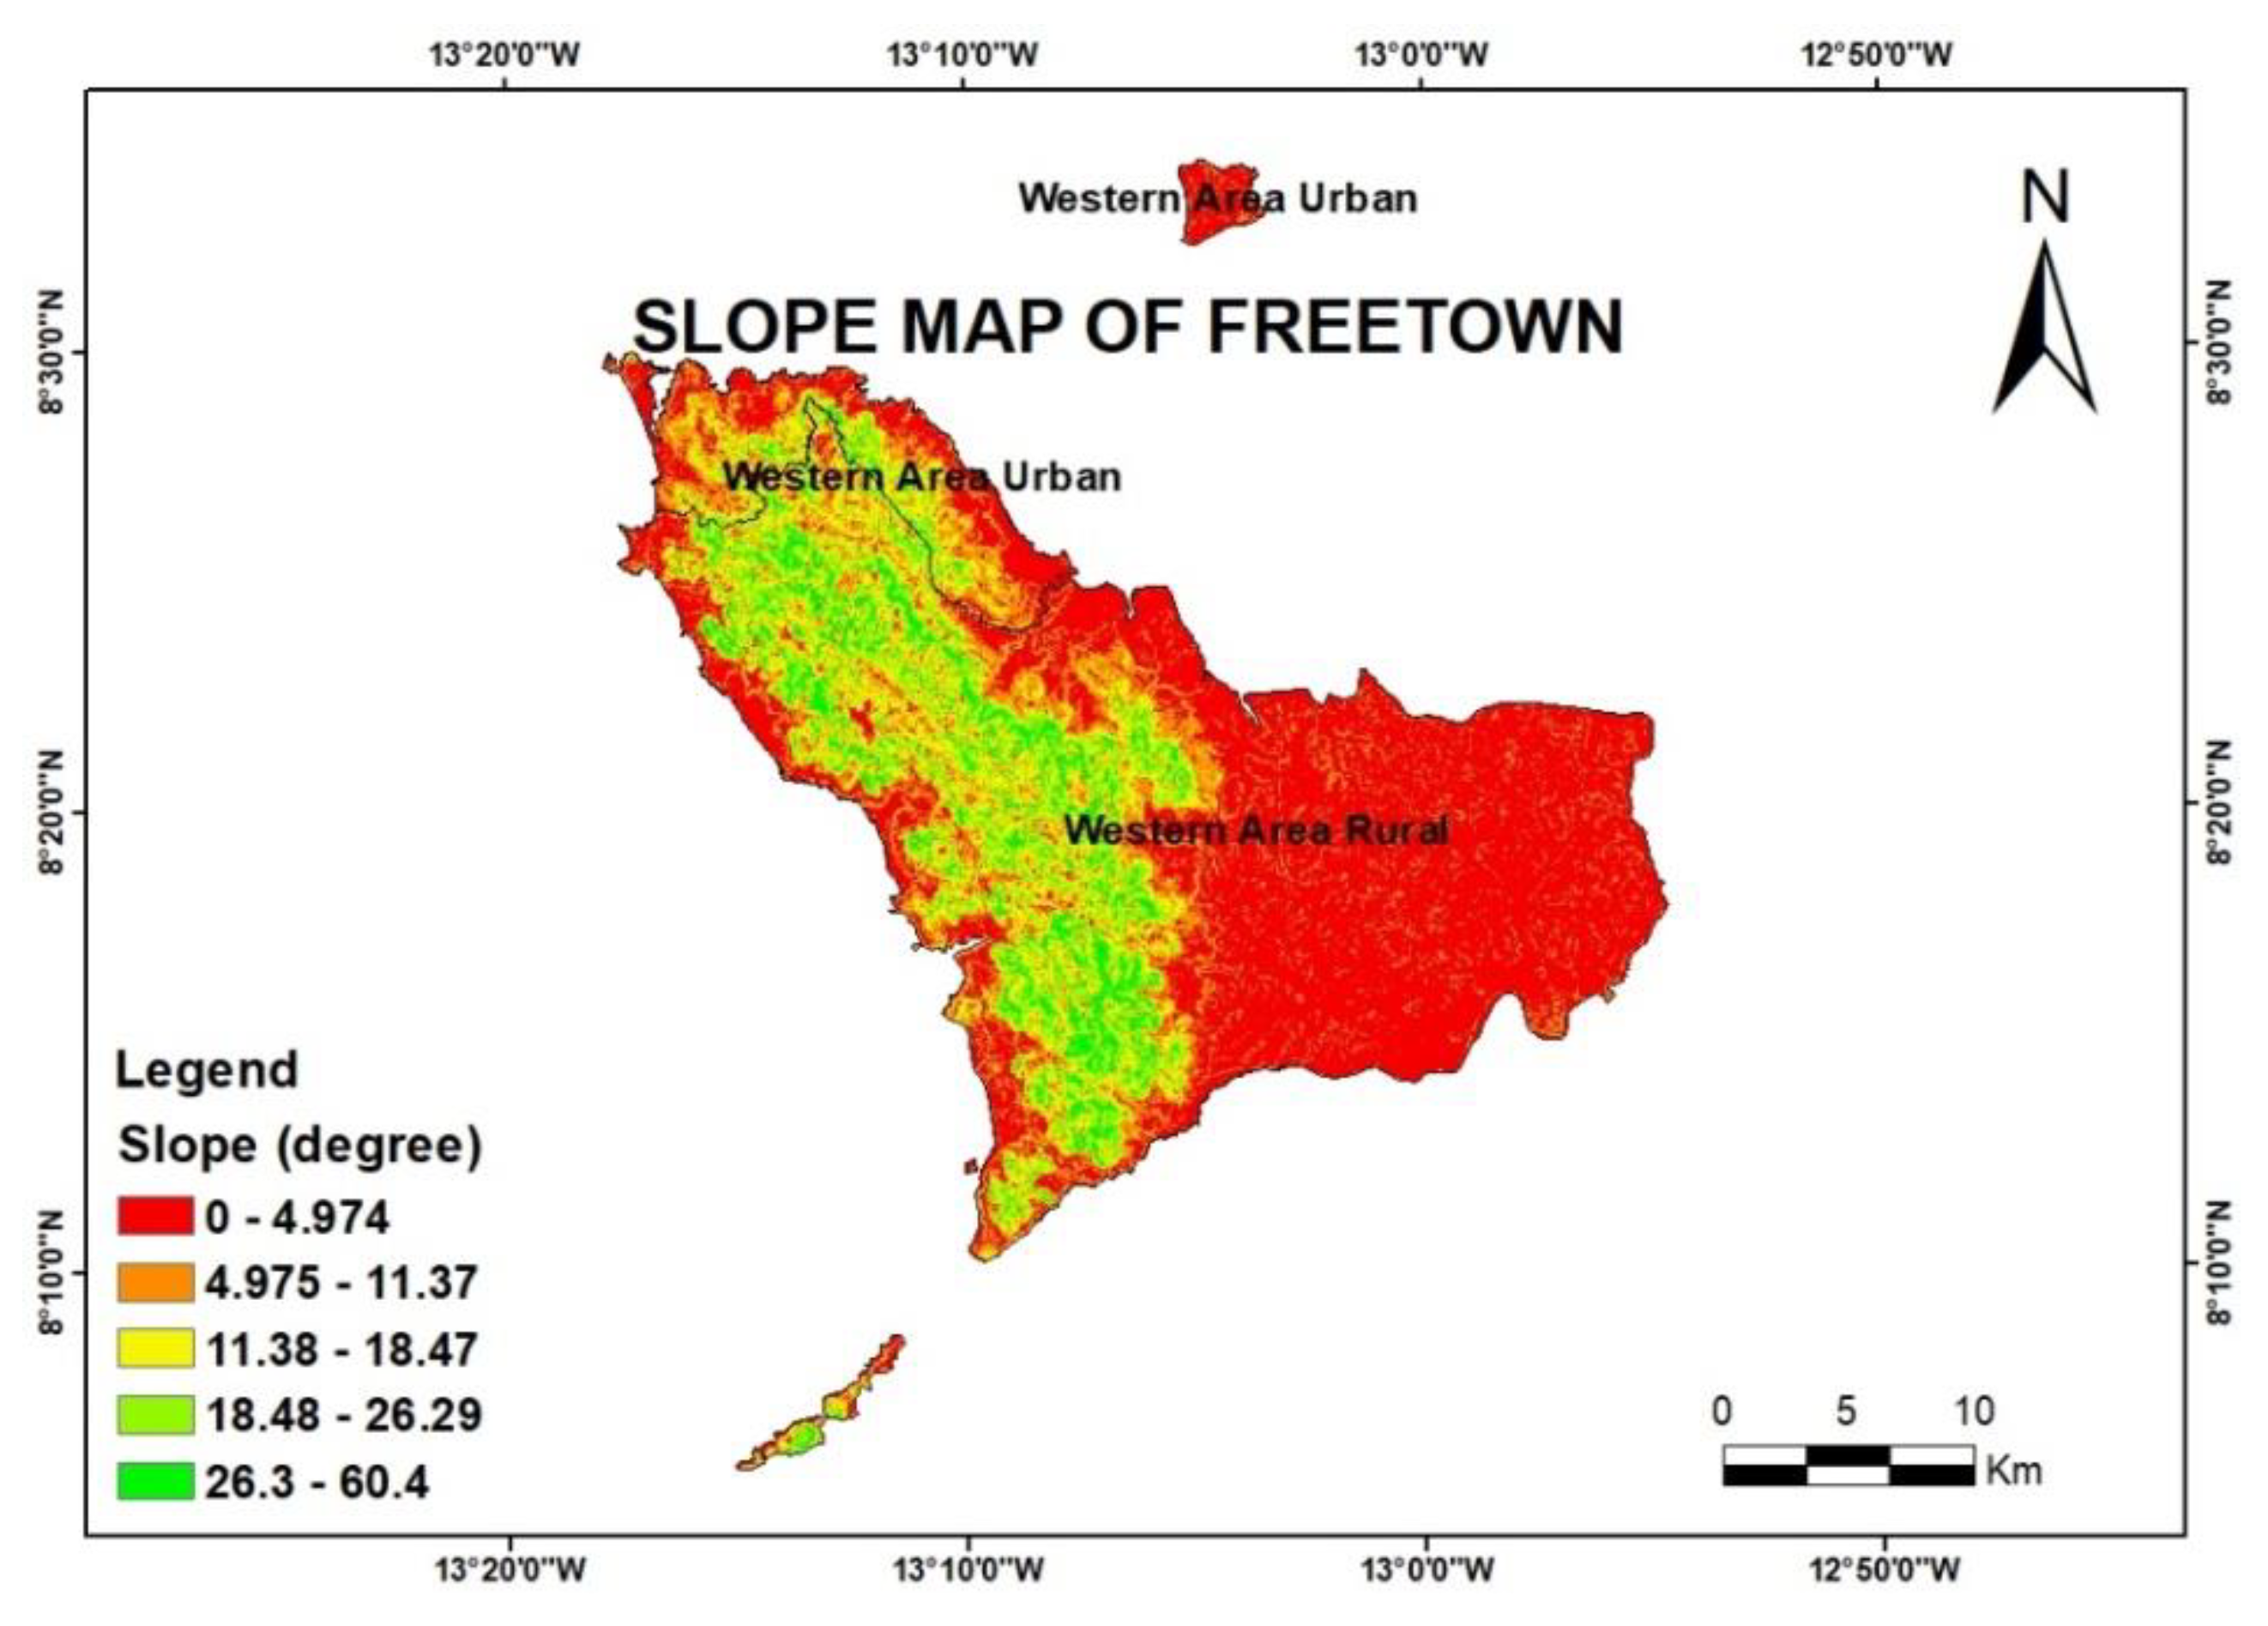
3.1.2. Slope
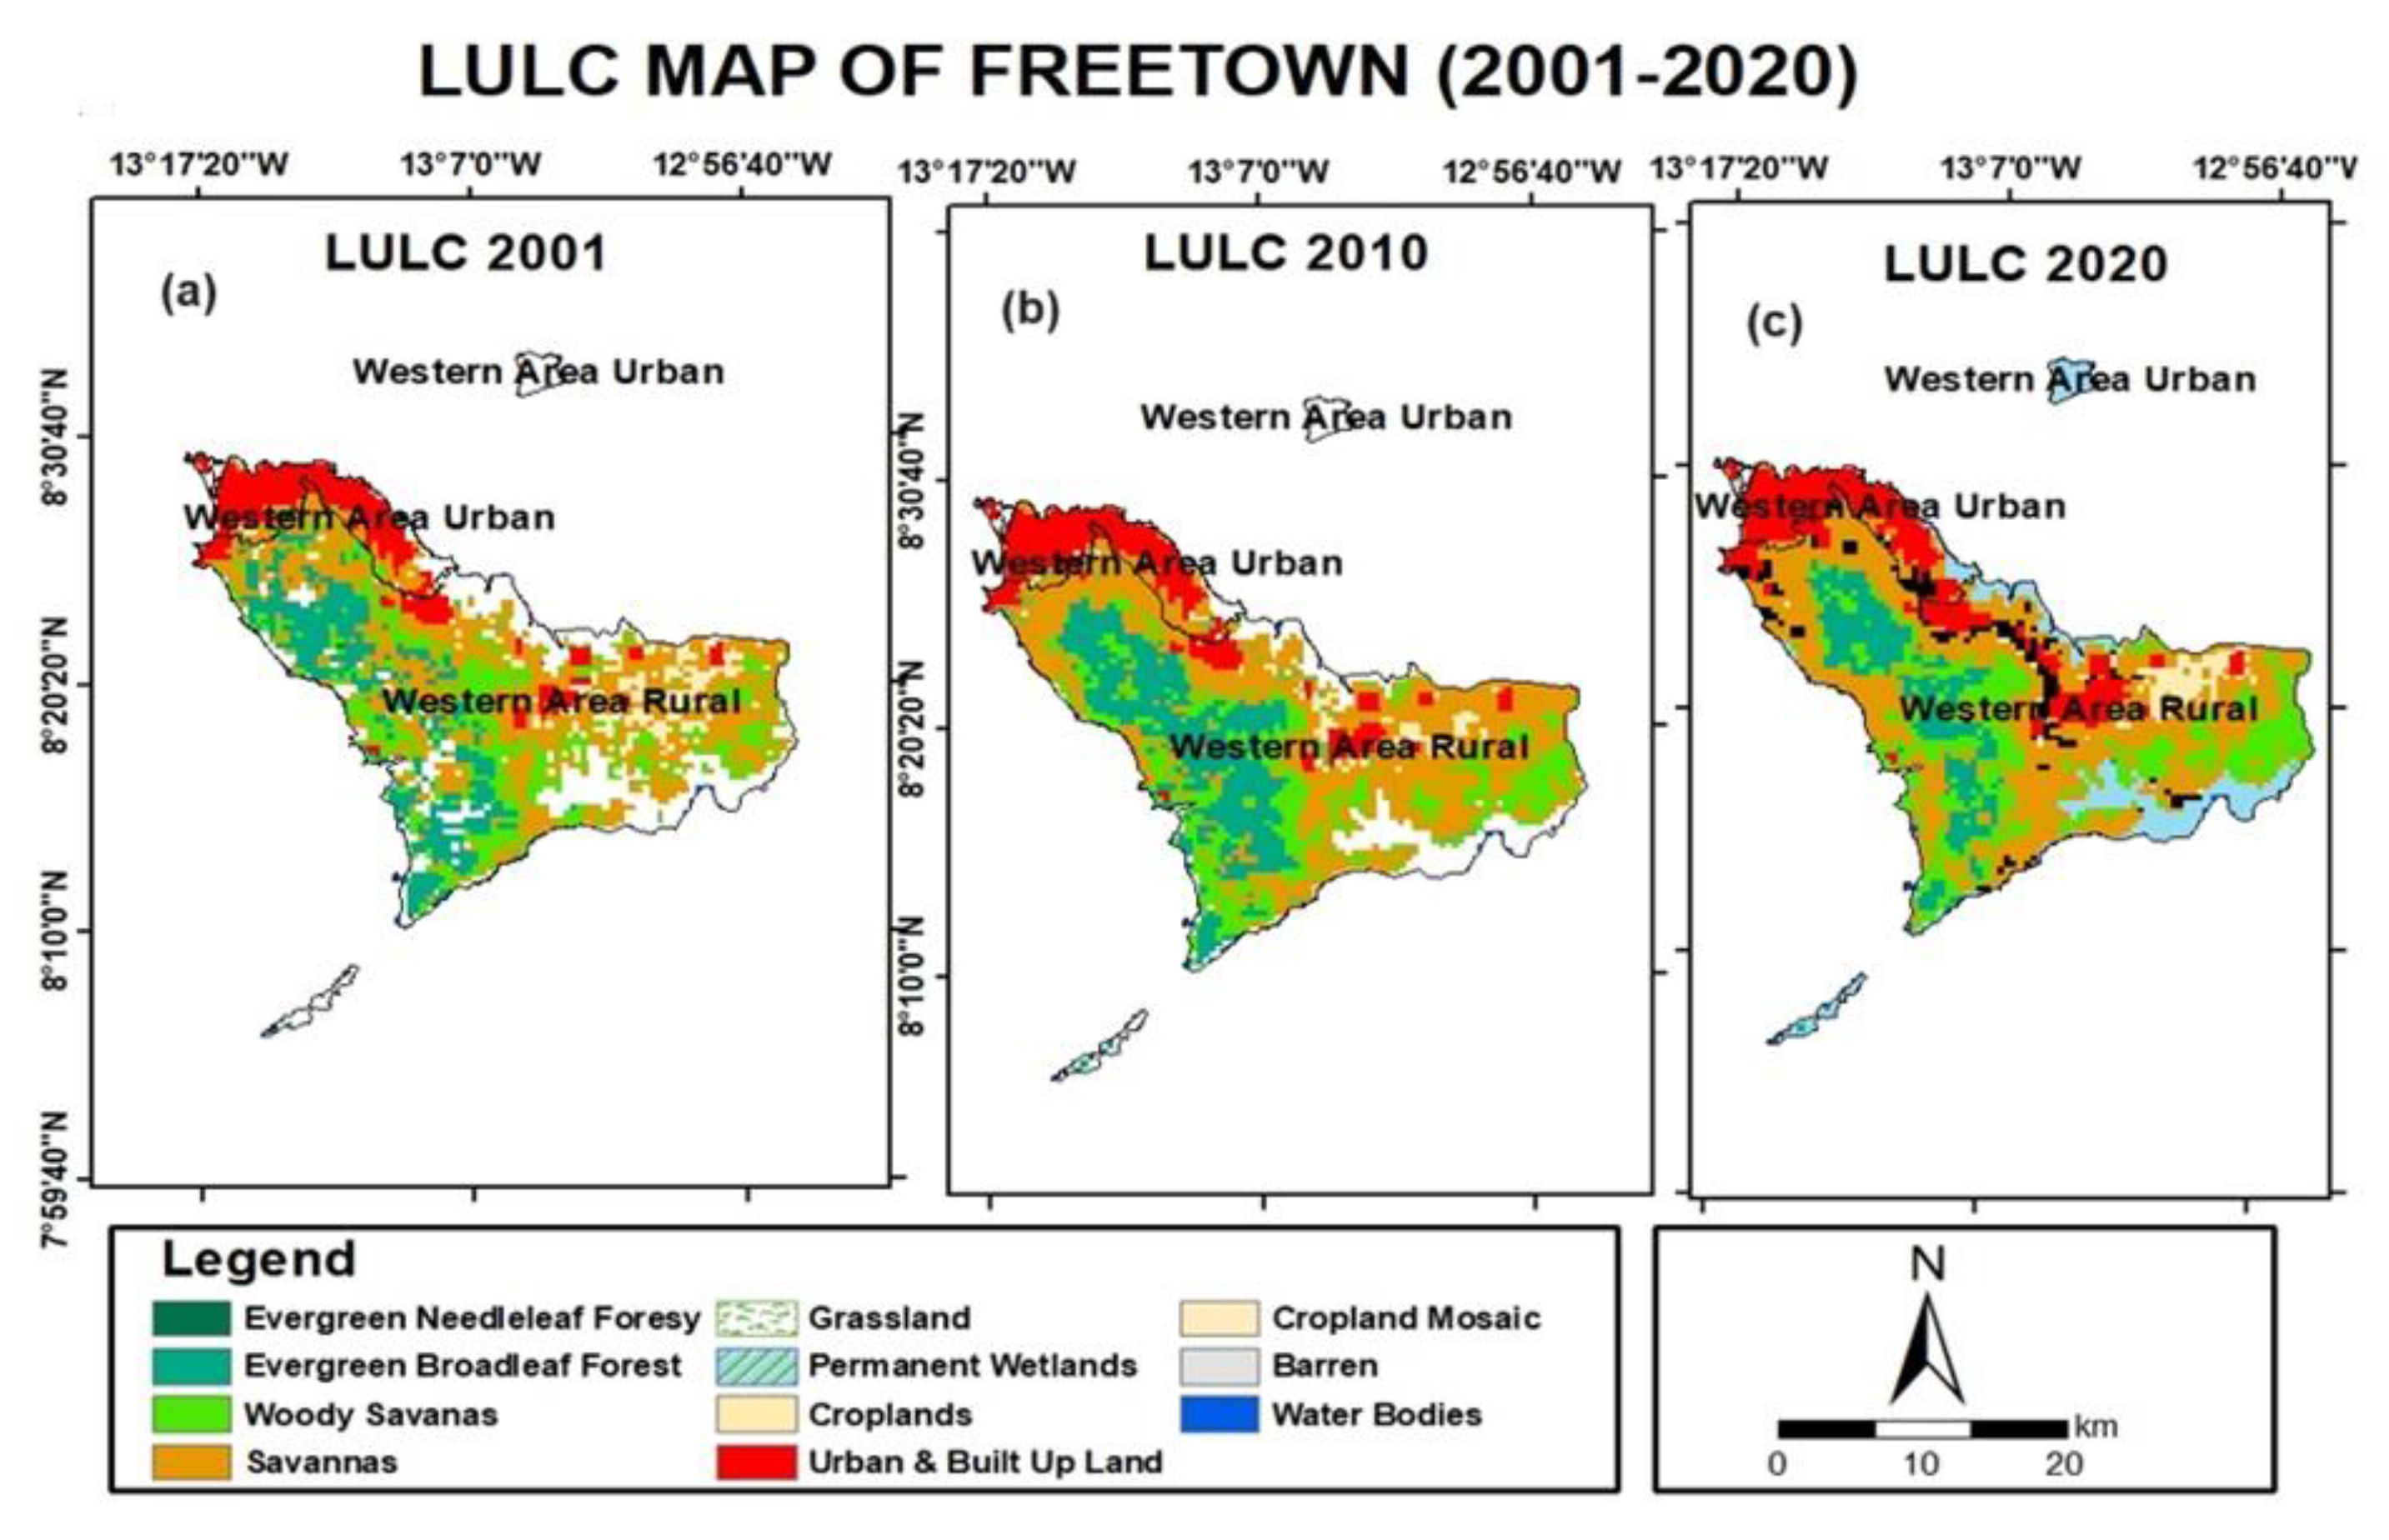
3.1.3. Land Use Land Cover
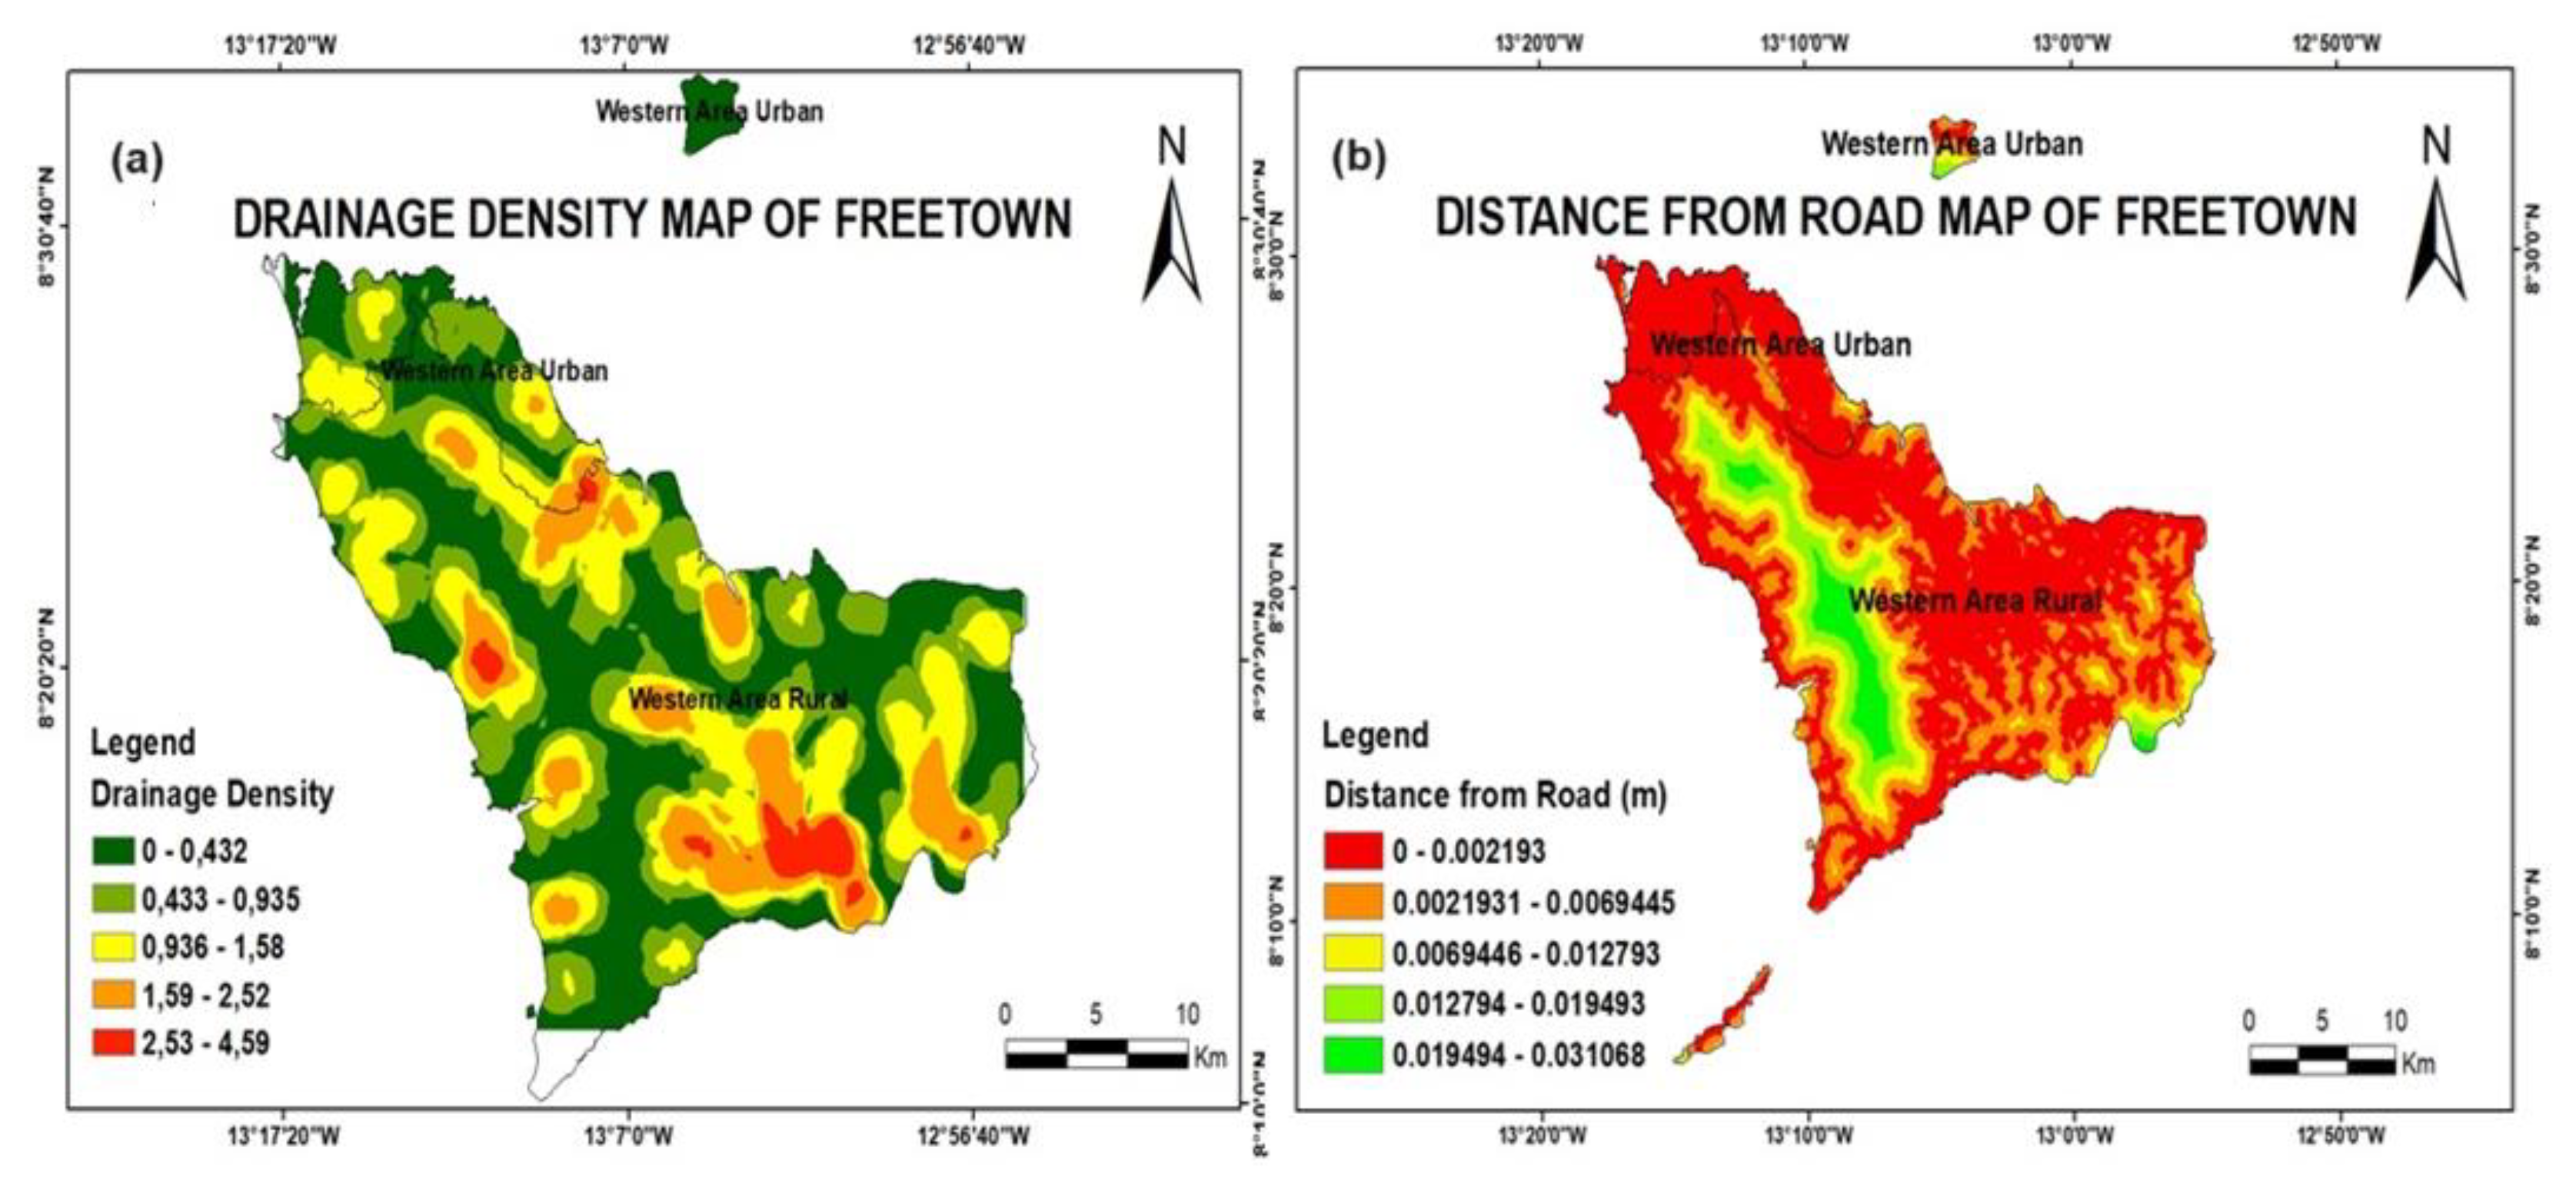
3.1.4. Drainage Density
3.1.5. Distance to Road
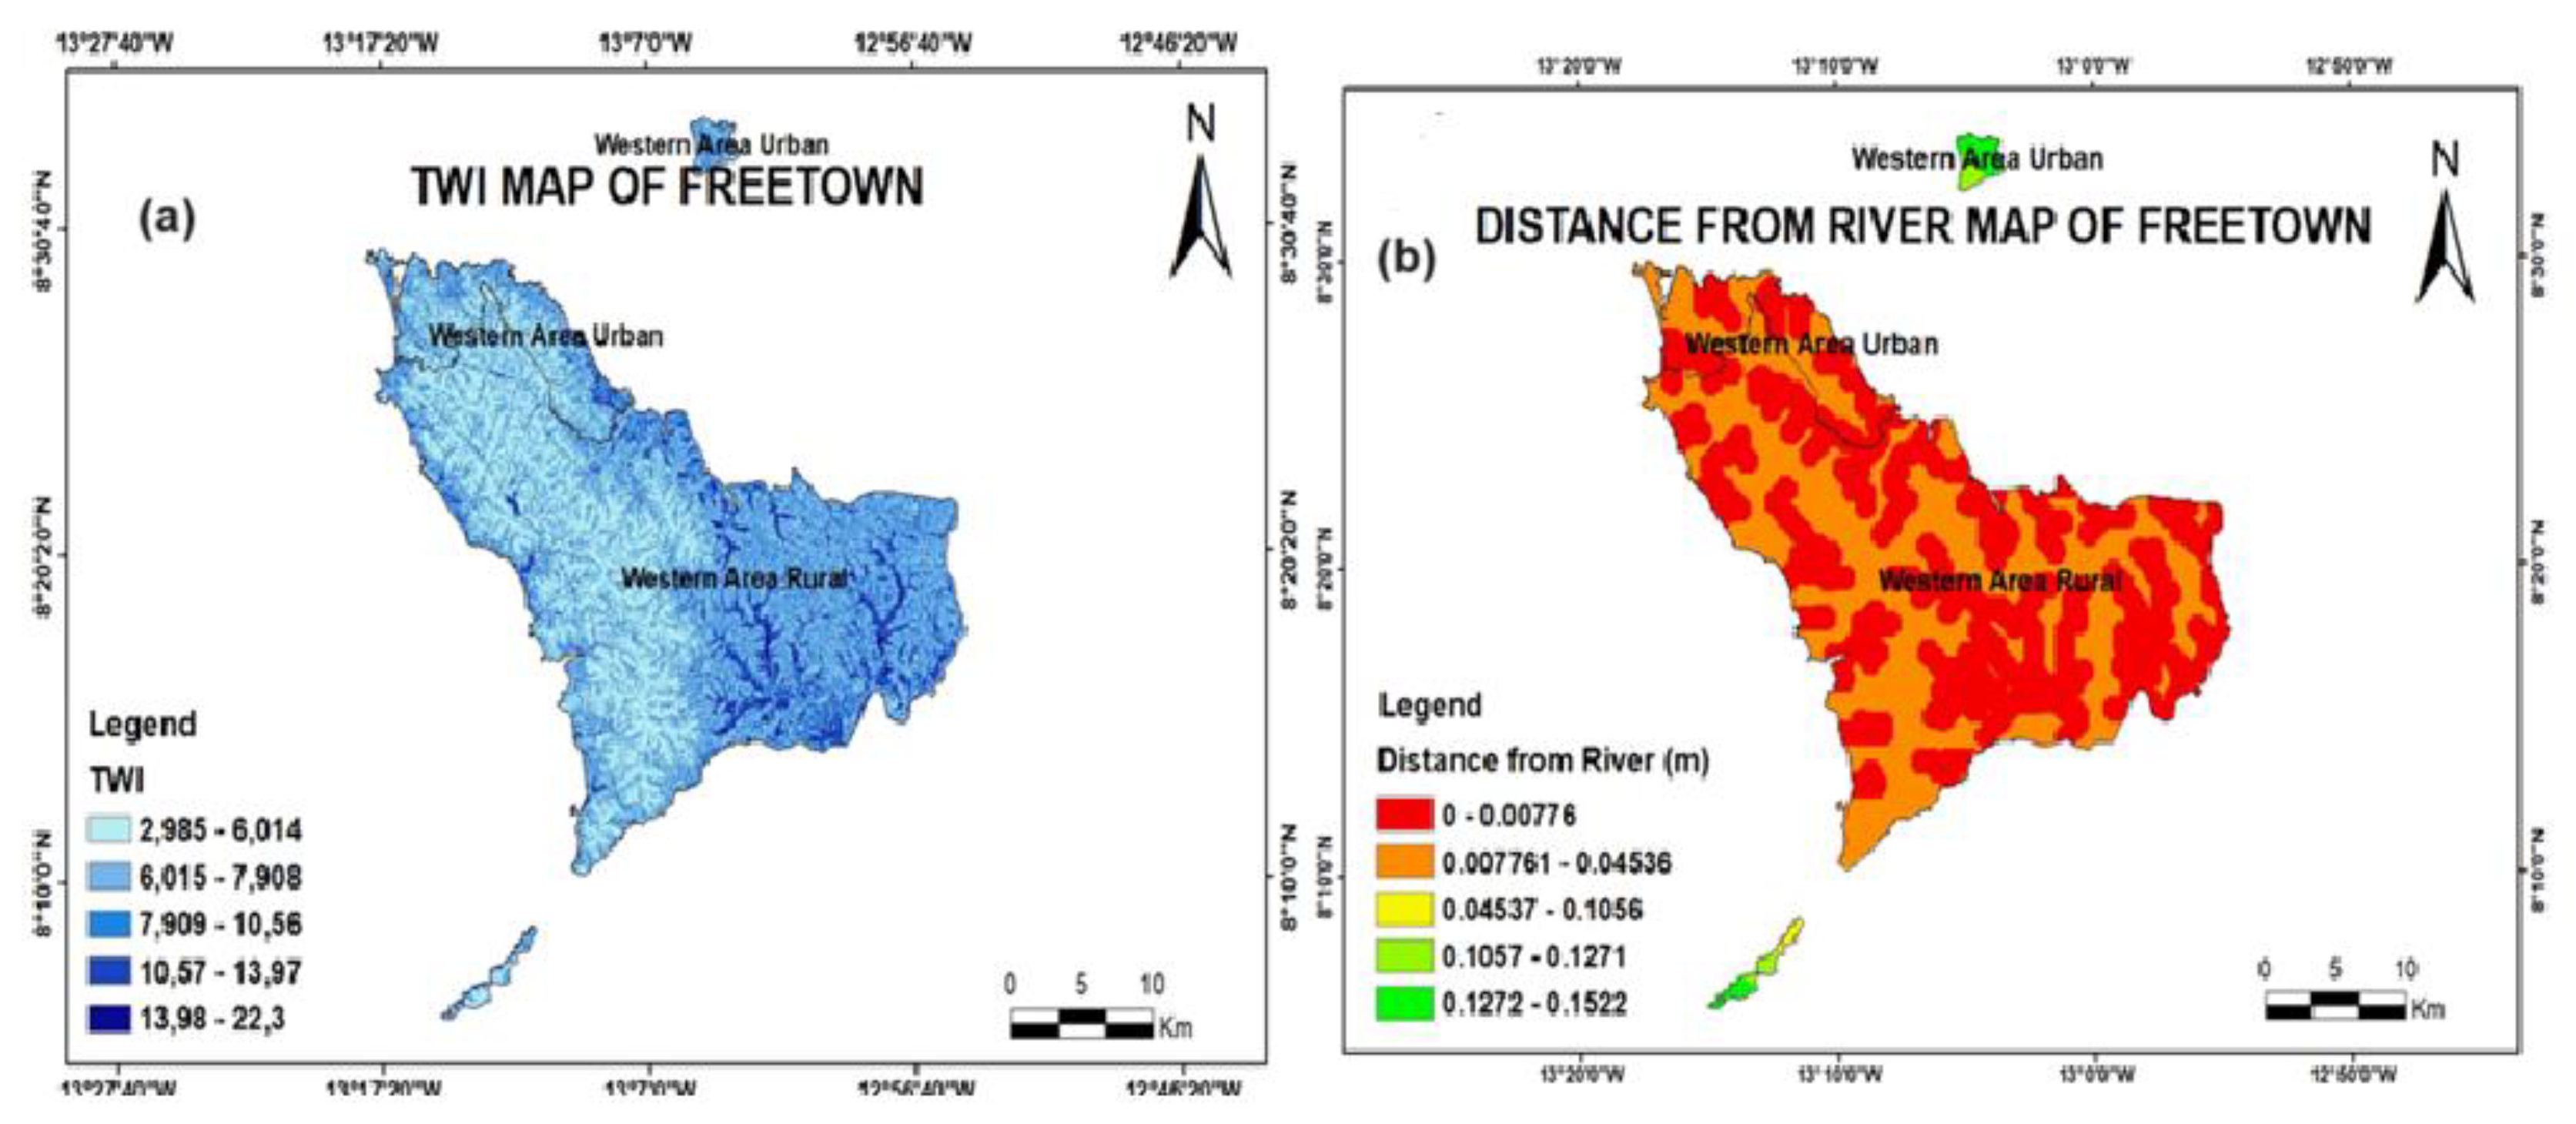
3.1.6. Topographic Wetness Index (TWI)
3.1.7. Distance to River
3.1.8. Normalized Difference Vegetation Index (NDVI)
3.1.9. Elevation
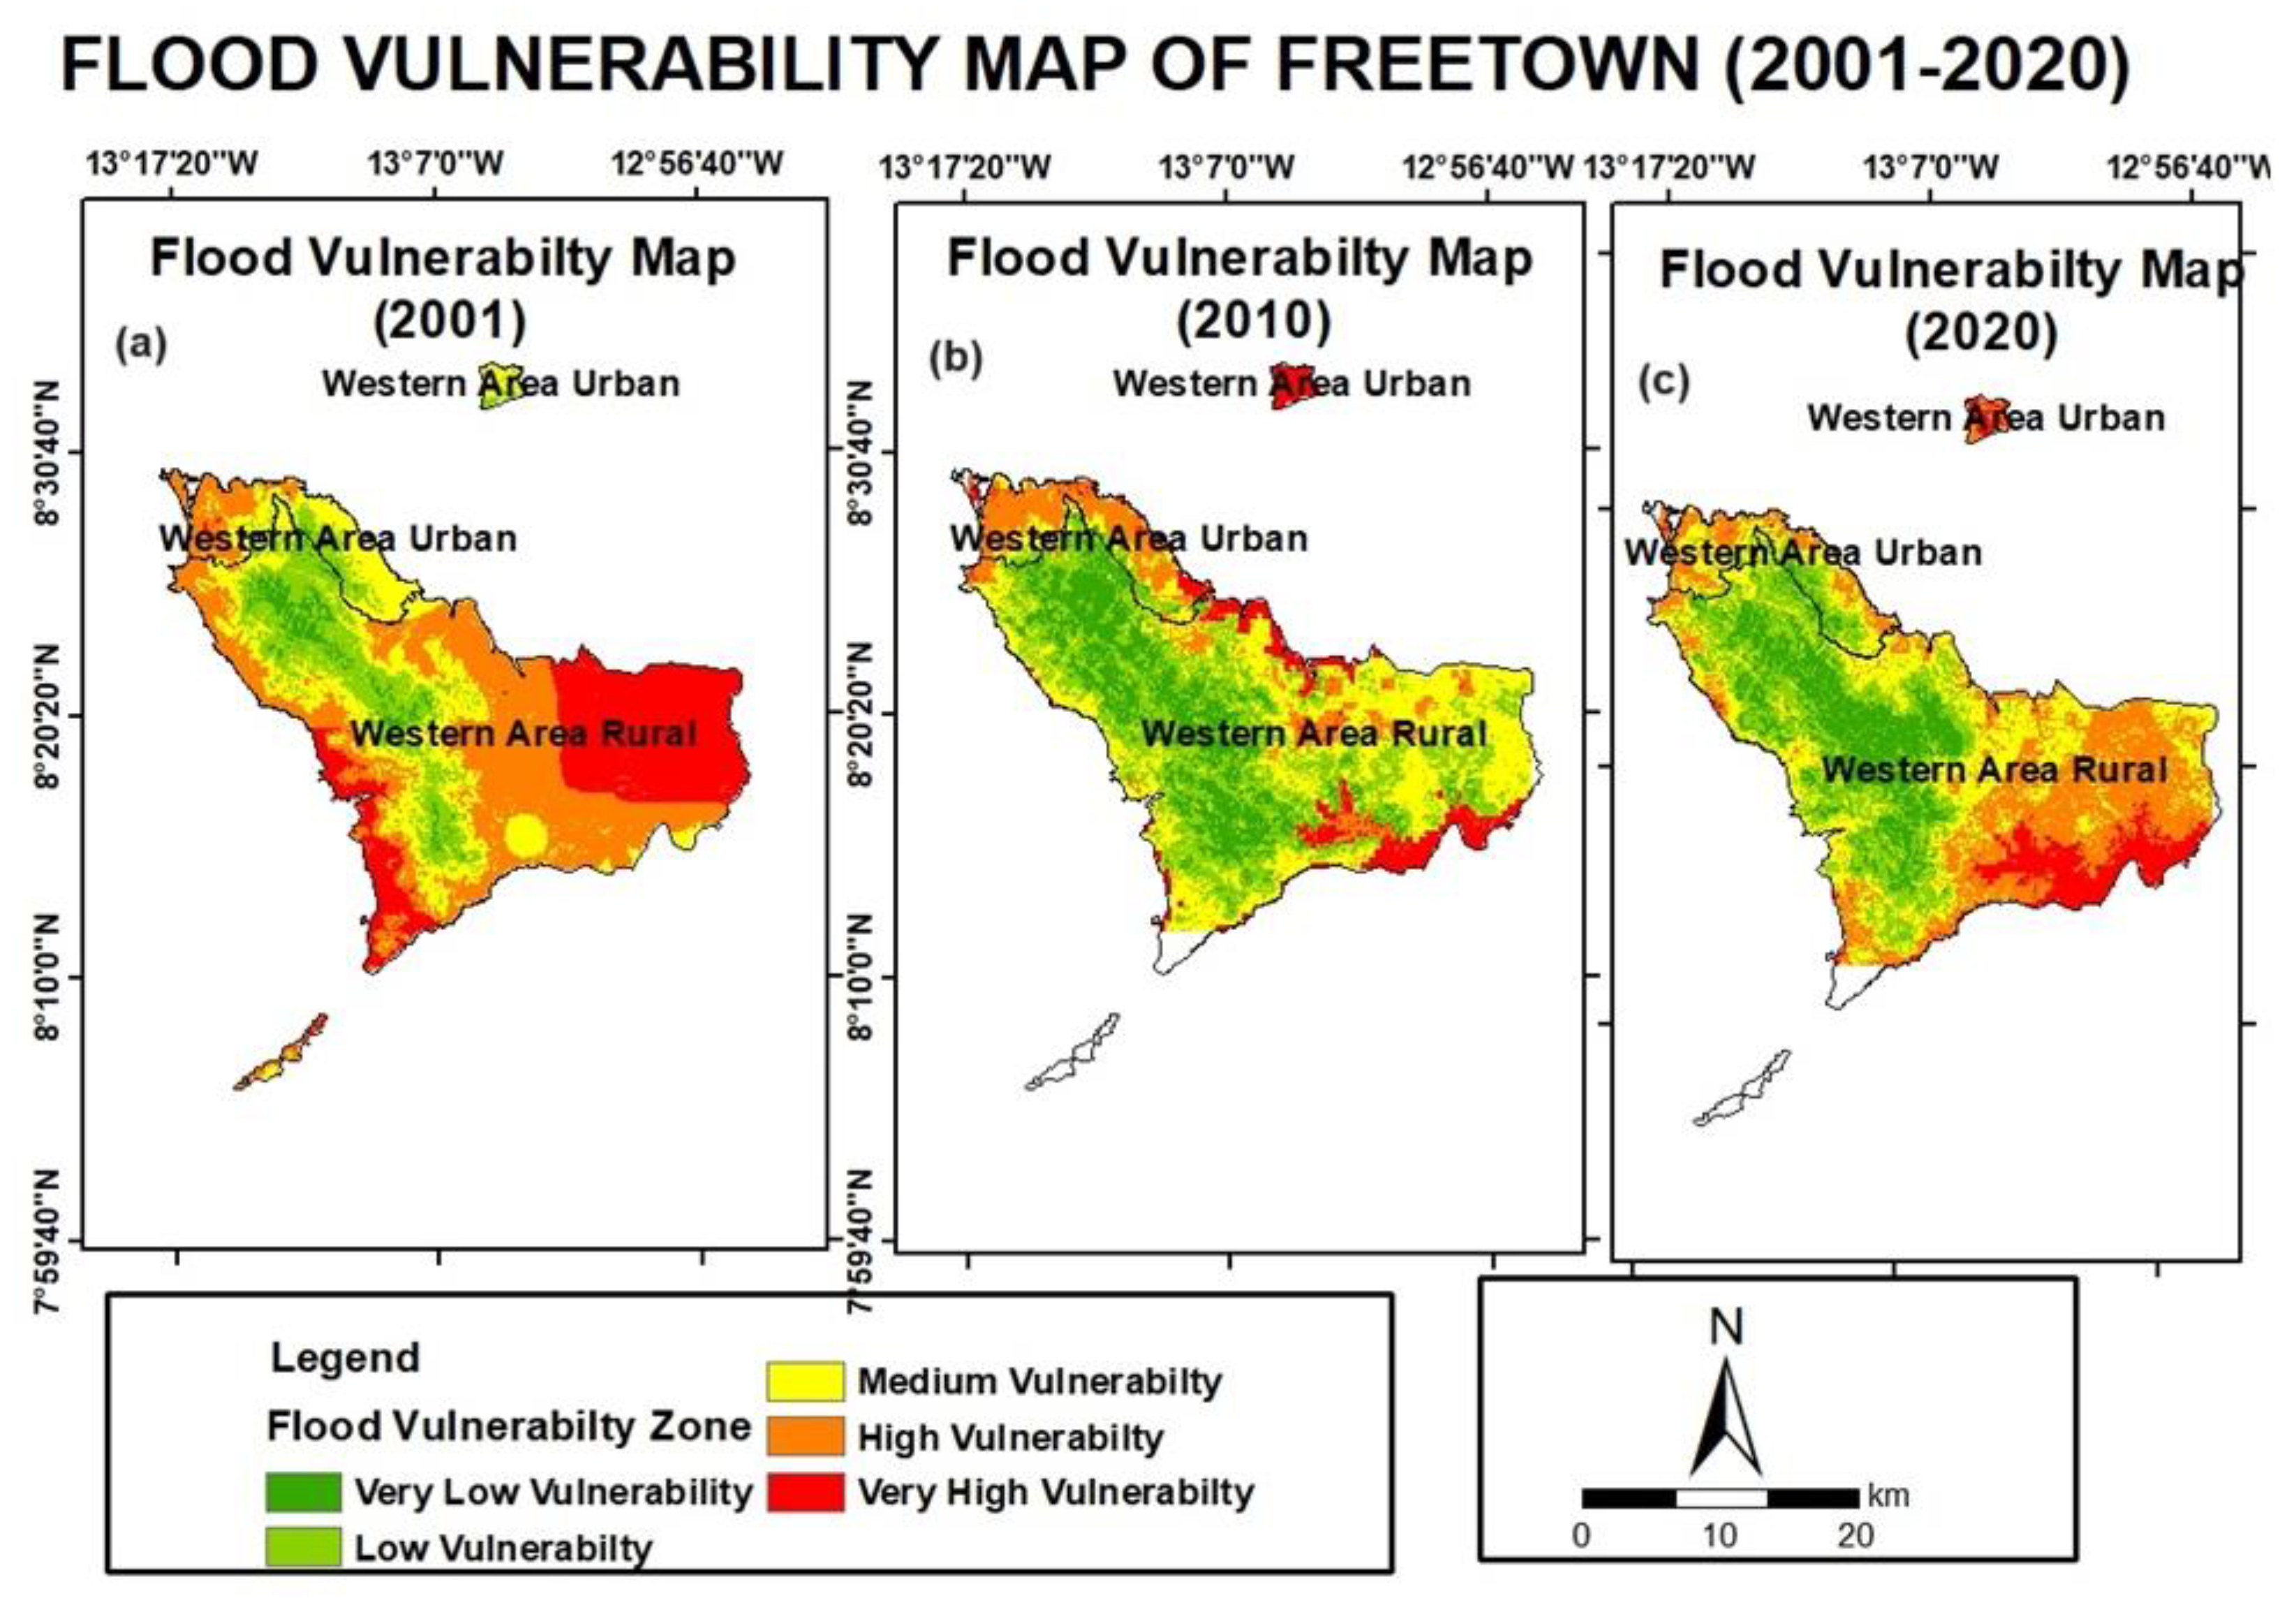
3.2. Flood Vulnerability Maps of Freetown
4. Discussion
5. Conclusions
Supplementary Materials
Author Contributions
Funding
Data Availability Statement
Acknowledgments
Conflicts of Interest
References
- Park, K.; Lee, M.-H. The Development and Application of the Urban Flood Risk Assessment Model for Reflecting upon Urban Planning Elements. Water 2019, 11, 920. [Google Scholar] [CrossRef]
- Berndtsson, R.; Becker, P.; Persson, A.; Aspegren, H.; Haghighatafshar, S.; Jönsson, K.; Larsson, R.; Mobini, S.; Mottaghi, M.; Nilsson, J.; et al. Drivers of changing urban flood risk: A framework for action. J. Environ. Manag. 2019, 240, 47–56. [Google Scholar] [CrossRef] [PubMed]
- Salazar-Briones, C.; Ruiz-Gibert, J.M.; Lomelí-Banda, M.A.; Mungaray-Moctezuma, A. An Integrated Urban Flood Vulnerability Index for Sustainable Planning in Arid Zones of Developing Countries. Water 2020, 12, 608. [Google Scholar] [CrossRef]
- Abdrabo, K.I.; Kantoush, S.A.; Esmaiel, A.; Saber, M.; Sumi, T.; Almamari, M.; Elboshy, B.; Ghoniem, S. An integrated indicator-based approach for constructing an urban flood vulnerability index as an urban decision-making tool using the PCA and AHP techniques: A case study of Alexandria, Egypt. Urban Clim. 2023, 48, 101426. [Google Scholar] [CrossRef]
- Ogie, R.; Holderness, T.; Dunn, S.; Turpin, E. Assessing the vulnerability of hydrological infrastructure to flood damage in coastal cities of developing nations. Comput. Environ. Urban Syst. 2018, 68, 97–109. [Google Scholar] [CrossRef]
- López-Valencia, A.P. Vulnerability assessment in urban areas exposed to flood risk: Methodology to explore green infrastructure benefits in a simulation scenario involving the Cañaveralejo River in Cali, Colombia. Nat. Hazards 2019, 99, 217–245. [Google Scholar] [CrossRef]
- Cea, L.; Costabile, P. Flood Risk in Urban Areas: Modelling, Management and Adaptation to Climate Change. A Review. Hydrology 2022, 9, 50. [Google Scholar] [CrossRef]
- Westra, S.; Varley, I.; Jordan, P.; Nathan, R.; Ladson, A.; Sharma, A.; Hill, P. Addressing Climatic Non-Stationarity in the Assessment of Flood Risk. Australas. J. Water Resour. 2010, 14, 1–16. [Google Scholar] [CrossRef]
- Trenberth, K.E. Challenges for Observing and Modeling the Global Water Cycle. In Remote Sensing of the Terrestrial Water Cycle, 1st ed.; Geophysical Monograph Series; Lakshmi, V., Alsdorf, D., Anderson, M., Biancamaria, S., Cosh, M., Entin, J., Huffman, G., Kustas, W., van Oevelen, P., Painter, T., et al., Eds.; Wiley: Hoboken, NJ, USA, 2014; pp. 511–519. [Google Scholar] [CrossRef]
- Shahirnia, M.; Vidrio-Sahagún, C.T.; He, J.; Valeo, C.; van Duin, B.; Beaudry, M.; Neumann, N.F. Land use and rainfall influences on bacterial levels and sources in stormwater ponds. Environ. Sci. Pollut. Res. 2023, 30, 112236–112251. [Google Scholar] [CrossRef]
- Clark-Ginsberg, A.; Blake, J.S.; Patel, K.V. Hybrid governance and disaster management in Freetown, Sierra Leone, Monrovia, Liberia, and Dar es Salaam, Tanzania. Disasters 2022, 46, 450–472. [Google Scholar] [CrossRef]
- Tempa, K. District flood vulnerability assessment using analytic hierarchy process (AHP) with historical flood events in Bhutan. PLoS ONE 2022, 17, e0270467. [Google Scholar] [CrossRef] [PubMed]
- Syldon, P.; Shrestha, B.B.; Miyamoto, M.; Tamakawa, K.; Nakamura, S. Assessing the impact of climate change on flood inundation and agriculture in the Himalayan Mountainous Region of Bhutan. J. Hydrol. Reg. Stud. 2024, 52, 101687. [Google Scholar] [CrossRef]
- Cotugno, A.; Smith, V.; Baker, T.; Srinivasan, R. A Framework for Calculating Peak Discharge and Flood Inundation in Ungauged Urban Watersheds Using Remotely Sensed Precipitation Data: A Case Study in Freetown, Sierra Leone. Remote Sens. 2021, 13, 3806. [Google Scholar] [CrossRef]
- Cobbinah, P.B.; Addaney, M. Sustainable Urban Futures in Africa, 1st ed.; Routledge: New York, NY, USA, 2021; Available online: https://www.taylorfrancis.com/books/9781003181484 (accessed on 29 August 2024).
- Kanani-Sadat, Y.; Arabsheibani, R.; Karimipour, F.; Nasseri, M. A new approach to flood susceptibility assessment in data-scarce and ungauged regions based on GIS-based hybrid multi criteria decision-making method. J. Hydrol. 2019, 572, 17–31. [Google Scholar] [CrossRef]
- Saaty, T.L. Decision making with the analytic hierarchy process. Int. J. Serv. Sci. 2008, 1, 83. [Google Scholar] [CrossRef]
- Handayani, W.; Chigbu, U.E.; Rudiarto, I.; Putri, I.H.S. Urbanization and Increasing Flood Risk in the Northern Coast of Central Java—Indonesia: An Assessment towards Better Land Use Policy and Flood Management. Land 2020, 9, 343. [Google Scholar] [CrossRef]
- Dhawale, R.; Schuster-Wallace, C.J.; Pietroniro, A. Assessing the multidimensional nature of flood and drought vulnerability index: A systematic review of literature. Int. J. Disaster Risk Reduct. 2024, 112, 104764. [Google Scholar] [CrossRef]
- Lins-De-Barros, F.M. Integrated coastal vulnerability assessment: A methodology for coastal cities management integrating socioeconomic, physical and environmental dimensions—Case study of Região dos Lagos, Rio de Janeiro, Brazil. Ocean Coast. Manag. 2017, 149, 1–11. [Google Scholar] [CrossRef]
- Mourato, S.; Fernandez, P.; Pereira, L.G.; Moreira, M. Assessing Vulnerability in Flood Prone Areas Using Analytic Hierarchy Process—Group Decision Making and Geographic Information System: A Case Study in Portugal. Appl. Sci. 2023, 13, 4915. [Google Scholar] [CrossRef]
- Vidrio-Sahagún, C.T.; Ruschkowski, J.; He, J.; Pietroniro, A. A practice-oriented framework for stationary and nonstationary flood frequency analysis. Environ. Model. Softw. 2024, 173, 105940. [Google Scholar] [CrossRef]
- Hoque, M.A.-A.; Tasfia, S.; Ahmed, N.; Pradhan, B. Assessing Spatial Flood Vulnerability at Kalapara Upazila in Bangladesh Using an Analytic Hierarchy Process. Sensors 2019, 19, 1302. [Google Scholar] [CrossRef] [PubMed]
- Nelson, A.; Lindbergh, S.; Stephenson, L.; Halpern, J.; Arroyo, F.A.; Espinet, X.; González, M.C. Coupling Natural Hazard Estimates with Road Network Analysis to Assess Vulnerability and Risk: Case Study of Freetown (Sierra Leone). Transp. Res. Rec. J. Transp. Res. Board 2019, 2673, 11–24. [Google Scholar] [CrossRef]
- Das, S. Flood susceptibility mapping of the Western Ghat coastal belt using multi-source geospatial data and analytical hierarchy process (AHP). Remote Sens. Appl. Soc. Environ. 2020, 20, 100379. [Google Scholar] [CrossRef]
- Balica, S.F.; Wright, N.G.; Van Der Meulen, F. A flood vulnerability index for coastal cities and its use in assessing climate change impacts. Nat. Hazards 2012, 64, 73–105. [Google Scholar] [CrossRef]
- Alfieri, L.; Dottori, F.; Betts, R.; Salamon, P.; Feyen, L. Multi-Model Projections of River Flood Risk in Europe under Global Warming. Climate 2018, 6, 6. [Google Scholar] [CrossRef]
- Bauer, T.; Ingram, V.; De Jong, W.; Arts, B. The socio-economic impact of extreme precipitation and flooding on forest livelihoods: Evidence from the Bolivian Amazon. Int. For. Rev. 2018, 20, 314–331. [Google Scholar] [CrossRef]
- Karmaoui, A.; Balica, S. A new flood vulnerability index adapted for the pre-Saharan region. Int. J. River Basin Manag. 2021, 19, 93–107. [Google Scholar] [CrossRef]
- DeCorse, C.R. Sierra Leone in the Atlantic World: Concepts, contours, and exchange. Atl. Stud. 2015, 12, 296–316. [Google Scholar] [CrossRef]
- Redshaw, P.; Boon, D.; Campbell, G.; Willis, M.; Mattai, J.; Free, M.; Jordan, C.; Kemp, S.J.; Morley, A.; Thomas, M. The 2017 Regent Landslide, Freetown Peninsula, Sierra Leone. Q. J. Eng. Geol. Hydrogeol. 2019, 52, 435–444. [Google Scholar] [CrossRef]
- Cui, Y.; Cheng, D.; Choi, C.E.; Jin, W.; Lei, Y.; Kargel, J.S. The cost of rapid and haphazard urbanization: Lessons learned from the Freetown landslide disaster. Landslides 2019, 16, 1167–1176. [Google Scholar] [CrossRef]
- Taylor, E.T.; Kamara, I.S.; Bockarie, A. Rainfall Pattern in Freetown, Sierra Leone: From a Retrospective Viewpoint. In Proceedings of the International Conference ADAPTtoCLIMATE, Nicosia, Cyprus, 27–28 March 2014. [Google Scholar]
- Ibrahim, A.S.; Memon, F.A.; Butler, D. Seasonal Variation of Rainy and Dry Season Per Capita Water Consumption in Freetown City Sierra Leone. Water 2021, 13, 499. [Google Scholar] [CrossRef]
- Mustafa, E.K.; El-Hamid, H.T.A.; Tarawally, M. Spatial and temporal monitoring of drought based on land surface temperature, Freetown City, Sierra Leone, West Africa. Arab. J. Geosci. 2021, 14, 1013. [Google Scholar] [CrossRef]
- Baky, M.A.A.; Islam, M.; Paul, S. Flood Hazard, Vulnerability and Risk Assessment for Different Land Use Classes Using a Flow Model. Earth Syst. Environ. 2020, 4, 225–244. [Google Scholar] [CrossRef]
- Roy, D.C.; Blaschke, T. Spatial vulnerability assessment of floods in the coastal regions of Bangladesh. Geomat. Nat. Hazards Risk. 2015, 6, 21–44. [Google Scholar] [CrossRef]
- Ariff, H.; Salit, M.S.; Ismail, N.; Nukman, Y. Use of Analytical Hierarchy Process (AHP) for Selecting the Best Design Concept. J. Teknol. 2012, 49, 1–18. Available online: https://journals.utm.my/index.php/jurnalteknologi/article/view/188 (accessed on 29 August 2024). [CrossRef]
- Holmes, K.; Chadwick, O.; Kyriakidis, P. Error in a USGS 30-meter digital elevation model and its impact on terrain modeling. J. Hydrol. 2000, 233, 154–173. [Google Scholar] [CrossRef]
- Friedl M SMD. MODIS/Terra+Aqua Land Cover Type Yearly L3 Global 500 m 2024. Available online: https://lpdaac.usgs.gov/products/mcd12q1v061/ (accessed on 1 August 2024).
- de Brito, M.M.; Evers, M. Multi-criteria decision-making for flood risk management: A survey of the current state of the art. Nat. Hazards Earth Syst. Sci. 2016, 16, 1019–1033. [Google Scholar] [CrossRef]
- Dijkstra, T.K. On the extraction of weights from pairwise comparison matrices. Cent. Eur. J. Oper. Res. 2013, 21, 103–123. [Google Scholar] [CrossRef]
- Zhang, L.; Nan, Z.; Yu, W.; Ge, Y. Modeling Land-Use and Land-Cover Change and Hydrological Responses under Consistent Climate Change Scenarios in the Heihe River Basin, China. Water Resour. Manag. 2015, 29, 4701–4717. [Google Scholar] [CrossRef]
- Membele, G.M.; Naidu, M.; Mutanga, O. Examining flood vulnerability mapping approaches in developing countries: A scoping review. Int. J. Disaster Risk Reduct. 2022, 69, 102766. [Google Scholar] [CrossRef]
- Findi, E.N.; Wantim, M.N.; Ayonghe, S.N. Assessing Rainfall and Temperature Trend: Implication on flood patterns in vulnerable Communities of Limbe and Douala, Cameroon. Int. J. Environ. Sci. 2022, 7, 1–13. [Google Scholar]
- Tazen, F.; Diarra, A.; Kabore, R.F.W.; Ibrahim, B.; Bologo/Traoré, M.; Traoré, K.; Karambiri, H. Trends in flood events and their relationship to extreme rainfall in an urban area of Sahelian West Africa: The case study of Ouagadougou, Burkina Faso. J. Flood Risk Manag. 2019, 12, e12507. [Google Scholar] [CrossRef]
- Kundzewicz, Z. Flood risk and vulnerability in the changing climate. Ann. Wars Univ. Life Sci.—SGGW Land Reclam. 2008, 39, 21–31. Available online: http://archive.sciendo.com/SGGW/sggw.2008.39.issue--1/v10060-008-0002-9/v10060-008-0002-9.pdf (accessed on 29 August 2024). [CrossRef]
- Mishra, K.; Sinha, R. Flood risk assessment in the Kosi megafan using multi-criteria decision analysis: A hydro-geomorphic approach. Geomorphology 2020, 350, 106861. [Google Scholar] [CrossRef]
- Danumah, J.H.; Odai, S.N.; Saley, B.M.; Szarzynski, J.; Thiel, M.; Kwaku, A.; Kouame, F.K.; Akpa, L.Y. Flood risk assessment and mapping in Abidjan district using multi-criteria analysis (AHP) model and geoinformation techniques, (cote d’ivoire). Geoenvironmental Disasters 2016, 3, 10. [Google Scholar] [CrossRef]
- Nsangou, D.; Kpoumié, A.; Mfonka, Z.; Ngouh, A.N.; Fossi, D.H.; Jourdan, C.; Mbele, H.Z.; Mouncherou, O.F.; Vandervaere, J.-P.; Ngoupayou, J.R.N. Urban flood susceptibility modelling using AHP and GIS approach: Case of the Mfoundi watershed at Yaoundé in the South-Cameroon plateau. Sci. Afr. 2022, 15, e01043. [Google Scholar] [CrossRef]
- Radwan, F.; Alazba, A.A.; Mossad, A. Flood risk assessment and mapping using AHP in arid and semiarid regions. Acta Geophys. 2019, 67, 215–229. [Google Scholar] [CrossRef]
- Jamshed, A.; Birkmann, J.; Rana, I.A.; Feldmeyer, D. The effect of spatial proximity to cities on rural vulnerability against flooding: An indicator based approach. Ecol. Indic. 2020, 118, 106704. [Google Scholar] [CrossRef]
- Khoirunisa, N.; Ku, C.-Y.; Liu, C.-Y. A GIS-Based Artificial Neural Network Model for Flood Susceptibility Assessment. Int. J. Environ. Res. Public Health 2021, 18, 1072. [Google Scholar] [CrossRef]
- Ntajal, J.; Lamptey, B.L.; Mahamadou, I.B.; Nyarko, B.K. Flood disaster risk mapping in the Lower Mono River Basin in Togo, West Africa. Int. J. Disaster Risk Reduct. 2017, 23, 93–103. [Google Scholar] [CrossRef]
- Bhuyan, M.J.; Deka, N.; Saikia, A. Micro-spatial flood risk assessment in Nagaon district, Assam (India) using GIS-based multi-criteria decision analysis (MCDA) and analytical hierarchy process (AHP). Risk Anal. 2024, 44, 817–832. [Google Scholar] [CrossRef] [PubMed]
- Rudorff, C.M.; Melack, J.M.; Bates, P.D. Flooding dynamics on the lower Amazon floodplain: 2. Seasonal and interannual hydrological variability: Lower Amazon Floodplain Hydrological Variability. Water Resour. Res. 2014, 50, 635–649. [Google Scholar] [CrossRef]
- Wang, G.; Hu, Z.; Liu, Y.; Zhang, G.; Liu, J.; Lyu, Y.; Gu, Y.; Huang, X.; Zhang, Q.; Tong, Z.; et al. Impact of Expansion Pattern of Built-Up Land in Floodplains on Flood Vulnerability: A Case Study in the North China Plain Area. Remote Sens. 2020, 12, 3172. [Google Scholar] [CrossRef]
- Taherizadeh, M.; Niknam, A.; Nguyen-Huy, T.; Mezősi, G.; Sarli, R. Flash flood-risk areas zoning using integration of decision-making trial and evaluation laboratory, GIS-based analytic network process and satellite-derived information. Nat. Hazards 2023, 118, 2309–2335. [Google Scholar] [CrossRef]
- Swain, K.C.; Singha, C.; Nayak, L. Flood Susceptibility Mapping through the GIS-AHP Technique Using the Cloud. ISPRS Int. J. Geo-Inf. 2020, 9, 720. [Google Scholar] [CrossRef]
- Das, S. Geographic information system and AHP-based flood hazard zonation of Vaitarna basin, Maharashtra, India. Arab. J. Geosci. 2018, 11, 576. [Google Scholar] [CrossRef]
- Hammami, S.; Zouhri, L.; Souissi, D.; Souei, A.; Zghibi, A.; Marzougui, A.; Dlala, M. Application of the GIS based multi-criteria decision analysis and analytical hierarchy process (AHP) in the flood susceptibility mapping (Tunisia). Arab. J. Geosci. 2019, 12, 653. [Google Scholar] [CrossRef]
- Aladejana, O.; Salami, A.T.; Adetoro, O.O. Potential flood hazard zone mapping based on geomorphologic considerations and fuzzy analytical hierarchy model in a data scarce West African basin. Geocarto Int. 2021, 36, 2160–2185. [Google Scholar] [CrossRef]
- Ahmadalipour, A.; Moradkhani, H. A data-driven analysis of flash flood hazard, fatalities, and damages over the CONUS during 1996–2017. J. Hydrol. 2019, 578, 124106. [Google Scholar] [CrossRef]
- Li, L.; Yang, J.; Wu, J. Future Flood Risk Assessment under the Effects of Land Use and Climate Change in the Tiaoxi Basin. Sensors 2020, 20, 6079. [Google Scholar] [CrossRef]
- Chaubey, P.K.; Kundu, A.; Mall, R.K. A geo-spatial inter-relationship with drainage morphometry, landscapes and NDVI in the context of climate change: A case study over the Varuna river basin (India). Spat. Inf. Res. 2019, 27, 627–641. [Google Scholar] [CrossRef]
- Liu, H.; Fang, C.; Miao, Y.; Ma, H.; Zhang, Q.; Zhou, Q. Spatio-temporal evolution of population and urbanization in the countries along the Belt and Road 1950–2050. J. Geogr. Sci. 2018, 28, 919–936. [Google Scholar] [CrossRef]
- Beven, K.J.; Kirkby, M.J. A physically based, variable contributing area model of basin hydrology / Un modèle à base physique de zone d’appel variable de l’hydrologie du bassin versant. Hydrol. Sci. Bull. 1979, 24, 43–69. [Google Scholar] [CrossRef]
- Lehner, B.; Verdin, K.; Jarvis, A. New Global Hydrography Derived from Spaceborne Elevation Data. Eos Trans. Am. Geophys. Union 2008, 89, 93–94. [Google Scholar] [CrossRef]
- Jones, B.; O’neill, B.C. Spatially explicit global population scenarios consistent with the Shared Socioeconomic Pathways. Environ. Res. Lett. 2016, 11, 084003. [Google Scholar] [CrossRef]


| S/No | Datasets | Description | Data Sources | Resolution |
|---|---|---|---|---|
| 1 | Rainfall | PDIR | PDIR-Now https://chrsdata.eng.uci.edu/ (accessed on 2 January 2024) | 1 km |
| 2 | Slope | Derived from DEM | DEM | 30 m |
| 3 | LULC | MODIS Land Cover V6.1 | USGS Earth Explorer https://earthexplorer.usgs.gov/ (accessed on 3 January 2024) | 500 m |
| 4 | Drainage Density | Extracted from DEM | DEM | 30 m |
| 5 | Distance to Road | Derived from BBBike and DEM | BBBike https://extract.bbbike.org/ (accessed on 4 January 2024) | 30 m |
| 6 | TWI | Extracted from DEM | DEM | 30 m |
| 7 | Distance to River | HydroSHEDS | HydroSHEDS https://www.hydrosheds.org/ (accessed on 3 January 2024) | 3 arc seconds |
| 8 | NDVI | MODIS Vegetation Indices V6.1 | USGS Earth Explorer https://earthexplorer.usgs.gov/ (accessed on 3 January 2024) | 250 m |
| 9 | Elevation | SRTM | USGS Earth Explorer https://earthexplorer.usgs.gov/ (accessed on 3 January 2024) | 30 m |
Disclaimer/Publisher’s Note: The statements, opinions and data contained in all publications are solely those of the individual author(s) and contributor(s) and not of MDPI and/or the editor(s). MDPI and/or the editor(s) disclaim responsibility for any injury to people or property resulting from any ideas, methods, instructions or products referred to in the content. |
© 2024 by the authors. Licensee MDPI, Basel, Switzerland. This article is an open access article distributed under the terms and conditions of the Creative Commons Attribution (CC BY) license (https://creativecommons.org/licenses/by/4.0/).
Share and Cite
Koroma, A.O.; Saber, M.; Abdelbaki, C. Urban Flood Vulnerability Assessment in Freetown, Sierra Leone: AHP Approach. Hydrology 2024, 11, 158. https://doi.org/10.3390/hydrology11100158
Koroma AO, Saber M, Abdelbaki C. Urban Flood Vulnerability Assessment in Freetown, Sierra Leone: AHP Approach. Hydrology. 2024; 11(10):158. https://doi.org/10.3390/hydrology11100158
Chicago/Turabian StyleKoroma, Abdulai Osman, Mohamed Saber, and Cherifa Abdelbaki. 2024. "Urban Flood Vulnerability Assessment in Freetown, Sierra Leone: AHP Approach" Hydrology 11, no. 10: 158. https://doi.org/10.3390/hydrology11100158