4.2.1. The Influence of Factors in Different Years
Using the R programming language, the information value (IV) of each variable was calculated for each of the five years to measure the influence of the independent variables on the life satisfaction of the elderly. Since variables with an IV of less than 0.02 are considered to have no influence on the dependent variable, variables for which the IV was always less than 0.02 were not considered. Therefore, marital status and main source of life were excluded, leaving 16 variables. The variables and their IV scores for the five years are presented in
Table A1 in
Appendix A. In the following graphs, variables belonging to one dimension are represented with the same color: demographic variables are in blue; physiological variables are in gray; psychological variables are in green; economic variables are in red; and, social variables are in purple.
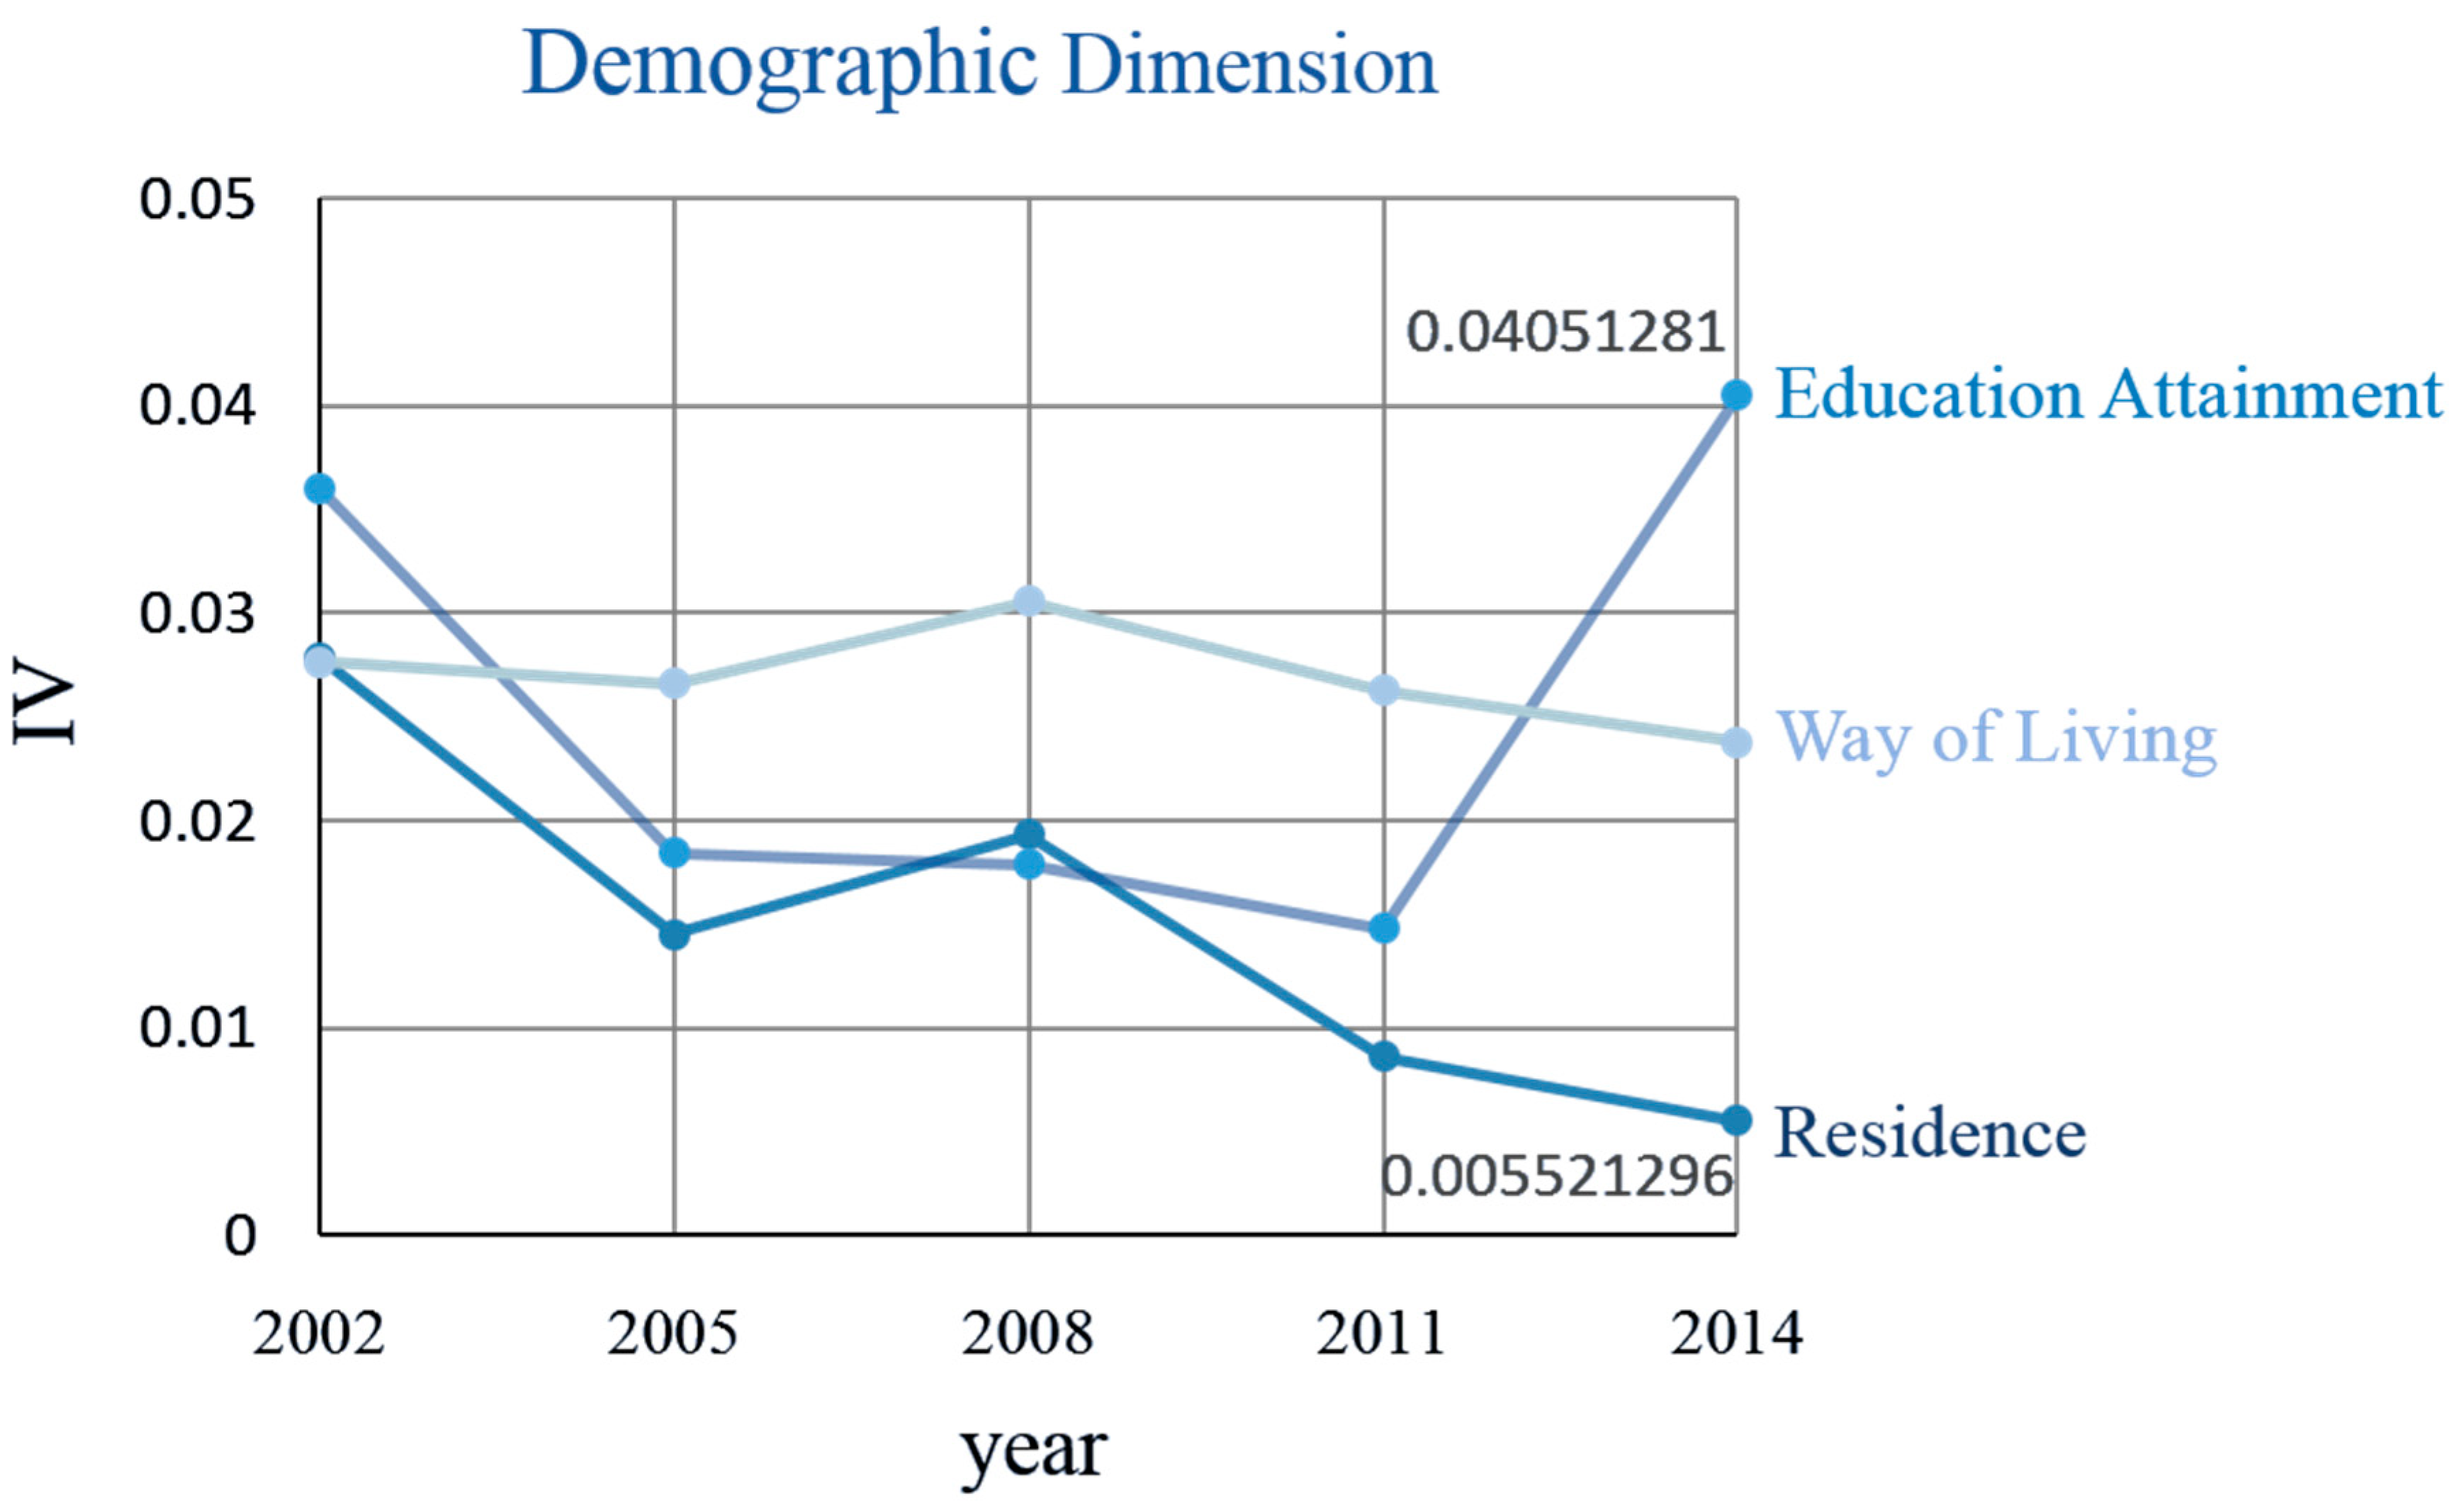
(1) Demographic dimension
Figure 5 shows change in the influence of demographic variables. The interval range of the IVs for these variables is 0.00552–0.04051.
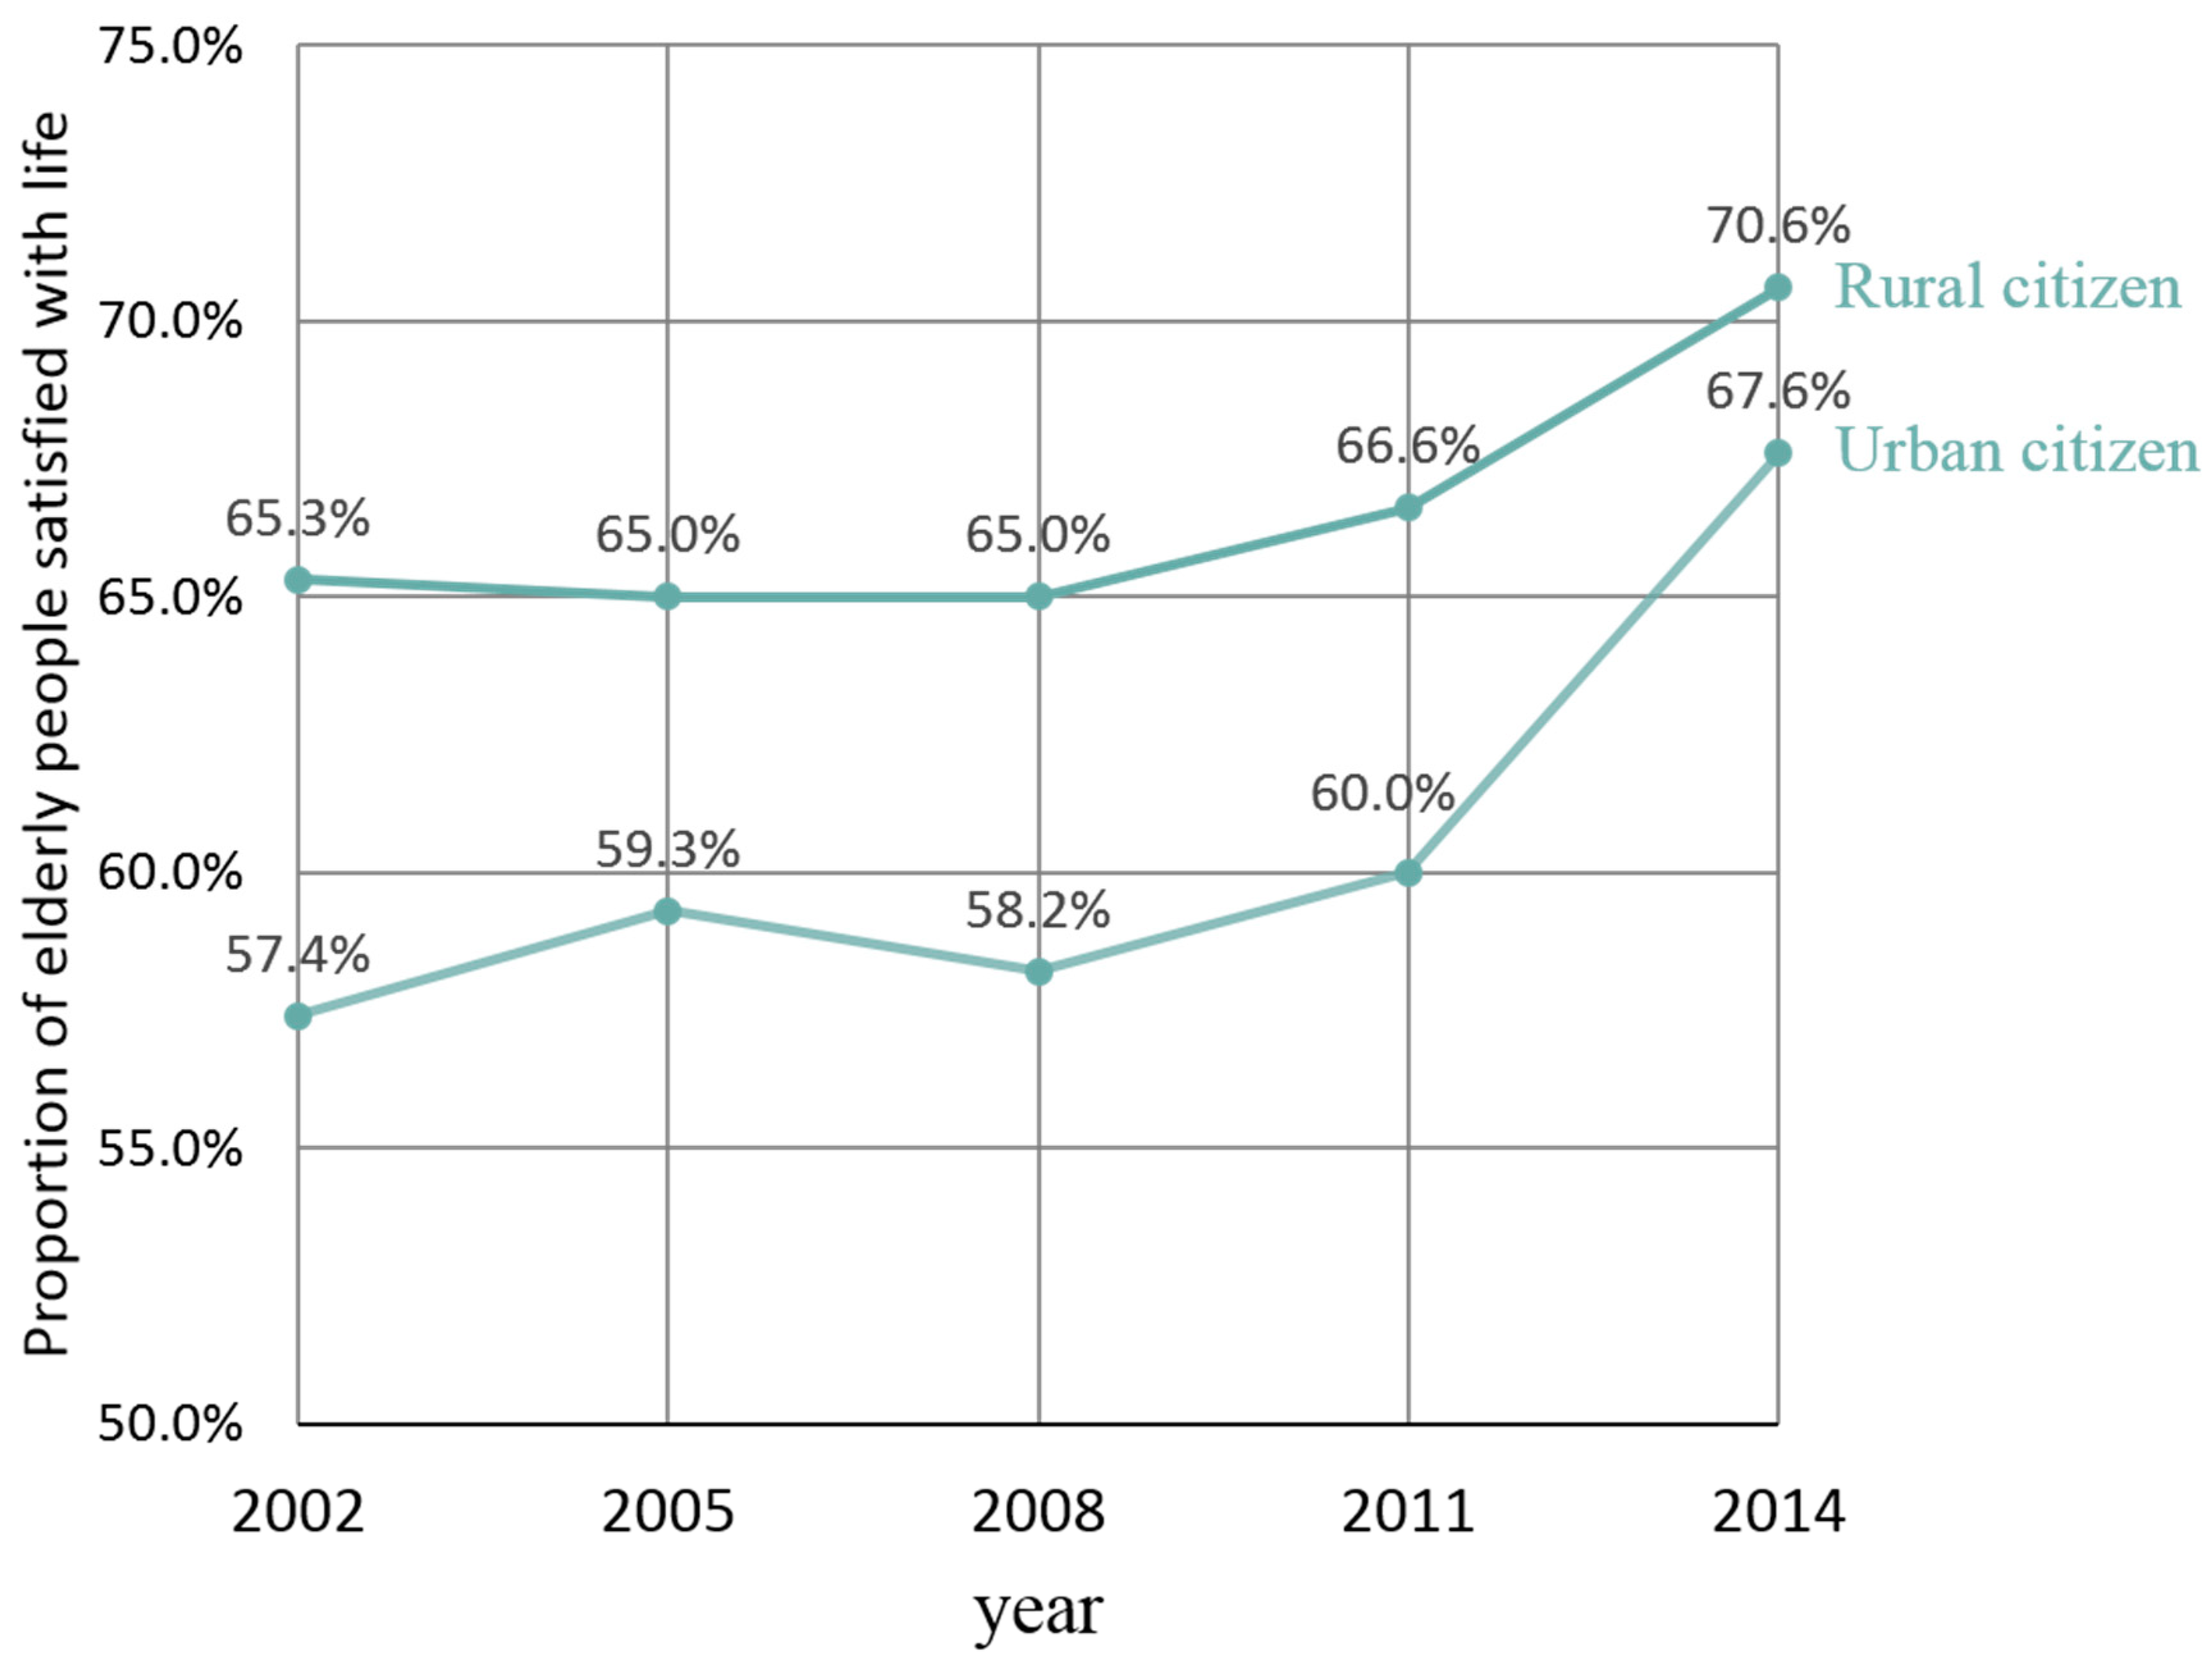
The IV for residence was higher than 0.02 only in 2002. That is, whether one lives in a rural area or an urban area had a weak influence on the life satisfaction of the elderly in 2002, and lost its influence from 2005 to 2014.
In 2002, education attainment had a slight impact on life satisfaction. During 2005 and 2011, the impact disappeared. In 2014, it again had a weak influence on life satisfaction. It is clear that the influence of education attainment has been changing over time.
From 2002 to 2014, way of living always had a slight effect on life satisfaction. Its influence has changed little in the past decade.
To conclude, the influence of residence and education attainment has fluctuated, while way of living has maintained a stable influence.
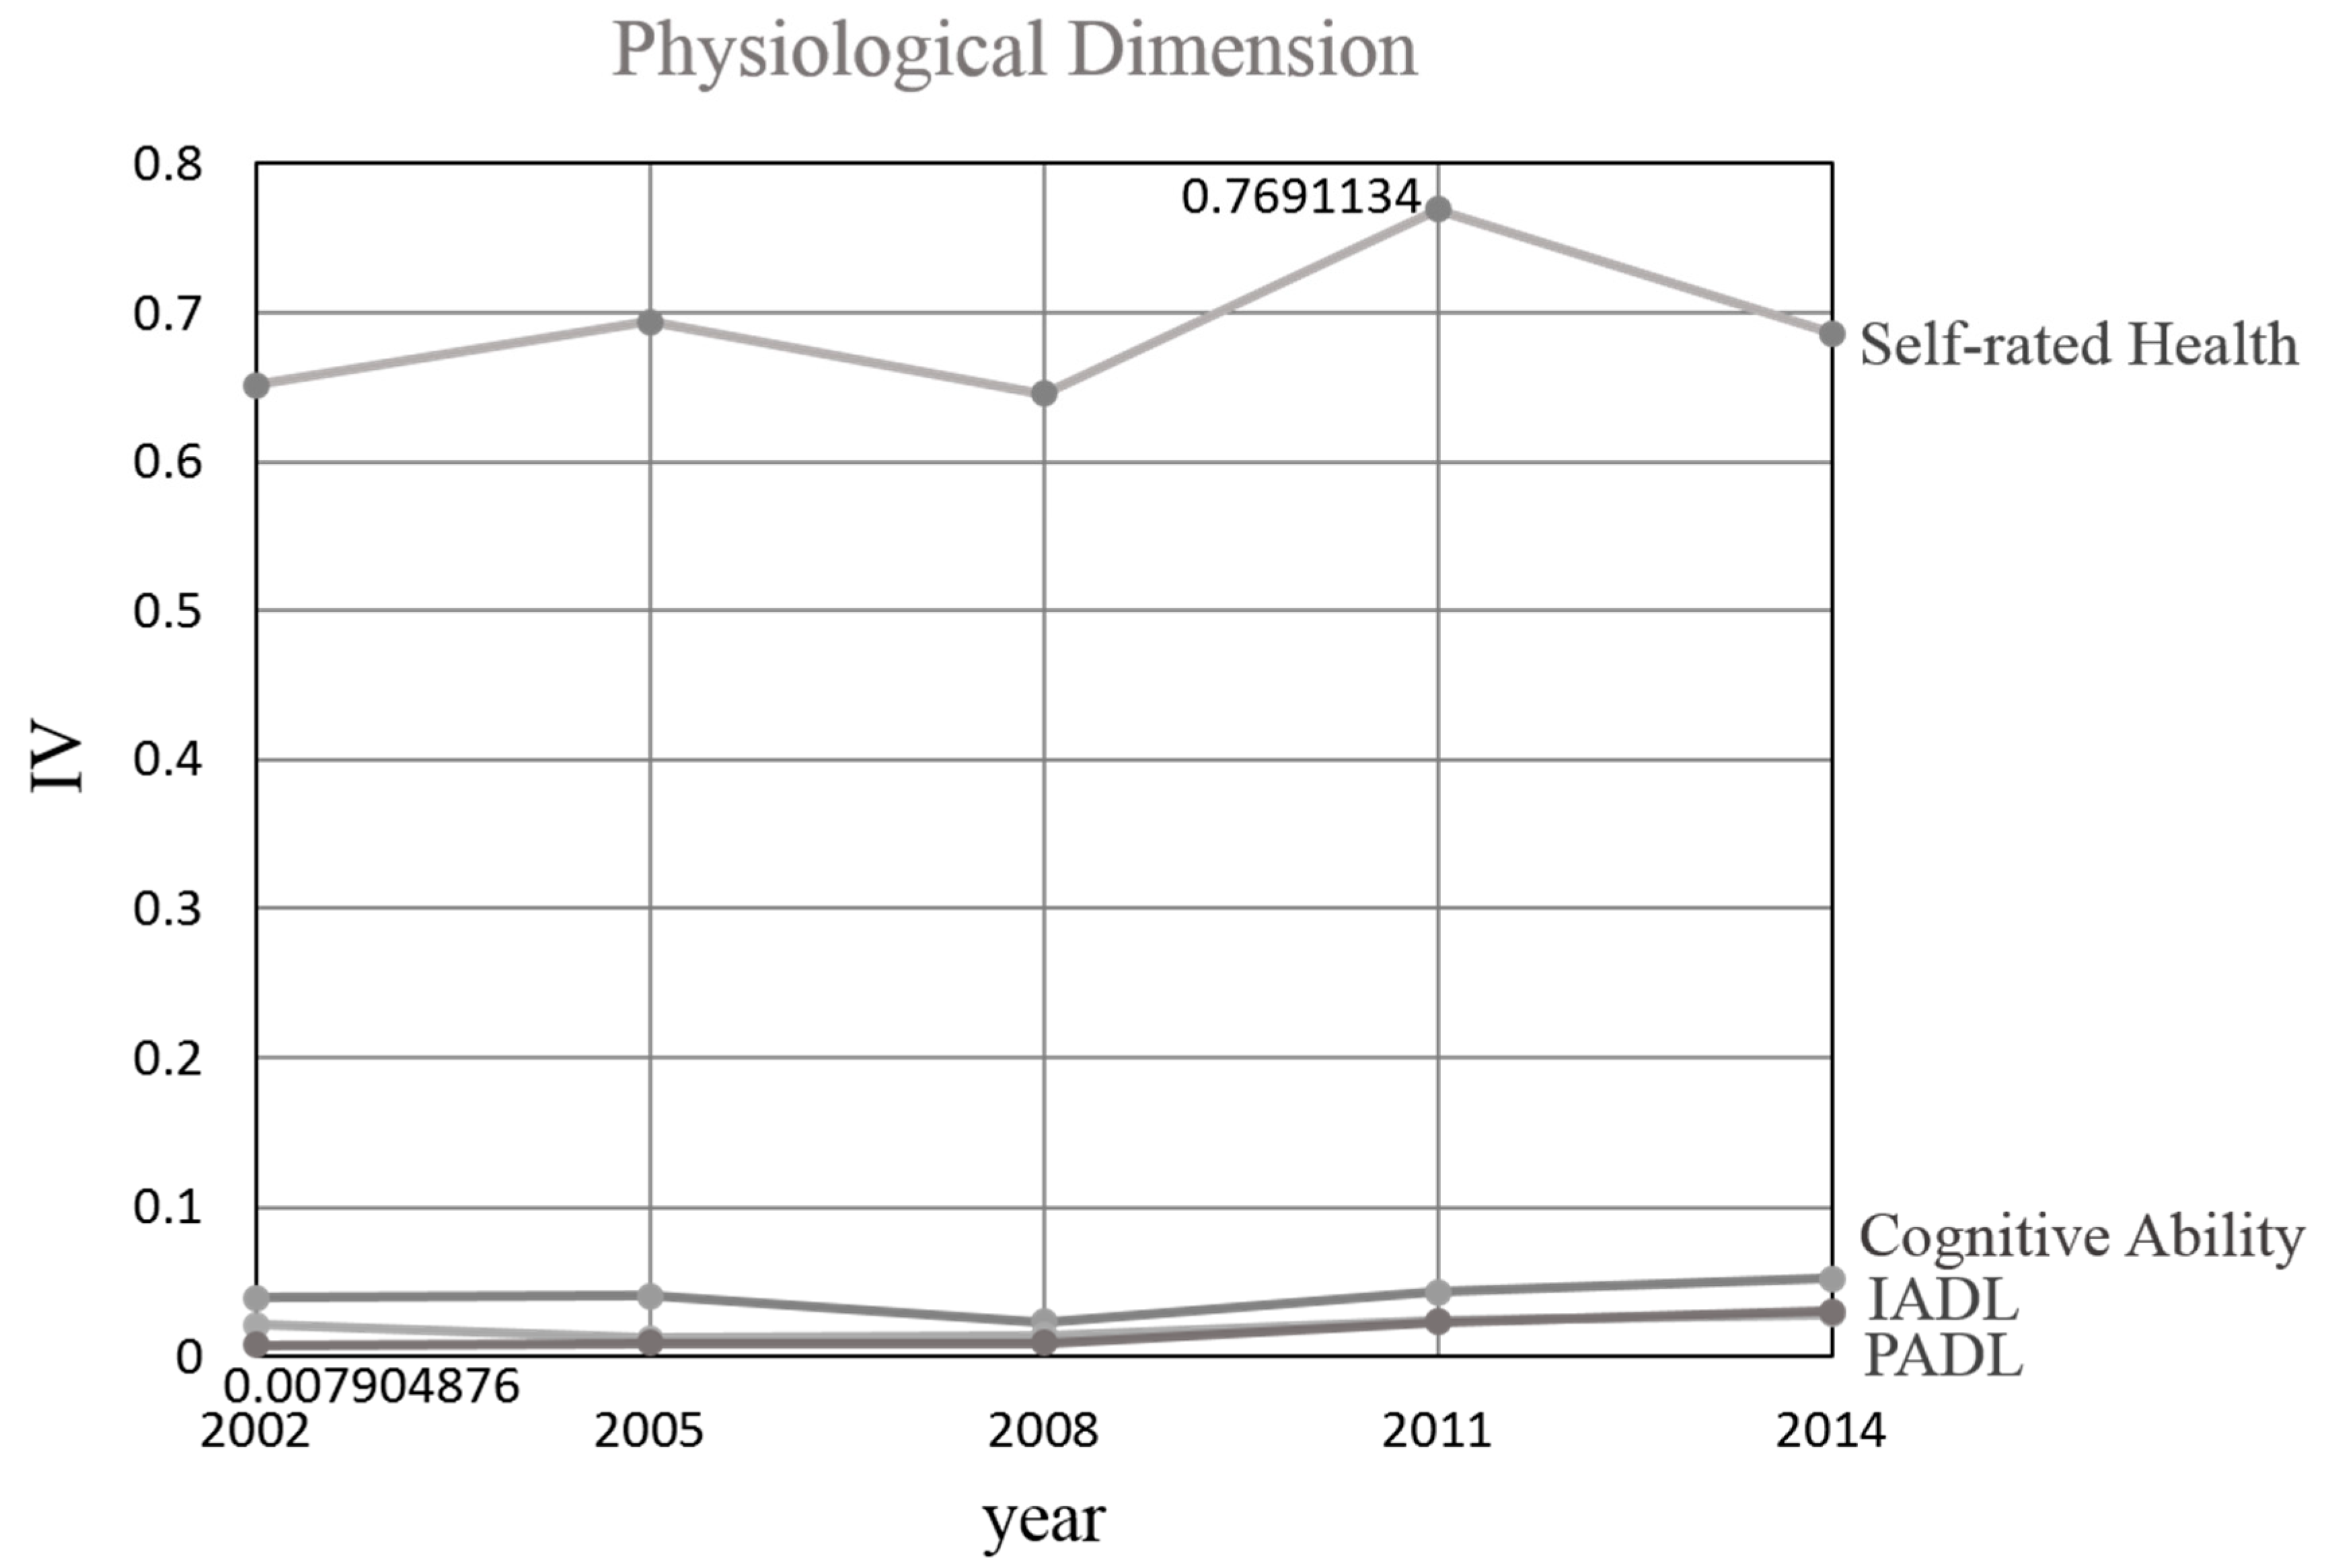
(2) Physiological Dimension
Figure 6 shows change in the influence of physiological variables. The interval range of the IVs for these variables is 0.0079–0.7691.
The IV of self-rated health was higher than 0.6, reflecting the strong influence that self-rated health has maintained on life satisfaction. From 2002 to 2008, the influence of self-rated health changed little, then increased from 2008 to 2011 and decreased after 2011.
Cognitive ability had a marginal effect on life satisfaction from 2002 to 2014. Its influence remained stable from 2002 to 2005, then declined from 2005 to 2008, and increased from 2008 to 2014.
PADL reflects the ability of the elderly to take care of themselves, while IADL reflects advanced skills that people need to live independently. During the period from 2002 to 2014, these variables had weak, or even no influence on life satisfaction. It is evident that the two variables have similar IVs and their influence shows an increasing trend from 2008 to 2014.
In general, the influence of self-rated health on life satisfaction has been significantly higher than for other variables, with slight changes. The influences of the other three variables are similar to each other and show an increasing trend from 2008.
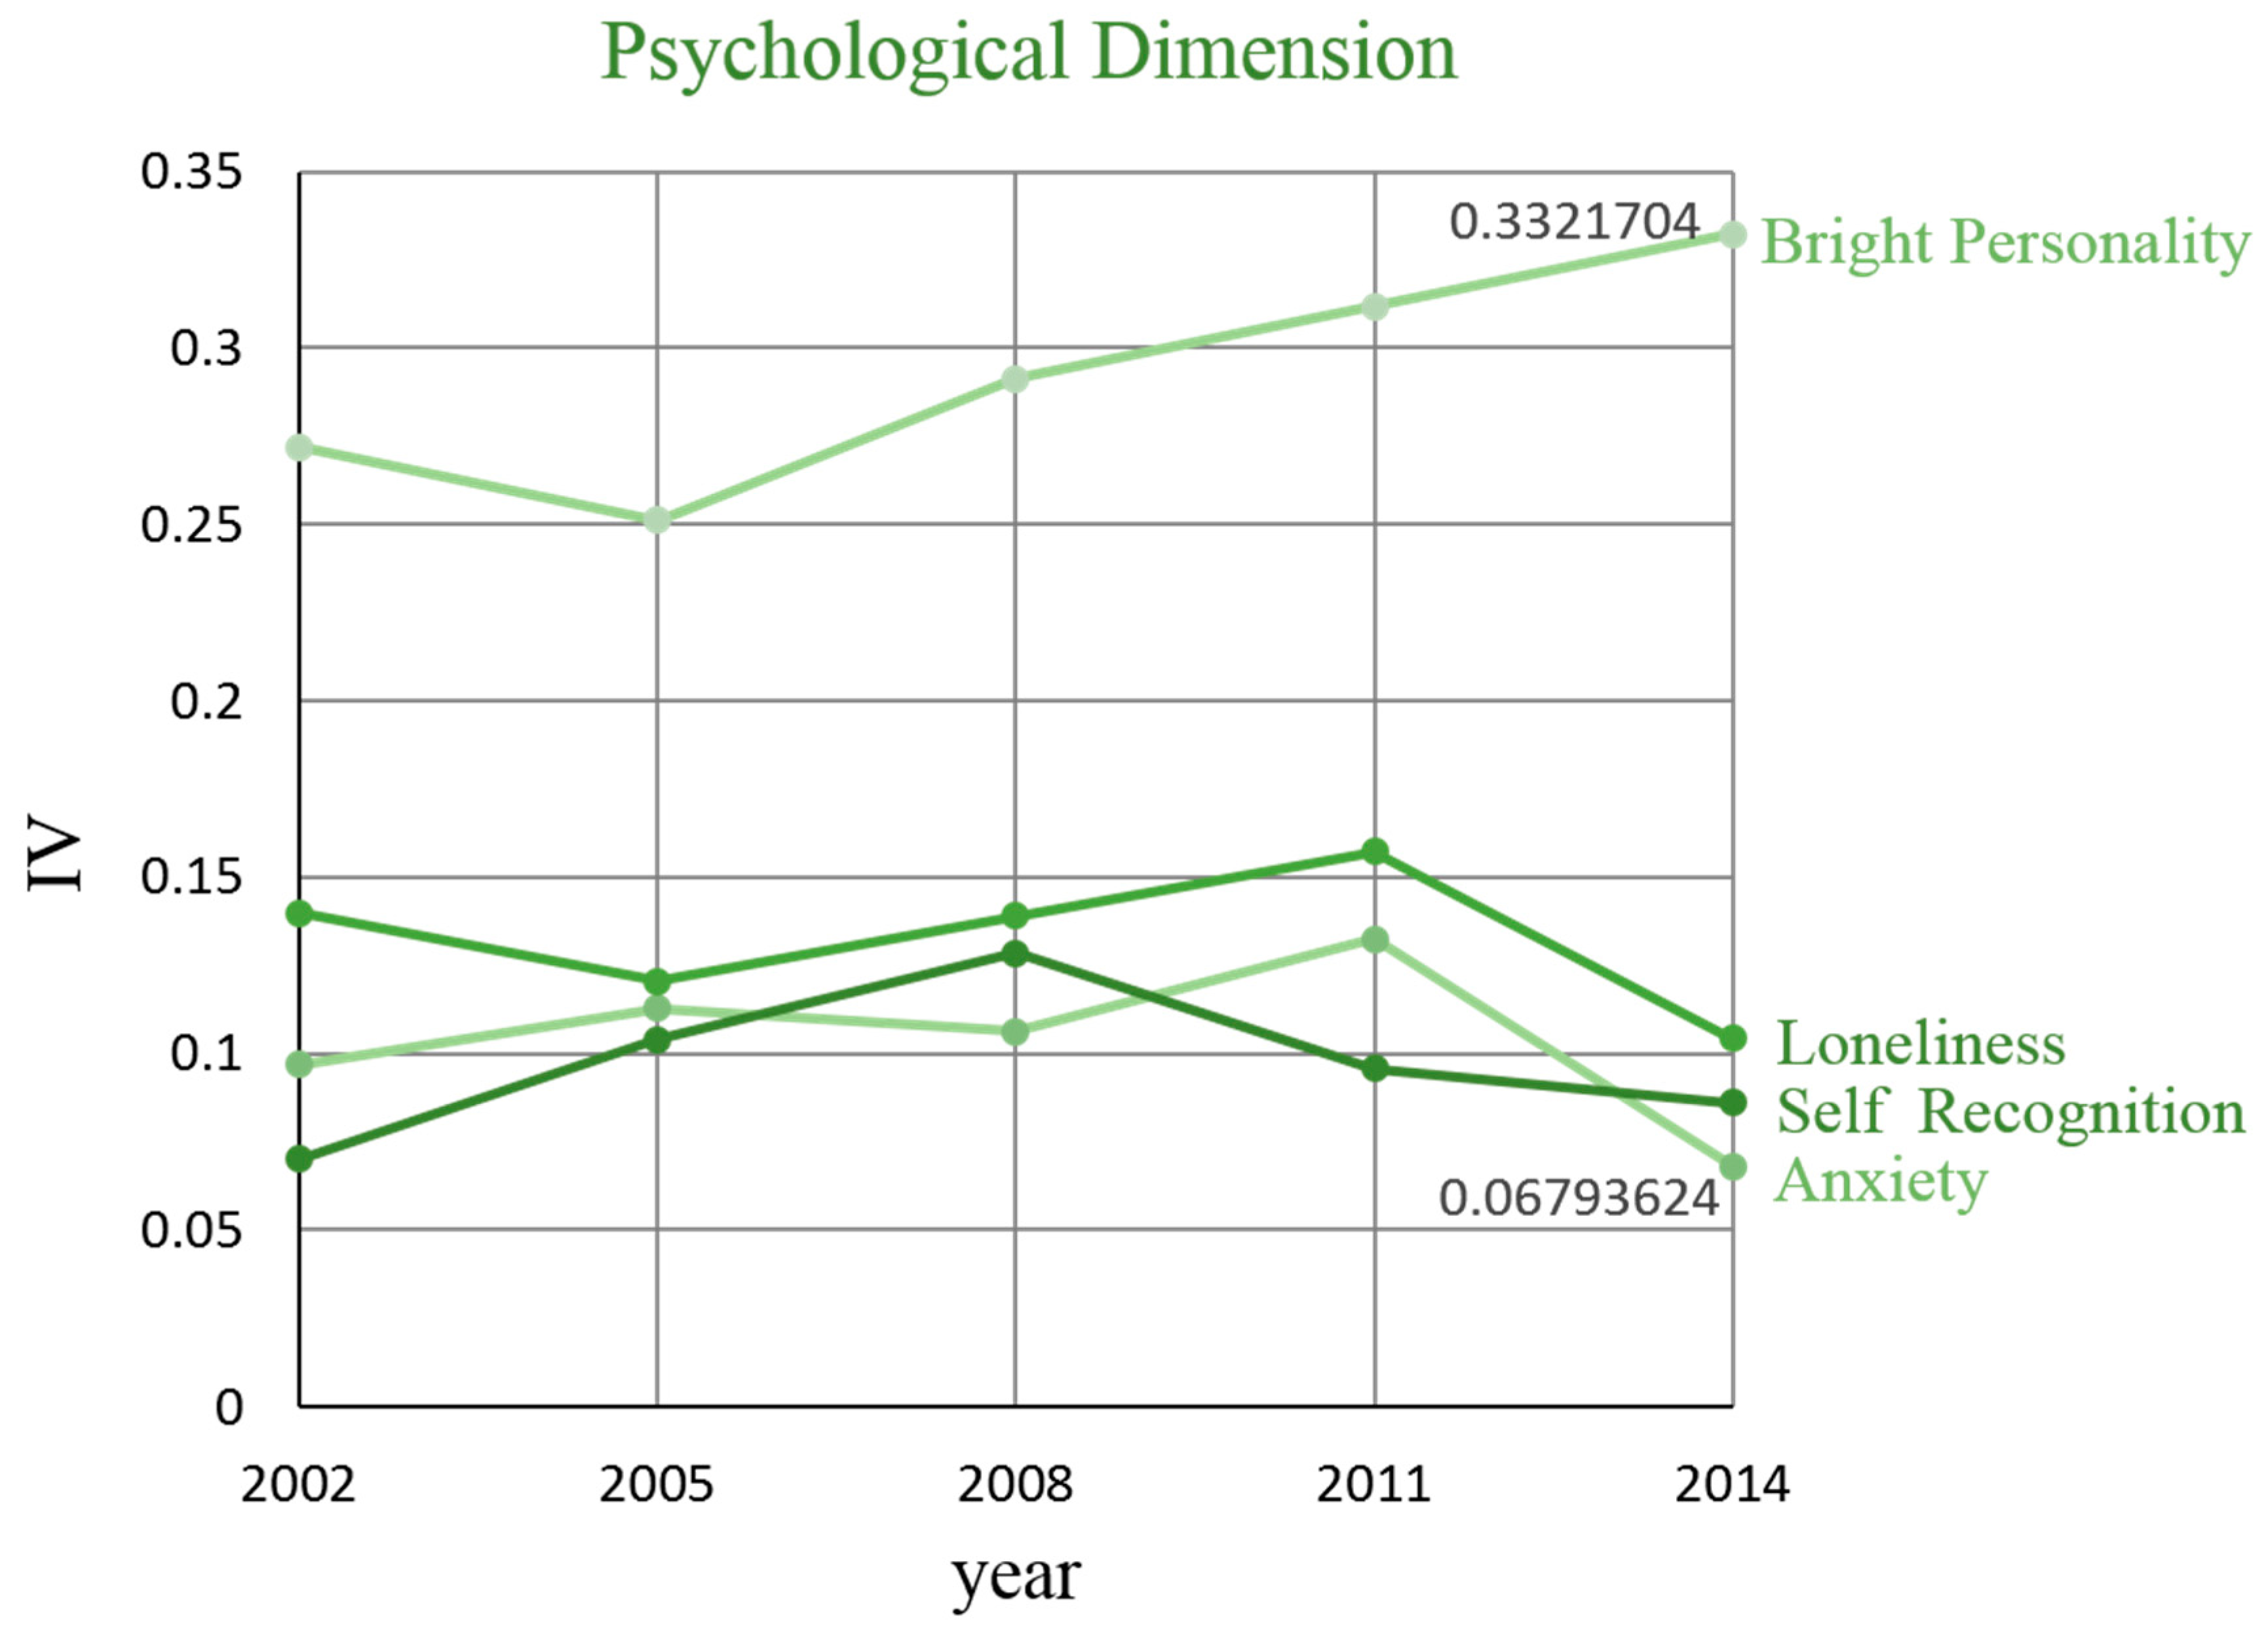
(3) Psychological dimension
Figure 7 shows change in the influence of psychological variables. The interval range of the IVs for these variables is 0.0679–0.3322.
The influence of a bright personality is notably higher than that of other psychological variables. Since 2005, its influence has increased with each year, suggesting that the elderly are paying more attention to their inner feelings.
Loneliness is the second most influential factor among the psychological variables. From 2002 to 2005, the influence of loneliness decreased, from 2005 to 2011 it continued to increase, and from 2011 to 2014 it decreased one more time.
From 2002 to 2008, the influence of anxiety remained stable, from 2008 to 2011 it increased, and from 2011 to 2014 it decreased sharply.
Self-recognition in the elderly represents their attitude to themselves. Its influence showed a rising trend from 2002 to 2008, and it was on the decline from 2008 to 2014.
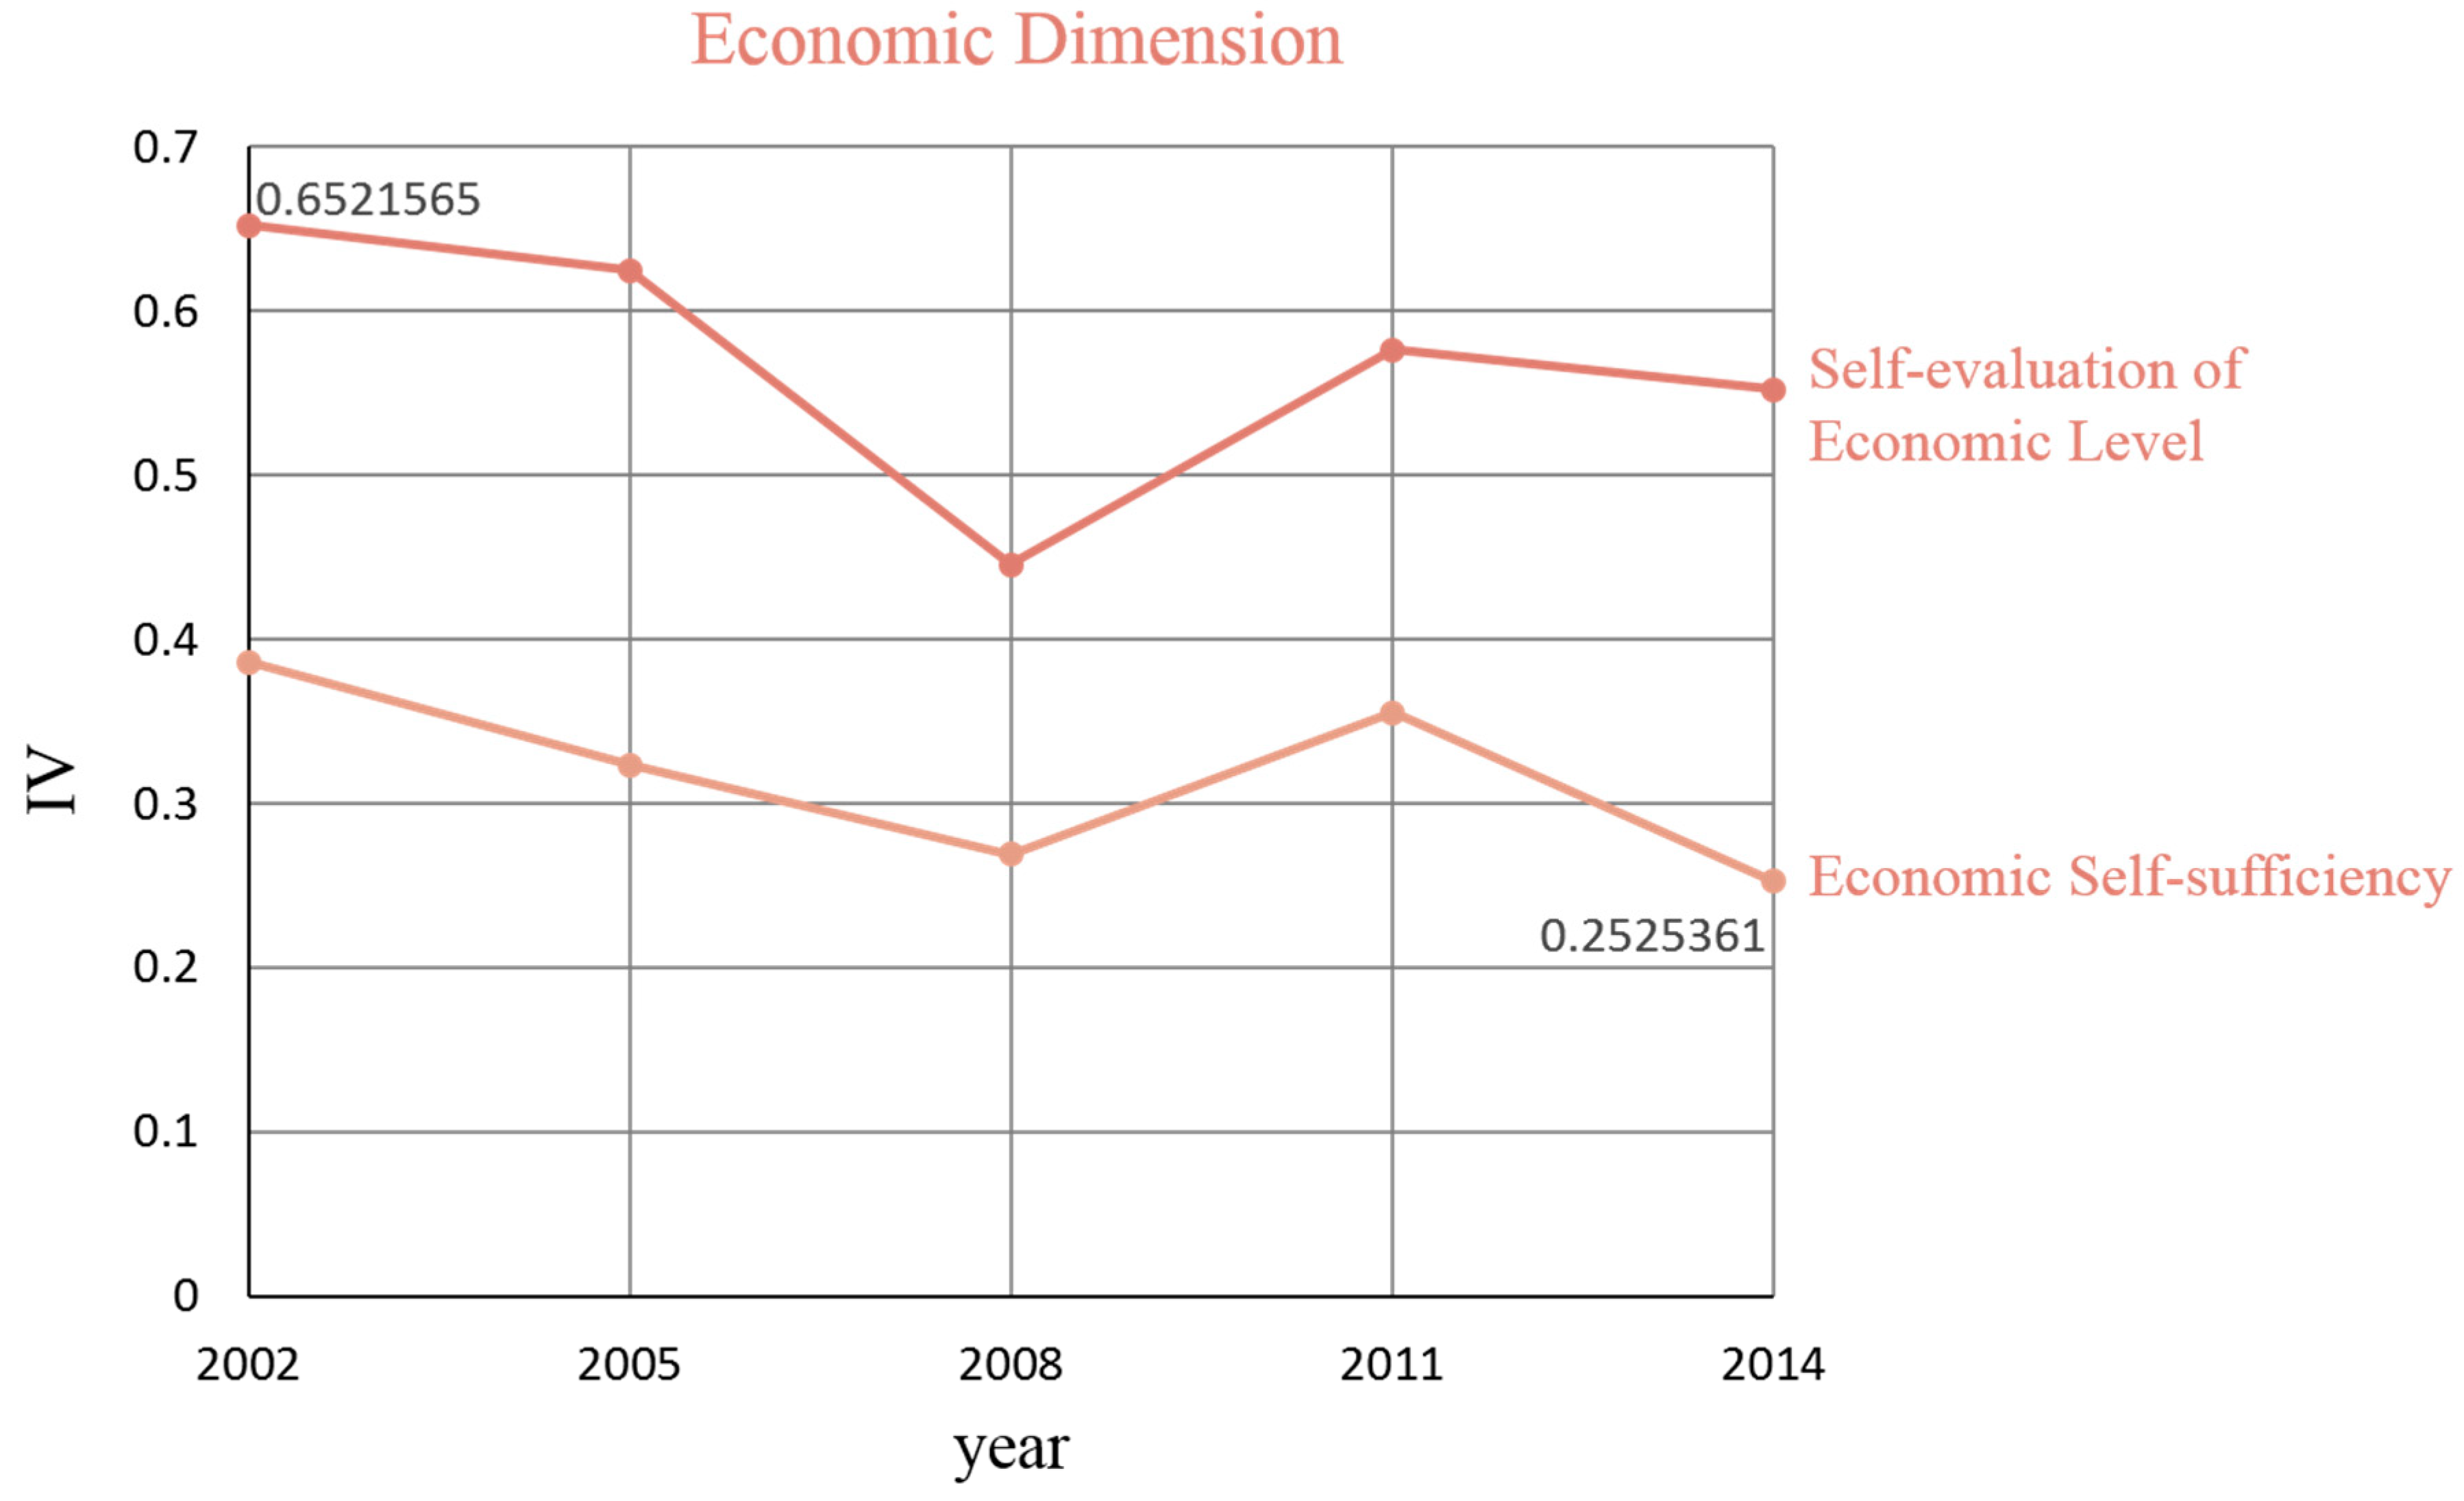
(4) Economic dimension
Figure 8 shows the change of influence of economic variables. The interval range of the IVs for these variables is 0.2525–0.6522.
The self-evaluation of economic level is a type of subjective judgement about people’s own economic conditions. Its IV was higher than 0.4 from 2002 to 2014, indicating that it is a strong influence on the life satisfaction of the elderly. In terms of the change in its influence, from 2002 to 2008 it decreased and, from 2008 to 2014, it first increased sharply and then leveled off.
In 2002, 2005 and 2011, economic self-sufficiency had a great influence on the life satisfaction of the elderly. In 2008 and 2014, it was at the general level. We can see that its influence decreased from 2002 to 2008, increased from 2008 to 2011, and then declined again after 2011.
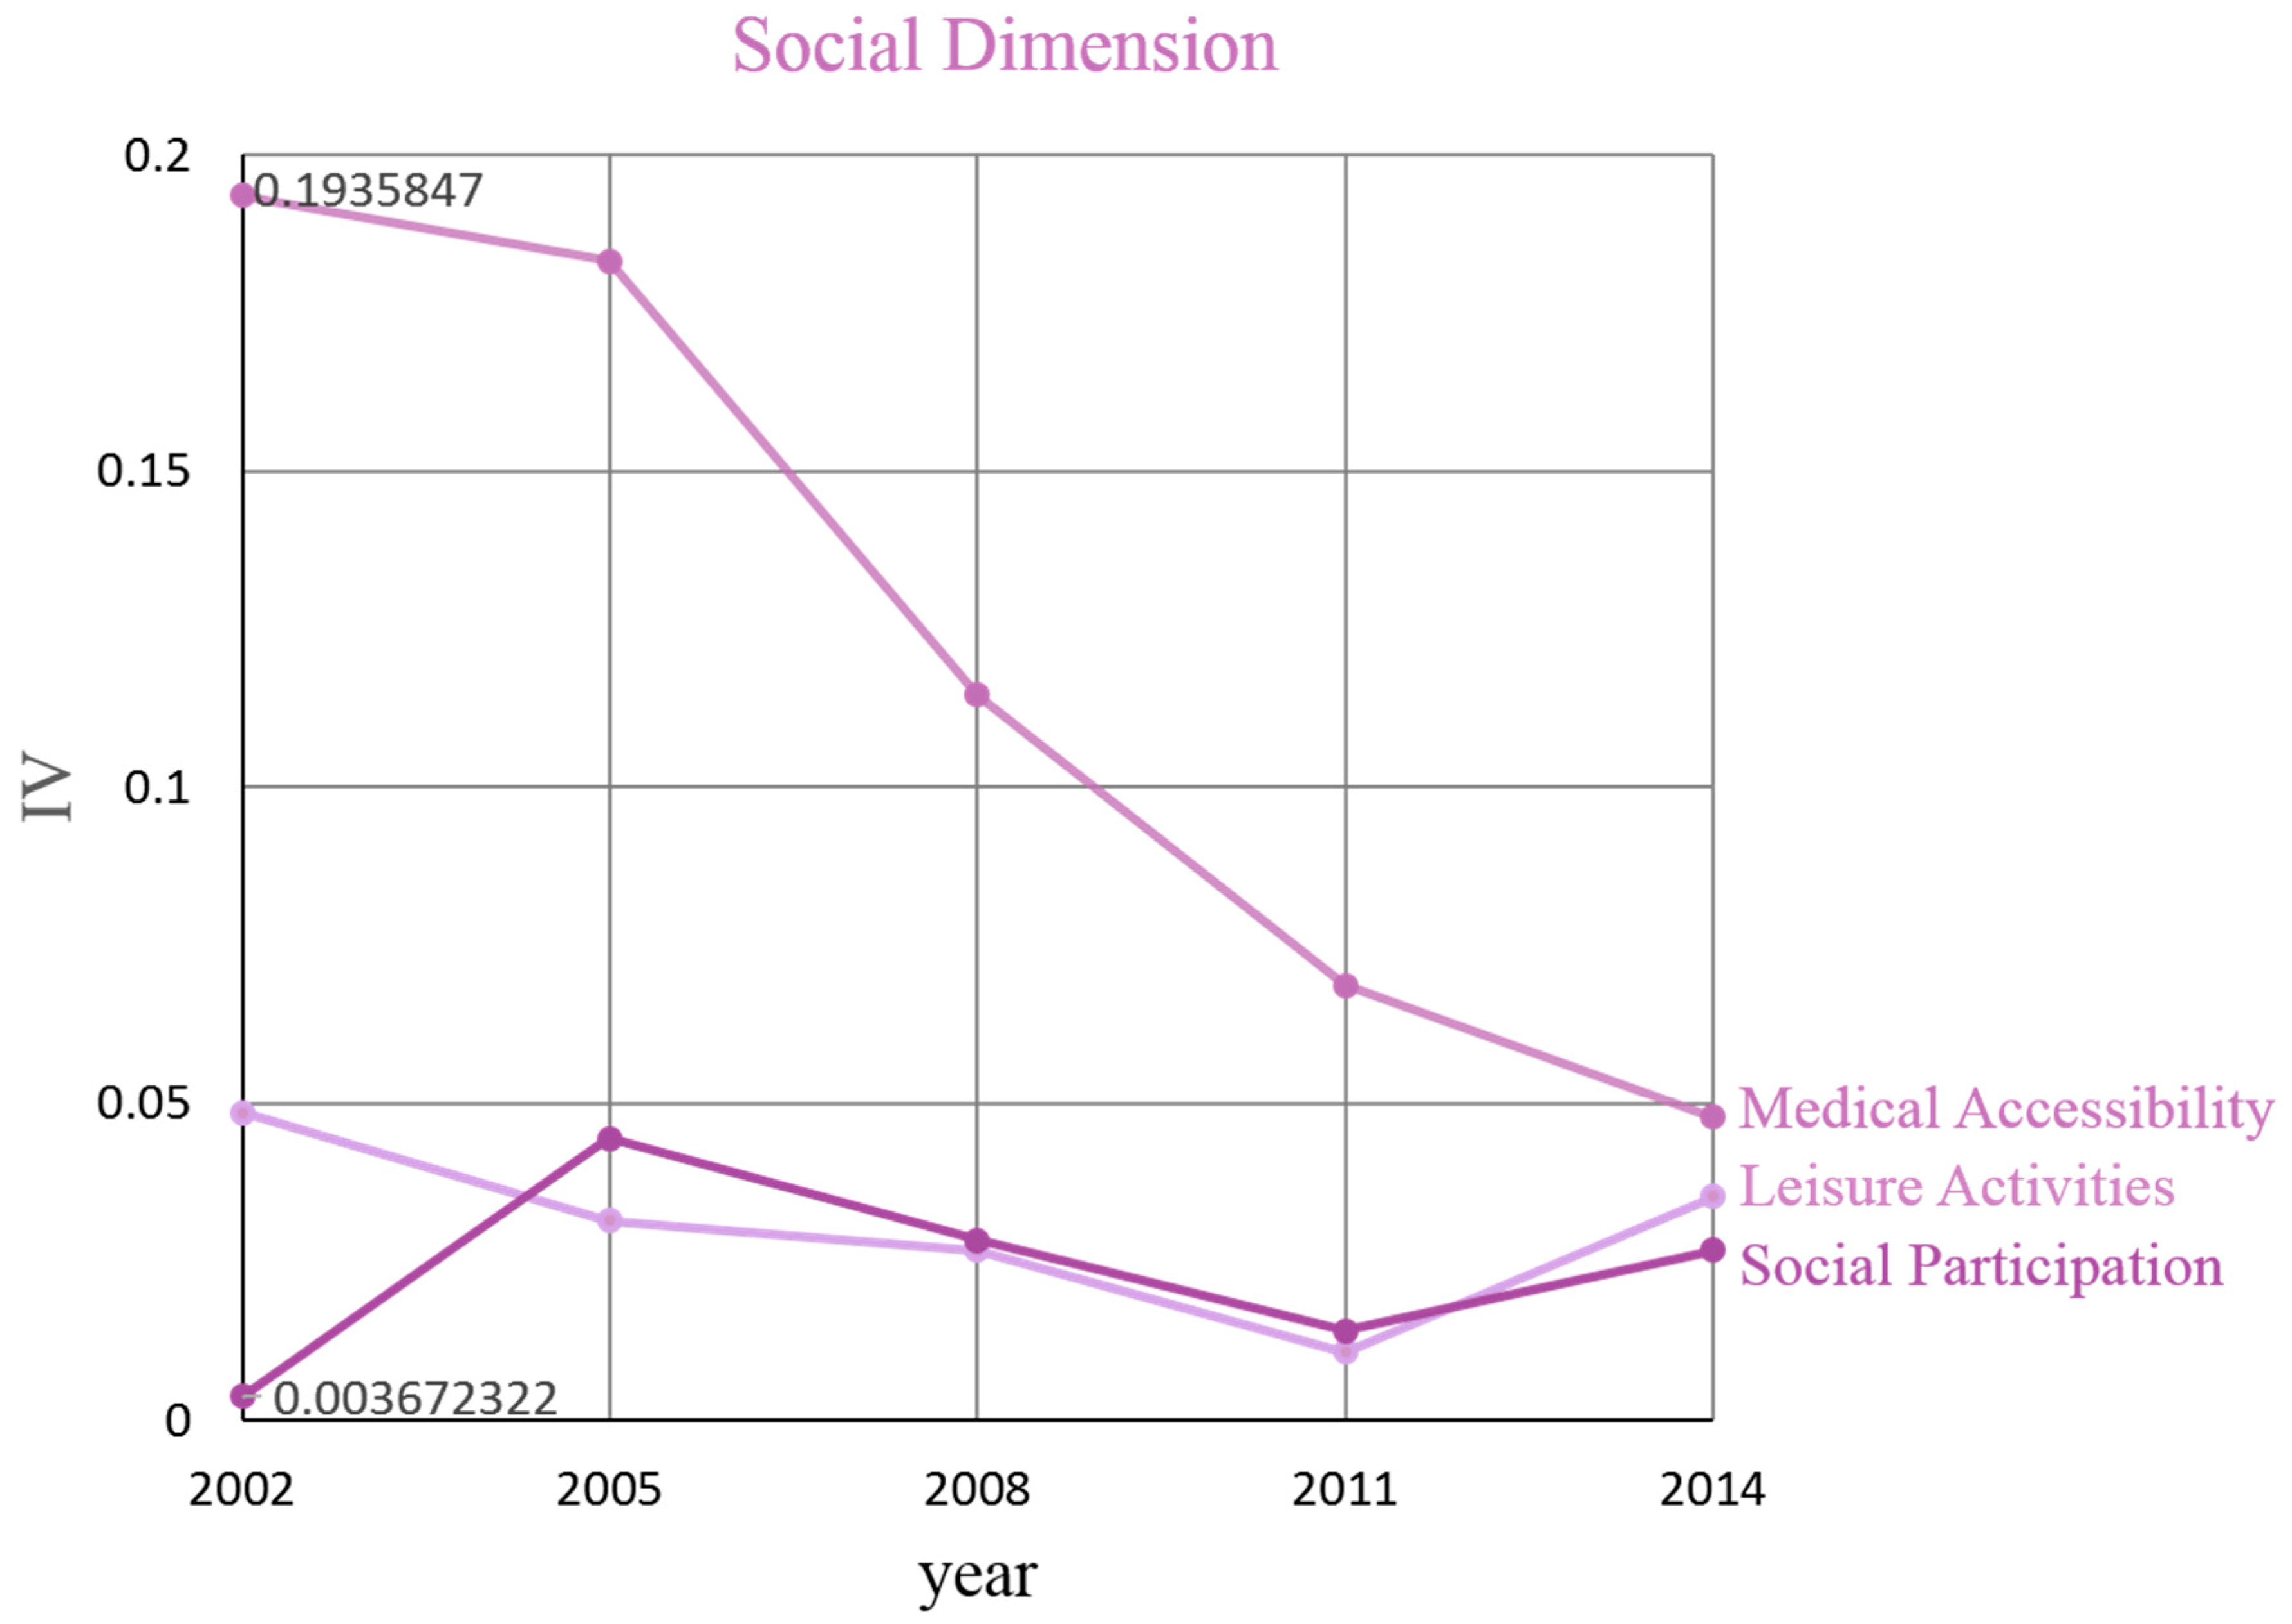
(5) Social dimension
Figure 9 shows change in the influence of social variables. The interval range of the IVs for these variables is 0.0037–0.1936.
Medical accessibility has always been the most influential variable in the social dimension. Medical accessibility was at the general level of influence from 2002 to 2008, and was of weak influence in 2011 and 2014. It can be seen that the influence of medical accessibility has been decreasing over the decade.
In 2002 and 2014, leisure activities and social participation had weak or even no influence. We can see that from 2005 to 2014, the change in influence of these two variables shared a common trend, declining from 2005 to 2011, and increasing from 2011 to 2014.
4.2.2. The Importance of Associated Factors in Different Years
We calculated the importance of the 16 factors to life satisfaction over the five years using the random forest model provided in R. The results are presented in
Table A2 in
Appendix A. During the years 2002 to 2014, the importance of these 16 factors associated with life satisfaction has changed. The importance, measured by the IV ranking, reflects the relative degree of importance in terms of the influence of these factors. Based on the results of the random forest model, changes in the importance of each associated factor can be analyzed.
We assume for each year that a variable ranking in the top one-third is considered to be a variable of strong importance, a variable ranking in the middle third is of general importance, and a variable ranking in the bottom third is of weak importance. Since the study concerns data for five years spanning more than a decade, in order to clearly present the important variables and show the change for all variables, we divided the 16 variables into three categories for visual analysis. We selected variables that had been ranked in the top five in at least one of the five years for visualization. These are the first-category variables and their ranking changes are presented in
Figure 10. Among the remaining variables, those which have entered the top 10 at least once are the second-category variables and are shown in
Figure 11. Lastly, variables which have always ranked in the bottom third are the third-category variables and are shown in
Figure 12.
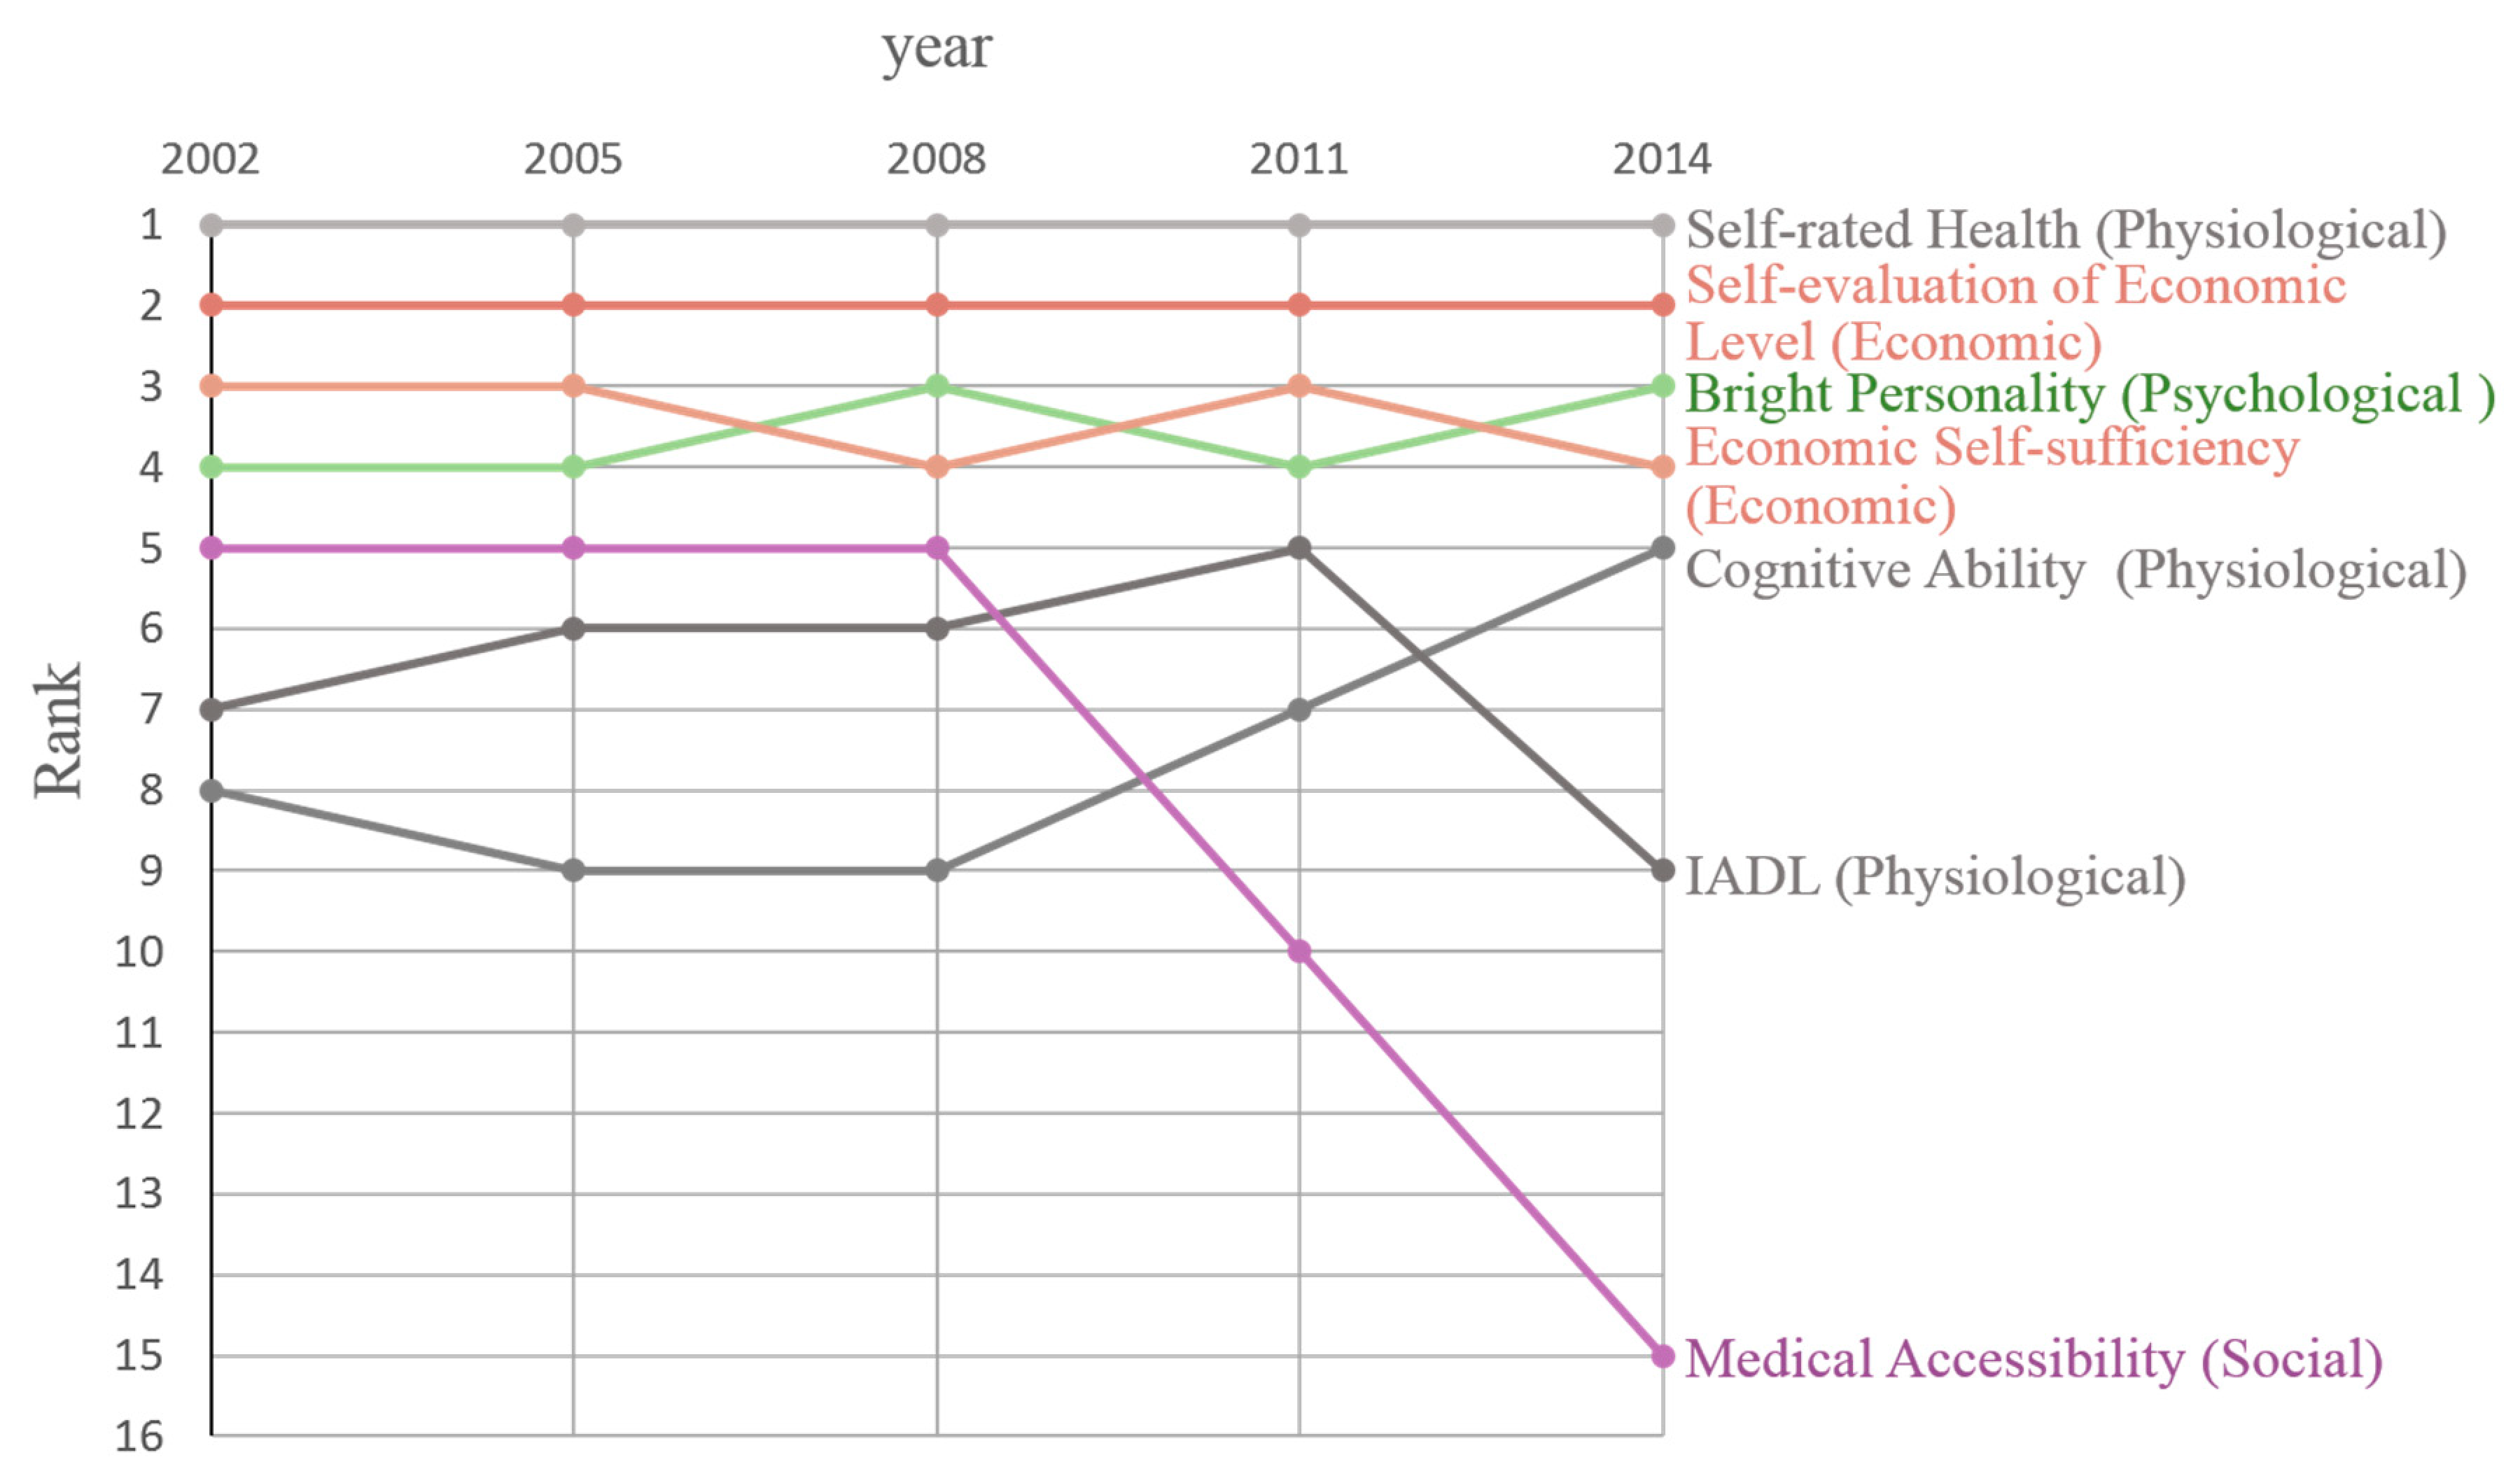
As shown in
Figure 10, we found that there were seven first-category variables, covering the physiological, psychological, economic and social dimensions and including, self-rated health, cognitive ability, IADL, economic self-sufficiency, self-evaluation of economic level, bright personality, and medical accessibility. Among these first-category variables, the ranking of self-rated health in physical dimension is very stable and has always ranked first in each of the five years, meaning that self-rated health has always been the most important factor. The ranking of self-rated economic level in the economic dimension has also been stable in second place, and is an important variable second only to self-rated health. Economic self-sufficiency in the economic dimension has ranked third or fourth in each of the five years. The rankings of bright personality in the psychological dimension are close to those of economic self-sufficiency, with both remaining stable in either third or fourth place. However, the ranking changes for medical accessibility, cognitive ability and IADL are large. Medical accessibility in the social dimension remained stable in fifth place from 2002 to 2008 but continued to drop after 2008, showing that the importance of medical accessibility remained unchanged from 2002 to 2008 and declined after 2008. IADL entered the top five only in 2011. Its importance changed slightly from 2002 to 2011, but dropped sharply in 2014. Cognitive ability entered the top five only in 2014. Its importance decreased from 2002 to 2005 and increased after 2008.
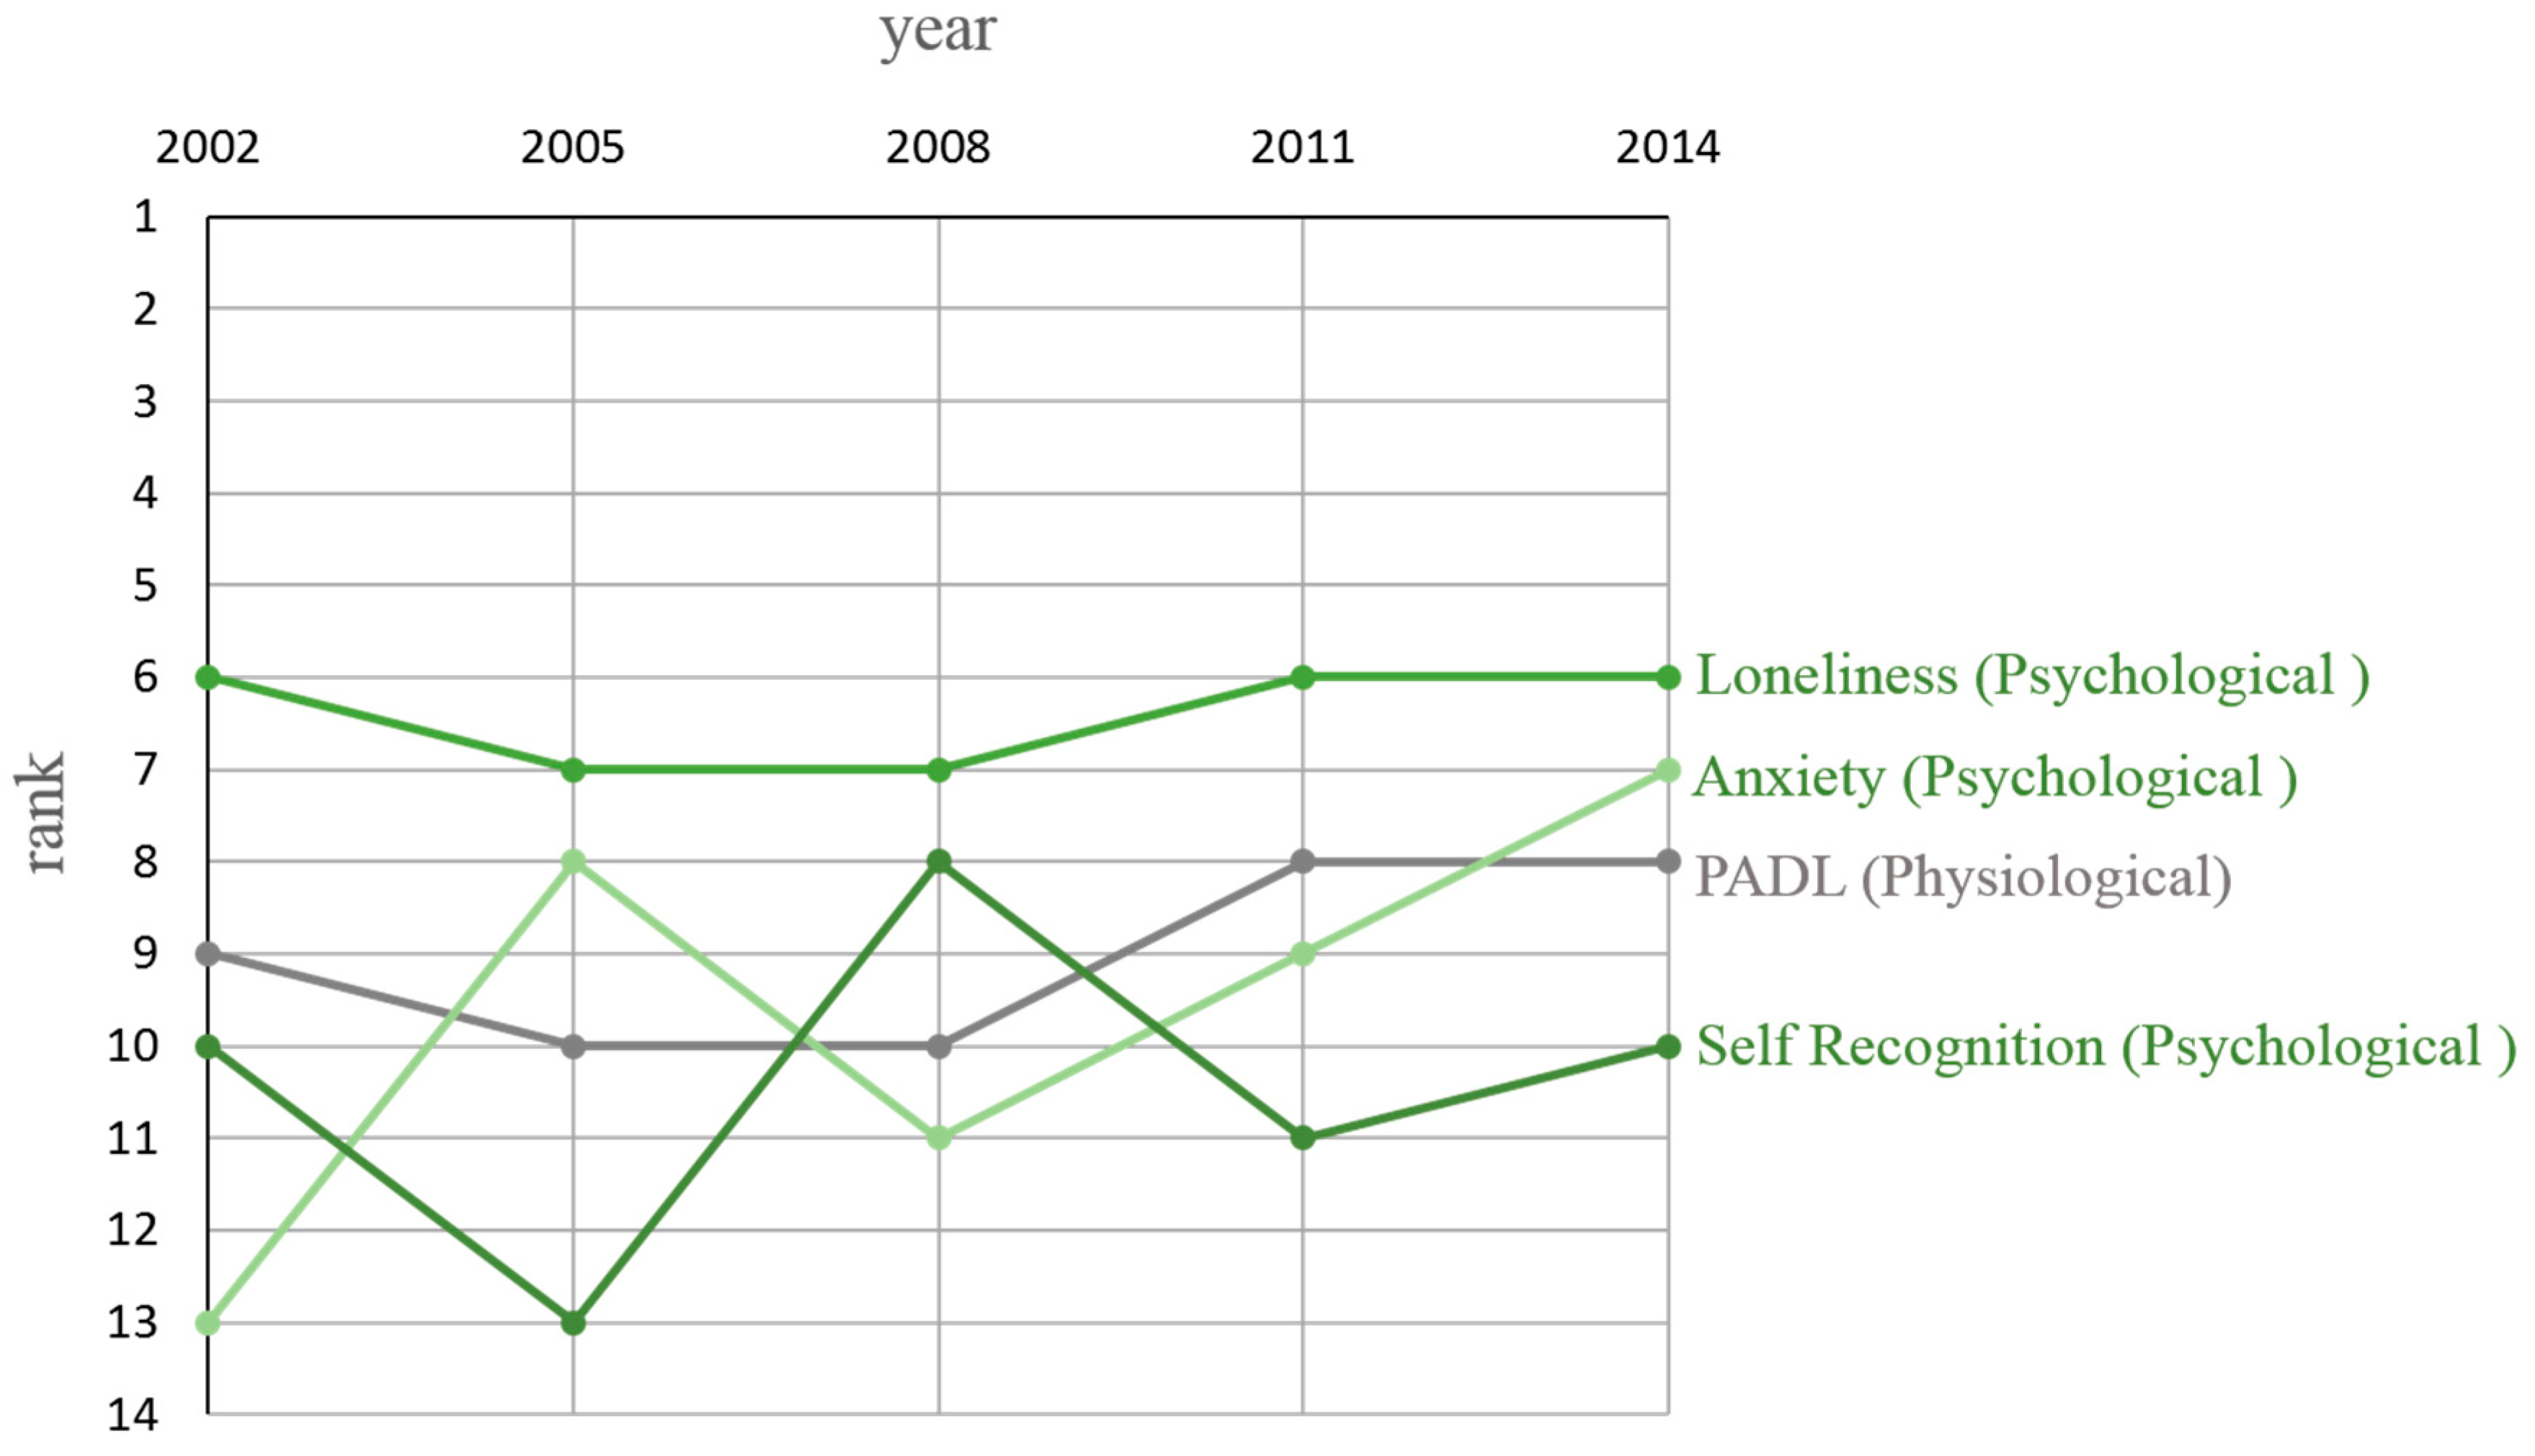
Figure 11 shows the change in importance of second-category variables during the twelve years. The second-category variables are loneliness, PADL, anxiety and self-recognition, and are mainly composed of variables in the psychological dimension. Loneliness ranked stably at sixth or seventh place, and is the most important variable among the second-category variables. From 2002 to 2008, the importance of PADL was relatively stable. It increased from 2008 to 2011, and remained unchanged after 2011. The ranking for anxiety fluctuates greatly. Its importance first rose and then dropped, and finally rose again. The importance of self-recognition has also changed greatly.
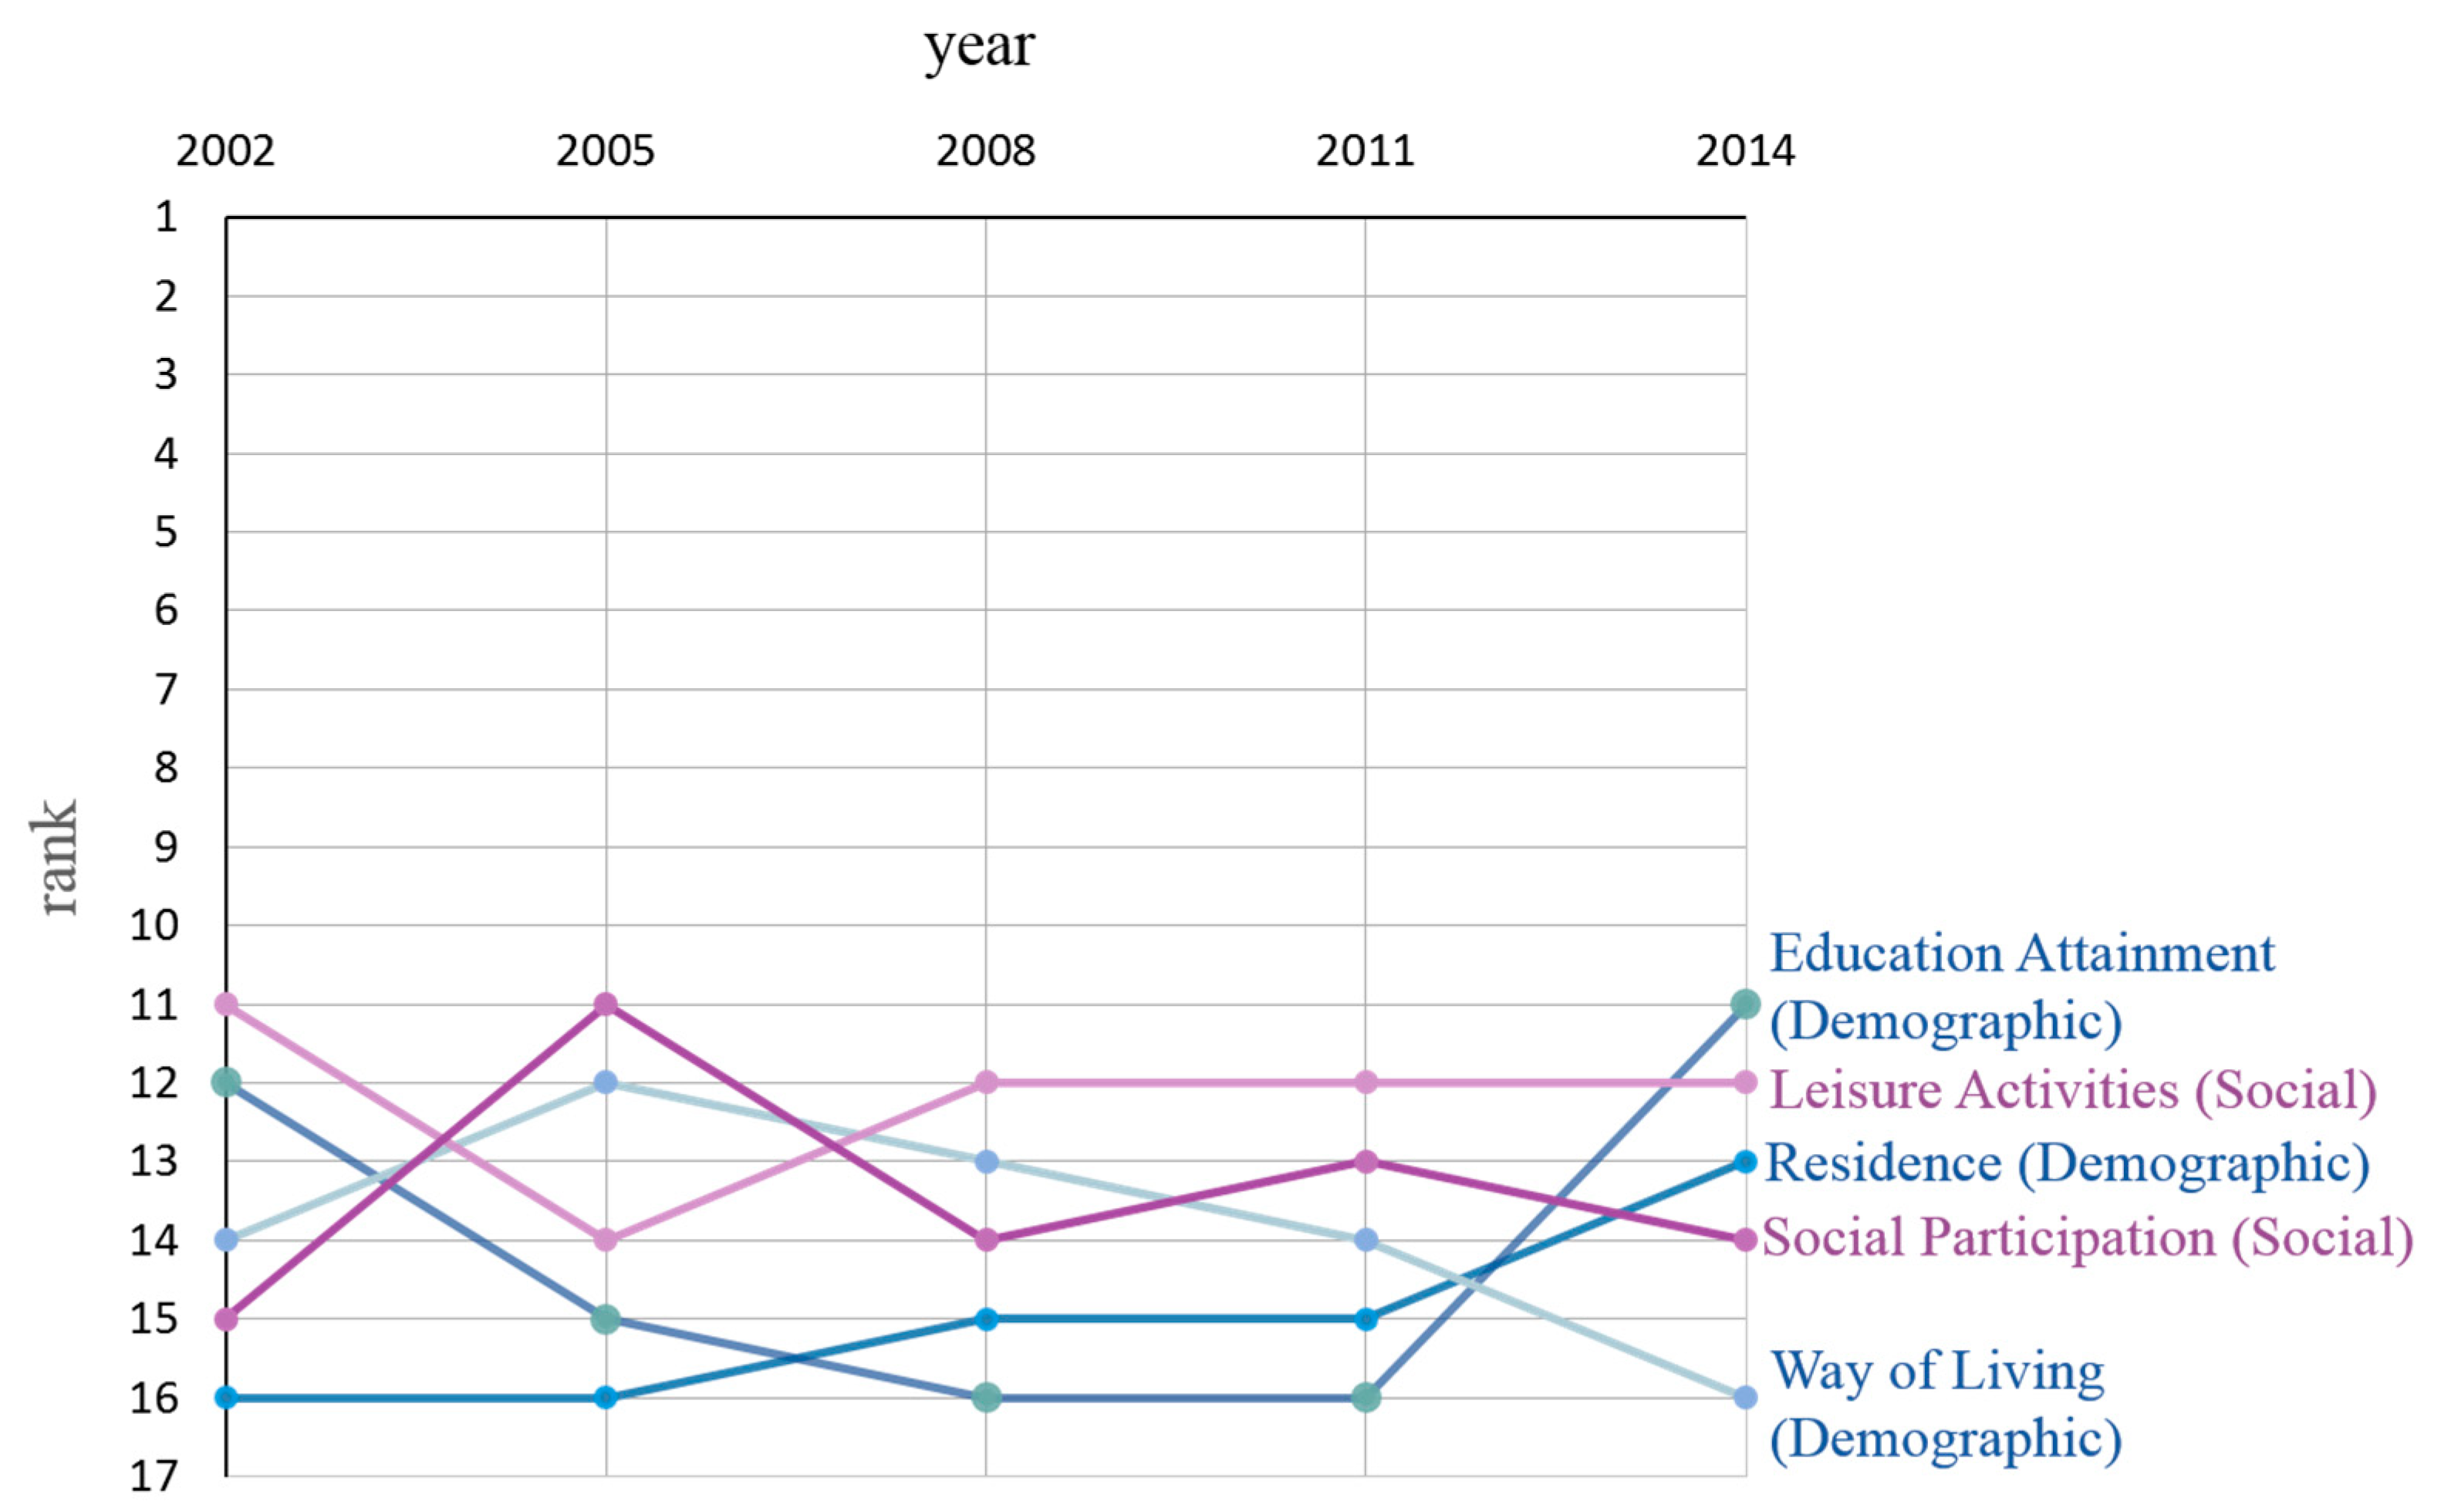
The change in importance of third-category variables from 2002 to 2014 is shown in
Figure 12. The third-category variables are mainly composed of social and demographic variables and include, leisure activities, social participation, education attainment, way of living and residence. The importance of leisure activities decreased strikingly from 2002 to 2005, rebounded in 2008, and remained unchanged after 2008. As for social participation, the importance increased significantly from 2002 to 2005, decreased significantly in 2008, and changed slightly after 2008. For education attainment, its importance dropped from 2002 to 2008, and increased sharply from 2011 to 2014. The importance of way of living increased from 2002 to 2005, and decreased from 2005 to 2014. Residence ranked either fifteenth or sixteenth from 2002 to 2011 and rose after 2011. The overall importance of residence has been low in general.


